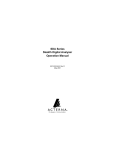
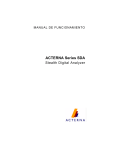
1
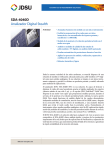
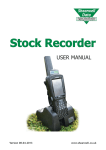
Application Note
Using JDSU Equipment to Test and Troubleshoot CPD,
Impulse Noise, and Ingress in the Return Path
History of CPD
• Common Path Distortion (CPD) is created by non-linear mixing from a diode junction created by corrosion
and dissimilar metal contacts. It’s not just dissimilar metals, but dissimilar metal groups. There are 4 main
groups of metals:
1. Magnesium and its alloys,
2. Cadmium, Zinc, Aluminum and its alloys,
3. Iron, Lead, Tin, & alloys (except stainless steel), and
4. Copper, Chromium, Nickel, Silver, Gold, Platinum, Titanium, Cobalt, Stainless Steel, and Graphite.
• CPD is second and third order intermods from the forward channels intermixing and creating distortions,
which fall everywhere. CPD will make CSO/CTB worse for forward performance.
• Separation depends on forward channel plan. NCTA, HRC, and IRC plans that use NTSC, 6 MHz spacing
will have beats every 6 MHz. PAL could be every 7 or 8 MHz.
• The original culprit was the old feed-through connectors. Dissimilar metals from the copper clad, aluminum center
conductor and the stainless steel seizure screw.
WEBSITE: www.jdsu.com
Application Note: Return Path Troubleshooting
• Housing terminators are notorious now because of the
higher levels to mix and intermodulate, not to mention
a few bad varieties that were manufactured.
• Colder weather makes CPD worse because the diode
works better. Electron funneling is better with heat
so there isn’t as much non-linear mixing. Because of
contraction and expansion, CPD could become worse
with heat.
• There is another impairment that manifests itself like
CPD, but the separation is a little different; it is called
transient hum modulation. An RF choke can saturate
with too much current draw and cause the ferrite
material to break down. The same thing can happen
in customer installed passives unless they have voltage
blocking capacitors installed.
Troubleshooting CPD
• Pull a forward pad to see if the return “cleans-up”. This
is definitely CPD, but very intrusive when doing this
and may disrupt CPD temporarily.
• Try not to disturb anything in this tracking process.
Vibrations and movement can temporarily “break
away” the diode/corrosion causing this CPD.
• Voltage surges can also destroy the diode. At least long
enough to warrant a return visit!
• The test point locations will determine the outcome.
If CPD is on any of the downstream output TPs of an
amplifier, it may be the output seizure screw or connector. Otherwise, continue down that leg. Look for
housing terminators.
• If CPD is on the Fwd input TP and not on the output
TP, it may be the input seizure screw or connector. The
reverse amplifier provides isolation that prevents CPD
from appearing on the output if created on the input.
• It could still be downstream though, because the levels
on the reverse input test point may be too low to see,
which may warrant a pre-amp. Otherwise, attach to
the reverse output and terminate reverse input pads
one at a time to determine the offending reverse input
leg.
2
• If you view the reverse spectrum from a bi-directional
test point with an analyzer, you could overdrive the
front-end of the analyzer with too much forward
path signal and cause intermodulation within the test
equipment. To see the reverse ingress, the instrument
is in its most sensitive mode. Both forward and reverse
signals are going directly into the mixer input. The
high level forward channels will cause intermodulation
products in the front-end of the meter. This will happen on any type of analyzer.
• Use a low pass filter to block all the forward channels.
You could use a diplex filter, but it’s cumbersome. The
insertion loss may not be calibrated, and it may not be
dc blocked.
• This is why newer units have a built-in, switchable,
lowpass filter to block out the forward channels.
• It may be advantageous to troubleshoot CPD from the
end-of-line back toward the node. This will eliminate
disturbing the fault until you get there.
Note: Be sure forward input levels to the Stealth headend
transmitter (Tx) are between 4 and 12 dBmV. If levels
are too high, distortions will be created in the Tx,
which appear as CPD when viewing the “Noise”
mode.
Tracking Down Ingress
The first step is to verify it is truly on your network and not
self-induced. Use some type of spectrum analyzer to view
the anomaly. Cross reference with frequency charts that
identify different ingress sources to get a best-guess idea.
Noise and transient ingress above the diplex filter region
is probably laser clipping or induced at the node. You may
also want to view the frequencies below 5 MHz to verify
it’s clean. Noise below 5 MHz could still affect the laser’s
dynamic range.
Listening to Ingress for Identification of the
Source
The second step is to demodulate the ingress, if possible, to
identify the type of ingress. Reverse path ingress is usually
amplitude modulated (AM), but could also be FM. Listening to the ingress helps to identify the source.
• FM demod for the audio of forward channels and
certain shortwave radio.
• AM demod for most reverse interference and ingress,
such as CB, Ham, and shortwave radio.
• This may give you some insight into the location of the
source or at least the nature of the source. You may be
able to get the call signs of a ham radio operator
or a mile marker from a truck driver using his CB.
This could aid in pinpointing the ingress location.
Application Note: Return Path Troubleshooting
3
A single source of interference is easy to track down. If it’s
constant, just use the “divide and conquer” theory to dissect
the system. Observing how it reacts and changes could indicate different sources such as a trucker or home user. A CB
level changing quickly or slowly could indicate this source
quickly.
ing. Sometimes an in-line pad can be attached to
decrease the amount of energy tested, which in turn,
may create a better match. Be careful when probing
seizure screws, though. The AC present will harm inline pads and certain test equipment. The equipment
is AC blocked for ~ 100 Vac.
Multiple ingress sources, bursty noise, and electrical transient noise are a totally different story and are very difficult
to pinpoint. Remember that the lower value taps contribute more noise and ingress than the higher value taps. The
lower attenuation from tap values of 14 and below coupled
with the low attenuation in the cable at lower frequencies
creates an easy path for noise to funnel back.
• Start with 14 dB taps and lower. If the problem is at the
input of the tap and not the output, then the problem
is from one of the drops or farther upstream possibly
from a cracked cable before the next amplifier.
• Look at one drop at a time to determine the biggest
contributor.
Return Path Power Addition
Many people don’t fully understand power addition and
become discouraged when trying to perform noise mitigation. A little decrease could be more than you think.
Understanding power loading for return path ingress is
essential to help aid in troubleshooting.
For example: I observe a CB signal at 27 MHz in the
headend at 20 dBmV total power. I disconnect one leg
by removing a reverse input pad and the level drops to
18.8 dBmV. I disconnect the second leg and the level drops
to 17 dBmV. After disconnecting the third leg, the total
power drops to 14 dBmV. After disconnecting the last leg,
the ingress at 27 MHz is eliminated. So the question that
remains is, which leg has the largest amount of ingress?
The answer is none. All four legs of the node are funneling
equal amounts of noise to the headend of 14 dBmV! Two
14s equal 17. Three 14s equal approximately 18.8 and four
14s equal 20 dBmV. Remember, every doubling of power is
3 dB.
Test Location Considerations
• Because the return path signals are low in level, it may
be warranted to use a preamp.
• The preamp is used to raise the signal above the noise
floor of the test equipment. This is especially a problem
on the return signals that are read from high loss test
points.
• The newer units have a preamp built-in and compensate all measurements accordingly.
• If a problem is observed at the output seizure screw of a
tap, continue on.
• Some new probes from SignalVision and Gilbert create
a good ground and quick connect.
Note: One caveat to this is a probe will always be bi-directional and will cause an impedance mismatch itself.
This is something to keep in mind when troubleshoot-
Noise Readings
• Be careful with spectrum analyzer, noise level readings.
2 dB/div is a good scale for sweeping and 5 or 10 dB/
div is best for the spectrum mode.
• The level displayed is based on the RBW setting and
will be very different from one setting to another.
A -20 dBmV noise floor with 30 kHz RBW is really
1.2 dBmV in a 4 MHz bandwidth and there’s usually a
correction factor associated with it.
Note: The “Spectrum” mode is not the same as a true spectrum analyzer. The RBW is set at 280 kHz and a VBW >
1 MHz. This is optimized for analog carriers and burst
noise measurements. It has a peak noise detector so
the noise reading may be significantly higher than a
normal spectrum analyzer with the same RBW setting.
• A pad on the analyzer will lower the level as well. Attenuation and gain affect noise and carriers equally.
• Measurements with no point of reference are very
misleading. If there’s a reference carrier present, you
can make a relative measurement, such as desired-toundesired ratio (D/U). One fault with this, though, is
RBW settings affect noise and continuous wave (CW)
carriers differently. A CW carrier is theoretically 1 Hz
wide and the level won’t change with different RBW
settings while the noise level will, thus giving a different D/U ratio. A CW carrier will change shape on the
analyzer display because of the RBW filter width.
The “Noise” Mode
• The ability to switch between a headend mode and a
remote analyzer mode has many advantages. One can
successfully use the “divide and conquer” technique to
quickly find the source of the problem and not have
to rely on another person’s interpretation. This also
eliminates inefficient use of resources and employee
time.
Application Note: Return Path Troubleshooting
• The field unit has a “noise/ingress” feature, which can
be used for troubleshooting. This displays the noise
seen in the headend with optimum resolution of 280
kHz. This simplifies reverse troubleshooting and testing of headend reverse noise or ingress. The newer
headend unit will transmit or broadcast the ingress
from all the return amplifiers connected to it back to
the field unit. This transmits the ingress seen in the
headend on the forward telemetry frequency. So if no
reverse communication is achieved, you will still get a
display of the noise/ingress floor. The noise mode on
the multiple user reverse receiver (Rx) transmits the
total noise in the headend also, but with a resolution
based on the return channel plan resolution.
Note: The newer “Noise” mode can take up to a minute to
track if the reverse is not connected. The new PathTrak
system is faster and more resolution is obtained for
return path monitoring and troubleshooting.
PathTrak
PathTrak is a Return Path Monitoring system that consistently and automatically provides:
• Advanced notice to detect developing problems
• A chance to respond before outages occur, which eventually generate into service calls
• Performance archiving
• Ability to organize preventative maintenance
• Reports to correlate RF plant performance to error
reports from modems and telephony systems
Systems can quickly characterize and separate real problems from insignificant events. This is critical to:
•
•
•
•
Perform trend analysis
Set baseline performance standards
Certify plant as “ready” for operation
Document times and frequencies that are more reliable, possibly to set times for IPPV downloads and to
do quality of service (QoS) provisioning.
This system can also be incorporated to communicate with
the field units. This allows the field unit to observe noise
and ingress levels in the headend while in the field on a “per
node” basis.
4
• By utilizing forward path egress techniques, it may be
possible to characterize the return path ingress points
to some extent. Testing stringently at 5 or 10 µV/m
everywhere, including the drops, is probably a better indication of return path integrity. The hardline
plant only contributes about 5% of the total ingress.
Approximately 75% of ingress is from house and 20%
from the drop.
• Forward path leakage does not necessarily equal ingress, though. Some sources of leakage and ingress are
frequency selective. This would lead us to believe that a
reverse frequency would be better to monitor.
• The problem with this is signals on the return path are
only present when communication is taking place.
They are usually very low in level and bursty in nature.
• We can’t insert a reverse frequency carrier at the headend because the diplex filters would block the carrier.
• We can’t insert a carrier at the EOL and look for egress,
because sources of ingress inhibit accurate measurements. Most importantly, the antenna would be huge;
approximately 23.4 feet for 20 MHz! Maybe we can
get away with an octave of that and also tag it with an
identifying signal.
Using a Variable Dwell Time to Catch
Impulse Noise
• Some spectrum analyzers call this sweep speed or the
dwell time. If the sweep speed is too fast, it may skip
over fast impulse noise.
• So we slow down the sweep speed or increase the dwell
time. One problem with a longer dwell time on a spectrum analyzer is that it takes longer to scan.
• The nice thing about a longer dwell time is that it’s
easier to catch intermittent signals because it displays
the carrier peak. This is similar to a peak hold every
scan, which makes it great for troubleshooting impulse
noise.
Return Path Egress/Ingress Testing
• The FCC states that the maximum allowable limit for
egress from dc up to 54 MHz is 15 µV/m at 30 meters.
We commonly refer to this as leakage.
Reverse ingress spectrum trace after 30 s with traditional settings.
Application Note: Return Path Troubleshooting
5
Why Measure Cable Modem C/N?
Reverse ingress spectrum trace after 6 s. with dwell-time = 20 ms.
The “Zero Span” Mode
• In this mode, you can view desired-to-undesired ratios
and see peak bursts of TDMA data. You can also measure peak digital levels, observe high traffic periods &
collisions, and see ingress in the data packet without
taking the service off-line.
• Measuring the Signal-to-Noise (S/N) on return-path
cable modem signals has never been an easy assignment, especially for the novice field technician. A
fundamental difficulty has been the detailed set-up
of the test equipment required to make the modem
S/N measurement. The test equipment is normally
a spectrum analyzer used in a zero-span operating
mode. The zero-span mode requires the user to be
well acquainted with set-up parameters such as trigger
level threshold, sweep time, measurement bandwidth,
video bandwidth, and resolution bandwidth. The field
technician must also be proficient at RF signal evaluation in the time-domain mode, versus the standard
frequency domain mode.
• To overcome the confusing test equipment set-up process, JDSU has introduced a new instrument feature
that allows technicians, at all skill levels, to perform accurate return-path cable modem S/N measurements.
The feature is called Modem C/N, and is a standard
feature on all SDA-5000 and SDA-4040D meters with
firmware version 2.2. This feature is accessable under
the Navigator screen.
• The modem S/N of the return cable plant may well
determine whether the return network is capable of
reliably carrying cable modem traffic. The DOCSIS
standard states that the S/N for upstream (return) digital signals is 20 dB for QPSK and 25 dB for 16-QAM.
Although most QPSK and 16-QAM signals are robust
enough to transmit through noisier return path environments, complying with the DOCSIS S/N standard
will ensure that the cable modem will reliably operate
on the return network.
• Use the pre-amp and low pass filter when doing any
zero-span or modem test. The forward levels hitting
the meter and the test equipment noise floor could
give faulty noise floor readings.
• The RBW is factory set to 2 MHz. To make accurate
measurements in zero-span, you should use a RBW
smaller than the actual payload of the modem. Remember there are 5 modem payloads specified. .16,
.32, .64, 1.28, and 2.56 MHz. I’m talking payload not
the filter skirts included.
• You can use the factory default RBW of 2 MHz if you
make the MBW 2 MHz like the RBW, that way no correction factor is added for carriers that are narrower
than 2 MHz. One problem with this is the noise floor
will be uncorrected when it actually should be.
6
Application Note: Return Path Troubleshooting
All statements, technical information and recommendations related to the products herein are based upon information believed to be reliable or accurate. However, the accuracy or completeness thereof is not guaranteed, and no
responsibility is assumed for any inaccuracies. The user assumes all risks and liability whatsoever in connection with
the use of a product or its applications. JDSU reserves the right to change at any time without notice the design,
specifications, function, fit or form of its products described herein, including withdrawal at any time of a product
offered for sale herein. JDSU makes no representations that the products herein are free from any intellectual property
claims of others. Please contact JDSU for more information. JDSU and the JDSU logo are trademarks of JDS Uniphase
Corporation. Other trademarks are the property of their respective holders.
© 2006 JDS Uniphase Corporation. All rights reserved. 30137308 500 0906 RPT.AN.CAB.TM.AE
Test & Measurement Regional Sales
NORTH AMERICA
LATIN AMERICA
ASIA PACIFIC
TEL: 1 866 228 3762
FAX: +1 301 353 9216
TEL:+55 11 5503 3800
FAX:+55 11 5505 1598
TEL:+852 2892 0990
FAX:+852 2892 0770
EMEA
TEL:+49 7121 86 2222
FAX:+49 7121 86 1222
WEBSITE: www.jdsu.com