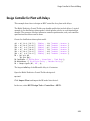
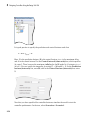
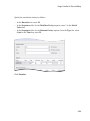
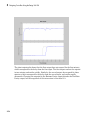
1
Model Predictive Control Toolbox™
Getting Started Guide
Alberto Bemporad
Manfred Morari
N. Lawrence Ricker
R2015a
How to Contact MathWorks
Latest news:
www.mathworks.com
Sales and services:
www.mathworks.com/sales_and_services
User community:
www.mathworks.com/matlabcentral
Technical support:
www.mathworks.com/support/contact_us
Phone:
508-647-7000
The MathWorks, Inc.
3 Apple Hill Drive
Natick, MA 01760-2098
Model Predictive Control Toolbox™ Getting Started Guide
© COPYRIGHT 2005–2015 by The MathWorks, Inc.
The software described in this document is furnished under a license agreement. The software may be used
or copied only under the terms of the license agreement. No part of this manual may be photocopied or
reproduced in any form without prior written consent from The MathWorks, Inc.
FEDERAL ACQUISITION: This provision applies to all acquisitions of the Program and Documentation
by, for, or through the federal government of the United States. By accepting delivery of the Program
or Documentation, the government hereby agrees that this software or documentation qualifies as
commercial computer software or commercial computer software documentation as such terms are used
or defined in FAR 12.212, DFARS Part 227.72, and DFARS 252.227-7014. Accordingly, the terms and
conditions of this Agreement and only those rights specified in this Agreement, shall pertain to and
govern the use, modification, reproduction, release, performance, display, and disclosure of the Program
and Documentation by the federal government (or other entity acquiring for or through the federal
government) and shall supersede any conflicting contractual terms or conditions. If this License fails
to meet the government's needs or is inconsistent in any respect with federal procurement law, the
government agrees to return the Program and Documentation, unused, to The MathWorks, Inc.
Trademarks
MATLAB and Simulink are registered trademarks of The MathWorks, Inc. See
www.mathworks.com/trademarks for a list of additional trademarks. Other product or brand
names may be trademarks or registered trademarks of their respective holders.
Patents
MathWorks products are protected by one or more U.S. patents. Please see
www.mathworks.com/patents for more information.
Revision History
October 2004
March 2005
September 2005
March 2006
September 2006
March 2007
September 2007
March 2008
October 2008
March 2009
September 2009
March 2010
September 2010
April 2011
September 2011
March 2012
September 2012
March 2013
September 2013
March 2014
October 2014
March 2015
First printing
Online only
Online only
Online only
Online only
Online only
Online only
Online only
Online only
Online only
Online only
Online only
Online only
Online only
Online only
Online only
Online only
Online only
Online only
Online only
Online only
Online only
New for Version 2.1 (Release 14SP1)
Revised for Version 2.2 (Release 14SP2)
Revised for Version 2.2.1 (Release 14SP3)
Revised for Version 2.2.2 (Release 2006a)
Revised for Version 2.2.3 (Release 2006b)
Revised for Version 2.2.4 (Release 2007a)
Revised for Version 2.3 (Release 2007b)
Revised for Version 2.3.1 (Release 2008a)
Revised for Version 3.0 (Release 2008b)
Revised for Version 3.1 (Release 2009a)
Revised for Version 3.1.1 (Release 2009b)
Revised for Version 3.2 (Release 2010a)
Revised for Version 3.2.1 (Release 2010b)
Revised for Version 3.3 (Release 2011a)
Revised for Version 4.0 (Release 2011b)
Revised for Version 4.1 (Release 2012a)
Revised for Version 4.1.1 (Release 2012b)
Revised for Version 4.1.2 (Release 2013a)
Revised for Version 4.1.3 (Release 2013b)
Revised for Version 4.2 (Release R2014a)
Revised for Version 5.0 (Release 2014b)
Revised for Version 5.0.1 (Release 2015a)
Contents
1
2
Introduction
Model Predictive Control Toolbox Product Description . . . .
Key Features . . . . . . . . . . . . . . . . . . . . . . . . . . . . . . . . . . . . .
1-2
1-2
Acknowledgments . . . . . . . . . . . . . . . . . . . . . . . . . . . . . . . . . . .
1-3
Bibliography . . . . . . . . . . . . . . . . . . . . . . . . . . . . . . . . . . . . . . . .
1-4
Building Models
MPC Modeling . . . . . . . . . . . . . . . . . . . . . . . . . . . . . . . . . . . . . .
Plant Model . . . . . . . . . . . . . . . . . . . . . . . . . . . . . . . . . . . . . .
Input Disturbance Model . . . . . . . . . . . . . . . . . . . . . . . . . . .
Output Disturbance Model . . . . . . . . . . . . . . . . . . . . . . . . . .
Measurement Noise Model . . . . . . . . . . . . . . . . . . . . . . . . . .
2-2
2-2
2-4
2-5
2-6
Signal Types . . . . . . . . . . . . . . . . . . . . . . . . . . . . . . . . . . . . . . . .
Inputs . . . . . . . . . . . . . . . . . . . . . . . . . . . . . . . . . . . . . . . . . .
Outputs . . . . . . . . . . . . . . . . . . . . . . . . . . . . . . . . . . . . . . . . .
2-8
2-8
2-8
Construct Linear Time Invariant (LTI) Models . . . . . . . . . . .
Transfer Function Models . . . . . . . . . . . . . . . . . . . . . . . . . . .
Zero/Pole/Gain Models . . . . . . . . . . . . . . . . . . . . . . . . . . . . .
State-Space Models . . . . . . . . . . . . . . . . . . . . . . . . . . . . . . .
LTI Object Properties . . . . . . . . . . . . . . . . . . . . . . . . . . . . .
LTI Model Characteristics . . . . . . . . . . . . . . . . . . . . . . . . . .
2-9
2-9
2-10
2-10
2-12
2-15
Specify Multi-Input Multi-Output (MIMO) Plants . . . . . . . .
2-17
v
3
vi
Contents
CSTR Model . . . . . . . . . . . . . . . . . . . . . . . . . . . . . . . . . . . . . . .
2-19
Linearize Simulink Models . . . . . . . . . . . . . . . . . . . . . . . . . . .
Linearization Using MATLAB Code . . . . . . . . . . . . . . . . . .
Linearization Using Linear Analysis Tool in Simulink Control
Design . . . . . . . . . . . . . . . . . . . . . . . . . . . . . . . . . . . . . . .
2-21
2-21
Identify Plant from Data . . . . . . . . . . . . . . . . . . . . . . . . . . . .
2-31
Design Controller for Identified Plant . . . . . . . . . . . . . . . . .
2-33
Design Controller Using Identified Model with Noise
Channel . . . . . . . . . . . . . . . . . . . . . . . . . . . . . . . . . . . . . . . . .
2-35
Working with Impulse-Response Models . . . . . . . . . . . . . . .
2-37
Bibliography . . . . . . . . . . . . . . . . . . . . . . . . . . . . . . . . . . . . . . .
2-38
2-24
Designing Controllers Using the Design Tool GUI
Design Controller Using the Design Tool . . . . . . . . . . . . . . . .
Start the Design Tool . . . . . . . . . . . . . . . . . . . . . . . . . . . . . .
Load a Plant Model . . . . . . . . . . . . . . . . . . . . . . . . . . . . . . . .
Navigate Using the Tree View . . . . . . . . . . . . . . . . . . . . . . .
Perform Linear Simulations . . . . . . . . . . . . . . . . . . . . . . . .
Customize Response Plots . . . . . . . . . . . . . . . . . . . . . . . . . .
Change Controller Settings . . . . . . . . . . . . . . . . . . . . . . . . .
Define Soft Output Constraints . . . . . . . . . . . . . . . . . . . . . .
Save Your Work . . . . . . . . . . . . . . . . . . . . . . . . . . . . . . . . .
Load Your Saved Work . . . . . . . . . . . . . . . . . . . . . . . . . . . .
3-2
3-2
3-3
3-6
3-10
3-17
3-23
3-40
3-44
3-46
Test Controller Robustness . . . . . . . . . . . . . . . . . . . . . . . . . .
Plant Model Perturbation . . . . . . . . . . . . . . . . . . . . . . . . . .
Simulation Tests . . . . . . . . . . . . . . . . . . . . . . . . . . . . . . . . .
3-48
3-48
3-48
Design Controller for Plant with Delays . . . . . . . . . . . . . . .
3-51
Design Controller for Nonsquare Plant . . . . . . . . . . . . . . . .
More Outputs Than Manipulated Variables . . . . . . . . . . . .
3-58
3-58
More Manipulated Variables Than Outputs . . . . . . . . . . . .
4
3-59
Designing Controllers Using the Command Line
Design Controller at the Command Line . . . . . . . . . . . . . . . .
Create a Controller Object . . . . . . . . . . . . . . . . . . . . . . . . . .
View and Alter Controller Properties . . . . . . . . . . . . . . . . . .
Review Controller Design . . . . . . . . . . . . . . . . . . . . . . . . . . .
Perform Linear Simulations . . . . . . . . . . . . . . . . . . . . . . . . .
Save Calculated Results . . . . . . . . . . . . . . . . . . . . . . . . . . . .
4-2
4-2
4-3
4-5
4-6
4-8
Simulate Controller with Nonlinear Plant . . . . . . . . . . . . . . .
Nonlinear CSTR Application . . . . . . . . . . . . . . . . . . . . . . . . .
Example Code for Successive Linearization . . . . . . . . . . . . .
CSTR Results and Discussion . . . . . . . . . . . . . . . . . . . . . . .
4-9
4-9
4-10
4-12
Control Based On Multiple Plant Models . . . . . . . . . . . . . . .
A Two-Model Plant . . . . . . . . . . . . . . . . . . . . . . . . . . . . . . .
Designing the Two Controllers . . . . . . . . . . . . . . . . . . . . . .
Simulating Controller Performance . . . . . . . . . . . . . . . . . . .
4-15
4-15
4-17
4-18
Compute Steady-State Gain . . . . . . . . . . . . . . . . . . . . . . . . . .
4-24
Extract Controller . . . . . . . . . . . . . . . . . . . . . . . . . . . . . . . . . .
4-25
Bibliography . . . . . . . . . . . . . . . . . . . . . . . . . . . . . . . . . . . . . . .
4-26
Signal Previewing . . . . . . . . . . . . . . . . . . . . . . . . . . . . . . . . . .
4-27
Run-Time Constraint Updating . . . . . . . . . . . . . . . . . . . . . . .
4-28
Run-Time Weight Tuning . . . . . . . . . . . . . . . . . . . . . . . . . . . .
4-29
vii
5
Designing and Testing Controllers in Simulink
Design Controller in Simulink . . . . . . . . . . . . . . . . . . . . . . . . .
viii
Contents
5-2
Test an Existing Controller . . . . . . . . . . . . . . . . . . . . . . . . . .
5-15
Schedule Controllers at Multiple Operating Points . . . . . .
A Two-Model Plant . . . . . . . . . . . . . . . . . . . . . . . . . . . . . . .
Animation of the Multi-Model Example . . . . . . . . . . . . . . . .
Designing the Two Controllers . . . . . . . . . . . . . . . . . . . . . .
Simulating Controller Performance . . . . . . . . . . . . . . . . . . .
5-16
5-16
5-17
5-18
5-19
1
Introduction
• “Model Predictive Control Toolbox Product Description” on page 1-2
• “Acknowledgments” on page 1-3
• “Bibliography” on page 1-4
1
Introduction
Model Predictive Control Toolbox Product Description
Design and simulate model predictive controllers
Model Predictive Control Toolbox™ provides functions, an app, and Simulink® blocks for
systematically analyzing, designing, and simulating model predictive controllers. You
can specify plant and disturbance models, horizons, constraints, and weights. The toolbox
enables you to diagnose issues that could lead to run-time failures and provides advice on
tuning weights to improve performance and robustness. By running different scenarios in
linear and nonlinear simulations, you can evaluate controller performance.
You can adjust controller performance as it runs by tuning weights and varying
constraints. You can implement adaptive model predictive controllers by updating the
plant model at run time. For applications with fast sample times, you can develop explicit
model predictive controllers. For rapid prototyping and embedded system design, the
toolbox supports C-code and IEC 61131-3 Structured Text generation.
Key Features
• Design and simulation of model predictive controllers in MATLAB® and Simulink
• Customization of constraints and weights with advisory tools for improved
performance and robustness
• Adaptive MPC control through run-time changes to internal plant model
• Explicit MPC control for applications with fast sample times using pre-computed
solutions
• Control of plants over a wide range of operating conditions by switching between
multiple model predictive controllers
• Specialized model predictive control quadratic programming (QP) solver optimized for
speed, efficiency, and robustness
• Support for C-code generation with Simulink Coder™ and IEC 61131-3 Structured
Text generation with Simulink PLC Coder™
1-2
Acknowledgments
Acknowledgments
MathWorks would like to acknowledge the following contributors to Model Predictive
Control Toolbox.
Alberto Bemporad
Professor of Control Systems, IMT Institute for Advanced Studies Lucca, Italy.
Research interests include model predictive control, hybrid systems, optimization
algorithms, and applications to automotive, aerospace, and energy systems. Fellow of
the IEEE®. Author of the Model Predictive Control Simulink library and commands.
Manfred Morari
Professor at the Automatic Control Laboratory and former Head of Department
of Information Technology and Electrical Engineering, ETH Zurich, Switzerland.
Research interests include model predictive control, hybrid systems, and robust
control. Fellow of the IEEE, AIChE, and IFAC. Co-author of the first version of the
toolbox.
N. Lawrence Ricker
Professor of Chemical Engineering, University of Washington, Seattle, USA.
Research interests include model predictive control and process optimization. Author
of the quadratic programming solver and graphical user interface.
1-3
1
Introduction
Bibliography
[1] Allgower, F., and A. Zheng, Nonlinear Model Predictive Control, Springer-Verlag,
2000.
[2] Camacho, E. F., and C. Bordons, Model Predictive Control, Springer-Verlag, 1999.
[3] Kouvaritakis, B., and M. Cannon, Non-Linear Predictive Control: Theory & Practice,
IEE Publishing, 2001.
[4] Maciejowski, J. M., Predictive Control with Constraints, Pearson Education POD,
2002.
[5] Prett, D., and C. Garcia, Fundamental Process Control, Butterworths, 1988.
[6] Rossiter, J. A., Model-Based Predictive Control: A Practical Approach, CRC Press,
2003.
1-4
2
Building Models
• “MPC Modeling” on page 2-2
• “Signal Types” on page 2-8
• “Construct Linear Time Invariant (LTI) Models” on page 2-9
• “Specify Multi-Input Multi-Output (MIMO) Plants” on page 2-17
• “CSTR Model” on page 2-19
• “Linearize Simulink Models” on page 2-21
• “Identify Plant from Data” on page 2-31
• “Design Controller for Identified Plant” on page 2-33
• “Design Controller Using Identified Model with Noise Channel” on page 2-35
• “Working with Impulse-Response Models” on page 2-37
• “Bibliography” on page 2-38
2
Building Models
MPC Modeling
In this section...
“Plant Model” on page 2-2
“Input Disturbance Model” on page 2-4
“Output Disturbance Model” on page 2-5
“Measurement Noise Model” on page 2-6
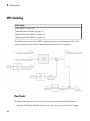
The model structure used in the MPC controller appears in the illustration below. This
section explains how the models connect for prediction and state estimation.
Plant Model
The plant model may be in one of the following linear-time-invariant (LTI) formats:
• Numeric LTI models: Transfer function (tf), state-space (ss), zero-pole-gain (zpk).
2-2
MPC Modeling
• Identified models (requires System Identification Toolbox™): idss, idtf, idproc,
and idpoly.
The MPC controller performs all the estimation and optimization calculations using
a discrete-time, delay-free, state-space system, with dimensionless input and output
variables. Therefore, when you specify a plant model in the MPC controller, the following
model-conversion steps are automatically carried out, if needed:
1
Conversion to state-space. The ss command appropriate for the supplied model
format generates an LTI state-space model.
2
Discretization or resampling. If the model’s sample time differs from the MPC
controller’s sample time (defined in the Ts property), one of the following occurs:
• If the model is continuous-time, the c2d command converts it to a discrete-time
LTI object using the controller’s sample time.
• If the model is discrete-time, the d2d command resamples it to generate a
discrete-time LTI object using the controller’s sample time.
3
Delay removal. If the discrete time model includes any input, output, or internal
delays, the absorbDelay command replaces them with the appropriate number
of poles at z = 0, increasing the total number of discrete states. The InputDelay,
OutputDelay, and InternalDelay properties of the resulting state space model
are all zero.
4
Conversion to dimensionless input and output variables. The MPC controller allows
you to specify a scale factor for each plant input and output variable. If you do not
specify scale factors, they default to unity. The software converts the plant input and
output variables to dimensionless form as follows:
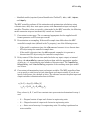
x p ( k + 1 ) = A p x p ( k ) + BSi u p ( k )
y p ( k ) = So-1Cxp ( k ) + So-1 DSi up ( k ) .
Here, where Ap, B, C, and D are constant state space matrices determined in step 3,
and:
• Si — Diagonal matrix of input scale factors in engineering units.
• So — Diagonal matrix of output scale factors in engineering units.
• xp — State vector from step 3 in engineering units. No scaling is performed on
state variables.
2-3
2
Building Models
• up — Dimensionless plant input variables.
• up — Dimensionless plant output variables.
The resulting plant model has the following equivalent form:
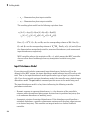
x p ( k + 1 ) = A p x p ( k ) + Bpu u ( k ) + Bpv v ( k ) + B pd d ( k )
y p ( k ) = Cp x p ( k ) + D pu u ( k ) + D pv v ( k ) + D pd d ( k ) .
Here, C p = So-1C , Bpu, Bpv and Bpd are the corresponding columns of BSi. Also, Dpu,
Bpv and Bpd are the corresponding columns of So-1 DSi . Finally, u(k), v(k) and d(k) are
the dimensionless manipulated variables, measured disturbances, and unmeasured
input disturbances, respectively.
MPC controller enforces the restriction of Dpu = 0, which means that MPC controller
does not allow direct feedthrough from any manipulated variable to any plant
output.
Input Disturbance Model
If your plant model includes unmeasured input disturbances, labeled as d(k) in the
diagram of the MPC system, the input disturbance model indicates how d(k) evolves with
time. That is, the input disturbance model specifies what type of signal you expect from
d(k). If you do not provide an input disturbance model, the controller uses a default input
disturbance model. The getindist command provides access to the model being used.
The input disturbance model is a key factor influencing the following controller
performance attributes:
• Dynamic response to apparent disturbances, i.e., the character of the controller’s
response when the measured plant output deviates from its predicted trajectory (due
to an unknown disturbance or modeling error).
• Asymptotic rejection of sustained disturbances. If the disturbance model predicts a
sustained disturbance, controller adjustments continue until the plant output returns
to its desired trajectory. This emulates an integral mode in a classical feedback
controller.
2-4
MPC Modeling
You can provide the input disturbance model as an LTI state-space (ss), transfer
function (tf), or zero-pole-gain (zpk) object. See “Controller State Estimation” for more
details about the input disturbance model.
The MPC controller converts the input disturbance model to a discrete-time, delay-free,
LTI state-space system using the same steps used to convert the plant model (see “Plant
Model” on page 2-2). The result is:
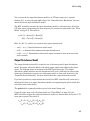
xid ( k + 1 ) = Aid xid ( k ) + Bid wid ( k )
d ( k ) = Cid xid ( k ) + Did wid ( k ) .
Here, Aid, Bid, Cid, and Did are constant state space matrices and:
• xid(k) — nxid ≥ 0 input disturbance model states.
• dk(k) — nd dimensionless unmeasured input disturbances.
• wid(k) — nid ≥ 1 dimensionless white noise inputs, assumed to have zero mean and
unity variance.
Output Disturbance Model
The output disturbance model is a special case of the more general input disturbance
model. Its output is directly added to the plant output rather than affecting the plant
states. The diagram shows its location in the MPC model hierarchy. The output
disturbance model indicates how the disturbance will evolve with time (in other words,
what type of disturbance signal you would expect) and it is often used in practice. See
“Controller State Estimation” for more details about the output disturbance model.
If you don’t provide an output disturbance model, the MPC controller will create one by
default when there is no input disturbance model and augmenting the plant model does
not violate state observability.
The getoutdist command provides access to the model being used.
Using the same steps as for the plant model (see “Plant Model” on page 2-2), the
MPC controller converts the output disturbance model to a discrete-time, delay-free, LTI
state-space system. The result is:
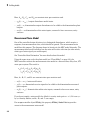
xod ( k + 1 ) = Aod xod ( k ) + Bod wod ( k )
yod ( k ) = Cod xod ( k ) + Dod wod ( k ) .
2-5
2
Building Models
Here, Aod, Bod, Cod, and Dod are constant state space matrices and:
• xod(k) — nxod ≥ 1 output disturbance model states.
• yod(k) — ny dimensionless output disturbances to be added to the dimensionless plant
outputs.
• wod(k) — nod dimensionless white noise inputs, assumed to have zero mean, unity
variance.
Measurement Noise Model
One of the controller design objectives is to distinguish disturbances, which require a
response, from measurement noise, which should be ignored. The measurement noise
model has this purpose. The diagram shows its location in the MPC model hierarchy. The
measurement noise model indicates how the noise will evolve with time (in other words,
what type of noise signal you would expect).
See “Controller State Estimation” for more details about this model.
Using the same steps as for the plant model (see “Plant Model” on page 2-2), the
MPC controller converts the measurement noise model to a discrete-time, delay-free, LTI
state-space system. The result is:
xn ( k + 1) = An xn ( k ) + Bn wn ( k )
yn ( k ) = Cn xn ( k ) + Dn wn ( k ) .
Here, An, Bn, Cn, and Dn are constant state space matrices and:
• xn(k) — nxn ≥ 0 noise model states.
• yn(k) — nym dimensionless noise signals to be added to the dimensionless measured
plant outputs.
• wn(k) — nn ≥ 1 dimensionless white noise inputs, assumed to have zero mean, unity
variance.
If you do not supply a noise model, the default is a unity static gain: nxn = 0, Dn is an nymby-nym identity matrix, and An, Bn, and Cn are empty.
For an mpc controller object MPCobj, the property MPCobj.Model.Noise provides
access to the measurement noise model.
2-6
MPC Modeling
Note: If the minimum eigenvalue of Dn DnT is less than 1x10⁻⁸, the MPC controller adds
1x10⁻⁴ to each diagonal element of Dn. This adjustment makes it more likely that the
default Kalman gain calculation will succeed.
More About
•
“Controller State Estimation”
2-7
2
Building Models
Signal Types
Inputs
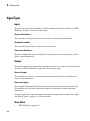
The plant inputs are the independent variables affecting the plant. As shown in “MPC
Modeling” on page 2-2, there are three types:
Measured disturbances
The controller can't adjust them, but uses them for feedforward compensation.
Manipulated variables
The controller adjusts these in order to achieve its goals.
Unmeasured disturbances
These are independent inputs of which the controller has no direct knowledge, and for
which it must compensate.
Outputs
The plant outputs are the dependent variables (outcomes) you wish to control or monitor.
As shown in “MPC Modeling” on page 2-2, there are two types:
Measured outputs
The controller uses these to estimate unmeasured quantities and as feedback on the
success of its adjustments.
Unmeasured outputs
The controller estimates these based on available measurements and the plant model.
The controller can also hold unmeasured outputs at setpoints or within constraint
boundaries.
You must specify the input and output types when designing the controller. See “Input
and Output Types” on page 2-14 for more details.
More About
•
2-8
“MPC Modeling” on page 2-2
Construct Linear Time Invariant (LTI) Models
Construct Linear Time Invariant (LTI) Models
In this section...
“Transfer Function Models” on page 2-9
“Zero/Pole/Gain Models” on page 2-10
“State-Space Models” on page 2-10
“LTI Object Properties” on page 2-12
“LTI Model Characteristics” on page 2-15
Model Predictive Control Toolbox software supports the same LTI model formats as does
Control System Toolbox™ software. You can use whichever is most convenient for your
application. It's also easy to convert from one format to another.
The following topics describe the three model formats and the commands used to
construct them:
• “Transfer Function Models” on page 2-9
• “Zero/Pole/Gain Models” on page 2-10
• “State-Space Models” on page 2-10
• “LTI Object Properties” on page 2-12
• “Specify Multi-Input Multi-Output (MIMO) Plants” on page 2-17
• “LTI Model Characteristics” on page 2-15
For more details, see the Control System Toolbox documentation.
Transfer Function Models
A transfer function (TF) relates a particular input/output pair. For example, if u(t) is a
plant input and y(t) is an output, the transfer function relating them might be:
Y ( s)
s+2
= G( s) =
e - 1 .5 s
2
U ( s)
s + s + 10
This TF consists of a numerator polynomial, s+2, a denominator polynomial, s2+s+10, and
a delay, which is 1.5 time units here. You can define G using Control System Toolbox tf
function:
2-9
2
Building Models
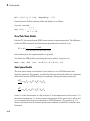
Gtf1 = tf([1 2], [1 1 10], 'OutputDelay', 1.5)
Control System Toolbox software builds and displays it as follows:
Transfer function:
s + 2
exp(-1.5*s) * -----------s^2 + s + 10
Zero/Pole/Gain Models
Like the TF, the zero/pole/gain (ZPK) format relates an input/output pair. The difference
is that the ZPK numerator and denominator polynomials are factored, as in
G ( s) = 2 .5
s + 0.45
( s + 0 .3)( s + 0 .1 + 0 .7 i)( s + 0 .1 - 0.7i)
(zeros and/or poles are complex numbers in general).
You define the ZPK model by specifying the zero(s), pole(s), and gain as in
Gzpk1 = zpk( -0.45, [-0.3, -0.1+0.7*i, -0.1-0.7*i], 2.5)
State-Space Models
The state-space format is convenient if your model is a set of LTI differential and
algebraic equations. For example, consider the following linearized model of a continuous
stirred-tank reactor (CSTR) involving an exothermic (heat-generating) reaction [9]
dC¢A
= a11C¢A + a12 T ¢ + b11Tc¢ + b12C¢Ai
dt
dT ¢
= a21C¢A + a22 T ¢ + b21Tc¢ + b22 C¢Ai
dt
where CA is the concentration of a key reactant, T is the temperature in the reactor, Tc is
the coolant temperature, CAi is the reactant concentration in the reactor feed, and aij and
bij are constants. See the process schematic in CSTR Schematic. The primes (e.g., C′A)
denote a deviation from the nominal steady-state condition at which the model has been
linearized.
2-10
Construct Linear Time Invariant (LTI) Models
CSTR Schematic
Measurement of reactant concentrations is often difficult, if not impossible. Let us
assume that T is a measured output, CA is an unmeasured output, Tc is a manipulated
variable, and CAi is an unmeasured disturbance.
The model fits the general state-space format
dx
= Ax + Bu
dt
y = Cx + Du
where
ÈC¢ ˘
È T¢ ˘
È T¢ ˘
x = Í A˙ u= Í c ˙ y = Í ˙ ,
Î T¢ ˚
Î C¢Ai ˚
ÎC¢A ˚
Èa
A = Í 11
Î a21
a12 ˘
b12 ˘
Èb
È0 1 ˘
È0 0 ˘
B = Í 11
C= Í
D=Í
˙
˙
˙
˙
a22 ˚
Î b21 b22 ˚
Î1 0 ˚
Î0 0 ˚
The following code shows how to define such a model for some specific values of the aij
and bij constants:
A = [-0.0285
-0.0371
B = [-0.0850
0.0802
-0.0014
-0.1476];
0.0238
0.4462];
2-11
2
Building Models
C = [0 1
1 0];
D = zeros(2,2);
CSTR = ss(A,B,C,D);
This defines a continuous-time state-space model. If you do not specify a sampling period,
a default sampling value of zero applies. You can also specify discrete-time state-space
models. You can specify delays in both continuous-time and discrete-time models.
Note In the CSTR example, the D matrix is zero and the output does not instantly
respond to change in the input. The Model Predictive Control Toolbox software prohibits
direct (instantaneous) feedthrough from a manipulated variable to an output. For
example, the CSTR model could include direct feedthrough from the unmeasured
disturbance, CAi, to either CA or T but direct feedthrough from Tc to either output would
violate this restriction. If the model had direct feedthrough from Tc, you can add a small
delay at this input to circumvent the problem.
LTI Object Properties
The ss function in the last line of the above code creates a state space model, CSTR,
which is an LTI object. The tf and zpk commands described in “Transfer Function
Models” on page 2-9 and “Zero/Pole/Gain Models” on page 2-10 also create LTI
objects. Such objects contain the model parameters as well as optional properties.
LTI Properties for the CSTR Example
The following code sets some of the CSTR model's optional properties:
CSTR.InputName = {'T_c', 'C_A_i'};
CSTR.OutputName = {'T', 'C_A'};
CSTR.StateName = {'C_A', 'T'};
CSTR.InputGroup.MV = 1;
CSTR.InputGroup.UD = 2;
CSTR.OutputGroup.MO = 1;
CSTR.OutputGroup.UO = 2;
CSTR
The first three lines specify labels for the input, output and state variables. The next four
specify the signal type for each input and output. The designations MV, UD, MO, and UO
mean manipulated variable, unmeasured disturbance, measured output, and unmeasured
2-12
Construct Linear Time Invariant (LTI) Models
output. (See “Signal Types” on page 2-8 for definitions.) For example, the code specifies
that input 2 of model CSTR is an unmeasured disturbance. The last line causes the LTI
object to be displayed, generating the following lines in the MATLAB Command Window:
a =
C_A
T
C_A
-0.0285
-0.0371
T
-0.0014
-0.1476
b =
C_A
T
T_c
-0.085
0.0802
C_Ai
0.0238
0.4462
c =
T
C_A
C_A
0
1
T
1
0
d =
T
C_A
T_c
0
0
C_Ai
0
0
Input groups:
Name
Channels
MV
1
UD
2
Output groups:
Name
Channels
MO
1
UO
2
Continuous-time model
Input and Output Names
The optional InputName and OutputName properties affect the model displays, as in
the above example. The toolbox also uses the InputName and OutputName properties to
label plots and tables. In that context, the underscore character causes the next character
to be displayed as a subscript.
2-13
2
Building Models
Input and Output Types
General Case
As mentioned in “Signal Types” on page 2-8, Model Predictive Control Toolbox software
supports three input types and two output types. In a Model Predictive Control Toolbox
design, designation of the input and output types determines the controller dimensions
and has other important consequences.
For example, suppose your plant structure were as follows:
Plant Inputs
Plant Outputs
Two manipulated variables (MVs)
Three measured outputs (MOs)
One measured disturbance (MD)
Two unmeasured outputs (UOs)
Two unmeasured disturbances (UDs)
The resulting controller has four inputs (the three MOs and the MD) and two outputs
(the MVs). It includes feedforward compensation for the measured disturbance, and
assumes that you wanted to include the unmeasured disturbances and outputs as part of
the regulator design.
If you didn't want a particular signal to be treated as one of the above types, you could do
one of the following:
• Eliminate the signal before using the model in controller design.
• For an output, designate it as unmeasured, then set its weight to zero (see “Output
Weights”).
• For an input, designate it as an unmeasured disturbance, then define a custom state
estimator that ignores the input (see “Disturbance Modeling and Estimation”).
Note By default, the toolbox assumes that unspecified plant inputs are manipulated
variables, and unspecified outputs are measured. Thus, if you didn't specify signal
types in the above example, the controller would have four inputs (assuming all
plant outputs were measured) and five outputs (assuming all plant inputs were
manipulated variables).
For model CSTR, default Model Predictive Control Toolbox assumptions are incorrect.
You must set its InputGroup and OutputGroup properties, as illustrated in the above
code, or modify the default settings when you load the model into the design tool.
2-14
Construct Linear Time Invariant (LTI) Models
Use setmpcsignals to make type definition. For example
CSTR = setmpcsignals(CSTR, 'UD', 2, 'UO', 2);
sets InputGroup and OutputGroup to the same values as in the previous example. The
CSTR display would then include the following lines:
Input groups:
Name
Unmeasured
Manipulated
Output groups:
Name
Unmeasured
Measured
Channels
2
1
Channels
2
1
Notice that setmpcsignals sets unspecified inputs to Manipulated and unspecified
outputs to Measured.
LTI Model Characteristics
Control System Toolbox software provides functions for analyzing LTI models. Some
of the more commonly used are listed below. Type the example code at the MATLAB
prompt to see how they work for the CSTR example.
Example
Intended Result
dcgain(CSTR)
Calculate gain matrix for the CSTR model's
input/output pairs.
impulse(CSTR)
Graph CSTR model's unit-impulse response.
linearSystemAnalyzer(CSTR)
Open the Linear System Analyzer with the
CSTR model loaded. You can then display
model characteristics by making menu
selections.
pole(CSTR)
Calculate CSTR model's poles (to check
stability, etc.).
step(CSTR)
Graph CSTR model's unit-step response.
2-15
2
Building Models
2-16
Example
Intended Result
zero(CSTR)
Compute CSTR model's transmission zeros.
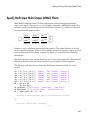
Specify Multi-Input Multi-Output (MIMO) Plants
Specify Multi-Input Multi-Output (MIMO) Plants
Most Model Predictive Control Toolbox applications involve plants having multiple
inputs and outputs. You can use ss, tf, and zpk to represent a MIMO plant model. For
example, consider the following model of a distillation column [11], which has been used
in many advanced control studies:
È 12.8 e-s
Í
È y1 ˘ Í 16.7 s + 1
=
Í ˙ Í
Î y2 ˚
6 .6 e-7 s
Í
Î 10.9 s + 1
- 18 .9 e-3 s
21 .0 s + 1
-19.4 e-3 s
14.4 s + 1
3.8 e-8.1s ˘
˙
14 .9 s + 1 ˙
4 .9e -3.4 s ˙
˙
13 .2 s + 1 ˚
Èu1 ˘
Í ˙
Íu2 ˙
ÍÎu3 ˙˚
Outputs y1 and y2 represent measured product purities. The control objective is to hold
each at specified setpoints. To do so, the controller manipulates inputs u1 and u2, the flow
rates of reflux and reboiler steam, respectively. Input u3 is a measured feed flow rate
disturbance.
The model consists of six transfer functions, one for each input/output pair. Each transfer
function is the first-order-plus-delay form often used by process control engineers.
The following code shows how to define the distillation column model for use in the
toolbox:
g11 = tf( 12.8, [16.7 1], 'IOdelay', 1.0,'TimeUnit','minutes');
g12 = tf(-18.9, [21.0 1], 'IOdelay', 3.0,'TimeUnit','minutes');
g13 = tf( 3.8, [14.9 1], 'IOdelay', 8.1,'TimeUnit','minutes');
g21 = tf( 6.6, [10.9 1], 'IOdelay', 7.0,'TimeUnit','minutes');
g22 = tf(-19.4, [14.4 1], 'IOdelay', 3.0,'TimeUnit','minutes');
g23 = tf( 4.9, [13.2 1], 'IOdelay', 3.4,'TimeUnit','minutes');
DC = [g11 g12 g13
g21 g22 g23];
DC.InputName = {'Reflux Rate', 'Steam Rate', 'Feed Rate'};
DC.OutputName = {'Distillate Purity', 'Bottoms Purity'};
DC = setmpcsignals(DC, 'MD', 3)
-->Assuming unspecified input signals are manipulated variables.
DC =
From input "Reflux Rate" to output...
12.8
2-17
2
Building Models
Distillate Purity:
Bottoms Purity:
exp(-1*s) * ---------16.7 s + 1
6.6
exp(-7*s) * ---------10.9 s + 1
From input "Steam Rate" to output...
-18.9
Distillate Purity: exp(-3*s) * -------21 s + 1
Bottoms Purity:
-19.4
exp(-3*s) * ---------14.4 s + 1
From input "Feed Rate" to output...
Distillate Purity:
Bottoms Purity:
Input groups:
Name
Measured
Manipulated
Output groups:
Name
Measured
3.8
exp(-8.1*s) * ---------14.9 s + 1
4.9
exp(-3.4*s) * ---------13.2 s + 1
Channels
3
1,2
Channels
1,2
Continuous-time transfer function.
The code defines the individual transfer functions, and then forms a matrix in which
each row contains the transfer functions for a particular output, and each column
corresponds to a particular input. The code also sets the signal names and designates the
third input as a measured disturbance.
2-18
CSTR Model
CSTR Model
The linearized model of a continuous stirred-tank reactor (CSTR) involving an
exothermic (heat-generating) reaction is represented by the following differential
equations:[9]
dC¢A
dt
= a11C¢A + a12 T ¢ + b11Tc¢ + b12C¢Ai
dT ¢
= a21C¢A + a22 T ¢ + b21Tc¢ + b22 C¢Ai
dt
where CA is the concentration of a key reactant, T is the temperature in the reactor, Tc is
the coolant temperature, CAi is the reactant concentration in the reactor feed, and aij and
bij are constants. The primes (e.g., C′A) denote a deviation from the nominal steady-state
condition at which the model has been linearized.
Measurement of reactant concentrations is often difficult, if not impossible. Let us
assume that T is a measured output, CA is an unmeasured output, Tc is a manipulated
variable, and CAi is an unmeasured disturbance.
The model fits the general state-space format
dx
= Ax + Bu
dt
y = Cx + Du
where
2-19
2
Building Models
ÈC¢ ˘
È T¢ ˘
È T¢ ˘
x = Í A˙ u= Í c ˙ y = Í ˙ ,
Î T¢ ˚
Î C¢Ai ˚
ÎC¢A ˚
Èa
A = Í 11
Î a21
a12 ˘
b12 ˘
Èb
B = Í 11
˙
˙ C=
a22 ˚
Î b21 b22 ˚
È0 1 ˘
È0 0 ˘
Í1 0 ˙ D = Í0 0 ˙
Î
˚
Î
˚
The following code shows how to define such a model for some specific values of the aij
and bij constants:
A = [-0.0285 -0.0014
-0.0371 -0.1476];
B = [-0.0850
0.0238
0.0802
0.4462];
C = [0 1
1 0];
D = zeros(2,2);
CSTR = ss(A,B,C,D);
The following code sets some of the CSTR model's optional properties:
CSTR.InputName = {'T_c', 'C_A_i'};
CSTR.OutputName = {'T', 'C_A'};
CSTR.StateName = {'C_A', 'T'};
CSTR.InputGroup.MV = 1;
CSTR.InputGroup.UD = 2;
CSTR.OutputGroup.MO = 1;
CSTR.OutputGroup.UO = 2;
To view the properties of CSTR, enter:
CSTR
2-20
Linearize Simulink Models
Linearize Simulink Models
Generally, real systems are nonlinear. To design an MPC controller for a nonlinear
system, you must model the plant in Simulink.
Although an MPC controller can regulate a nonlinear plant, the model used within the
controller must be linear. In other words, the controller employs a linear approximation
of the nonlinear plant. The accuracy of this approximation significantly affects controller
performance.
To obtain such a linear approximation, you linearize the nonlinear plant at a specified
operating point. The Simulink environment provides two ways to accomplish this:
• “Linearization Using MATLAB Code” on page 2-21
• “Linearization Using Linear Analysis Tool in Simulink Control Design” on page
2-24
Note: Simulink Control Design™ software must be installed to linearize nonlinear
Simulink models.
Linearization Using MATLAB Code
This example shows how to obtain a linear model of a plant using a MATLAB script.
For this example the CSTR model, CSTR_OpenLoop, is linearized. The model inputs
are the coolant temperature (manipulated variable of the MPC controller), limiting
reactant concentration in the feed stream, and feed temperature. The model states are
the temperature and concentration of the limiting reactant in the product stream. Both
states are measured and used for feedback control.
Obtain Steady-State Operating Point
The operating point defines the nominal conditions at which you linearize a model. It is
usually a steady-state condition.
Suppose that you plan to operate the CSTR with the output concentration, C_A, at
. The nominal feed concentration is
, and the nominal feed
temperature is 300 K. Create an operating point specification object to define the steadystate conditions.
2-21
2
Building Models
opspec = operspec('CSTR_OpenLoop');
opspec = addoutputspec(opspec,'CSTR_OpenLoop/CSTR',2);
opspec.Outputs(1).Known = true;
opspec.Outputs(1).y = 2;
op1 = findop('CSTR_OpenLoop',opspec);
Operating Point Search Report:
--------------------------------Operating Report for the Model CSTR_OpenLoop.
(Time-Varying Components Evaluated at time t=0)
Operating point specifications were successfully met.
States:
---------(1.) CSTR_OpenLoop/CSTR/C_A
x:
2
dx:
-4.6e-12 (0)
(2.) CSTR_OpenLoop/CSTR/T_K
x:
373
dx:
5.49e-11 (0)
Inputs:
---------(1.) CSTR_OpenLoop/Coolant Temperature
u:
299
[-Inf Inf]
Outputs:
---------(1.) CSTR_OpenLoop/CSTR
y:
2
(2)
The calculated operating point is C_A =
and T_K = 373 K. Notice that the
steady-state coolant temperature is also given as 299 K, which is the nominal value of
the manipulated variable of the MPC controller.
To specify:
• Values of known inputs, use the Input.Known and Input.u fields of opspec
• Initial guesses for state values, use the State.x field of opspec
2-22
Linearize Simulink Models
For example, the following code specifies the coolant temperature as 305 K and initial
guess values of the C_A and T_K states before calculating the steady-state operating
point:
opspec = operspec('CSTR_OpenLoop');
opspec.States(1).x = 1;
opspec.States(2).x = 400;
opspec.Inputs(1).Known = true;
opspec.Inputs(1).u = 305;
op2 = findop('CSTR_OpenLoop',opspec);
Operating Point Search Report:
--------------------------------Operating Report for the Model CSTR_OpenLoop.
(Time-Varying Components Evaluated at time t=0)
Operating point specifications were successfully met.
States:
---------(1.) CSTR_OpenLoop/CSTR/C_A
x:
1.78
dx:
-8.88e-15 (0)
(2.) CSTR_OpenLoop/CSTR/T_K
x:
377
dx:
1.14e-13 (0)
Inputs:
---------(1.) CSTR_OpenLoop/Coolant Temperature
u:
305
Outputs: None
----------
Specify Linearization Inputs and Outputs
If the linearization input and output signals are already defined in the model, as in
CSTR_OpenLoop, then use the following to obtain the signal set.
io = getlinio('CSTR_OpenLoop');
Otherwise, specify the input and output signals as shown here.
2-23
2
Building Models
io(1)
io(2)
io(3)
io(4)
io(5)
=
=
=
=
=
linio('CSTR_OpenLoop/Feed Concentration', 1, 'input');
linio('CSTR_OpenLoop/Feed Temperature',
1, 'input');
linio('CSTR_OpenLoop/Coolant Temperature', 1, 'input');
linio('CSTR_OpenLoop/CSTR', 1, 'output');
linio('CSTR_OpenLoop/CSTR', 2, 'output');
Linearize Model
Linearize the model using the specified operating point, op1, and input/output signals,
io.
sys = linearize('CSTR_OpenLoop', op1, io)
sys =
a =
C_A
-5
47.68
C_A
T_K
T_K
-0.3427
2.785
b =
C_A
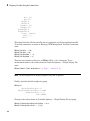
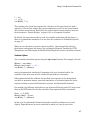
T_K
Feed Concent
1
0
Feed Tempera
0
1
Coolant Temp
0
0.3
c =
CSTR/1
CSTR/2
C_A
0
1
T_K
1
0
d =
CSTR/1
CSTR/2
Feed Concent
0
0
Feed Tempera
0
0
Coolant Temp
0
0
Continuous-time state-space model.
Linearization Using Linear Analysis Tool in Simulink Control Design
This example shows how to linearize a Simulink model using the Linear Analysis Tool,
provided by the Simulink Control Design product.
2-24
Linearize Simulink Models
For this example, the CSTR model, CSTR_OpenLoop, is linearized.
Open Simulink Model
sys = 'CSTR_OpenLoop';
open_system(sys)
Open Linear Analysis Tool
In the Simulink model window, select Analysis > Control Design > Linear Analysis.
Specify Linearization Inputs and Outputs
The linearization inputs and outputs are already specified for CSTR_OpenLoop.
The input signals correspond to the outputs from the Feed Concentration, Feed
Temperature, and Coolant Temperature blocks. The output signals are the inputs to
the CSTR Temperature and Residual Concentration blocks.
2-25
2
Building Models
To specify a signal as a:
• Linearization input, right-click the signal in the Simulink model window and select
Linear Analysis Points > Input Perturbation.
• Linearization output, right-click the signal in the Simulink model window and select
Linear Analysis Points > Output Measurement.
Specify Residual Concentration as Known Trim Constraint
In the Simulink model window, right-click the CA output signal from the CSTR block.
Select Linear Analysis Points > Trim Output Constraint.
In the Linear Analysis Tool, in the Linear Analysis tab, in the Operating Point dropdown list, select Trim model.
In the Outputs tab:
• Select the Known check box for Channel - 1 under CSTR_OpenLoop/CSTR.
• Set the corresponding Value to 2 kmol/m3.
2-26
Linearize Simulink Models
Create and Verify Operating Point
In the Trim the model dialog box, click Start trimming.
The operating point op_trim1 displays in the Linear Analysis Workspace.
Double click op_trim1 to view the resulting operating point.
2-27
2
Building Models
In the Edit dialog box, select the Input tab.
The coolant temperature at steady state is 299 K, as desired.
Linearize Model
In the Linear Analysis tab, in the Operating Point drop-down list, select op_trim1.
Click
Step to linearize the model.
This creates the linear model linsys1 in the Linear Analysis Workspace and
generates a step response for this model. linsys1 uses optrim1 as its operating point.
2-28
Linearize Simulink Models
The step response from feed concentration to output CSTR/2 displays an interesting
inverse response. An examination of the linear model shows that CSTR/2 is the residual
CSTR concentration, C_A. When the feed concentration increases, C_A increases initially
because more reactant is entering, which increases the reaction rate. This rate increase
results in a higher reactor temperature (output CSTR/1), which further increases the
reaction rate and C_A decreases dramatically.
Export Linearization Result
If necessary, you can repeat any of these steps to improve your model performance.
Once you are satisfied with your linearization result, drag and drop it from the Linear
Analysis Workspace to the MATLAB Workspace in the Linear Analysis Tool. You can
now use your linear model to design an MPC controller.
Related Examples
•
“Design Controller Using the Design Tool”
2-29
2
Building Models
2-30
•
“Design Controller in Simulink”
•
“Design Controller at the Command Line”
Identify Plant from Data
Identify Plant from Data
This example shows how to identify a linear plant model using measured data.
When you have measured plant input/output data, you can use System Identification
Toolbox software to estimate a linear plant model. Then, you can use the estimated plant
model to create a model predictive controller.
You can estimate the plant model either programmatically or by using the System
Identification app.
This example requires a System Identification Toolbox license.
Load the measured data.
load dryer2
The variables u2 and y2, which contain the data measured for a temperature-control
application, are loaded into the MATLAB workspace. u2 is the plant input, and y2 is the
plant output. The sampling period for u2 and y2 is 0.08 seconds.
Create an iddata object for the measured data.
Use an iddata object to store the measured values of the plant inputs and outputs,
sampling time, channel names, etc.
Ts = 0.08;
dry_data = iddata(y2,u2,Ts);
dry_data is an iddata object that contains the measured input/output data.
You can optionally assign channel names and units for the input/output signals. To do so,
use the InputName, OutputName, InputUnit and OutputUnit properties of an iddata
object. For example:
dry_data.InputName = 'Power';
dry_data.OutputName = 'Temperature';
Detrend the measured data.
Before estimating the plant model, preprocess the measured data to increase the
accuracy of the estimated model. For this example, u2 and y2 contain constant offsets
that you eliminate.
2-31
2
Building Models
dry_data_detrended = detrend(dry_data);
Estimate a linear plant model.
You can use System Identification Toolbox software to estimate a linear plant model in
one of the following forms:
• State-space model
• Transfer function model
• Polynomial model
• Process model
• Grey-box model
For this example, estimate a third-order, linear state-space plant model using the
detrended data.
plant = ssest(dry_data_detrended,3);
To view the estimated parameters and estimation details, at the MATLAB command
prompt, type plant.
See Also
detrend | iddata | ssest
Related Examples
•
“Identify Linear Models Using System Identification App”
•
“Design Controller for Identified Plant” on page 2-33
•
“Design Controller Using Identified Model with Noise Channel” on page 2-35
More About
2-32
•
“Handling Offsets and Trends in Data”
•
“Working with Impulse-Response Models” on page 2-37
Design Controller for Identified Plant
Design Controller for Identified Plant
This example shows how to design a model predictive controller for a linear identified
plant model.
This example uses only the measured input and output of the identified model for the
model predictive controller plant model.
This example requires a System Identification Toolbox license.
Obtain an identified linear plant model.
load dryer2;
Ts = 0.08;
dry_data = iddata(y2,u2,Ts);
dry_data_detrended = detrend(dry_data);
plant_idss = ssest(dry_data_detrended,3);
plant_idss is a third-order, identified state-space model that contains one measured
input and one unmeasured (noise) input.
Convert the identified plant model to a numeric LTI model.
You can convert the identified model to an ss, tf, or zpk model. For this example,
convert the identified state-space model to a numeric state-space model.
plant_ss = ss(plant_idss);
plant_ss contains the measured input and output of plant_idss. The software
discards the noise input of plant_idss when it creates plant_ss.
Design a model predictive controller for the numeric plant model.
controller = mpc(plant_ss,Ts);
controller is an mpc object. The software treats:
• The measured input of plant_ss as the manipulated variable of controller
• The output of plant_ss as the measured output of the plant for controller
2-33
2
Building Models
To view the structure of the model predictive controller, type controller at the
MATLAB command prompt.
See Also
mpc
Related Examples
•
“Identify Plant from Data” on page 2-31
•
“Design Controller Using Identified Model with Noise Channel” on page 2-35
More About
•
2-34
“About Identified Linear Models”
Design Controller Using Identified Model with Noise Channel
Design Controller Using Identified Model with Noise Channel
This example shows how to design a model predictive controller using an identified plant
model with a nontrivial noise component.
This example requires a System Identification Toolbox license.
Obtain an identified linear plant model.
load dryer2;
Ts = 0.08;
dry_data = iddata(y2,u2,Ts);
dry_data_detrended = detrend(dry_data);
plant_idss = ssest(dry_data_detrended,3);
plant_idss is a third-order, identified state-space model that contains one measured
input and one unmeasured (noise) input.
Design a model predictive controller for the identified plant model.
controller = mpc(plant_idss,Ts);
controller is an mpc object. The software treats:
• The measured input of plant_ss as the manipulated variable of controller
• The unmeasured noise input of plant_ss as the unmeasured disturbance of the plant
for controller
• The output of plant_ss as the measured output of the plant for controller
To view the structure of the model predictive controller, at the MATLAB command
prompt, type controller.
You can change the treatment of a plant input in one of two ways:
• Programmatic — Use the setmpcsignals command to modify the signal .
• Model Predictive Control Toolbox design tool — Use the Input signal properties
table to modify the plant model signal types.
You can also design a model predictive controller using:
plant_ss = ss(plant_idss,'augmented');
controller = mpc(plant_ss,Ts);
2-35
2
Building Models
When you use the 'augmented' input argument, ss creates two input groups,
Measured and Noise, for the measured and noise inputs of plant_idss. mpc handles
the measured and noise components of plant_ss and plant_idss identically.
See Also
mpc
Related Examples
•
“Identify Plant from Data” on page 2-31
•
“Design Controller for Identified Plant” on page 2-33
More About
•
2-36
“About Identified Linear Models”
Working with Impulse-Response Models
Working with Impulse-Response Models
You can use System Identification Toolbox software to estimate finite step-response
or finite impulse-response (FIR) plant models using measured data. Such models, also
known as nonparametric models (see [6] for example), are easy to determine from plant
data ([3] and [7]) and have intuitive appeal.
You use the impulseest function to estimate an FIR model from measured data.
The function returns an identified transfer function model, idtf. To design a model
predictive controller for the plant, you can convert the identified FIR plant model to a
numeric LTI model. However, this conversion usually yields a high-order plant, which
can degrade the controller design. This result is particularly an issue for MIMO systems.
For example, the estimator design can be affected by numerical precision issues with
high-order plants.
Model predictive controllers work best with low-order parametric models (see [5] for
example). Therefore, to design a model predictive controller using measured plant
data, you can use a parametric estimator, such as ssest. Then estimate a low-order
parametric plant model. Alternatively, you can initially identify a nonparametric model
using the data and then estimate a low-order parametric model for the nonparametric
model’s response. (See [10] for an example.)
See Also
impulseest | ssest
Related Examples
•
“Identify Plant from Data” on page 2-31
•
“Design Controller for Identified Plant” on page 2-33
•
“Design Controller Using Identified Model with Noise Channel” on page 2-35
2-37
2
Building Models
Bibliography
[1] Allgower, F., and A. Zheng, Nonlinear Model Predictive Control, Springer-Verlag,
2000.
[2] Camacho, E. F., and C. Bordons, Model Predictive Control, Springer-Verlag, 1999.
[3] Cutler, C., and F. Yocum, “Experience with the DMC inverse for identification,”
Chemical Process Control — CPC IV (Y. Arkun and W. H. Ray, eds.), CACHE,
1991.
[4] Kouvaritakis, B., and M. Cannon, Non-Linear Predictive Control: Theory & Practice,
IEE Publishing, 2001.
[5] Maciejowski, J. M., Predictive Control with Constraints, Pearson Education POD,
2002.
[6] Prett, D., and C. Garcia, Fundamental Process Control, Butterworths, 1988.
[7] Ricker, N. L., “The use of bias least-squares estimators for parameters in discretetime pulse response models,” Ind. Eng. Chem. Res., Vol. 27, pp. 343, 1988.
[8] Rossiter, J. A., Model-Based Predictive Control: A Practical Approach, CRC Press,
2003.
[9] Seborg, D. E., T. F. Edgar, and D. A. Mellichamp, Process Dynamics and Control, 2nd
Edition, Wiley, 2004, pp. 34–36 and 94–95.
[10] Wang, L., P. Gawthrop, C. Chessari, T. Podsiadly, and A. Giles, “Indirect approach
to continuous time system identification of food extruder,” J. Process Control, Vol.
14, Number 6, pp. 603–615, 2004.
[11] Wood, R. K., and M. W. Berry, Chem. Eng. Sci., Vol. 28, pp. 1707, 1973.
2-38
3
Designing Controllers Using the
Design Tool GUI
• “Design Controller Using the Design Tool” on page 3-2
• “Test Controller Robustness” on page 3-48
• “Design Controller for Plant with Delays” on page 3-51
• “Design Controller for Nonsquare Plant” on page 3-58
3
Designing Controllers Using the Design Tool GUI
Design Controller Using the Design Tool
In this section...
“Start the Design Tool” on page 3-2
“Load a Plant Model” on page 3-3
“Navigate Using the Tree View” on page 3-6
“Perform Linear Simulations” on page 3-10
“Customize Response Plots” on page 3-17
“Change Controller Settings” on page 3-23
“Define Soft Output Constraints” on page 3-40
“Save Your Work” on page 3-44
“Load Your Saved Work” on page 3-46
The Model Predictive Control Toolbox design tool is a graphical user interface for
controller design. This GUI is part of the Control and Estimation Tools Manager GUI.
Start the Design Tool
Start the design tool by typing the MATLAB command
mpctool
The Control and Estimation Tools Manager window appears, as shown below. By default,
it contains a Model Predictive Control Toolbox task called MPC Design Task (listed in
the tree view on the left side of the window), which is selected, causing the view shown on
the right to appear.
3-2
Design Controller Using the Design Tool
Model Predictive Control Toolbox Design Tool Initial View
Load a Plant Model
The first step in the design is to load a plant model. Its dimensions and signal
characteristics set the context for the remaining steps. You can either load the model
directly, as described in this section, or indirectly by importing a controller or a saved
design (see “Load Your Saved Work” on page 3-46).
3-3
3
Designing Controllers Using the Design Tool GUI
The following example uses the CSTR model described in “CSTR Model” on page 2-19.
Verify that the LTI object CSTR is in your MATLAB workspace.
Plant Model Importer Dialog Box
In the design tool, click the Import Plant button (see Model Predictive Control Toolbox
Design Tool Initial View). The Plant Model Importer dialog box appears.
Plant Model Importer Dialog Box
The Import from MATLAB workspace option button should be selected by default,
as shown. The Items in your workspace table lists your LTI models. If CSTR doesn't
appear, define it as discussed in “State-Space Models” on page 2-10, then reopen this
dialog box.
After CSTR appears, select it. The Properties list displays the number of inputs and
outputs, their names and signal types, etc.
Click the Import button. This loads CSTR into the design tool. Then click the Close
button (otherwise the dialog box remains visible in case you want to import another
model). The design tool should appear as in Model Predictive Control Toolbox Design
Tool's Signal Definition View.
3-4
Design Controller Using the Design Tool
Model Predictive Control Toolbox Design Tool's Signal Definition View
Signal Property Specifications
The figure's graphical display indicates that you've imported a plant model by showing
the number of inputs and outputs, and the number in each subclass: measured
disturbance, manipulated variables, etc.). Also, the tables labeled Input signal
properties and Output signal properties fill with data:
• The Name entries are from the CSTR model's InputName and OutputName
properties (the design tool assigns defaults if necessary). You can edit these at any
time.
• The Type entries are from the CSTR model's InputGroup and OutputGroup
properties. (The design tool defaults all unspecified inputs to manipulated variables
and all unspecified outputs to measured.)
3-5
3
Designing Controllers Using the Design Tool GUI
Note Once you leave this view, if you subsequently change a signal type, you will have
to restart the design. Be sure the signal types are correct at the beginning.
• The Description and Unit entries are optional. You can enter the values shown in
Model Predictive Control Toolbox Design Tool's Signal Definition View manually. As
you will see, the design tool uses them to label plots and other tables.
• The Nominal entries are initial conditions for simulations. The design tool default is
0.0.
Navigate Using the Tree View
The tree in the left-hand frame of Model Predictive Control Toolbox Design Tool's Signal
Definition View shows that the default MPC Design Task node (see Model Predictive
Control Toolbox Design Tool Initial View) has been renamed CSTRcontrol by clicking
the name, waiting for the usual edit box to appear, typing the new name, and pressing
Enter to finalize the choice.
Model Predictive Control Toolbox Design Tool's Signal Definition View also shows three
new nodes below CSTRcontrol. These activate once you've imported a plant model (or
controller).
In general, clicking a node displays a view supporting a particular design activity.
Project View (Signal Properties Tables)
For example, clicking the project node (CSTRcontrol in Model Predictive Control
Toolbox Design Tool's Signal Definition View) allows you to review and edit the signal
properties tables.
Listing Your Plant Models
Select the Plant models node to list the plant models you've imported, as shown in
Plant Models View with CSTR Model Selected. (Each model name is editable.) The
Model details section displays properties of the selected model. There is also a space to
enter notes describing the model's special features. Buttons allow you to import a new
model or delete one you no longer need.
3-6
Design Controller Using the Design Tool
Plant Models View with CSTR Model Selected
Viewing Your Controllers
Next, select Controllers. The view shown in Controllers View appears. A + sign to the
left of Controllers indicates that it contains subnodes. You can click a + sign to expand
the tree (as shown in Controllers View, where the + sign has changed to a – sign).
3-7
3
Designing Controllers Using the Design Tool GUI
Controllers View
The table at the top of Controllers View lists all the controllers you've defined. The design
tool automatically creates a controller containing Model Predictive Control Toolbox
defaults, naming it MPC1. It is a subnode of Controllers.
Note If you define additional controllers, they will appear here. For example, you might
want to test several options, saving each as a separate controller, making it easy to
switch from one to another during testing.
The table Controllers defined in this project allows you to edit the controller name
and gives you quick access to three important design parameters: Plant Model, Control
Interval, and Prediction Horizon. All are editable, but leave them at their default
values for this example.
3-8
Design Controller Using the Design Tool
The buttons shown in Controllers View let you do the following:
• Import a controller designed previously and stored either in your workspace or in a
MAT-file.
• Export the selected controller to your workspace.
• Create a new controller initialized to Model Predictive Control Toolbox defaults.
• Copy the selected controller, creating a duplicate you can modify.
• Delete the selected controller.
You can also right-click the Controllers node to access menu options New, Import,
and Export, or one of its subnodes to access menu options Copy, Rename, Export, and
Delete.
Select the MPC1 node to display Model Predictive Control Toolbox default controller
settings. (“Change Controller Settings” on page 3-23 covers this view in detail).
Viewing Simulation Scenarios
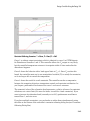
A scenario is a set of conditions defining a simulation. The design tool creates a default
scenario and names it Scenario1. To view it, click the + symbol next to the Scenarios
node, and select the Scenario1 subnode. You should see a view like that shown in CSTR
Temperature Setpoint Change Scenario.
3-9
3
Designing Controllers Using the Design Tool GUI
Scenarios View
Whenever you select the Scenarios node, you see a table summarizing your current
scenarios (not shown). Its function is similar to the Controllers view described
previously.
Perform Linear Simulations
You usually want to test your controller in simulations. The Model Predictive Control
Toolbox design tool makes it easy to run closed-loop simulations involving a Model
Predictive Control Toolbox controller and an LTI plant model. This plant can differ from
that used in the controller design, allowing you to test your controller's sensitivity to
prediction errors (see “Test Controller Robustness” on page 3-48).
This section covers the following topics:
• “Defining Simulation Conditions” on page 3-11
3-10
Design Controller Using the Design Tool
• “Running a Simulation” on page 3-12
• “Open-Loop Simulations” on page 3-15
Defining Simulation Conditions
To define simulation conditions, select an existing scenario node or create a new one, and
then edit its tabular fields to define your conditions.
CSTR Temperature Setpoint Change Scenario shows the result of renaming the default
Scenario1 node to T Setpoint and editing its default conditions. The required editing
steps are as follows:
• Increase Duration from 10 to 30.
• Locate the tabular data defining the reactor temperature setpoint (first row of the
upper table in CSTR Temperature Setpoint Change Scenario).
• Click the Type table cell and select Step from the list of choices.
• Change Size from 1.0 to 2.
• Change Time from 1.0 to 5.
Note The Control Interval is a property of the controller being used (MPC1 in this
case). To change it, select the controller node in the tree, and then edit the value
on the Model and Horizons tab (see “Model and Horizons” on page 3-23).
Such a change would apply to all simulations involving that controller.
3-11
3
Designing Controllers Using the Design Tool GUI
CSTR Temperature Setpoint Change Scenario
Running a Simulation
To run a simulation, do one of the following:
• Select the scenario you want to run, and click its Simulate button (see the bottom of
CSTR Temperature Setpoint Change Scenario).
• Click the toolbar's Simulation button, which is the triangular icon shown on the top
left of CSTR Temperature Setpoint Change Scenario.
The toolbar method runs the current scenario, i.e., the one most recently selected or
modified.
Try running the T Setpoint scenario. This should generate the two response plot
windows shown in Plant Outputs for T Setpoint Scenario with Added Data Markers and
Plant Inputs for the T Setpoint Scenario.
3-12
Design Controller Using the Design Tool
Plant Outputs for T Setpoint Scenario with Added Data Markers
3-13
3
Designing Controllers Using the Design Tool GUI
Plant Inputs for the T Setpoint Scenario
Plant Outputs for T Setpoint Scenario with Added Data Markers shows that the
reactor temperature setpoint increases suddenly by 2 degrees at t = 5, as you specified
when defining the scenario in “Defining Simulation Conditions” on page 3-11.
Unfortunately, the temperature does not track the setpoint very well, and there is a
persistent error of about 1.6 degrees at the end of the simulation.
Also, the controller requests a sudden jump in the coolant temperature (see the upper
graph in Plant Inputs for the T Setpoint Scenario), which might be difficult to deliver
in practice. (The lower graph in Plant Inputs for the T Setpoint Scenario shows that the
feed concentration, CAi, remains constant, as specified in the scenario.)
See “Change Controller Settings” on page 3-23 for ways to overcome these
deficiencies.
Note Plant Outputs for T Setpoint Scenario with Added Data Markers has data markers.
To add these, left-click the curve to create the data marker. Drag a marker to relocate
3-14
Design Controller Using the Design Tool
it. Left-click in a graph's white space to erase its markers. For more information on data
markers, see the Control System Toolbox documentation.
Open-Loop Simulations
By default, scenarios are closed loop, i.e., an active controller adjusts the manipulated
variables entering your plant based on feedback from the plant outputs. You can also run
open-loop simulations that test the plant model without feedback control.
For example, you might want to check your plant model's response to a particular input
without opening another tool. You might also want to display unmeasured disturbance
signals before using them in a closed-loop simulation.
To see how this works, create a new scenario by right-clicking the T Setpoint node
in the tree, and selecting Copy Scenario in the resulting menu. Rename the copy
OpenLoop.
Select OpenLoop in the tree. On its scenario view, change Duration to 100, and turn off
(clear) Close loops.
Open-loop simulations ignore the Setpoints table settings, so there is no need to modify
them.
If CSTR had a measured disturbance input, the pane would contain another table
allowing you to specify it.
For this example, focus on the Unmeasured disturbances table. Configure it as shown
below.
The C_A_i input's nominal value is 0.0 (see Model Predictive Control Toolbox Design
Tool's Signal Definition View), so the above models a sudden increase to 1 at the
beginning of the simulation. The following is an equivalent setup using the Step type.
3-15
3
Designing Controllers Using the Design Tool GUI
Using one of these, simulate the scenario (click its Simulate button). The output
response plot should be as shown below.
This is the CSTR model's open-loop response to a unit step in the CAi disturbance input.
You could also set up the table as shown below.
This simulation would display the open-loop response to a unit step in the Tc
manipulated variable input (try it).
Finally, set it up as follows.
3-16
Design Controller Using the Design Tool
This adds a pulse to the T output. The pulse begins at time t = 10, and lasts 20 time
units. Its height is 0.95 degrees.
Run the simulation. The output response plot displays the pulse (see Response Plot
Showing Open-Loop Pulse Disturbance). In this case, the T output's nominal value is
zero, so you only see the pulse. (If the T output had a nonzero nominal value, the pulse
would add to that.)
Response Plot Showing Open-Loop Pulse Disturbance
If you were to run a closed-loop simulation with this same T disturbance, the controller
would attempt to hold T at its setpoint, and the result would differ from that shown in
Response Plot Showing Open-Loop Pulse Disturbance.
Customize Response Plots
Each time you simulate a scenario, the design tool plots the corresponding plant input
and output responses. The graphic below shows such a response plot for a plant having
two outputs (the corresponding input response plot is not shown).
3-17
3
Designing Controllers Using the Design Tool GUI
By default, each plant signal plots in its own graph area (as shown above). If the
simulation is closed loop, each output signal plot include the corresponding setpoint.
The following sections describe response plot customization options:
• “Data Markers” on page 3-18
• “Displaying Multiple Scenarios” on page 3-20
• “Viewing Selected Variables” on page 3-21
• “Grouping Variables in a Single Plot” on page 3-21
• “Normalizing Response Amplitudes” on page 3-22
Data Markers
You can use data markers to label a curve or to display numerical details.
Adding a Data Marker
To add a data marker, click the desired curve at the location you want to mark. The
following graph shows a marker added to each output response and its corresponding
setpoint.
3-18
Design Controller Using the Design Tool
Data Marker Contents
Each data marker provides information about the selected point, as follows:
• Response – The scenario that generated the curve.
• Time – The time value at the data marker location.
• Amplitude – The signal value at the data marker location.
• Output – The plant variable name (plant outputs only).
• Input – Variable name for plant inputs and setpoints.
Changing a Data Marker's Alignment
To relocate the data marker's label (without moving the marker), right-click the marker,
and select one of the four Alignment menu options. The above example shows three of
the possible four alignment options.
Relocating a Data Marker
To move a marker, left-click it (holding down the mouse key) and drag it along its curve
to the desired location.
Deleting Data Markers
To delete all data markers in a plot, click in the plot's white space.
3-19
3
Designing Controllers Using the Design Tool GUI
To delete a single data marker, right-click it and select the Delete option.
Right-Click Options
Right-click a data marker to use one of the following options:
• Alignment – Relocate the marker's label.
• Font Size – Change the label's font size.
• Movable – On/off option that makes the marker movable or fixed.
• Delete – Deletes the selected marker.
• Interpolation – Interpolate linearly between the curve's data points, or locate at the
nearest data point.
• Track Mode – Changes the way the marker responds when you drag it.
Displaying Multiple Scenarios
By default the response plots include all the scenarios you've simulated. The example
below shows a response plot for a plant with two outputs. The data markers indicate the
two scenarios being plotted: “Accurate Model” and “Perturbed Model”. Both scenarios use
the same setpoints (not marked—the lighter solid lines).
Viewing Selected Scenarios
If your plots are too cluttered, you can hide selected scenarios. To do so:
• Right-click in the plot's white space.
• Select Responses from the resulting context menu.
• Toggle a response on or off using the submenu.
Note This selection affects all variables being plotted.
3-20
Design Controller Using the Design Tool
Revising a Scenario
If you modify and recalculate a scenario, its data are replotted, replacing the original
curves.
Viewing Selected Variables
By default, the design tool plots all plant inputs in a single window, and plots all plant
outputs in another. If your application involves many signals, the plots of each may be
too small to view comfortably.
Therefore, you can control the variables being plotted. To do so, right-click in a plot's
white space and select Channel Selector from the resulting menu. A dialog box
appears, on which you can opt to show or hide each variable.
Grouping Variables in a Single Plot
By default, each variable appears in its own plot area. You can instead choose to display
variables together in a single plot. To do so, right-click in a plot's white space, and select
Channel Grouping, and then select All.
To return to the default mode, use the Channel Grouping: None option.
3-21
3
Designing Controllers Using the Design Tool GUI
Normalizing Response Amplitudes
When you're using the Channel Grouping: All option, you might find that the variables
have very different scales, making it difficult to view them together. You can choose to
normalize the curves, so that each expands or contracts to fill the available plot area.
For example, the plot below shows two plant outputs together (Channel Grouping: All
option). The outputs have very different magnitudes. When plotted together, it's hard to
see much detail in the smaller response.
The plot below shows the normalized version, which displays each curve's variations
clearly.
The y-axis scale is no longer meaningful, however. If you want to know a normalized
signal's amplitude, use a data marker (see “Adding a Data Marker” on page 3-18).
Note that the two data markers on the plot below are at the same normalized y-axis
location, but correspond to very different amplitudes in the original (unnormalized)
coordinates.
3-22
Design Controller Using the Design Tool
Change Controller Settings
The simulations shown in Plant Outputs for T Setpoint Scenario with Added Data
Markers and Plant Inputs for the T Setpoint Scenario uses the default controller
settings. These often work well, but the CSTR application is an exception. The following
discussion covers the main controller options in detail, and shows how to tune a
controller for better performance.
This section covers the following topics:
• “Model and Horizons” on page 3-23
• “Weight Tuning” on page 3-24
• “Blocking” on page 3-29
• “Defining Manipulated Variable Constraints” on page 3-32
• “Disturbance Modeling and Estimation” on page 3-34
Model and Horizons
Select your MPC1 controller in the tree. The view shown in Controller Options — Model
and Horizons Tab should appear. If necessary, click the Model and Horizons tab to
bring it to the front. This tab contains the following controller options:
3-23
3
Designing Controllers Using the Design Tool GUI
• Plant model specifies the LTI model to be used for controller predictions.
• Control interval sets the elapsed time between successive adjustments of the
controller's manipulated variables.
• Prediction horizon is the number of control intervals over which the outputs are to
be optimized.
• Control horizon sets the number of control intervals over which the manipulated
variables are to be optimized.
• Selecting the Blocking option gives you more control over the way in which the
controller's moves are allocated.
Leave all of the Model and Horizons tab settings at their default values for now.
Controller Options — Model and Horizons Tab
Weight Tuning
Click the Weight Tuning tab. The view shown in Controller Options — Weight Tuning
Tab appears.
Make the following changes:
• In the Input weights section, change the coolant temperature's Rate Weight from
the default 0.1 to 0.3.
3-24
Design Controller Using the Design Tool
• In the Output weights section, change the reactant concentration's Weight (last
entry in the second row) from the default 1.0 to 0.
Controller Options — Weight Tuning Tab
Test the changes using the T Setpoint scenario (click the toolbar's Simulation button).
Improved Setpoint Tracking for CSTR Temperature shows that the CSTR temperature
now tracks the setpoint change smoothly, reaching the new value in about 10 time units
with no overshoot.
3-25
3
Designing Controllers Using the Design Tool GUI
Improved Setpoint Tracking for CSTR Temperature
On the other hand, the reactant concentration, CA, exhibits a larger deviation from its
setpoint, which is being held constant at zero (compare to Plant Outputs for T Setpoint
Scenario with Added Data Markers, where the final deviation is about a factor of 4
smaller).
This behavior reflects an unavoidable trade-off. The controller has only one adjustment
at its disposal: the coolant temperature. Therefore, it can't satisfy setpoints on both
outputs.
Output Weights
The output weights let you dictate the accuracy with which each output must track
its setpoint. Specifically, the controller predicts deviations for each output over the
prediction horizon. It multiplies each deviation by the output's weight value, and then
computes the weighted sum of squared deviations, Sy(k), as follows
P
Sy ( k) =
ny
2
  {wy j[rj (k + i) - y j (k + i)]}
i =1 j =1
where k is the current sampling interval, k + i is a future sampling interval (within the
prediction horizon), P is the number of control intervals in the prediction horizon, ny is
3-26
Design Controller Using the Design Tool
the number of plant outputs, wyj is the weight for output j, and the term [rj(k + i) – yj(k +
i)] is a predicted deviation for output j at interval k + 1.
The weights must be zero or positive. If a particular weight is large, deviations for that
output dominate Sy(k). One of the controller's objectives is to minimize Sy(k). Thus, a
large weight on a particular output causes the controller to minimize deviations in that
output (relative to outputs having smaller weights).
For example, the default values used to produce Plant Outputs for T Setpoint Scenario
with Added Data Markers specify equal weights on each output, so the controller is
trying to eliminate deviations in both, which is impossible. On the other hand, the design
of Improved Setpoint Tracking for CSTR Temperature uses a weight of zero on the
second output, so it is able to eliminate deviations in the first output.
Note The second output is unmeasured. Its predictions rely on the plant model and the
temperature measurements. If the model were reliable, we could hold the predicted
concentration at a setpoint, allowing deviations in the reactor temperature instead. In
practice, it would be more common to control the temperature as done here, using the
predicted reactant concentration as an auxiliary indicator.
You might expect equal output weights to result in equal output deviations at steady
state. Plant Outputs for T Setpoint Scenario with Added Data Markers shows that this
is not the case. The reason is that the controller is trying to satisfy several additional
objectives simultaneously.
Rate Weights
One is to minimize the weighted sum of controller adjustments, calculated according to
M n mv
SD u ( k) =
2
  {wDj uDu j (k + i - 1)}
i =1 j =1
where M is the number of intervals in the control horizon, nmv is the number of
manipulated variables, D u j ( k + i - 1) is the predicted adjustment in manipulated
variable j at future (or current) sampling interval k + i – 1, and wDj u is the weight on this
adjustment, called the rate weight because it penalizes the incremental change rather
3-27
3
Designing Controllers Using the Design Tool GUI
than the cumulative value. Increasing this weight forces the controller to make smaller,
more cautious adjustments.
Plant Inputs for Modified Rate Weight
Plant Inputs for Modified Rate Weight shows that increasing the rate weight from 0.1 to
0.3 decreases the move sizes significantly, especially the initial move (compare to Plant
Inputs for the T Setpoint Scenario).
Setting the rate weight to 0.1 yields a faster approach to the T setpoint with a small
overshoot, but the initial Tc move is about six times larger than needed to achieve the
new steady state, which would be unacceptable in most applications (not shown; try it).
Note The controller minimizes the sum Sy(k) + SΔu(k). Changes in the coolant
temperature have unequal effects on the two outputs, so the steady-state output
deviations won't be equal, even when both output weights are unity as in Plant Outputs
for T Setpoint Scenario with Added Data Markers.
Input Weights
The controller also minimizes the weighted sum of manipulated variable deviations from
their nominal values, computed according to
3-28
Design Controller Using the Design Tool
M nmv
Su (k) =
2
  {wuj [u j (k + i - 1) - u j ]}
i =1 j =1
where wuj is the input weight and u j is the nominal value for input j. In the above
simulations, you used the default, wuj = 0. This is the usual choice.
When a sustained disturbance or setpoint change occurs, the manipulated variable must
deviate permanently from its nominal value (as shown in Plant Inputs for the T Setpoint
Scenario and Plant Inputs for Modified Rate Weight). Using a nonzero input weight
forces the corresponding input back toward its nominal value. Test this by running
a simulation in which you set the input weight to 1. The final Tc value is closer to its
nominal value, but this causes T to deviate from the new setpoint (not shown).
Note Some applications involve more manipulated variables than plant outputs. In such
cases, it is common to define nonzero input weights on certain manipulated variables
in order to hold them near their most economical values. The remaining manipulated
variables eliminate steady-state error in the plant outputs.
Blocking
The section “Weight Tuning” on page 3-24 used penalty weights to shape the
controller's response. This section covers the following topics:
• An alternative to penalty weighting, called blocking
• Side-by-side controller comparisons
To begin, select Controllers in the tree, and click the New button, creating a controller
initialized to the Model Predictive Control Toolbox default settings. Rename this
controller Blocking 1 by editing the appropriate table cell.
Select Blocking 1 in the tree, select its Weight Tuning tab, and set the Weight for
output C_A to 0 (see “Weight Tuning” on page 3-24 to review the reason for this).
Leave other weights at their defaults.
Now select the Model and Horizons tab, and select its Blocking check box. This
activates the blocking options. It also deactivates the Control Horizon option (the
blocking options override it).
3-29
3
Designing Controllers Using the Design Tool GUI
Set Number of moves computed per step to 2. Verify that Blocking allocation
within prediction horizon is set to Beginning, the default.
Select Controllers in the tree, and use its Copy button to create two controllers based
on Blocking 1. Rename these Blocking 2 and Blocking 3. Edit their blocking options,
setting Blocking allocation within prediction horizon to Uniform for Blocking 2,
and to End for Blocking 3.
Select Scenarios in the tree. Rename the T Setpoint scenario to T Setpoint 1, and set
its Controller option to Blocking 1.
Create two copies of T Setpoint 1, naming them T Setpoint 2 and T Setpoint 3. Set
their Controller options to Blocking 2 and Blocking 3, respectively. Now you should
have three scenarios, identical except for the controller being used.
Delete the MPC1 controller and select T Setpoint 1 in the tree. Your view should
resemble T Setpoint 1 Scenario, with three controllers and three scenarios in the tree.
T Setpoint 1 Scenario
If any simulation plot windows are open, close them. This forces subsequent simulations
to generate new plots.
3-30
Design Controller Using the Design Tool
Simulate each of the three scenarios. When you run the first, new plot windows open.
Leave them open when you run the other two scenarios so all three results appear
together, as shown in Blocking Comparison, Outputs and Blocking Comparison,
Manipulated Variable.
Blocking Comparison, Outputs
Blocking Comparison, Manipulated Variable
The numeric annotations on these figures refer to the three scenarios. Recall that T
Setpoint 1 uses the default blocking, which usually results in faster setpoint tracking
but larger manipulated variable moves. The blocking options in T Setpoint 2 and T
Setpoint 3 reduce the move size but make setpoint tracking more sluggish.
3-31
3
Designing Controllers Using the Design Tool GUI
Results for T Setpoint 3 are very similar to those shown in Improved Setpoint Tracking
for CSTR Temperature and Plant Inputs for Modified Rate Weight, where a penalty rate
weight reduced the move sizes. If rate weights and blocking achieve the same ends, why
does the toolbox provide both features? One difference not evident in this simple problem
is that blocking applies to all the manipulated variables in your application, but each
rate weight affects one only.
Note To obtain the dashed lines shown for T Setpoint 2, activate the plot window
and select Property Editor from the View menu. The Property Editor appears at the
bottom of the window. Then select the curve you want to edit. The Property Editor lets
you change the line type, thickness, color, and symbol type. Select the axis labels to see
additional options.
By default, the toolbox plots each scenario on the same plot. If you recalculate a revised
scenario, it replots that result but doesn't change any others.
If you don't want to see a particular scenario, right-click the plot and use the Responses
menu option to hide it. (You can also close the plot window and recalculate selected
responses in a fresh window.)
Defining Manipulated Variable Constraints
Physical devices have limited ranges and rates of change. For example, the CSTR model's
coolant might be restricted to a 20 degree range (from –10 to 10) and its maximum rate
of change might be ±4 degrees per control interval. If these are true physical restrictions,
it's good practice to include them in the controller design. Otherwise the controller might
attempt an unrealistic adjustment.
To compare constrained and unconstrained performance for the CSTR example, select the
Blocking 1 controller in the tree, and rename it Unconstrained.
Select its Model and Horizons tab and turn off (clear) its Blocking option. Increase
Control horizon to 3, and reduce Control Interval to 0.25.
Delete the Blocking 2 and Blocking 3 controllers. (Click Yes or OK to dismiss the
resulting warning messages.)
Copy the Unconstrained controller. Name this copy MVconstraints, and select its
Constraints tab. Then enter the manipulated variable constraints shown in Entering
CSTR Manipulated Variable Constraints.
3-32
Design Controller Using the Design Tool
Entering CSTR Manipulated Variable Constraints
If any simulation plot windows are open, close them (to force fresh plots).
Select the T Setpoint 1 scenario. If necessary, set its Controller option to
Unconstrained. Change Duration to 15, and simulate the scenario.
Select the T Setpoint 2 scenario, set its Controller option to MVconstraints, change
its Duration to 15, and simulate it. The results appear in CSTR Outputs, Unconstrained
(1) and MVconstraints (2) and CSTR Manipulated Variable, Unconstrained (1) and
MVconstraints (2).
The larger control horizon and smaller control interval cause the unconstrained
controller to make larger moves (see CSTR Manipulated Variable, Unconstrained (1)
and MVconstraints (2), curve 1). The output settles at the new setpoint in about 5
time units rather than the 10 required previously (compare curve 1 in CSTR Outputs,
Unconstrained (1) and MVconstraints (2) to curve 1 in Blocking Comparison, Outputs).
CSTR Manipulated Variable, Unconstrained (1) and MVconstraints (2) (curve 2) shows
that the Max Up Rate constraint limits the size of the first two moves to 4 degrees.
The third move hits the Maximum constraint at 10 degrees. The coolant temperature
remains saturated at its upper limit for the next 7 control intervals, then slowly moves
back down to its final value.
CSTR Outputs, Unconstrained (1) and MVconstraints (2) (curve 2) shows that the output
response is slower, but still settles at the new setpoint smoothly within about 5 time
units. This demonstrates the anti-windup protection provided automatically by the
Model Predictive Control Toolbox controller.
3-33
3
Designing Controllers Using the Design Tool GUI
CSTR Outputs, Unconstrained (1) and MVconstraints (2)
CSTR Manipulated Variable, Unconstrained (1) and MVconstraints (2)
Disturbance Modeling and Estimation
The previous sections tested the controller's response to setpoint changes. In process
control, disturbances rejection is often more important. The Model Predictive Control
Toolbox product allows you to tailor the controller's disturbance response. The following
example assumes that you have just completed the previous section, and the design tool
is still open.
Select the first controller in the tree and rename it InputSteps. (Its settings should be
identical to the Unconstrained controller of the previous section.)
3-34
Design Controller Using the Design Tool
Copy this controller. Rename the copy OutputSteps. Click its Estimation tab. The
initial view should be as in Default Output Disturbance Settings for CSTR. Note the
following:
• Model Predictive Control Toolbox default settings are being used. (The Use Model
Predictive Control Defaults button restores these settings if you modify them.)
• The Output Disturbances tab is selected, and the Signal-by-signal option is
selected. The graphic shows that the output disturbances add to each output.
• The tabular entries show, however, that these disturbance magnitudes are currently
zero.
Default Output Disturbance Settings for CSTR
Click the Input Disturbances tab. (This would be inactive if the plant model had no
unmeasured disturbances.) The view should change to that shown in Default Input
Disturbance Settings for CSTR.
3-35
3
Designing Controllers Using the Design Tool GUI
Default Input Disturbance Settings for CSTR
In this case the disturbance magnitude is nonzero, and the disturbance type is Steps.
Thus, the controller assumes that disturbances enter as random steps (integrated white
noise) at the plant's unmeasured disturbance input.
Click the Measurement Noise tab, verifying that the controller is assuming white
noise, magnitude 1 (not shown).
The following summarizes Model Predictive Control Toolbox default disturbance
modeling assumptions for this case:
• Additive output disturbances: none
• Unmeasured input disturbances: random steps (integrated white noise)
• Measurement noise: white
3-36
Design Controller Using the Design Tool
In general, if your plant model includes unmeasured disturbance inputs, the toolbox
default strategy will assume that they are dominant and sustained, as in the above
example. This forces the controller to include an integrating mode, intended to eliminate
steady-state error.
If the plant model contains no unmeasured input disturbances, the toolbox assumes
sustained (integrated white noise) disturbances at the measured plant outputs.
If there are more measured outputs than unmeasured input disturbances, it assumes
sustained disturbances in both locations according to an algorithm described in the
product's online documentation.
In any case, the design tool displays the assumptions being used.
To modify the estimation strategy in the OutputSteps controller, do the following:
• Click the Input Disturbances tab. Set the disturbance Type to White, and its
Magnitude to 0.
• Click the Output Disturbances tab. For the T output, set the disturbance Type to
Steps, and its magnitude to 1.
This reverses the default assumptions, i.e., the OutputSteps controller assumes that
sustained disturbances enter at the plant output rather than at the unmeasured
disturbance input. The InputSteps controller is still using the original (default)
assumptions.
Next, select the first scenario in the tree. Rename it Disturbance 1, set its Duration
to 30, define all setpoints as constant zero values, and define a unit-step disturbance in
the unmeasured input, C_A_i. If necessary, set its Controller option to InputSteps .
CSTR Disturbance 1 Scenario shows the final Disturbance 1 scenario.
3-37
3
Designing Controllers Using the Design Tool GUI
CSTR Disturbance 1 Scenario
Copy Disturbance 1. Rename the copy Disturbance 2, and set its Controller option to
OutputSteps.
If necessary, close any open simulation plot windows. Simulate both scenarios. CSTR
Outputs for Disturbance Scenarios 1 and 2 and CSTR Inputs for Disturbance Scenarios 1
and 2 show the results.
CSTR Outputs for Disturbance Scenarios 1 and 2 shows that default controller (case 1)
returns to the setpoint in less than one third the time required by the modified controller
(case 2). Its maximum deviation from the setpoint is also 10% smaller. CSTR Inputs for
Disturbance Scenarios 1 and 2 shows that in both cases the input moves are smooth and
of reasonable magnitude. (It also shows the input disturbance.)
3-38
Design Controller Using the Design Tool
The default controller expects unmeasured disturbances to enter as defined in the
scenarios, so it's not surprising that the default controller performs better. The point is
that the difference can be large, so it merits design consideration.
CSTR Outputs for Disturbance Scenarios 1 and 2
CSTR Inputs for Disturbance Scenarios 1 and 2
3-39
3
Designing Controllers Using the Design Tool GUI
For comparison, reset the two scenarios so that the only disturbance is a one-degree step
increase added to the measured reactor temperature. The modified controller (case 2) is
designed for such disturbances, and CSTR Outputs, Output Disturbance Scenarios 1 and
2 shows that it performs better, but the difference is less dramatic than in the previous
scenario. The default controller is likely to be best if the real process has multiple
dominant disturbance sources.
CSTR Outputs, Output Disturbance Scenarios 1 and 2
Define Soft Output Constraints
The discussion in “Weight Tuning” on page 3-24, defined temperature control as
the primary goal for the CSTR application. The predicted (but unmeasured) reactant
concentration, CA, could vary freely.
Suppose this were acceptable provided that CA stayed below a specified maximum (above
which unwanted reactions would occur). You can use an output constraint to enforce this
specification.
Start with a single controller identical to the InputSteps controller described in
“Disturbance Modeling and Estimation” on page 3-34. Rename it Unconstrained.
Right-click Unconstrained in the tree and select Copy. Rename the copy Yhard. Make
another copy, naming it Ysoft.
3-40
Design Controller Using the Design Tool
Similarly, start with a single scenario identical to CSTR Disturbance 1 Scenario, except
that its Controller setting should be Unconstrained. Name this scenario None.
Right-click None in the tree and select Copy. Rename the copy Hard, and change
its Controller setting to Yhard. Make another copy, naming it Soft and changing its
Controller setting to Ysoft. Your tree should be as shown below.
Select your Yhard controller. On the Constraints tab, set the maximum for CA to 3 as
shown below.
Click the Constraint Softening button to open the dialog box in Constraint Softening
Dialog Box. The Input constraints section shows the bounds on the inputs and their
rates, and relaxation bands, which let you soften these constraints. By default, input
constraints are hard, meaning that the controller tries to prevent any violation.
3-41
3
Designing Controllers Using the Design Tool GUI
Constraint Softening Dialog Box
The Output constraints section lists the output limits and their relaxation bands. By
default, the output constraints are soft. Make the CA upper limit hard by entering a zero
as its relaxation band (as in Constraint Softening Dialog Box).
Select the Ysoft controller. Define a soft upper bound on CA by using the same settings
shown in Constraint Softening Dialog Box, but with a relaxation band of 100 instead of 0.
Simulate the three scenarios in the order they appear in the tree, i.e., None, Hard, Soft.
The resulting output responses appear in Constraint Softening Scenarios: 1 = None, 2 =
Hard, 3 = Soft.
3-42
Design Controller Using the Design Tool
Constraint Softening Scenarios: 1 = None, 2 = Hard, 3 = Soft
Curve 1 is without output constraints, which is identical to curve 1 in CSTR Outputs
for Disturbance Scenarios 1 and 2. This controller allows the CA output to vary freely,
but the controlled temperature returns to its setpoint within 10 time units after the
disturbance happens.
Curve 2 shows the behavior with a hard upper limit at CA = 3. Once CA reaches this
bound, the controller must use its one manipulated variable (Tc) to satisfy the constraint,
so it's no longer able to control the temperature.
Curve 3 shows the result for a soft constraint. The controller reaches a compromise
between the competing objectives: temperature control and constraint satisfaction. As
you'd expect, performance lies between the curve 1 and curve 2 extremes.
The numerical value of the relaxation band represents a relative tolerance for constraint
violations, not a strict limit (if it were the latter, it would be a hard constraint). If you
were to increase its relaxation band (currently set at 100), performance would move
toward Case 1, and vice versa.
If you have multiple constraints, you can harden or soften them simultaneously using
the slider at the bottom of the controller's constraint softening dialog box (see Constraint
Softening Dialog Box).
3-43
3
Designing Controllers Using the Design Tool GUI
In general, you'll have to experiment to determine the settings that provide appropriate
trade-offs for your application. In particular, the relaxation band settings interact with
those on the controller's Weight Tuning tab (see “Weight Tuning” on page 3-24).
Another important factor is the expected numerical range for each variable. For example,
if a particular variable stays within ±0.1 of its nominal value, it should have a small
relaxation band relative to another variable having a range of ±100.
For details on the Model Predictive Control Toolbox constraint softening formulation, see
“Optimization Problem”.
Save Your Work
You'll usually want to save your design so you can reuse or revise it. You can save
individual controllers or an entire project.
When you close the design tool, you'll be prompted to save new or modified designs. You
can also save manually to preserve an intermediate state or guard against an unexpected
shutdown.
This section covers the following topics:
• “Exporting a Controller” on page 3-44
• “Saving a Project” on page 3-45
Exporting a Controller
To save a controller, export it to your MATLAB workspace or to a MAT-file. The former
allows you to use the exported controller in command-line functions or a Simulink block.
Note Your workspace disappears when you exit MATLAB. A MAT-file is permanent, and
you can reload it in a subsequent MATLAB session.
The following example assumes that the design tool is open and in the state described
in the previous section. Suppose you want to export the controller to your workspace.
Expand the tree if necessary, right-click MPC2, and select Export Controller from the
resulting menu. The following dialog box appears.
3-44
Design Controller Using the Design Tool
The default behavior is to export the selected controller to the workspace. Click Export
to confirm. You can verify the export by typing
whos
at the MATLAB prompt. The resulting list should include an mpc object named MPC2.
Type
MPC2
to display the object's properties.
Saving a Project
To save your entire project, click the toolbar's Save button.
The following dialog box appears.
3-45
3
Designing Controllers Using the Design Tool GUI
Dialog Box for Saving a Controller Design Project
The default behavior saves the current project (named Project - CSTR_MPC in this
case) in a MAT-file (called CSTR_MPC here). If the design tool had contained other
projects, they would appear in the list, and you could select the ones you wanted to save.
The MAT-file will be saved in the default folder. To verify the location, click the Browse
(...) button and change the folder if necessary. When ready to save, click OK.
Load Your Saved Work
The following assumes that you've saved a project as described in the previous section. To
reload this project, close the design tool if it's open. Also clear any mpc objects from your
workspace. (Type whos at the MATLAB prompt for a list of objects.) For example, if MPC1
and MPC2 are in your workspace, type
clear MPC1 MPC2
to clear (remove) them.
If you've closed the CSTR_MPC model, open it. Double-click the MPC Controller block to
open its mask, and verify that the MPC Controller parameter is set to MPC2.
Note If you were to attempt to run the CSTR_MPC model at this stage, an error dialog box
would indicate that the MPC Controller block was unable to initialize. The MPC2 object
specified in the block mask must be loaded into your workspace or be part of an active
design tool task.
3-46
Design Controller Using the Design Tool
You could define the required MPC2 object in one of the following ways:
• Import MPC2 from a MAT-file (assuming you had saved it as explained in “Exporting a
Controller” on page 3-44).
• Load the model's project file, which contains a copy of MPC2.
To use the second approach, open the design tool by typing
mpctool
in the MATLAB Command Window. This creates a blank Model Predictive Control
Toolbox project called MPC Design Task. Click Load on the toolbar.
This opens a dialog box similar to that shown in Dialog Box for Saving a Controller
Design Project. Use it to select the project file you've saved, and then click OK to load the
project. It should appear in the tree. Verify that it contains a controller named MPC2.
Run the CSTR_MPC model in Simulink. The block mask automatically retrieves MPC2
from the design tool, and the simulation runs. In other words, loading the project
automatically restores the link between the design tool and the MPC Controller block.
3-47
3
Designing Controllers Using the Design Tool GUI
Test Controller Robustness
It's good practice to test your controller's sensitivity to prediction errors. Classical phase
and gain margins are one way to quantify robustness for a SISO application. Robust
Control Toolbox™ software provides sophisticated approaches for MIMO systems. It
can also be helpful to run simulations. The following example illustrates the simulation
approach.
Plant Model Perturbation
Create a perturbed version of a model.
For this example, use the nonlinear CSTR model discussed in “CSTR Model”.
CSTRp = CSTR;
CSTRp.a=[-0.0303
-0.0569
CSTRp.b=[-0.0857
0.1393
-0.0113
-0.1836];
0.0191
0.4241];
This creates a copy of CSTR called CSTRp, then replaces the state space A and B matrices
with perturbed versions (compare to the originals defined in “State-Space Models” on
page 2-10). Use the following command to compare the two step responses:
step(CSTR, CSTRp)
Observe the difference in the responses (not shown).
Select Plant models in the tree. Click the Import button and import the CSTRp model.
Simulation Tests
Delete all controllers except the first one in the tree. If necessary, make its settings
identical to Unconstrained (see “Defining Manipulated Variable Constraints” on page
3-32).
Delete all scenarios except the first, naming that Accurate Model. Define its properties
as shown in Robustness Test, Accurate Plant Model Scenario. The scenario begins
with a step change in the temperature setpoint, followed 25 time units later by a step
disturbance in the reactant entering the CSTR.
3-48
Test Controller Robustness
Copy Accurate Model. Rename the copy Perturbed Model, and set its Plant option to
CSTRp. Thus, both scenarios use the same controller, which is based on the CSTR model,
but the Perturbed Model scenario uses a different model to represent the “real” plant.
This tests the controller's robustness to a change in plant parameters.
Robustness Test, Accurate Plant Model Scenario
Simulate the two scenarios. Robustness Test, Accurate Model (1) and Perturbed Model
(2) shows the output responses. As expected, setpoint tracking degrades when the model
is inaccurate, but performance is still acceptable.
The disturbance rejection appears to improve with the perturbed model. This is a
consequence of the perturbations used. The gain for the T/CAi output/input pair is about
15% smaller in the CSTRp model, which has two beneficial effects: the actual impact of
the disturbance is reduced, and the controller is aggressive because it expects a larger
impact.
3-49
3
Designing Controllers Using the Design Tool GUI
Robustness Test, Accurate Model (1) and Perturbed Model (2)
Note MIMO applications are usually more sensitive to model error than SISO
applications, so robustness testing is especially recommended for MIMO cases.
3-50
Design Controller for Plant with Delays
Design Controller for Plant with Delays
This example shows how to design an MPC controller for a plant with delays.
The Model Predictive Control Toolbox can handle models that include delays. A typical
example is the distillation column model, which includes a delay in each input/output
channel. The presence of delays influences controller performance, and your controller
specifications should account for them.
Create the distillation column plant model.
g11 = tf( 12.8, [16.7 1], 'IOdelay', 1.0,'TimeUnit','minutes');
g12 = tf(-18.9, [21.0 1], 'IOdelay', 3.0,'TimeUnit','minutes');
g13 = tf( 3.8, [14.9 1], 'IOdelay', 8.1,'TimeUnit','minutes');
g21 = tf( 6.6, [10.9 1], 'IOdelay', 7.0,'TimeUnit','minutes');
g22 = tf(-19.4, [14.4 1], 'IOdelay', 3.0,'TimeUnit','minutes');
g23 = tf( 4.9, [13.2 1], 'IOdelay', 3.4,'TimeUnit','minutes');
DC = [g11 g12 g13
g21 g22 g23];
DC.InputName = {'Reflux Rate', 'Steam Rate', 'Feed Rate'};
DC.OutputName = {'Distillate Purity', 'Bottoms Purity'};
DC = setmpcsignals(DC, 'MD', 3);
The largest ioDelay of the DC model delay is 8.1 minutes.
Open the Model Predictive Control Toolbox design tool.
mpctool
Click Import Plant and import the DC model into the tool.
In the tree, select MPC Design Task > Controllers > MPC1.
3-51
3
Designing Controllers Using the Design Tool GUI
It is good practice to specify the prediction and control horizons such that
P - M ? td,max / Dt
Here, P is the prediction horizon, M is the control horizon, td,max is the maximum delay,
and Δt is the control interval. In the Control interval (time units) box, which specifies
Δt, enter 1. Then, because the maximum ioDelay for the DC model is 8.1 minutes, td,max/
Δt is 8.1. You can satisfy the inequality by setting P = 30 and M = 5. In the Prediction
horizon (intervals) box, enter 30, and in the Control horizon (intervals) box, enter
5.
Now that you have specified the controller horizons, simulate the model to test the
controller performance. In the tree, select Scenarios > Scenario1.
3-52
Design Controller for Plant with Delays
Specify the simulation settings as follows:
• In the Duration box, enter 50.
• In the Setpoints table, for the Distillate Purity setpoint, enter 1 in the Initial
Value box.
• In the Setpoints table, for the Bottoms Purity setpoint, from the Type list, select
Step. In the Time box, enter 25.
Click Simulate.
3-53
3
Designing Controllers Using the Design Tool GUI
The plant outputs plot shows that the first output does not respond for the first minute,
which corresponds to the delay from the first input. The first output reaches the setpoint
in two minutes and settles quickly. Similarly, the second output does respond for three
minutes, which corresponds to the delay from the second input, and settles rapidly
afterwards. Changing the setpoint for the Bottoms Purity output disturbs the Distillate
Purity output, but the magnitude of this interaction is less than 10%.
3-54
Design Controller for Plant with Delays
The plant inputs plot shows that the initial input moves are more than five times
the final change. Also, there are periodic pulses in the control action as the controller
attempts to counteract the delayed effects of each input on the two outputs.
You can moderate these effects by tuning the controller weights or by specifying a custom
blocking strategy. For this example, use the latter approach. In the tree, select MPC
Design Task > Controllers > MPC1. Select the Blocking check box.
In the Blocking section:
• From the Blocking allocation within prediction horizon list, select Custom
• In the Custom move allocation vector, enter [5 5 5 5 10]
3-55
3
Designing Controllers Using the Design Tool GUI
In the tree, select Scenarios > Scenario1.
Click Simulate.
3-56
Design Controller for Plant with Delays
The initial input moves are much smaller and the moves are less oscillatory. The tradeoff is a slower output response, with about 20% interaction between the outputs.
Related Examples
•
“Specify Multi-Input Multi-Output (MIMO) Plants” on page 2-17
3-57
3
Designing Controllers Using the Design Tool GUI
Design Controller for Nonsquare Plant
A nonsquare plant has an unequal number of manipulated variables and output
variables. This is common in practice, and the Model Predictive Control Toolbox software
supports an excess of manipulated variables or outputs. In such cases you will usually
need to modify default toolbox settings.
This section covers the following topics:
• “More Outputs Than Manipulated Variables” on page 3-58
• “More Manipulated Variables Than Outputs” on page 3-59
More Outputs Than Manipulated Variables
When there are excess outputs, you can't hold each at a setpoint. You have the following
options:
• Enforce setpoints on all outputs, in which case all will deviate from their setpoints to
some extent.
• Specify that certain outputs need not be held at setpoints by setting their weights to
zero on the controller's Weight Tuning tab.
The initial test of the CSTR controller used option 1 (the default), which caused both
outputs to deviate from their setpoints (see Plant Outputs for T Setpoint Scenario with
Added Data Markers). You can adjust the offset in each output by changing the output
weights. Increasing an output weight decreases the offset in that output (at the expense
of increased offset in other outputs).
The modified CSTR controller used option 2 (see the discussion in “Weight Tuning”
on page 3-24). In general, if the application has Ne more outputs than manipulated
variables, setting Ne output weights to zero should allow the remaining outputs to
be held at setpoints (unless the manipulated variables are constrained). This was
the case for the modified CSTR controller (see Improved Setpoint Tracking for CSTR
Temperature).
Outputs that have been “sacrificed” by setting their weights to zero can still be useful. If
measured, they can help the controller to estimate the plant's state, thereby improving
its predictions. They can also be used as indicators, or as variables to be held within an
operating region defined by output constraints.
3-58
Design Controller for Nonsquare Plant
More Manipulated Variables Than Outputs
In this situation, default Model Predictive Control Toolbox settings should provide offsetfree output-setpoint tracking, but the manipulated variables are likely to drift.
One way to avoid this is to use manipulated variable setpoints. If there are Ne excess
manipulated variables and you hold Ne of them at target values, the rest should not drift.
Rather, they will attain the values needed to eliminate output offset.
To define a manipulated variable setpoint:
1
Enter the setpoint value in the Nominal field in the signal properties view – see
Model Predictive Control Toolbox Design Tool's Signal Definition View.
2
Assign a nonzero input weight using the Weight entry on the controller's Weight
Tuning tab – see Controller Options — Weight Tuning Tab.
In step 2, the magnitude of the input weight determines the extent to which the
manipulated variable can deviate from its target during a transient. See “Input Weights”
on page 3-28 for more discussion and mathematical details.
You might want to allow such deviations temporarily in order to provide better output
setpoint tracking. In that case, use a relatively small input weight. If you want the
manipulated variable to stay near its target value at all times, increase its input weight.
Another way to avoid drift is to constrain one or more manipulated variables to a narrow
operating region. You can even hold an MV constant by setting its lower and upper
bounds to the same value (in which case its nominal value should also be set to this
value), or by setting both of its rate constraints to zero. To define constraints, use the
controller's Constraints tab (see “Defining Manipulated Variable Constraints” on page
3-32).
3-59
4
Designing Controllers Using the
Command Line
• “Design Controller at the Command Line” on page 4-2
• “Simulate Controller with Nonlinear Plant” on page 4-9
• “Control Based On Multiple Plant Models” on page 4-15
• “Compute Steady-State Gain” on page 4-24
• “Extract Controller” on page 4-25
• “Bibliography” on page 4-26
• “Signal Previewing” on page 4-27
• “Run-Time Constraint Updating” on page 4-28
• “Run-Time Weight Tuning” on page 4-29
4
Designing Controllers Using the Command Line
Design Controller at the Command Line
In this section...
“Create a Controller Object” on page 4-2
“View and Alter Controller Properties” on page 4-3
“Review Controller Design” on page 4-5
“Perform Linear Simulations” on page 4-6
“Save Calculated Results” on page 4-8
“Design Controller Using the Design Tool” on page 3-2 shows how to use the Model
Predictive Control Toolbox design tool to create a controller and test it. You might prefer
to use functions instead. They allow access to options not available in the design tool, as
well as automation of repetitive tasks using scripts and customized plotting.
Create a Controller Object
This topic uses the CSTR model described in “CSTR Model” on page 2-19 as an example.
You must have the linear plant model CSTR in the base workspace before beginning this
tutorial.
Use the mpc function to create a controller. For example, type
Ts = 1;
MPCobj = mpc(CSTR,Ts);
to create one based on the CSTR model with a control interval of 1 time unit and all other
parameters at their default values.
Note MPCobj is an MPC object. It contains a complete controller definition for use with
Model Predictive Control Toolbox software.
To display the controller's properties in the Command Window, type
display(MPCobj)
or type the object's name without a trailing semicolon.
4-2
Design Controller at the Command Line
View and Alter Controller Properties
Once you've defined an MPC object, it's easy to alter its properties. For a description of
the editable properties, type:
mpcprops
To display the list of properties and their current values, type
get(MPCobj)
ManipulatedVariables (MV):
OutputVariables (OV):
DisturbanceVariables (DV):
Weights (W):
Model:
Ts:
Optimizer:
PredictionHorizon (P):
ControlHorizon:
History:
Notes:
UserData:
[1x1 struct]
[1x2 struct]
[1x1 struct]
[1x1 struct]
[1x1 struct]
1
[1x1 struct]
10
2
[2e+003 7 21 20 18 20.1]
{}
[]
(Your History entry will differ.) To alter one of these properties, you can use the syntax
ObjName.PropName = value;
where ObjName is the object name, and PropName is the property you want to set. For
example, to change the prediction horizon from 10 (the default) to 15, type:
MPCobj.P = 15;
Note You can abbreviate property names provided that the abbreviation is unambiguous.
As shown above, many of the properties are MATLAB structures containing additional
properties. For example, type
MPCobj.MV
4-3
4
Designing Controllers Using the Command Line
Min:
Max:
MinECR:
MaxECR:
RateMin:
RateMax:
RateMinECR:
RateMaxECR:
Target:
Name:
Units:
-Inf
Inf
0
0
-Inf
Inf
0
0
'nominal'
'T_c'
''
This shows that the default controller has no constraints on the manipulated variable.
To include constraints as shown in Entering CSTR Manipulated Variable Constraints,
enter:
MPCobj.MV.Min = -10;
MPCobj.MV.Max = 10;
MPCobj.MV.RateMin = -4;
MPCobj.MV.RateMax = 4;
There are two outputs in this case, so MPCobj.OV is a 1-by-2 structure. To set
measurement units to the values shown in Controller Options — Weight Tuning Tab,
enter:
MPCobj.Model.Plant.OutputUnit = {'Deg C','kmol/m^3'};
Note The unit properties for display purposes only and is optional.
Finally, check the default weights by typing
MPCobj.W
ManipulatedVariables:
ManipulatedVariablesRate:
OutputVariables:
ECR:
0
0.1000
[1 1]
100000
Change to the values shown in Controller Options — Weight Tuning Tab by typing:
MPCobj.W.ManipulatedVariablesRate = 0.3;
MPCobj.W.OutputVariables = [1 0];
4-4
Design Controller at the Command Line
You can also specify time-varying weights and constraints. The time-varying weights and
constraints are defined for the prediction horizon, which shifts at each time step. This
implies that as long as the property is not changed, the set of time-varying parameters is
the same at each time step. To learn how to specify time-varying constraints and weights
in the GUI, see “Constraints Tab” and “Weight Tuning Tab”.
The time-varying weights modify the tuning of the unconstrained controller response.
To specify a different weight for each step in the prediction horizon, modify the
Weightproperty. For example,
MPCobj.W.OutputVariables = [0.1 0;0.2 0;0.5 0;1 0];
deemphasizes setpoint tracking errors early in the prediction horizon. The default weight
of 1 is used for the fourth step and beyond.
Constraints can also be time varying. The time-varying constraints have a nonlinear
effect when they are active. For example,
MPCobj.MV.RateMin = [-4;-3.5;-3;-2.5];
MPCobj.MV.RateMax = [4;3.5;3;2.5];
forces MV to change more and more slowly along the prediction horizon. The constraint of
-2.5 and 2.5 is used for the fourth step and beyond.
You could also alter the controller's disturbance rejection characteristics using functions
that parallel the design tool's disturbance modeling options (described in “Disturbance
Modeling and Estimation” on page 3-34). See the reference pages for the setEstimator,
setindist, and setoutdist functions.
Review Controller Design
Use the review command to examine the potential controller stability and performance
issues at runtime. review generates a report on the results of the tests it performs.
review(MPCobj)
4-5
4
Designing Controllers Using the Command Line
In this example, the review command found two potential issues in this design. The
first warning asks whether the user intends to have zero weight on the C_A output. The
second warning asks the user to avoid having hard constraints on both MV and MVRate.
Perform Linear Simulations
To run a linear simulation, use the sim function. For example, given the MPCobj
controller defined in the previous section, type:
4-6
Design Controller at the Command Line
T = 26;
r = [2 0];
sim(MPCobj,T,r);
This simulates the closed-loop response for a duration of 26 control intervals with a
setpoint of 2 for the first output (the reactor temperature) and 0 for the second output
(the residual concentration). Recall that the second output's tuning weight is zero (see
the discussion in “Output Weights” on page 3-26), so its setpoint is ignored.
By default, the same linear model is used for controller predictions and the plant, i.e.,
there is no plant/model mismatch. You can alter this as shown in “Simulation Options”
on page 4-7.
When you use the above syntax (no output variables), sim automatically plots the
plant inputs and outputs (not shown, but see Improved Setpoint Tracking for CSTR
Temperature and Plant Inputs for Modified Rate Weight for results of a similar scenario).
Simulation Options
You can modify simulation options using the mpcsimopt function. For example, the code
MPCopts = mpcsimopt;
MPCopts.Constraints = 'off';
sim(MPCobj,T,r,MPCopts)
runs an unconstrained simulation. Comparing to the case described earlier, the
controller's first move now exceeds 4 units (the specified rate constraint).
Other options include the addition of a specified noise sequence to the manipulated
variables or measured outputs, open-loop simulations, a look-ahead option for better
setpoint tracking or measured disturbance rejection, and plant/model mismatch.
For example, the following code defines a new plant model having gains 50% larger than
those in the CSTR model used in the controller, then repeats the above simulation:
Plant = 1.5*CSTR;
MPCopts.Model = Plant;
sim(MPCobj,T,r,MPCopts)
In this case, the plant/model mismatch degrades controller performance, but only
slightly. Degradation can be severe and must be tested on a case-by-case basis.
4-7
4
Designing Controllers Using the Command Line
Save Calculated Results
If you'd like to save simulation results in your workspace, use the following sim function
format:
[y,t,u] = sim(MPCobj,T,r);
This suppresses automatic plotting, instead creating variables y, t, and u, which hold the
computed outputs, time, and inputs, respectively. A typical use is to create customized
plots. For example, to plot both outputs on the same axis versus time, you could type:
plot(t,y)
4-8
Simulate Controller with Nonlinear Plant
Simulate Controller with Nonlinear Plant
You can use sim to simulate a closed-loop system consisting of a linear plant model and
an MPC controller.
If your plant is a nonlinear Simulink model, you must linearize the plant (see
“Linearization Using Linear Analysis Tool in Simulink Control Design”) and design a
controller for the linear model (see “Design Controller in Simulink”). To simulate the
system, specify the controller in the MPC block parameter MPC Controller field and
run the closed-loop Simulink model.
Alternatively, your nonlinear model might be a MEX-file, or you might want to include
features unavailable in the MPC block, such as a custom state estimator. The mpcmove
function is the Model Predictive Control Toolbox computational engine, and you can use
it in such cases. The disadvantage is that you must duplicate the infrastructure that the
sim function and the MPC block provide automatically.
The rest of this section covers the following topics:
• “Nonlinear CSTR Application” on page 4-9
• “Example Code for Successive Linearization” on page 4-10
• “CSTR Results and Discussion” on page 4-12
Nonlinear CSTR Application
The CSTR model described in “Linearize Simulink Models” on page 2-21 is a strongly
nonlinear system. As shown in “Design Controller in Simulink”, a controller can regulate
this plant, but degrades (and might even become unstable) if the operating point changes
significantly.
The objective of this example is to redefine the predictive controller at the beginning of
each control interval so that its predictive model, though linear, represents the latest
plant conditions as accurately as possible. This will be done by linearizing the nonlinear
model repeatedly, allowing the controller to adapt as plant conditions change. See
references [1] and [2] for more details on this approach.
4-9
4
Designing Controllers Using the Command Line
Example Code for Successive Linearization
In the following code, the simulation begins at the CSTR model's nominal operating point
(concentration = 8.57) and moves to a lower point (concentration = 2) where the reaction
rate is much higher. The required code is as follows:
[sys, xp] = CSTR_INOUT([],[],[],'sizes');
up = [10 298.15 298.15];
u = up(3);
tsave = []; usave = []; ysave = []; rsave = [];
Ts = 1;
t = 0;
while t < 40
yp = xp;
% Linearize the plant model at the current conditions
[a,b,c,d]=linmod('CSTR_INOUT', xp, up );
Plant = ss(a,b,c,d);
Plant.InputGroup.ManipulatedVariables = 3;
Plant.InputGroup.UnmeasuredDisturbances = [1 2];
Model.Plant = Plant;
% Set nominal conditions to the latest values
Model.Nominal.U = [0 0 u];
Model.Nominal.X = xp;
Model.Nominal.Y = yp;
dt = 0.001;
simOptions.StartTime = num2str(t);
simOptions.StopTime = num2str(t+dt);
simOptions.LoadInitialState = 'on';
simOptions.InitialState = 'xp';
simOptions.SaveTime = 'on';
simOptions.SaveState = 'on';
simOptions.LoadExternalInput = 'on';
simOptions.ExternalInput = '[t up; t+dt up]';
simOut = sim('CSTR_INOUT',simOptions);
T = simOut.get('tout');
XP = simOut.get('xout');
YP = simOut.get('yout');
Model.Nominal.DX = (1/dt)*(XP(end,:)' - xp(:));
4-10
Simulate Controller with Nonlinear Plant
% Define MPC Toolbox controller for the latest model
MPCobj = mpc(Model, Ts);
MPCobj.W.Output = [0 1];
% Ramp the setpoint
r = max([8.57 - 0.25*t, 2]);
% Compute the control action
if t <= 0
xd = [0; 0];
x = mpcstate(MPCobj, xp, xd, [], u);
end
u = mpcmove(MPCobj, x, yp, [0 r], []);
% Simulate the plant for one control interval
up(3) = u;
simOptions.StartTime = num2str(t);
simOptions.StopTime = num2str(t+Ts);
simOptions.InitialState = 'xp';
simOptions.ExternalInput = '[t up; t+Ts up]';
simOut = sim('CSTR_INOUT',simOptions);
T = simOut.get('tout');
XP = simOut.get('xout');
YP = simOut.get('yout');
% Save results for plotting
tsave = [tsave; T];
ysave = [ysave; YP];
usave = [usave; up(ones(length(T),1),:)];
rsave = [rsave; r(ones(length(T),1),:)];
xp = XP(end,:)';
t = t + Ts;
end
figure(1)
plot(tsave,[ysave(:,2) rsave])
title('Residual Concentration')
4-11
4
Designing Controllers Using the Command Line
figure(2)
plot(tsave,usave(:,3));
title('Coolant Temperature')
CSTR Results and Discussion
The plotted results appear below. Note the following points:
• The setpoint is being ramped from the initial concentration to the desired final value
(see the step-wise changes in the reactor concentration plot below). The reactor
concentration tracks this ramp smoothly with some delay (see the smooth curve), and
settles at the final state with negligible overshoot. The controller works equally well
(and achieves the final concentration more rapidly) for a step-wise setpoint change,
but it makes unrealistically rapid changes in coolant temperature (not shown).
• The final steady state requires a coolant temperature of 305.20 K (see the coolant
temperature plot below). An interesting feature of this nonlinear plant is that if
one starts at the initial steady state (coolant temperature = 298.15 K), stepping
the coolant temperature to 305.20 and holding will not achieve the desired final
concentration of 2. In fact, under this simple strategy the reactor concentration
stabilizes at a final value of 7.88, far from the desired value. A successful controller
must increase the reactor temperature until the reaction “takes off,” after which
it must reduce the coolant temperature to handle the increased heat load. The
relinearization approach provides such a controller (see following plots).
4-12
Simulate Controller with Nonlinear Plant
• Function linearize relinearizes the plant as its state evolves. This function was
discussed previously in “Linearization Using MATLAB Code”.
• The code also resets the linear model's nominal conditions to the latest values. Note,
however, that the first two input signals, which are unmeasured disturbances in the
4-13
4
Designing Controllers Using the Command Line
controller design, always have nominal zero values. As they are unmeasured, the
controller cannot be informed of the true values. A non-zero value would cause an
error.
• Function mpc defines a new controller based on the relinearized plant model. The
output weight tuning ignores the temperature measurement, focusing only on the
concentration.
• At t = 0, the mpcstate function initializes the controller's extended state vector,
x, which is an mpcstate object. Thereafter, the mpcmove function updates it
automatically using the controller's default state estimator. It would also be possible
to use an Extended Kalman Filter (EKF) as described in [1] and [2], in which case the
EKF would reset the mpcstate input variables at each step.
• The mpcmove function uses the latest controller definition and state, the measured
plant outputs, and the setpoints to calculate the new coolant temperature at each
step.
• The Simulink sim function simulates the nonlinear plant from the beginning to the
end of the control interval. Note that the final condition from the previous step is
being used as the initial plant state, and that the plant inputs are being held constant
during each interval.
Remember that a conventional feedback controller or a fixed Model Predictive Control
Toolbox controller tuned to operate at the initial condition would become unstable as
the plant moves to the final condition. Periodic model updating overcomes this problem
automatically and provides excellent control under all conditions.
4-14
Control Based On Multiple Plant Models
Control Based On Multiple Plant Models
The “Nonlinear CSTR Application” on page 4-9 shows how updates to the prediction
model can improve MPC performance. In that case the model is nonlinear and you can
obtain frequent updates by linearization.
A more common situation is that you have several linear plant models, each of which
applies at a particular operating condition and you can design a controller based on
each linear model. If the models cover the entire operating region and you can define a
criterion by which you switch from one to another as operating conditions change, the
controller set should be able to provide better performance than any individual controller.
The Model Predictive Control Toolbox includes a Simulink block that performs this
function. It is the Multiple MPC Controllers block. The rest of this section is an
illustrative example organized as follows:
• “A Two-Model Plant” on page 4-15
• “Designing the Two Controllers” on page 4-17
• “Simulating Controller Performance” on page 4-18
A Two-Model Plant
Note Switching MPC Controllers with Multiple MPC Controllers Block provides an
animated version of the plant described below.
Animation of the Multi-Model Example is a stop-action snapshot of the subject plant. It
consists of two masses, M1 and M2. A spring connects M1 to a rigid wall and pulls it to the
right. An applied force, shown as a red arrow in Animation of the Multi-Model Example,
opposes this spring, pulling M1 to the left.
When the two masses are detached, as in Animation of the Multi-Model Example, mass
M2 is uncontrollable and responds only to the spring pulling it to the left.
If the two masses collide, however, they stick together (the collision is completely
inelastic) until a change in the applied force separates them.
The control objective is to move M1 in response to a command signal. The blue triangle
in Animation of the Multi-Model Example represents the desired location. At the instant
shown, the desired location is –5.
4-15
4
Designing Controllers Using the Command Line
Animation of the Multi-Model Example
In order to achieve its objective, the controller can adjust the applied force magnitude
(the length of the red arrow). It receives continuous feedback on the M1 location. There is
also a contact sensor to signal collisions. The M2 location is unmeasured.
If M1 were isolated, this would be a routine control problem. The challenge is that the
relationship between the applied force and the M1 movement changes dramatically when
M2 attaches to M1.
The following code defines the model. First define the system parameters as follows:
%% Model Parameters
M1=1;
% mass
M2=5;
% mass
k1=1;
% spring constant
k2=0.1;
% spring constant
b1=0.3;
% friction coefficient
b2=0.8;
% friction coefficient
yeq1=10;
% wall mount position
yeq2=-10;
% wall mount position
Next define a model of M1 when the masses are separated. Its states are the M1 position
and velocity. Its inputs are the applied force, which will be the controller's manipulated
4-16
Control Based On Multiple Plant Models
variable, and a spring constant calibration signal, which is a measured disturbance
input.
A1=[0 1;-k1/M1 -b1/M1];
B1=[0 0;-1/M1 k1*yeq1/M1];
C1=[1 0];
D1=[0 0];
sys1=ss(A1,B1,C1,D1);
sys1=setmpcsignals(sys1, 'MV', 1, 'MD', 2);
The setmpcsignals command specifies the input type for the two inputs.
We need another model (with the same input/output structure) to predict movement
when the two masses are joined, as follows:
A2=[0 1;-(k1+k2)/(M1+M2) -(b1+b2)/(M1+M2)];
B2=[0 0;-1/(M1+M2) (k1*yeq1+k2*yeq2)/(M1+M2)];
C2=[1 0];
D2=[0 0];
sys2=ss(A2,B2,C2,D2);
sys2=setmpcsignals(sys2, 'MV', 1, 'MD', 2);
Designing the Two Controllers
Next we define controllers for each case. Both use a 0.2 second sampling period, a
prediction horizon of P = 20, a control horizon of M = 1, and the default values for all
other controller design parameters. The only difference in the controllers is the prediction
model.
Ts=0.2;
% sampling time
p=20;
% prediction horizon
m=1;
% control horizon
MPC1=mpc(sys1,Ts,p,m); % Controller for M1 detached from M2
MPC2=mpc(sys2,Ts,p,m); % Controller for M1 connected to M2
The applied force also has the same constraints in each case. Its lower bound is zero (it
can't reverse direction), and its maximum rate of change is 1000 per second (increasing or
decreasing).
MPC1.MV=struct('Min',0,'RateMin',-1e3,'RateMax',1e3);
MPC2.MV=struct('Min',0,'RateMin',-1e3,'RateMax',1e3);
4-17
4
Designing Controllers Using the Command Line
Simulating Controller Performance
Block Diagram of the Two-Model Example shows the Simulink block diagram for this
example. The upper portion simulates the movement of the two masses, plots the signals
as a function of time, and animates the example.
Block Diagram of the Two-Model Example
The lower part contains three key elements:
• A pulse generator that supplies the desired M1 position (the controller reference
signal). Its output is a square wave varying between –5 and 5 with a frequency of
0.015 per second.
4-18
Control Based On Multiple Plant Models
• A simulation of a contact sensor. When the two masses have the same position, the
Compare to Constant block evaluates to true, and the Add1 block converts this to
a 2. Otherwise, the Add1 output is 1.
• The Multiple MPC Controller block. It has four inputs. The measured output (mo),
reference (ref), and measured disturbance (md) inputs are as for a standard MPC
Controller block. The distinctive feature is the switch input.
The figure below shows the Multiple MPC Controller block mask for this example
(obtained by double clicking on the controller block).
4-19
4
Designing Controllers Using the Command Line
When the switch input is 1 the block automatically activates the first controller listed
(MPC1), which is appropriate when the masses are separated. When the switch input is
2 the block automatically enables the second controller (MPC2).
The following code simulates the controller performance
Tstop=100; % Simulation time
y1initial=0;
% Initial M1 and M2 Positions
y2initial=10;
open('mpc_switching');
sim('mpc_switching',Tstop);
The figure below shows the signals scope output.
4-20
Control Based On Multiple Plant Models
In the upper plot, the cyan curve is the desired position. It starts at –5. The M1 position
(yellow) starts at 0 and under the control of MPC1, M1 moves rapidly toward the desired
position. M2 (magenta) starts at 10 and begins moving in the same direction. At about t =
13 seconds, M2 collides with M1. The switching signal (lower plot) changes at this instant
from 1 to 2, so controller MPC2 has taken over.
The collision moves M1 away from its desired position and M2 remains joined to M1.
Controller MPC2 adjusts the applied force (middle plot) so M1 quickly returns to the
desired position.
4-21
4
Designing Controllers Using the Command Line
When the desired position changes step-wise to 5, the two masses separate briefly (with
appropriate switching to MPC1) but for the most part move together and settle rapidly at
the desired position. The transition back to –5 is equally well behaved.
Now suppose we force MPC2 to operate under all conditions. The figure below shows the
result. When the masses are separated, as at the start, MPC2 applies excessive force
and then over-compensates, resulting in oscillatory behavior. Once the masses join, the
movement smooths out, as would be expected.
The oscillations are especially severe in the last transition. The masses collide frequently
and M1 never reaches the desired position.
4-22
Control Based On Multiple Plant Models
If we put MPC1 in charge exclusively, we instead see sluggish movements that fail to
settle at the desired position before the next transition occurs (not shown but you can run
mpcswitching).
In this case, at least, two controllers are better than one.
4-23
4
Designing Controllers Using the Command Line
Compute Steady-State Gain
This example shows how to analyze a Model Predictive Controller using cloffset. The
function computes the closed-loop, steady-state gain for each output when subjected to a
sustained, 1-unit disturbance added to each output. It assumes that no constraints will
be encountered.
For example, consider the controller operating at the final steady-state of the nonlinear
CSTR of the previous section. To compute its gain, type
cloffset(MPCobj)
which gives the result:
ans =
1.0000
-0.0000
14.5910
-0.0000
The interpretation is that the controller doesn't react to a sustained disturbance of 1 unit
in the first output (the reactor temperature). Recall that we assigned zero weight to this
output in the controller design, so the controller ignores deviations from its setpoint. The
same disturbance has no effect on the second output (the 2,1 element is zero).
If there is a 1-unit disturbance in the second output, the controller reacts, and the first
output increases 14.59 units. This is again due to the zero weight on this output. The
second output stays at its setpoint (the 2,2 element is zero).
4-24
Extract Controller
Extract Controller
This example shows how to obtain an LTI representation of an unconstrained Model
Predictive Control Toolbox controller using ss. You can use this to analyze the
controller's closed-loop frequency response, etc.
For example, consider the controller designed in “Create a Controller Object” on page 4-2.
To extract the controller, you could type:
MPCss = ss(MPCobj);
You could then construct an LTI model of the closed-loop system using the feedback
function (see Control System Toolbox for details) by typing:
CSTRd = c2d(CSTR, MPCss.Ts);
Feedin = 1;
Feedout = 1;
Sign = 1;
CLsys = feedback(CSTRd, MPCss, Feedin, Feedout, Sign);
Note The CSTR model must be converted to discrete form with the same control interval
as the controller.
Recall that the CSTR plant has two inputs and two outputs. The first input is the
manipulated variable and the other is an unmeasured disturbance. The first output
is measured for feedback and the other is not. The Feedin and Feedout parameters
specify the input and output to be used for control. The Sign parameter signifies that the
MPC object uses positive feedback, i.e., the measured outputs enter the controller with
no sign change. Omission of this would cause the feedback command to use negative
feedback by default and would almost certainly lead to an unstable closed-loop system.
You could then type
eig(CLsys)
to verify that all closed-loop poles are within the unit circle, or
bode(CLsys)
to compute a closed-loop Bode plot.
4-25
4
Designing Controllers Using the Command Line
Bibliography
[1] Lee, J. H. and N. L. Ricker, “Extended Kalman Filter Based Nonlinear Model
Predictive Control,” Ind. Eng. Chem. Res., Vol. 33, No. 6, pp. 1530–1541 (1994).
[2] Ricker, N. L., and J. H. Lee “Nonlinear Model Predictive Control of the Tennessee
Eastman Challenge Process,” Computers & Chemical Engineering, Vol. 19, No. 9,
pp. 961–981 (1995).
4-26
Signal Previewing
Signal Previewing
By default, a Model Predictive Controller assumes the current reference and measured
plant disturbance signals will remain constant for the duration of the controller’s
prediction horizon. This emulates conventional feedback control.
As shown in “Optimization Problem”, however, the MPC Toolbox optimization problem
allows these signals to vary within the prediction horizon. If your application allows
you to anticipate trends in such signals, you can use signal previewing in combination
with a Model Predictive Controller to improve reference tracking, measured disturbance
rejection, or both.
The following Model Predictive Control Toolbox commands provide previewing options:
• sim
• mpcmove
• mpcmoveAdaptive
For Simulink, the following blocks support previewing:
• MPC Controller
• Adaptive MPC Controller
• Multiple MPC Controllers
The Explicit MPC Controller will support previewing in a future release.
Related Examples
•
Improving Control Performance with Look-Ahead (Previewing)
More About
•
“Run-Time Constraint Updating” on page 4-28
4-27
4
Designing Controllers Using the Command Line
Run-Time Constraint Updating
Constraint bounds can change during controller operation. The mpcmove,
mpcmoveAdaptive, and mpcmoveExplicit commands allow for this possibility. In
Simulink, all the MPC Controller blocks allow for it as well. Both of these simulation
approaches give you the option to update all specified bounds at each control interval.
You cannot constrain a variable for which the corresponding controller object property is
unbounded.
If your controller object uses time-varying constraints, the updating option applies to the
first finite value in the prediction horizon, and all other values adjust to maintain the
same profile, i.e., they update by the same amount.
Related Examples
•
Varying Input and Output Constraints
More About
•
4-28
“Run-Time Weight Tuning” on page 4-29
Run-Time Weight Tuning
Run-Time Weight Tuning
There are two ways to perform tuning experiments using Model Predictive Control
Toolbox software:
• Modify your controller object off line (by changing weights, etc.) and then test the
modified object.
• Change tuning weights as the controller operates.
This topic describes the second approach.
You can adjust the following tuning weights as the controller operates (see “Tuning
Weights”):
• Plant output variable (OV) reference tracking, wy.
• Manipulated variable (MV) reference tracking, wu.
• MV increment suppression, w∆u.
• Global constraint softening, ρ .
∊
In each case, the weight applies to the entire prediction horizon. If you are using timevarying weights, you must use offline modification of the weight and then test the
modified controller.
In Simulink, the following blocks support online (run-time) tuning:
• MPC Controller
• Adaptive MPC Controller
• Multiple MPC Controllers. In this case, the tuning signals apply to the active
controller object, which might switch as the control system operates. If the objects in
your set employ different weights, you should tune them off line.
The Explicit MPC Controller block cannot support online tuning because a weight change
requires a complete revision of the explicit MPC control law, which is computationally
intensive.
For command-line testing, the mpcmove and mpcmoveAdaptive commands include
options to mimic the online tuning behavior available in Simulink.
Related Examples
•
Tuning Controller Weights
4-29
4
Designing Controllers Using the Command Line
More About
•
4-30
“Signal Previewing” on page 4-27
5
Designing and Testing Controllers in
Simulink
• “Design Controller in Simulink” on page 5-2
• “Test an Existing Controller” on page 5-15
• “Schedule Controllers at Multiple Operating Points” on page 5-16
The Model Predictive Control Toolbox provides a controller block library for use in
Simulink. This allows you to test controller performance in nonlinear simulations. The
procedure depends on whether you have already designed a controller. You also have the
option to coordinate multiple Model Predictive Controllers.
5
Designing and Testing Controllers in Simulink
Design Controller in Simulink
This example shows how to design a model predictive controller in Simulink.
Suppose you have built a nonlinear plant model in Simulink. You want to design an MPC
controller at a specific equilibrium operating point. This example shows that model-based
design workflow. You linearize the plant at the desired operating point, design the MPC
controller and validate it with nonlinear simulation.
Continuous Stirred Tank-Reactor Model
The Simulink model, CSTR_ClosedLoop, models a continuous stirred tank-reactor
(CSTR) plant. A model predictive controller regulates the CSTR plant.
open_system('CSTR_ClosedLoop');
CSTR Plant
The CSTR block, which models the nonlinear plant, has three inputs:
• Feed Concentration (CAi inport) — Concentration of the limiting reactant in the
CSTR feed stream.
• Feed Temperature (Ti inport) — Temperature of the limiting reactant in the CSTR
feed stream.
• Coolant Temperature (Tc inport) — Temperature of the CSTR coolant. The MPC
controller (MPC Controller block) treats this plant input as a manipulated variable.
The CSTR block has two states: the temperature and concentration of the limiting
reactant in the reactor. These states are measured and displayed by the following blocks:
5-2
Design Controller in Simulink
• CSTR Temperature — Temperature of the limiting reactant in the product stream.
• Concentration — Concentration of the limiting reactant in the product stream, also
referred to as residual concentration. The MPC controller regulates this state to
satisfy the desired setpoint.
MPC Controller
The MPC Controller block, which requires a supported C or C++ compiler, represents the
model predictive controller. It is available in the Model Predictive Control Toolbox
library of the Simulink Library Browser. For this example, the block is configured as
follows:
• Measured output (mo inport) — Residual concentration; signal originating at the CA
outport of the CSTR block.
• Reference, also referred to as setpoint or target (ref inport) — Residual concentration
reference; signal originating at the Concentration Setpoint block. Set to 2 kmol/m3.
• Manipulated variable (mv outport) — Concentration of the CSTR coolant; input signal
of the Tc inport of the CSTR block.
The reactor temperature is usually controlled. For this example, ignore the reactor
temperature for a more challenging nonlinear control problem.
Open MPC Design Tool
Double-click the MPC Controller block to open the block dialog box.
5-3
5
Designing and Testing Controllers in Simulink
The MPC Controller box is blank. No controller has been designed yet.
Click Design. The MPC Question dialog box opens.
5-4
Design Controller in Simulink
For this example, use the default values of this dialog box. Click OK. The software
performs multiple tasks to design an initial MPC controller. These tasks include finding
an equilibrium operating point, linearizing the plant model, and building the MPC
controller. Finally, the Control and Estimation Tools Manager opens, containing an
MPC design task node (MPC Design Task - MPC Controller). This node includes the
linearized plant model, MPC open loop plant 1.
Evaluate Default Operating Point
The CSTR plant model has multiple equilibrium operating points. The software uses the
default equilibrium operating point to linearize the plant model. This operating point
could differ from the desired operating point. It is important to verify that the software
used an appropriate operating point. Otherwise, the linear plant model can be unsuitable
for controller design.
5-5
5
Designing and Testing Controllers in Simulink
In the MPC open loop plant 1 node of the tree, click Operating Point.
The software found a steady-state operating point (derivatives are close to zero).
However, the reactor temperature (CSTR_ClosedLoop/CSTR/T_K) is very low, yielding
a low reaction rate. Compare the values of the residual concentration state (9.9919 kmol/
m3) and the feed concentration (10 kmol/m3) to confirm the low reaction rate.
Because this operating point does not result in a significant reaction, calculate another
operating point with a higher reaction rate.
Calculate Desired Operating Point for Plant Model
Suppose the desired operating point is:
• Residual concentration is 2 kmol/m3
• Reactor temperature is 370 K
Specify output constraints on all the OV/MV/MD signals connected to the MPC
Controller. This step is required because the software uses the steady-state values of
these signals as the nominal values for the controller. In the Simulink model, right-click
the MO signal entering the controller. Select Linear Analysis Points> Trim Output
Constraint. Repeat for the MV signal of the MPC Controller block. All constrained
signals are marked with T.
5-6
Design Controller in Simulink
In the tree of the Control and Estimation Tools Manager, click Operating Points. Then,
click the Compute Operating Points tab.
Specify the desired operating point states:
• CSTR_ClosedLoop/CSTR/C_A (residual concentration) — Enter 2 in the Value
box.
• CSTR_ClosedLoop/CSTR/T_K (reactor temperature) — Enter 370 in the Value
box.
• CSTR_ClosedLoop/MPC Controller/MPC/last_mv — Clear the Steady State
check box. This state, which belongs to the MPC Controller block, can be arbitrary. Its
value is set by the software during the operating point calculation.
Specify the desired operating point outputs. Click the Outputs tab.
• CSTR_ClosedLoop/CSTR (reactor concentration) — Enter 2 in the Value box.
Then, select Known check box.
• CSTR_ClosedLoop/MPC Controller (coolant temperature) — Use default values.
5-7
5
Designing and Testing Controllers in Simulink
Click Compute Operating Points.
The Computation Results tab displays the operating point search result. The new
operating point, Operating Point, appears in the Operating Points node.
Tip If an operating point computation fails, you can:
• Specify better initial estimates of the unknown quantities.
• Select a different optimization algorithm for the operating point search. To specify
a different optimization algorithm, in the Controls and Estimation Tools Manager,
select Options in the Tools menu. Specify the algorithm options in the Operating
Point Search tab.
5-8
Design Controller in Simulink
Confirm that Operating Point is the desired operating point. In the tree, click
Operating Point in the Operating Points node.
As desired, the reactor temperature is close to 370 K at steady state. Similarly, the
reactor concentration is 2 kmol/m3 at steady state. Operating Point is verified as the
desired operating point.
Linearize Plant at Desired Operating Point
In the tree, click MPC Design Task - MPC Controller.
Click Import Plant. The Plant Model Importer dialog box opens.
Click the Linearized Plant from Simulink tab.
• Linearized plant model name box (name of the linearized plant to be created) —
Use the default name, MPC open loop plant2.
• Use existing operating point list — Select Operating Point.
5-9
5
Designing and Testing Controllers in Simulink
Click OK. The software calculates the linearized plant model, MPC open loop plant 2.
This model is visible in the Control and Estimation Tools Manager, in the Plant models
node.
(Optional) Close the Plant Model Importer dialog box by clicking Close.
(Optional) To see the nominal values of the input and output signals, in the tree, click
MPC Design Task - MPC Controller.
5-10
Design Controller in Simulink
These values correspond to the desired operating point.
Update Controller to Use New Plant Model
In the tree, click Controllers. Then, in the Plant Model list, select MPC open loop
plant 2.
5-11
5
Designing and Testing Controllers in Simulink
Alternatively, delete MPC open loop plant 1, the model computed at default operating
point. Deleting this plant forces the controller to use the new model and eliminates the
potential for confusion. In the tree, click Plant models. Then, in the Plant models
imported for this project list box, select MPC open loop plant 1. Click Delete.
Generally, the next step is to configure the controller, including specifying the control
and prediction horizons, constraints, weights, and noise/disturbance models. For such
configuration, select the controller in the Controllers node. However, for this example,
use the default controller settings.
(Optional) You can validate the controller design by performing linear simulations. To do
so, use the Scenarios node.
Export Controller and Operating Point to MATLAB Workspace
By default, the software creates a controller, MPC1, based on the model obtained by
automatic linearization. The software automatically exports MPC1 to the MATLAB
workspace. Also, in the Simulink model, the software updates the MPC Controller block.
It sets the MPC Controller parameter to MPC1. So, when you run the Simulink model,
you use MPC1.
Because the initial linearization was unsuitable, you must export the controller with
the new plant model. In the Controllers node, right-click MPC1 and select Export
Controller. The MPC Controller Exporter dialog box opens. Use the default values
specified in this dialog box. Click Export and confirm that you want to replace the
existing MPC1 in the MATLAB workspace. Optionally, close this dialog box by clicking
Close.
5-12
Design Controller in Simulink
Tip After you export the controller, you can examine it for design errors and stability
problems using the review function.
Verify Steady-State Operation for Plant-Controller Combination
To simulate the model at the desired operating point, export Operating Point to the
MATLAB workspace and initialize the model with it. In the Control and Estimation
Tools Manager, expand the Operating Points node and right-click Operating Point.
Select Export to Workspace. The Export to Workspace dialog box opens. Select the Use
the operating point to initialize model check box. Click OK.
Run the CSTR_ClosedLoop model.
The simulation plots show that the residual concentration reaches 2 kmol/m3 and the
reactor temperature is approximately 373 K. Therefore, the controller is initialized at the
desired operating point.
Test Controller Robustness
For example, change the feed concentration, specified by the Feed Concentration block,
to 9.5 kmol/m3. Recall that the nominal feed concentration value used to design the
controller is 10 kmol/m3. Run the model.
5-13
5
Designing and Testing Controllers in Simulink
The decrease in feed concentration reduces heat generation. If the controller were absent,
the reactor temperature would drop significantly, reducing the reaction rate, and the
CSTR concentration would increase to roughly 3 kmol/m3. To counteract these effects,
the controller raises the coolant temperature, which returns the CSTR temperature to a
value slightly below the nominal condition.
See Also
review
Related Examples
5-14
•
“Linearize Simulink Models”
•
“Design Controller Using the Design Tool”
Test an Existing Controller
Test an Existing Controller
If you have already designed a model predictive controller to use with a Simulink plant,
to test it in Simulink:
1
Open Simulink model.
2
Add an MPC Controller block to the model and connect it.
3
Specify the controller.
Open the MPC Controller and enter the name of your controller in the MPC
Controller box. The string you enter here must be the name of an mpc object in the
workspace.
4
(Optional) Modify the controller.
To use mpctool, click Design with the MPC Controller open. Change the controller
parameters and then export the modified controller to the workspace.
Alternatively, use commands to modify the controller object in the workspace.
5
Run the Simulink model.
5-15
5
Designing and Testing Controllers in Simulink
Schedule Controllers at Multiple Operating Points
In this section...
“A Two-Model Plant” on page 5-16
“Animation of the Multi-Model Example” on page 5-17
“Designing the Two Controllers” on page 5-18
“Simulating Controller Performance” on page 5-19
If your plant is nonlinear, a controller designed to operate in a particular target
region may perform poorly in other regions. The common way to compensate is to
design multiple controllers, each intended for a particular combination of operating
conditions. Switch between them in real-time as conditions change. Gain scheduling is a
conventional example of this technique. The following example shows how to coordinate
multiple model predictive controllers for this purpose.
The rest of this section is an illustrative example organized as follows:
• “A Two-Model Plant” on page 5-16 describes the example application involving two
distinct operating conditions.
• “Animation of the Multi-Model Example” on page 5-17 explains how to simulate
the plant.
• “Designing the Two Controllers” on page 5-18 shows how to obtain the controllers
for each operating condition.
• “Simulating Controller Performance” on page 5-19 shows how to use the Multiple
MPC Controllers block in Simulink to coordinate the two controllers.
A Two-Model Plant
The figure below is a stop-action snapshot of the plant. It consists of two masses, M1
(upper) and M2 (lower). A spring connects M1 to a rigid wall and pulls it to the right. An
applied force, shown as a red arrow, opposes the spring pulling M1 to the left.
5-16
Schedule Controllers at Multiple Operating Points
In the above, mass M2 is uncontrollable. It responds solely to the spring pulling it to the
left.
If the two masses collide, however, they stick together until a change in the applied force
separates them.
The control objective is to make M1 track a reference signal. The blue triangle in the
above indicates the desired location, which varies with time. At the instant shown, the
desired numeric location is -5.
For an animated version of the plant, see Scheduling Controllers for a Plant with
Multiple Operating Points.
Animation of the Multi-Model Example
In order to achieve its objective, the controller can adjust the applied force magnitude
(the length of the red arrow). It receives continuous measurements of the M1 location.
There is also a contact sensor to signal collisions. The M2 location is unmeasured.
If M1 were isolated, this would be a routine control problem. The challenge is that the
relationship between the applied force and M1’s movement changes dramatically when M2
attaches to M1.
Define the model.
5-17
5
Designing and Testing Controllers in Simulink
Define the system parameters.
M1 =
M2 =
k1 =
k2 =
b1 =
b2 =
yeq1
yeq2
1; % mass
5; % mass
1; % spring constant
0.1; % spring constant
0.3; % friction coefficient
0.8; % friction coefficient
= 10; % wall mount position
= -10; % wall mount position
Define a model of M1 when the masses are separated. Its states are the position and
velocity of M1. Its inputs are the applied force, which will be the controller’s manipulated
variable (MV), and a spring constant calibration signal, which a measured disturbance
(MD) input.
A1 =
B1 =
C1 =
D1 =
sys1
sys1
[0 1;-k1/M1 -b1/M1];
[0 0;-1/M1 k1*yeq1/M1];
[1 0];
[0 0];
= ss(A1,B1,C1,D1);
= setmpcsignals(sys1,'MV',1,'MD',2);
The call to setmpcsignals specifies the input type for the two inputs.
Define another model (with the same input/output structure) to predict movement when
the two masses are joined.
A2 =
B2 =
C2 =
D2 =
sys2
sys2
[0 1;-(k1+k2)/(M1+M2) -(b1+b2)/(M1+M2)];
[0 0;-1/(M1+M2) (k1*yeq1+k2*yeq2)/(M1+M2)];
[1 0];
[0 0];
= ss(A2,B2,C2,D2);
= setmpcsignals(sys2,'MV',1,'MD',2);
Designing the Two Controllers
Next, define controllers for each case. Both controllers employ a 0.2 second sampling
period (Ts), a prediction horizon of p = 20, a control horizon of m = 1 and default values
for all other controller parameters.
The only property that distinguishes the two controllers is the prediction model.
5-18
Schedule Controllers at Multiple Operating Points
Ts = 0.2;
p = 20;
m = 1;
MPC1 = mpc(sys1,Ts,p,m); % Controller for M1 detached from M2
MPC2 = mpc(sys2,Ts,p,m); % Controller for M1 connected to M2
The applied force also have the same constraints in each case. The lower bound for the
applied force is zero because it cannot reverse direction. The maximum rate of change for
the applied force is 1000 per second (increasing or decreasing).
MPC1.MV = struct('Min',0,'RateMin',-1e3,'RateMax',1e3);
MPC2.MV = struct('Min',0,'RateMin',-1e3,'RateMax',1e3);
Simulating Controller Performance
The following is the Simulink block diagram for this example.
The upper portion simulates the movement of the two masses, plots the signals as a
function of time and animates the plant.
5-19
5
Designing and Testing Controllers in Simulink
The lower part contains the following key elements:
• A pulse generator that supplies the desired M1 position (the controller reference
signal). The output of the pulse generator is a square wave that varies between —5
and 5, with a frequency of 0.015 per second.
• Simulation of a contact sensor. When the two masses have the same position, the
Compare to Constant block evaluates to true and the Add1 block converts this to a 2.
Else, the output of Add1 is 1.
• The Multiple MPC Controllers block, which has four inputs. The measured output
(mo), reference (ref) and measured disturbance (md) inputs are as for the MPC
Controller block. The distinctive feature of the Multiple MPC Controllers block is the
switch input.
The figure below shows the Multiple MPC Controllers block mask for this example.
5-20
Schedule Controllers at Multiple Operating Points
When the switch input is 1, the block automatically activates the first controller
that is listed (MPC1), which is appropriate when the masses are separated. When the
switch input is 2, the block automatically enables the second controller (MPC2).
Simulate the controller performance using Simulink commands.
Tstop = 100; % Simulation time
y1initial = 0; % Initial M1 and M2 Positions
5-21
5
Designing and Testing Controllers in Simulink
y2initial = 10;
open('mpc_switching');
sim('mpc_switching',Tstop);
The figure below shows the signals scope output.
5-22
Schedule Controllers at Multiple Operating Points
5-23
5
Designing and Testing Controllers in Simulink
In the upper plot, the cyan curve is the desired position. It starts at -5. The M1
position (yellow) starts at 0. Under the control of MPC1, M1 moves rapidly towards the
desired position. M2 (magenta) starts at 10 and begins moving in the same direction.
At about t = 13 seconds, M2 collides with M1. The switching signal (lower plot)
changes at this instant from 1 to 2, so MPC2 takes over.
The completely inelastic collision moves M1 away from its desired position and M2
remains joined to M1. Controller MPC2 adjusts the applied force (middle plot) so M1
quickly returns to the desired position.
When the desired position changes step-wise to 5, the two masses separate briefly,
with the controller switching to MPC1 appropriately. But, for the most part, the two
masses move together and settle rapidly at the desired location. The transition back
to —5 is equally well behaved.
Suppose we force MPC2 to operate under all conditions.
The figure below shows the result.
5-24
Schedule Controllers at Multiple Operating Points
5-25
5
Designing and Testing Controllers in Simulink
When the masses are disconnected, as at the start, MPC2 applies excessive force and
then over-compensates, resulting in oscillatory behavior. Once the masses join, the
move more smoothly, as would be expected.
The last transition causes especially severe oscillations. The masses collide frequently
and M1 never reaches the desired position.
If MPC1 is in charge exclusively, the masses move sluggishly and fail to settle at the
desired position before the next transition occurs. For more information, see the
Scheduling Controllers for a Plant with Multiple Operating Points.
In this application, at least, two controllers are, indeed, better than one.
5-26