1
SMART 96 Piú
USER'S
MANUAL
01/2003
SMART96 Piú
DUCATI energia S.p.A.
Table of Contents
1.
INTRODUCTION ...................................................................................... 1
2.
SYSTEM ARCHITECTURE ....................................................................... 3
2.1
The RS485 Serial interface: network with up to 31 analysers ................................................ 4
2.2
The RS485 Serial interface: Network with more than 31 analysers ....................................... 5
2.3
The RS485 Serial interface. Network with “DAT” Data Logger ............................................ 6
3.
“2P” SMART96 Piú with PULSE or ALARM OUTPUTS ............................... 7
4.
DEVICE DESCRIPTION............................................................................ 7
5.
6.
4.1
User interface........................................................................................................................... 8
4.2
Terminal board......................................................................................................................... 9
4.3
Installing the device on the panel............................................................................................. 10
WIRING DIAGRAMS ................................................................................ 12
5.1
Power supply ........................................................................................................................... 12
5.2
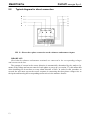
Typical diagram for direct connection..................................................................................... 13
5.3
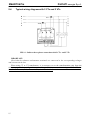
Typical diagram for indirect connection.................................................................................. 14
5.4
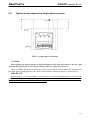
Typical wiring diagram with 2 CTs and 2 VTs ....................................................................... 15
5.5
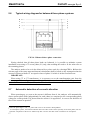
Typical wiring diagram for single-phase systems ................................................................... 16
5.6
Typical wiring diagram for balanced three-phase systems ..................................................... 17
5.7
Automatic detection of current’s direction.............................................................................. 17
5.8
Cogeneration’s function........................................................................................................... 18
OPERATING INSTRUCTIONS .................................................................. 20
6.1
Display test at power up .......................................................................................................... 20
6.2
Default page............................................................................................................................. 20
6.3
M easurement pages.................................................................................................................. 20
6.4
Configuration pages (Setup).................................................................................................... 26
6.4.1 Reset................................................................................................................................... 28
6.4.2 Setting the instrument ........................................................................................................ 29
6.4.3 Setting the KV (VT transformation ratio).......................................................................... 29
6.4.4 Setting the KA (CT transformation ratio).......................................................................... 30
6.4.5 Setting the cogeneration mode ........................................................................................... 30
6.4.6 Selection of the measures of the last measurements page (PAr, ThdF normal or %)........ 31
i
SMART96 Piú
DUCATI energia S.p.A.
6.4.7 Active energy pulsed output (OUT1) ................................................................................ 32
6.4.8 Reactive energy pulsed output (OUT2)............................................................................. 33
6.4.9 Alarm output (OUT1)........................................................................................................ 33
6.4.9.1 Alarms 29 ÷ 34: Disconnection Function (D.F.)....................................................... 36
6.4.10 Alarm output (OUT2)........................................................................................................ 36
6.4.11 Default page ....................................................................................................................... 36
6.4.12 M ean time .......................................................................................................................... 37
6.4.13 Setting the parameters for the RS485 serial interface........................................................ 37
6.4.14 Address of the analyser...................................................................................................... 37
6.4.15 Serial communication protocol.......................................................................................... 38
6.4.16 Password setting................................................................................................................. 38
6.4.17 Instrument firmware version and serial number................................................................. 40
6.5
7.
INI page(InI)............................................................................................................................ 41
PERFORMANCE AND TECHNICAL CHARACTERISTICS......................... 42
7.1
Acquired quantities .................................................................................................................. 42
7.2
Calculated measurements ........................................................................................................ 42
7.3
Interfaces.................................................................................................................................. 43
7.4
Inputs ....................................................................................................................................... 43
7.4.1 Voltmeter inputs ................................................................................................................ 43
7.4.2 Ammeter inputs ................................................................................................................. 43
7.4.3 Out-of- range visualisation................................................................................................. 44
7.5
Energy count............................................................................................................................ 44
7.6
Configurable measurement mode ............................................................................................ 44
7.7
Accuracy of the measurement.................................................................................................. 44
7.8
Power supply ........................................................................................................................... 45
7.9
Operating Conditions............................................................................................................... 45
7.10 Normative references ............................................................................................................... 45
7.11 Further information.................................................................................................................. 46
8.
TIPS FOR A CORRECT INSTALLATION................................................... 47
ii
SMART96 Piú
DUCATI energia S.p.A.
Table of Pictures
FIG 1 - System architecture .................................................................................................................3
FIG 2 - Network with up to 31 analysers ............................................................................................4
FIG 3 - Network with more than 31 analysers ....................................................................................5
FIG 4 - Network with “DAT” data logger and modem........................................................................6
FIG 5 - Device view .............................................................................................................................7
FIG 6 - Press SELECT to enter the Setup menu..................................................................................9
FIG 7 - Device terminal board .............................................................................................................9
FIG 8 - Panel installation ...................................................................................................................11
FIG 9 - Red spring installation (1) and locking (2)............................................................................11
FIG 10 - Panel installation completed................................................................................................11
FIG 11 - Power supply connections...................................................................................................12
FIG 12 - Direct three-phase connection on the voltmeter and ammeter inputs.................................13
FIG 13 - CT and VT indirect three-phase connection .......................................................................14
FIG 14 - Indirect three-phase connection with 2 CTs and 2 VTs.....................................................15
FIG 15 - Single-phase connection......................................................................................................16
FIG 16 - Balanced three-phase connection ........................................................................................17
FIG 17 - Two SMART96Più connected in opposition for the Cogeneration measurement ..............18
FIG 18 - Pair of SM ART96 Più for the measurement of the absorbed and generated energy ..........19
FIG 19 - Page for three-phase voltage, current, active and reactive energy ......................................21
FIG 20 - Page for three-phase active and reactive power, active and reactive energy ......................21
FIG 21 - Three-phase mean and maximum mean active power, active and reactive energy ............22
FIG 22 - Three-phase mean apparent power and maximum mean in VA ("UA") ............................22
FIG 23 - Page for three-phase power factor, frequency, active and reactive energy .........................22
FIG 24 - Voltage between phases, three-phase active and reactive energy.......................................23
FIG 25 - Using the SELECT key to enter the alternating phase page ...............................................23
FIG 26 - Page for phase 2 voltage and current, three-phase active and reactive energy ...................23
FIG 27 - Page for phase 3 voltage and current, three-phase active and reactive energy ...................24
FIG 28 - Partial energy meters ...........................................................................................................24
FIG 29 - Voltage’s and current’s ThdF – normal visualisation .........................................................24
FIG 30 - Voltage’s and current’s ThdF – % visualisation.................................................................24
FIG 31 - ThdF lower than 1...............................................................................................................25
FIG 32 - ThdF greater than 1 .............................................................................................................25
FIG 33 - Accessing the configuration or Setup pages........................................................................26
FIG 34 - Accessing the configuration or Setup pages with password...............................................26
FIG 35 - Reset page............................................................................................................................28
FIG 36 - Analyser configuration........................................................................................................29
FIG 37 - Page for setting the VT transformation ratio.......................................................................30
FIG 38 - Page for setting the CT transformation ratio.......................................................................30
FIG 39 - Disabling the Cogeneration function...................................................................................31
FIG 40 - Enabling the Cogeneration function....................................................................................31
FIG 41 - Partial energy meters, ThdF – normal or % visualisation ...................................................31
FIG 42 - Pulsed output associated with the active energy (Wh/pulse)..............................................32
FIG 43 - Signal timing on the terminals of the OUT1 output ...........................................................32
FIG 44 - Pulsed output associated with the reactive energy (Varh/pulse).........................................33
FIG 45 - Setting of alarm on OUT1 output .......................................................................................33
FIG 46 - Selection of the alarm threshold associated with the current of line 1 (number 5).............35
FIG 47 - Auxiliary relay for alarms outputs ......................................................................................35
FIG 48 - Setting of alarm on OUT2 output .......................................................................................36
FIG 49 - Default page.........................................................................................................................36
FIG 50 - Page for mean time..............................................................................................................37
FIG 51 - RS485 Serial line: Baud rate(bps).......................................................................................37
iii
SMART96 Piú
DUCATI energia S.p.A.
FIG 52 - Setting the device address. ..................................................................................................37
FIG 53 - Setting the protocol type parameter ....................................................................................38
FIG 54 - Password setting/modification page....................................................................................38
FIG 55 - Selecting the password........................................................................................................39
FIG 56 - Password, initial confirmation.............................................................................................39
FIG 57 - Password: yes......................................................................................................................39
FIG 58 - Disabling the password.......................................................................................................39
FIG 59 - Disabling the password, initial confirmation.......................................................................40
FIG 60 - Disable confirmed................................................................................................................40
FIG 61 - Page for firmware release....................................................................................................40
iv
SMART96 Piú
1.
DUCATI energia S.p.A.
INTRODUCTION
In the scope of DUCATI energia S.p.A.'s extensive program in energy saving, the new and
cost-effective SM ART96 Piú enlarges the Analyser family started with the panel devices: M ACH
30 (three-phase), M ACH 20 (single-phase) M ACH SMART, MACH SM ART 96 and SMART Piú.
As a natural development of the Company’s experience in industrial controls, the range of hightech products and systems devised under this program synergically responds to DUCATI's timelong engagement in the field.
The panel SM ART96 Piú devices are specially designed and manufactured for use with power
distribution panels; they directly measure:
•
phase-to-neutral voltages
•
phase currents
•
frequency
•
phase active powers
And calculate:
•
three-phase active powers (instantaneous, mean and maximum powers)
•
three-phase reactive power
•
phase and three-phase system power factors
•
phase and three-phase equivalent active and reactive energy
•
voltage and current ThdF’s (calculated on phase L1)
•
voltage between phases
The above measurements can be viewed on the backlit LCD display located on the front panel.
Also, other measurements are available through a RS485 serial interface such as:
•
phase and three-phase system apparent and reactive powers (instantaneous, mean and maximum
powers)
Each SM ART96 Piú is fitted with a serial RS 485 port to create networks of analysers, to be
managed by means of a dedicated software.
In the SM ART96 Piú “2P” model, two pulsed outputs are available for the energy count; these
outputs can be transformed into simple threshold alarm outputs.
The same instrument can be used in different types of system by means of the user
configuration feature:
• Three-phase (default)
• Single phase (it shows the phase 1 values)
1
SMART96 Piú
DUCATI energia S.p.A.
• Balanced three-phase (the three phase voltages are used, but only one phase current is
read)
Some special features of the instrument are:
•
Measurement accuracy: class 0.5
•
Default page: the user can set which one of the available measurement pages is displayed as
the default page. It is also possible to set a cycle-wise display of all pages
•
Security password: this password is entered through the keyboard and prevents any
unauthorised access of the Setup menu in order to avoid any undesired instrument
configuration or energy meter reset
•
Automatic detection of current direction in CTs: this function, independently active on
each phase, means that the fitter does not have to worry about the direction in which he has
effected the amperometric/ammeter wiring or carry out any sort of configuration
•
There is the possibility to disable the automatic detection of current’s direction in CTs so to
measure of the cogeneration (the energy produced by an user functioning as generator),
using two SM ART96 Più in opposition
•
Conventional indication of the sign also for the three-phase power factor to help the fitter
recognise at a glance whether the fitting is correct. In fact, if the fitting is correct, PFs are
congruent and feature the same sign; if not, the PF has the same sign as the algebraic sum of
phase active powers
•
Partial active and reactive energy meters, displayed in a special page of the measurement
menu. This function is similar to that of a car tripmeter and is useful, for instance, when
measuring the energy consumption of a given work cycle. Press SELECT to reset both
meters in order to start an energy partial count
•
Pulsed or alarm outputs with possibility of a simple forecasting algorithm for load
disconnection
•
F/W update via PC if required
2
SMART96 Piú
2.
DUCATI energia S.p.A.
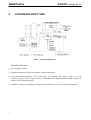
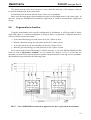
SYSTEM ARCHITECTURE
FIG 1 - S ystem architecture
SM ART96 Piú features:
•
power supply section
•
measurement input section (three-phase voltage and current)
•
two pulse-emitting outputs (“2P” model only) for counting Wh (active energy) or VArh
(reactive energy). These outputs can be transformed into simple-threshold alarm outputs by
means of the setup menu pages
•
a RS485 serial port with galvanic isolation for connection to a PC or network of instruments
3
SMART96 Piú
2.1
DUCATI energia S.p.A.
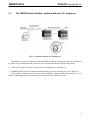
The RS485 Serial interface: network with up to 31 analysers
FIG 2 - Network with up to 31 analysers
The RS485 serial port available on each SM ART96 Piú allows managing a network of analysers
by means of two communication protocols, to be selected from the appropriate Setup menu.
•
“DUCATI energia” protocol: ASCII protocol to manage up to 98 analysers
•
MODBUS-RTU protocol: industrial standard binary protocol to manage up to 247 analysers
It is possible to connect up to 31 devices on the same line, without further aids except for a 120
Ohm “terminating resistor” on the last device, as shown in the “Detail” picture.
4
SMART96 Piú
2.2
DUCATI energia S.p.A.
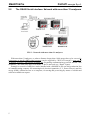
The RS485 Serial interface: Network with more than 31 analysers
FIG 3 - Network with more than 31 analysers
With more than 31 analysers, or when a distance longer than 1,000 meters has to be covered, it
is necessary to install a SRD signal repeater (can be supplied by “DUCATI energia”) every set of
31 devices, or every 1,000 meters of RS485 line. Regarding communication protocols and the “line
terminator”, the same rules apply as with the 31-device network (see “Detail” figure).
Example: a network of analysers can be installed with a SM ART96 Piú on each production line
of a manufacturing company for measuring local electrical quantities (V, I, Power Factors) and the
energy (kWh). All data are sent to a computer, for storing and processing by means of a dedicated
software available on request.
5
SMART96 Piú
2.3
DUCATI energia S.p.A.
The RS485 Serial interface. Network with “DAT” Data Logger
FIG 4 - Network with “DAT” data logger and modem
It is possible to connect an instrument network with data loggers of the Mach-Dat (or Dat Più)
series, also manufactured by “DUCATI energia”: the data loggers are designed to be installed on a
DIN rail, and can manage up to 6 (Dat/S2) or up to 98 (Dat Più) M ach or Smart devices, according
to the model. Once configured, the data are acquired from the M achs at fixed intervals, and
recorded in the loggers' memory. It is possible to download the stored data by connecting the M achDats to a PC (using a direct or modem connection). In case standard phone lines are not available,
the M ach-Dats can be connected to GSM modems.
6
SMART96 Piú
3.
DUCATI energia S.p.A.
“2P” SMART96 Piú with PULSE or ALARM OUTPUTS
The SM ART96 Piú analyser, “2P” model, features two outputs which can be used in the
following ways:
•
outputs managed as pulsed outputs
The analyser features two pairs of terminals for the production of pulses connected to the active
(OUT1) or reactive (OUT2) energy and, between each of these, a normally-open solid-state static
relay contact is available. These outputs are managed so that at every second all the pulses related to
the built-up count are emitted, with 10 pulses/second maximum.
•
outputs managed as alarm outputs
Pulsed outputs can be transformed into simple-threshold alarm outputs by setting to zero, in the
suitable setup page, the number of Wh or VArh / pulse. The threshold value can be set by means of
another suitable setup menu page. Each output can be assigned a quantity from a choice of 28 [34
with the load control management] (see par. 6.4.9 and 6.4.10). Having exceeded the alarm threshold
for at least 10 seconds, the output state will switch to “1”, whilst below the threshold it will read
“0”.
Warning: For the output’s connections to an external relay (Auxiliary Relay), see chapter
6.4.9 for details.
4.
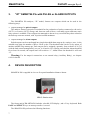
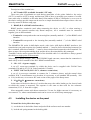
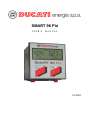
DEVICE DESCRIPTION
SM ART96 Piú is supplied in a box to fit a panel installation 96mm x 96mm.
FIG 5 - Device view
The front panel of SM ART96 Piú includes: a backlit LCD display, and a 2-key keyboard. Both
PAGE and S ELECT keys are autorepeat after 1 second.
The SM ART96 Piú performs the following functions:
7
SMART96 Piú
DUCATI energia S.p.A.
•
measurement of voltage and rms current for each phase of the three-phase network
•
measurement of active power
•
measurement of L1 phase frequency
•
on the basis of the measured values, computation of reactive and apparent power, power factor,
ThdF’s, active and reactive energy of each phase
•
display of measurements
•
reply to the commands received through the RS485 serial port
•
generation of a pulse to OUT1 and/or OUT2 outputs, if available, on the basis of the number of
Wh-(active energy) or VArh-(reactive energy) set in the setup page; on the other hand, if said
outputs have been programmed for such purpose in the relevant setup page, generation of alarm
upon exceeding threshold for at least ten seconds
4.1
User interface
The device is managed through two groups of pages (menu):
•
Measurement pages, to view records and processed data
•
Configuration (or Setup) pages, to modify the parameter values by means of the two PAGE
and SELECT keys in the following manner:
•
Selecting Measurement and Setup pages
•
press PAGE: next page each time this key is pressed
•
press PAGE and hold down: go back page by page
•
Selecting parameters
•
press SELECT: the parameter increases each time the key is pressed
•
press SELECT and hold down: the two-speed autorepeat is enabled
•
press SELECT and hold down, then press PAGE: the parameter is decreased
•
press SELECT and PAGE keys and hold down: the parameter is decreased and the
two-speed autorepeat is enabled
•
Quick access to the Setup menu
•
press SELECT and PAGE and hold down: immediate access to the Setup menu
The first measurement page is automatically displayed when switching the device on; to scroll
the pages, press PAGE. Each measurement page features the L1L2L3 string indicating the threephase environment or the single L1, or L2, or L3 strings indicating the environment of each phase.
For convenient reading, the line below indicates the active (kWh) and reactive (kVArh) energy,
which is repeated in all measurement pages.
In the Setup menu, the user can select which measurement page is the default page for the
instrument, i.e. the page to be displayed at power up or after a certain period of inactivity (see par.
6.4.11).
8
SMART96 Piú
DUCATI energia S.p.A.
To access the configuration pages, scroll all measurement pages with the PAGE key or obtain
quick access by holding down SELECT key and then pressing PAGE till the page named “Setup”
(white characters on a black background) is displayed. Then press SELECT again to enter the first
page of the menu, i.e. the Reset page.
SELECT + PAGE
SELECT
PAGE
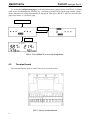
FIG 6 - Press S ELECT to enter the Setup menu
4.2
Terminal board
The terminal board is used to connect the device to the network.
FIG 7 - Device terminal board
9
SMART96 Piú
DUCATI energia S.p.A.
Description of the terminal sets:
1. OUT1 and OUT2 (available for model “2P” only)
These two pairs of terminals are used during generation of the pulses linked to the active
(OUT1) or reactive (OUT2) energy and between each of these a normally-open contact of a solidstate static relay is available; on the other hand, if the number of Wh or VArh/pulse is set to zero in
the relative setup page, this output can be used as a simple-threshold alarm output whose value can
be set by means of another setup page.
2. RS 485 (B G A, RS 485 serial interface)
RS485 interface terminals (used when connecting the device to a PC, or when creating a
network). If the network contains only Ducati analysers, all A terminals must be connected
together, just as all B terminals.
• Terminal A corresponds to the non-inverting line (normally marked “+”) of the RS485 serial
interface
• Terminal B corresponds to the inverting line (normally marked “-”) of the RS485 serial
interface
The SM ART96 Piú works in half-duplex mode; with 4-wire (full duplex) RS485 interfaces, the
transmission (out) and reception (in) terminals marked “+” must be short-circuited and connected to
the A terminal, while those marked “−” must be short-circuited and connected to the B terminal. For
these systems, the reception enabling logic and the driver direction shall be duly managed.
Terminal G can be used to ground the braid of the shielded cable. It is advisable to always ground
the cable in a single point of the network.
When using a “Ducati energia – DLC” RS232/RS485 signal converter, ensure that the connection is
made solely to the S terminal of the DLC RS485 terminal block.
3. 230 – 115 – 0 (power supply)
A set of 3 screw-type terminals, by which the device can be supplied with 230/240 Vrms
(terminals 230 and 0) or 115/120 Vrms (terminals 115 and 0).
4. INPUT VOLTAGE (L3 L2 L1 N, voltmeter connections)
A set of 4 screw-type terminals to connect the 3 voltmeter phases, and the neutral when
available. If M .T. measurements are to be taken, it is necessary to use standard VT (normally /100
or /110); in this case, set a correct KV ratio on one of the pages of the Setup menu.
5. L3
L2
L1
(ammeter connections)
In the centre of the device there are 3 cavities that accept the cables leading to the electric loads
on which the current is measured. The sequence is the same as that used for the voltmeter
connections (I3, I2, I1 from left to right).
M ax. measurable current with direct connection: 5A rms; for higher currents it is necessary to
use external CTs, whose transformation ratio can be set on one of the Setup menu pages.
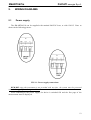
4.3
Installing the device on the panel
To install the device follow these steps:
1) set the device in the hollow frame and push till the surfaces touch one another
2) lock the red spring mounts in the locking slids
10
SMART96 Piú
DUCATI energia S.p.A.
3) push the red spring mounts to lock the frame to the device (to unlock the springs pull slightly
the spring vertical edge in order to unlock the blocking tooth and slide back the spring itself)
FIG 8 - Panel installation
FIG 9 - Red spring installation (1) and locking (2)
FIG 10 - Panel installation completed
11
SMART96 Piú
5.
5.1
DUCATI energia S.p.A.
WIRING DIAGRAMS
Power supply
The SM ART96 Piú can be supplied with nominal 240/230 Vrms, or with 120/115 Vrms as
shown in the following picture:
FIG 11 - Power supply connections
REMARK: since this instrument is not provided with any fuse, the system must be protected
with a 0.1 A type T fuse during installation.
After connecting to the power supply, the device is switched ON and the first page of the
measurement menu is displayed.
12
SMART96 Piú
5.2
DUCATI energia S.p.A.
Typical diagram for direct connection
FIG 12 - Direct three-phase connection on the voltmeter and ammeter inputs
IMPORTANT:
Check that the voltmeter and ammeter terminals are connected to the corresponding voltages
and currents on the line.
The passage of current in the correct direction is automatically determined by the analyser by
means of the voltage and current control of each phase at power up (see section 5.7): this means that
when installing you do not have to worry about direction of flow. In order for this procedure to
succeed, the user must respect the correct sequence in connecting the three-phase voltage wires to
the inputs and inserting the corresponding current wires in the ammeter ferrules.
13
SMART96 Piú
5.3
DUCATI energia S.p.A.
Typical diagram for indirect connection
FIG 13 - CT and VT indirect three-phase connection
IMPORTANT:
Check that the voltmeter and ammeter terminals are connected to the corresponding voltages
and currents on the line.
When using CT or VT transformers, it is necessary to set the transformation ratio from the
relevant page of the configuration menu (Setup). For instance, when using an 250/5 CT, the
transformation ratio (KA) to be set is 50 (see 6.4.3. and 6.4.4).
The passage of current in the correct direction is automatically determined by the analyser by
means of the voltage and current control of each phase at power up (see section 5.7): this means that
when installing you do not have to worry about direction of flow. In order for this procedure to
succeed, the user must respect the correct sequence in connecting the three-phase voltage wires to
the inputs and inserting the corresponding current wires in the ammeter ferrules.
14
SMART96 Piú
5.4
DUCATI energia S.p.A.
Typical wiring diagram with 2 CTs and 2 VTs
FIG 14 - Indirect three-phase connection with 2 CTs and 2 VTs
IMPORTANT:
Check that the voltmeter and ammeter terminals are connected to the corresponding voltages
and currents on the line.
When using CT or VT transformers, it is necessary to set the transformation ratio from the
relevant page of the configuration menu (Setup). For instance, when using a 250/5 CT, the
transformation ratio (KA) to be set is 50 (see 6.4.3 and 6.4.4).
15
SMART96 Piú
5.5
DUCATI energia S.p.A.
Typical wiring diagram for single-phase systems
FIG 15 - S ingle-phase connection
CAUTION:
When fitting you should arrange to feed the ammeter cable into the ferrule on the far right
corresponding to phase L1 and connect voltmeter cables to terminals L1 and N.
Then, set CFG = 13 on the relevant page of the setup menu in order to place the instrument in
the single-phase operating mode; the values of the quantities relating to phase L1 are displayed.
IMPORTANT:
When using CT or VT transformers, it is necessary to set the transformation ratio on the relevant
page of the configuration menu (Setup). For instance, when using a 250/5 CT, you should set a
transformation ratio (KA) of 50 (see 6.4.3 and 6.4.4).
16
SMART96 Piú
5.6
DUCATI energia S.p.A.
Typical wiring diagram for balanced three-phase systems
FIG 16 - Balanced three-phase connection
Having checked that all three-phase loads are balanced, is it possible to minimise system
installation costs using a CT on one phase (L1) only, thus avoiding the need to fit the other two on
the remaining phases.
The analyser needs to be set in the balanced three-phase mode by selecting CFG = 18 from the
relevant page of the setup menu and internal calculations shall be based on the assumption that the
currents of phases without CT are equal to those of phase L1 which is in fact fitted with one.
IMPORTANT:
When using CT or VT transformers, it is necessary to set the transformation ratio from the
relevant page of the configuration menu (Setup). For instance, when using a 250/5 CT, you should
set a transformation ratio (KA) of 50 (see 6.4.3 and 6.4.4).
5.7
Automatic detection of current’s direction
When powering up, as soon as the current is different from 0, the analyser will automatically
detect current phase shift (independently for each phase) as compared to the corresponding phase
i
voltage for certain periods. If it detects that the current is in opposition , it reverses the direction of
ii
flow of the current in question .
i
ii
When the phase angle is >90°, i.e. phase shift occurs in the second or third quadrant.
In a three-phase system, the instrument detects direction of flow of the current separately for all three phases, but the
automatic compensation function is enabled only after a current other than 0 has circulated in all three phases.
17
SMART96 Piú
DUCATI energia S.p.A.
This means that the fitter does not have to worry about the direction of the ammeter wiring or
set special configuration in the setup menu.
It should therefore be noted that the device works on two quadrants.
Please note that this option can be disabled using the corresponding menu in the setup pages. In
this case, using two SM ART96 Più installed in opposition, it could be measured the cogenerated
energy.
5.8
Cogeneration’s function
Using this functionality and a specific configuration of installation, it will be possible to detect
when each phase of a connected appliance is acting as load or as generator. Using this function it
will be possible to detect and count:
• Active absorbed energy for each phase an for the 3-phase system
• Reactive absorbed energy for each phase an for the 3-phase system
• Active generated energy for each phase an for the 3-phase system
• Reactive generated energy for each phase an for the 3-phase system
For a correct usage of this functionality it will be necessary to use two different SMART96 Più
both set with “Cogeneration enabled” (see for details the chapter 6.4.5), to avoid that the
automatic reversion of the currents direction restricts the instrument to work only on two quadrants,
and installed in opposition like the following figure
FIG 17 - Two S MART96Più connected in opposition for the Cogeneration measurement
18
SMART96 Piú
DUCATI energia S.p.A.
Setting for both instruments the cogeneration enabled, it will be restrict the TA direction and,
while the first SM ART96 Più counts only the input energy (absorbed by the user), on the contrary
the second counts only the cogenerated energy (generated by the user).
The first SM ART96 Più will measure the active energy and the reactive energy absorbed by the
user, while the second SM ART96 Più will measure the active energy and the reactive energy
generated by the user.
In this way, it will be possible to have an energy distribution on all the quadrants; particularly, in
all the possible states of the system, each SM ART96 Più will indicate a P.F.’s sign correct for that
function (user as load or as generator), even if the corresponding “twin” will indicate a sign that will
be however the opposite.
For a better understanding and in all the possible states, in the following figures will be
described in general all the different behaviours of the two described instruments.
FIG 18 - Pair of S MART96 Più for the measurement of the absorbed and generated energy
19
SMART96 Piú
6.
DUCATI energia S.p.A.
OPERATING INSTRUCTIONS
Following power up, the first measurement page will be displayed. The user can then scroll the
pages using the PAGE key and, when necessary, configure the device as described below.
6.1
Display test at power up
By pressing SELECT and powering up the instrument, all segments on the LCD display will be
lit to indicate it is working properly.
6.2
Default page
When powering up or after the keyboard has not been used for some time, the analyser will
show as default page a measurement page previously selected by the user in the setup menu. By
default, the page showing voltage, current, active energy and three-phase reactive energy page is
displayed, i.e. the page selected with PAG = 1 from the setup menu.
To display a different measurement page, proceed as follows (see section 6.4.11):
•
Go to the setup menu (simultaneously press the rapid access keys SELECT + PAGE )
•
Press the SELECT key to enter the setup menu
•
Press the PAGE key to move to the page where “PAG” is displayed
•
Press the SELECT key to define the number corresponding to the new default page
Finally, it should be remembered that selecting PAG = 0 will result in continuous scrolling of all
measurement pages, each one being displayed for approximately three seconds.
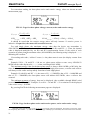
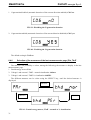
6.3
Measurement pages
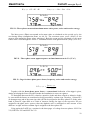
As shown in the following picture, the first page of the measurement menu contains:
•
centre top: L1 L2 L3 to indicate that the quantities are three-phase equivalents
•
the equivalent three-phase voltage
•
the equivalent three-phase current
•
bottom left: value of the three-phase active energy stored since the last energy reset. The active
energy is automatically indicated as kWh, then M Wh according to the accumulated value
•
bottom right: value of the three-phase reactive energy stored since the last energy reset. The
reactive energy is automatically indicated as kVArh, then M VArh according to the accumulated
value
20
SMART96 Piú
DUCATI energia S.p.A.
For convenient reading, the three-phase active and reactive energy values are shown on each
measurement page.
FIG 19 - Page for three-phase voltage, current, active and reactive energy
V3 ph−equiv . =
V12 + V 23 + V 31
3
kWh3 ph −equiv. = kWh1 + kWh2 + kWh3
I 3 ph−equiv . =
I1 + I2 + I3
3
kVArh3 ph−equiv . = kVArh1 + kVArh2 + kVArh3
It should be noted that the reactive energy meter will only increase if reactive power is
inductive: if capacitive, the meter will record no increase.
For each single phase, the maximum energy value that the device can accumulate is
4294.9M Wh (or M VArh) and relates to the measurement with KA and KV = 1. Then, the internal
value is displayed multiplied by set KA and KV transformation factors. If the result of such
operation is greater than the maximum value (4294.9M Wh), the following string is displayed “-----“
iii
indicating the overflow.
If exceeding such value, “rollover” occurs, i.e. the phase meter is reset (the display restarts from
0000).
Example: if KA = 20 and KV = 100 are set, phase meter rollover occurs every 8589934.59
M Wh, but the value displayed is “------“ when exceeding 4294.9 M Wh.
The maximum energy value for the three-phase meter is always 4294.9 M Wh (or M VArh), but
since the three-phase meter is always the sum of the 3 single-phase meters, overflow and rollover
will always occur earlier and separately from that of each single phase!
Example: if (with KA and KV = 1) the meter of L1 = 1500M Wh, that of L2 = 1600M Wh and
that of L3 = 2000M Wh, the three-phase meter will indicate 805.1M Wh, since a rollover has
occurred.
The minimum quantum of energy that can be displayed (also available through RS485 serial
protocol) is 1Wh * KA * KV. Example: if set KA = 30 and KV = 50 a variation of the displayed
value occurs every 1.50 KWh.
By pressing PAGE the following measurement pages are displayed:
FIG 20 - Page for three-phase active and reactive power, active and reactive energy
iii
Note that in this case the energy count is not lost but simply cannot be displayed. If wishing to know the value,
set temporarily KA and KV = 1, read the meter and multiply manually by KA and KV, then restore correct KA and KV.
21
SMART96 Piú
DUCATI energia S.p.A.
W3 ph −equiv. = W1 + W2 + W3
VAr3 ph−equiv . = VAr1 + VAr2 + VAr3
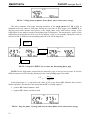
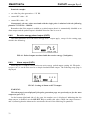
FIG 21 - Three-phase mean and maximum mean active power, active and reactive energy
The Mean power (Wm) corresponds to the mean value as calculated on the period set by the
user during Setup (configuration menu, see 6.4.12). The maximum mean power (M AX) is the
greatest from among the mean values calculated . Both the mean and the maximum of the mean
values can be reset through the “Reset 5” command from the configuration menu (Setup, see 6.4.1).
FIG 22 - Three-phase mean apparent power and maximum mean in VA ("UA")
FIG 23 - Page for three-phase power factor, frequency, active and reactive energy
P.F .3 ph −equiv. =
Pact3 ph− equiv.
Papp 3 ph−equiv.
Together with the three-phase power factor, a conventional indication of the sign is given,
aiming at helping the fitter to decide whether the installation is correct at a glance.
To distinguish between the PFs related to capacitive loads and those related to inductive loads,
by convention the former are considered as being preceded by a minus sign. Therefore, if phase PFs
are homogeneous and of the same sign, this will also be assigned to the three-phase PF; on the other
hand, if phase PF signs differ as a result of incorrect fitting, the signs of the respective PFs are
assigned to the phase active powers, then the algebraic sum is calculated to take account of the
different “weight” and the resultant sign is assigned to the three-phase PF.
Using again the PAGE key, continue in the three pages of voltage between phases: L1L2 for
V12; L2L3 for V23 and L1L3 for V13.
22
SMART96 Piú
DUCATI energia S.p.A.
FIG 24 - Voltage between phases, three-phase active and reactive energy.
The menu continues with pages showing quantities of the single phases L1, L2 or L3, as
indicated in the top centre of each page. Having accessed one of these pages, press S ELECT to
display power factor, instant active power of the single phase, active and reactive energy of the
single phase. Press again to return to the default page for that phase. The instant active power of the
single phase is shown always in W (even if the measure’s unit is not normally displayed), while in
the case of kW or M W the corresponding symbol K or M will be displayed.
PAGE
SELECT
PAGE
FIG 25 - Using the S ELECT key to enter the alternating phase page
NOTE: In the single-phase connection the alternative page is however not present, in fact the
different measures will be already displayed in the corresponding page of the menu.
P.F . phase =
Pact phase
Papp phase
In the phase pages, a [−] sign before the value of the power factor (PF) indicates that a load is
Ohmic-capacitive, but this does not imply that the PF is actually negative:
•
positive PF: Ohmic-inductive load
•
negative PF: Ohmic-capacitive load
FIG 26 - Page for phase 2 voltage and current, three-phase active and reactive energy
23
SMART96 Piú
DUCATI energia S.p.A.
FIG 27 - Page for phase 3 voltage and current, three-phase active and reactive energy
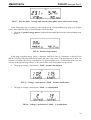
In the following page, according to the setting of the corresponding setup page (see chapter
6.4.6), three different types of measurements can be available.
1. The page of partial energy meters (displayed choosing PAr from the corresponding setup
menu)
FIG 28 - Partial energy meters
In the page of partial energy meter, a function similar to that of a tripmeter is shown. Press
SELECT to reset both the partial energy meter and start a new count. This function can be used, for
instance, to evaluate the energy consumption of a given machine cycle. At instrument power up, the
content of the partial energy meters is the same as that of the three-phase energy meters.
2. The page of voltage’s and current’s ThdF – normal visualisation
FIG 29 - Voltage’s and current’s ThdF – normal visualisation
3. The page of voltage’s and current’s ThdF - % visualisation
FIG 30 - Voltage’s and current’s ThdF – % visualisation
24
SMART96 Piú
DUCATI energia S.p.A.
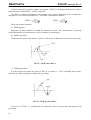
In the two previous pages the voltage’s and current’s ThdF (Total Harmonic Distortion Factor),
measured only on the phase L1, will be visualised.
The ThdF is a numerical indicator of the voltage’s and current’s distortion as due to harmonics
and equal to a crest factor normalised to 1. The ThdF is calculated as follows:
THDFV =
V peak
V RMS * 2
THDFI =
I peak
I RMS * 2
There can be three instances:
a) ThdF equal to 1
Represent an ideal situation in which the distortion is null. The measurement is perfectly
sinusoidal and there are no harmonics. Such a situation is seldom given.
b) ThdF lower than 1
In this case the positive and negative “peaks” of the wave are flattened (static power converters).
FIG 31 - Th dF lower than 1
c) ThdF greater than 1
It is the typical case when the angle of flow of a current is < 180° (switching power units,
actuators, etc.) this resulting in a high-peak wave shape.
FIG 32 - Th dF greater than 1
In the case of ThdF - % visualisation, the measured value is the previous, but expressed in
percentage.
25
SMART96 Piú
DUCATI energia S.p.A.
FIG 33 - Accessing the configuration or Setup pages
After all measurement pages, the setup menu access page is displayed. Press SELECT to enter
this menu and display the first of the available fields.
Unrestricted access to this menu is not available if a password has been previously set.
6.4
Configuration pages (Setup)
This menu allows the user to carry out instrument configuration, i.e. set the parameters
necessary for a given application. If you are on one of the measurement pages and want to gain
rapid access to the configuration menu, simply press the SELECT + PAGE keys simultaneously.
To increase values, press SELECT; hold down for rapid increase.
To decrease values, hold down SELECT and press and release PAGE for single step decrease;
holding down for rapid decrease.
To go forward one page at a time, press PAGE; hold down for fast-forward scroll.
To go back one page at a time, hold down PAGE in order to scroll back in page order.
The first time the configuration menu is entered, the password is disabled; the user can enter it
later, but then it will be requested every time this menu is accessed. To enter the password, press
SELECT key to increase the number, or SELECT + PAGE to decrease it. If the Password is
forgotten, an emergency procedure is possible (please contact your dealer or fitter). When the
password is enabled, the following screen is displayed:
FIG 34 - Accessing the configuration or Setup pages with password
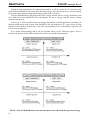
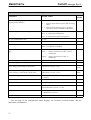
The following table contains the list of the available configuration options (left to right, the
second column contains acceptable values, the third column factory default values):
26
SMART96 Piú
DUCATI energia S.p.A.
Configuration menu
Parameter
Reset (resetting groups
restoring factory defaults)
Possible values
of measurements,
or 5
= resets the mean and max powers;
Factory
default
0
10 = resets the mean and max powers and the energy
values;
15 = resets the mean and max powers, the energy
values and restores the default configuration;
CFG (setting of the analyser configuration)
CFG = 8: three-phase configuration;
8
CFG = 13: single-phase configuration;
CFG = 18: balanced three-phase configuration
KV (VT) transformation ratio
1 to 500
1
KA (CT) transformation ratio
1 to 1000
1
Selection of cogeneration COG
COG = yes (cogeneration enabled);
no
GOG = no (cogeneration disabled)
Selection of the measures of the last measurements PAr
= visualisation of partial energy meters;
page
thd nor = voltage’s and current’s ThdF – normal
visualisation;
PAr
thd PEr = voltage’s and current’s ThdF - %
visualisation
Active Energy pulsed output (OUT1)
0.1 to 125 Wh / pulse (0.0 = disabled)
0.0
Reactive Energy pulsed output (OUT2)
0.1 to 125 Wh / pulse (0.0 = disabled)
0.0
Alarm output 1 (this page is displayed only if the The alarm can be linked to one of the 34 available 0
Active Energy pulsed output is NOT used)
measurem ents (see par. 6.4.9)
(disab.)
Alarm output 2 (this page is displayed only if the The alarm can be linked to one of the 34 available 0
Reactive Energy pulsed output is NOT used)
measurem ents (see par. 6.4.10)
(disab.)
PAG (default page)
1 to 15 (PAG=0: automatic scrolling of pages every 4 1
sec. approx.)
Calculation period for mean values (min.)
1 to 60 (minutes)
10
Baud rate for the RS485 serial interface
24, 48, 96 (e.g.: 96 stands for 9600 bit/s)
96
Address of analyser
with Ducati protocol: 1 to 98;
31
with Modbus-RTU protocol: 1 to 247
Protocol
0 = Ducati protocol;
0
1 = Modbus-RTU protocol
PAS (Password)
---; 001 to 999
--- (disab.)
The last page of the configuration menu displays the firmware revision number and the
instrument serial number.
27
SMART96 Piú
6.4.1
DUCATI energia S.p.A.
Reset
FIG 35 - Reset page
The following options are available:
a) Reset 5, i.e. Resetting the mean and max powers:
Press SELECT 5 times in a row, till the figure 5 is displayed in the numeric field. Then keep
pressing PAGE to get back to the measurement menu and wait for some seconds that the device
resets the mean and max powers and restarts.
b) Reset 10, i.e. Resetting the mean and max powers and the energy values:
Press SELECT 10 times in a row, till the figure 10 is displayed in the numeric field. Then keep
pressing PAGE to get back to the measurement menu and wait for some seconds that the device
resets the mean and max powers, resets the energy counters and restarts.
c) Reset 15, i.e. Resetting the mean and max powers, the energy values and recovering the
default configuration:
Press SELECT 15 times in a row, till the figure 15 is displayed in the numeric field. Then keep
pressing PAGE to get back to the measurement menu and wait some seconds for the reset of the
iv
values and the recovery of the "factory default" configuration parameters, i.e.:
•
Reset = 0 (none armed)
•
KV = 1
•
KA = 1
•
COG = no
•
Selection of the measures of the last measurements page = PAr
•
PLS= 0.0 Wh (pulsed output OUT1 for active energy disabled)
•
PLS= 0.0 VArh (pulsed output OUT2 for reactive energy disabled)
•
ALA = --- (alarm output to OUT1 disabled)
•
ALA = --- (alarm output to OUT2 disabled)
•
PAG = 1 (default page set as the first three-phase page)
•
min. = 10 (time of mean values calculation)
•
Baud rate = 96 (9600 bit/s)
•
Address of the analyser = 31
•
Prot = 0 (Ducati protocol)
•
CFG = 8 (analyser three-phase configuration)
•
PAS = --- if not yet set, otherwise, the current password.
Note therefore that Reset 15 DOES NOT remove the password set, if any.
iv
When using the Modbus_RTU protocol, with Reset 15 you bring the 6 configurable values back to the factory default
setting (2,4,6,8,10,12). Refer to the Modbus manual for any further inform ation.
28
SMART96 Piú
DUCATI energia S.p.A.
If SELECT is pressed a different number of times (e.g. different from 5, 10 or 15) and then
PAGE is pressed, the Setup menu is exit without modifying the active configuration.
6.4.2
Setting the instrument
Press the PAGE key to display the following setup menu page:
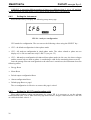
FIG 36 - Analyser configuration
CFG stands for configuration. The user can set the following values using the SELECT key:
•
CFG = 8: default configuration in three-phase mode
•
CFG = 13: analyser configuration in single-phase mode. The values related to phase one are
displayed, i.e. the user must use only I1 and V1 (see par. 5.5)
•
CFG = 18: analyser configuration in balanced three-phase mode (in this case, the three voltages
and the current only are used on phase 1, considering it valid for the remaining phases as well)
Once the passage from one configuration to the other one is carried out, the instrument clears the
following values:
•
Energy Reset
•
M ean Reset
•
Pulsed output configuration Reset
•
Alarm configuration Reset
•
Default page Reset to page 1
The set configuration is effective as soon as this page is exited.
6.4.3
Setting the KV (VT transformation ratio)
When taking indirect voltage measurements by using a VT it is necessary to set the relevant
transformation ratio. This is done from the page shown below; integers values between 1 and 500
are valid; the default value is 1:
29
SMART96 Piú
DUCATI energia S.p.A.
FIG 37 - Page for setting the VT transformation ratio
6.4.4
Setting the KA (CT transformation ratio)
When taking indirect current measurements by using a CT it is necessary to set the relevant
transformation ratio. This is done from the page shown below; integers values between 1 and 1000
(1.00k) are valid; the default value is 1:
FIG 38 - Page for setting the CT transformation ratio
IMPORTANT :
When installing the analyser for the first time, or when replacing a CT and/or VT, it is necessary to
set the fitting CT and/or VT transformation ratios: when different from the previous ones, they
modify the energy counting, adjusting it to the new ratios. Before completing the operations
mentioned above it is therefore advisable to take note of the energy values and to operate at least a
reset 10 to refresh all data and restart correctly with a new counting.
6.4.5
Setting the cogeneration mode
From this setup page the user have the possibility of enable or disable the cogeneration mode;
this is possible activating or deactivating the automatic detection of the CT current direction in the
instrument.
The deactivation of the automatic detection of the current direction is normally used only for the
measurement of the cogenerated energy, using two SM ART96 Più installed in opposition and both
set with this option. See for details the chapter 5.8.
Two different functioning modes are selectable:
30
SMART96 Piú
DUCATI energia S.p.A.
1. Cogeneration disabled (automatic detection of the current direction enabled): COG no
FIG 39 - Disabling the Cogeneration function
2. Cogeneration enabled (automatic detection of the current direction disabled): COG yes
FIG 40 - Enabling the Cogeneration function
The default setting is COG no.
6.4.6
Selection of the measures of the last measurements page (PAr, ThdF
normal or %)
The user have the possibility to select, among the following, the measure to display in the last
measurements page:
1. Partial energy meters: PAr
2. Voltage’s and current’s ThdF – normal visualisation: thd nor
3. Voltage’s and current’s ThdF % visualisation: thd PEr
The different measures can be select using the SELECT key, until the desired measure is
displayed.
SELECT
SELECT
FIG 41 - Partial energy meters, ThdF – normal or % visualisation
31
SELECT
SMART96 Piú
6.4.7
DUCATI energia S.p.A.
Active energy pulsed output (OUT1)
The analyser is provided with an output (marked "OUT1" on the terminal board) which can be
used to generate pulses in one of the following modes:
•
If the instrument setting is three-phase (CFG = 8 or CFG = 18), emitted pulses are related to the
three-phase active energy
•
If the instrument setting is single-phase (CFG = 13), emitted pulses are related to the L1 phase
energy
The page shown hereafter allows the user to decide, using the SELECT key, how many Wh of
active energy are to be associated to each pulse emission. The preset value is 0.0, meaning that this
output is disabled and choices can range between 0.1 and 125 Wh/pulse with KA = KV = 1; if the
selected value falls within the above-mentioned range this output is enabled as a pulsed output
and therefore cannot be used as an alarm output.
FIG 42 - Pulsed output associated with the active energy (Wh/pulse)
The following diagram shows the signal timing on terminals 1 and 2 of the PULSE output
OUT1 (or OUT2).
FIG 43 - S ignal timing on the terminals of the OUT1 output
Since the minimum time for generating a single pulse is 50ms (“open contact”) + 50ms (“closed
contact”), the result is that in one second a maximum of 10 pulses can be generated.
Take this into account when setting the number Wh/pulse. In fact, if the maximum sensitivity of
0.1 Wh/pulse is set, the instrument will be able to correctly generate pulses up to a three-phase
power of 3600W (with KA and KV = 1).
IMPORTANT:
The energy values refer to the three-phase voltage and current as directly read by the device
(i.e. with KA = KV = 1): the KA and KV values are therefore not accounted for. In order to
obtain true consumption figures, it is necessary to multiply the detected energy value by any
KA and KV values which may have been programmed.
32
SMART96 Piú
DUCATI energia S.p.A.
Practical example:
•
set value for pulse generation = 125 Wh
•
entered KV value = 20
•
entered KA value = 50
Consequently, the true value associated with the single pulse is obtained with the following
formula: 125*20*50 = 150kWh.
Remember that if the output is enabled as a pulsed output, then it is automatically disabled as an
alarm output and the pulsed output is disabled when the value is set to 0.
6.4.8
Reactive energy pulsed output (OUT2)
The same directions as for the active energy OUT1 output apply, except for the setting page,
which is the following:
FIG 44 - Pulsed output associated with the reactive energy (Varh/pulse)
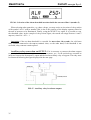
6.4.9
Alarm output (OUT1)
When the OUT1 output is not used as an active energy pulsed output (setting: 0.0 Wh/pulse see par. 6.4.7) it can be then used as a simple threshold alarm output. The following setup page is
displayed:
FIG 45 - S etting of alarm on OUT1 output
WARNING:
This alarm page is not displayed if the pulse generation page was previously set for the same
output (see par. 6.4.7).
On the bottom right-hand side of the page, the number zero is displayed, indicating that the
alarm output is disabled: use the S ELECT key to modify this value, which can range between 1
and 34, meaning that the alarm can be associated with one of the following 34 quantities:
33
SMART96 Piú
DUCATI energia S.p.A.
No.
Measure
1
2
3
4
5
6
7
8
9
10
11
12
13
14
15
16
17
18
19
20
21
22
23
24
25
26
27
28
29
30
31
32
33
34
Voltage phase 1 – neutral
Voltage phase 2 – neutral
Voltage phase 3 – neutral
Three-phase equivalent Voltage
Current of line 1
Current of line 2
Current of line 3
Three-phase equivalent Current
Line 1 active Power
Line 2 active Power
Line 3 active Power
Three-phase equivalent active Power
Line 1 reactive Power
Line 2 reactive Power
Line 3 reactive Power
Three-phase equivalent reactive Power
Line 1 Power Factor
Line 2 Power Factor
Line 3 Power Factor
Three-phase equivalent power Factor
Line 1 mean active Power
Line 2 mean active Power
Line 3 mean active Power
Three-phase equivalent mean active Power
Line 1 mean reactive Power
Line 2 mean reactive Power
Line 3 mean reactive Power
Three-phase equivalent mean reactive Power
DF: limit for mean three-phase active Power, calcul ated at 2 /3 of the mean period
DF: limit for mean three-phase apparent Power, calculated at 2 /3 of the mean period
DF: limit for mean three-phase active Power, calcul ated at 1 /2 of the mean period
DF: limit for mean three-phase apparent Power, calculated at 1 /2 of the mean period
DF: limit for mean three-phase active Power, calcul ated at 1 /3 of the mean period
DF: limit for mean three-phase apparent Power, calculated at 1 /3 of the mean period
In case of single phase configuration (CFG = 13), only the quantities related to phase 1 are valid
(therefore: 1, 5, 9, 13 etc. up to 25).
When selecting a quantity, the first threshold value suggested will always be half the full scale
value calculated including the KA and KV transformation ratio.
For example, if selecting the quantity “line 1 current”, we must set the value as 5 (using
S ELECT). After pressing PAGE to confirm our choice, a current value equal to half the full scale
will appear in the field on the right, as shown in the following figure:
34
SMART96 Piú
DUCATI energia S.p.A.
FIG 46 - S election of the alarm threshold associated with the current of line 1 (number 5)
When selecting other quantities, e.g. phase voltage, you may notice an inversion of the position
of the symbol “ALA” with its number; this is due to the position of the display segment related to
the unit of measure to be illuminated. Finally, using the SELECT key again, it is possible to vary
the threshold value; in the example of the previous figure, the current can range between 0 and 5
amperes, since KA = KV = 1.
Operation: if the set alarm threshold is exceeded for more than 10 seconds, the solid state
relay contacts connected to the output terminals close; on the other hand, if the threshold is not
exceeded, relay contacts remain opened.
Auxiliary relay connection on OUT1/2: If it is necessary to connect the alarm outputs
to great inductive loads, for example contactors ore actuators, etc., it will result always essential to
interpose between the instrument’s output and the load an auxiliary relay of support. The relay must
be connected following the figure displayed in the next page.
FIG 47 - Auxiliary relay for alarms outputs
35
SMART96 Piú
6.4.9.1
DUCATI energia S.p.A.
Alarms 29 ÷ 34: Disconnection Function (D.F.)
This function is used to manage a simple forecasting load-disconnecting algorithm, connected
to alarms on quantities 29, 31 and 33 which are a mean active power threshold and 30, 32 and 34
which are a mean apparent power thresholdv, respectively. The function means you can avoid
exceeding the mean power contractual value, since the alarm output can be used to disconnect a
load. The check is carried out on the energy accumulated over the mean period (the mean time can
be programmed as indicated in par. 6.4.12): in correspondence of the value set for the mean period
(at 1/2 of the set mean period, at 1/3 of the set mean period, or at 2/3 of the set mean period), the
instrument calculates the energy consumed and uses that trend to forecast whether the threshold will
be exceeded at the end of the period. If so, it enables the output. The last part of the period is
therefore an insensitive interval time. With this function there is the possibility to select fixed times
of intervention (fraction of the mean period), but however different amongst themselves. This
functionality determine a big flexibility in the controls setting, since for each alarm (OUT1 and
OUT2) is possible to select both the time and the value of the threshold of intervention.
Therefore you can choose for example different thresholds with the same period time, or the
same threshold with different time of activation, generating a consecutive activation of the two
alarm outputs, obtaining in this way a two steps control’s function.
At every new mean period, the alarm is reset.
The calculation is made on the active or apparent power, depending on whether the alarm setting
is 29, 31 and 33 or 30, 32 and 34.
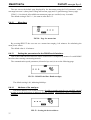
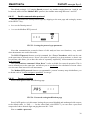
6.4.10
Alarm output (OUT2)
Similar directions as for the OUT1 alarm output apply, but in this case they apply to the setup
page for the reactive energy pulsed output.
The menu page to be displayed is the following:
FIG 48 - S etting of alarm on OUT2 output
Please note that it is possible to use one output for the energy count and, at the same time,
another one for an alarm.
6.4.11
Default page
FIG 49 - Default page
v
This quantity is mainly used in certain Eastern Countries.
36
SMART96 Piú
DUCATI energia S.p.A.
The user can set the default page displayed by the instrument using the PAG parameter, which
can range between 1 (three-phase voltage and current page) and 15 (partial energy meters page).
If PAG = 0 is selected, all available measurement pages are scrolled, every 4 seconds.
The default setting is PAG = 1, the same as after Reset 15.
6.4.12
Mean time
FIG 50 - Page for mean time
By pressing SELECT the user can set a mean time ranging 1-60 minutes for calculating the
mean power values.
The default value is 10 minutes.
6.4.13
Setting the parameters for the RS485 serial interface
One or more SM ART96 Piú devices can be connected to a computer by means of a serial RS485
interface, thus creating a measuring network
The communication speed parameter (in baud or bps rate) is set on the following page:
FIG 51 - RS 485 S erial line: Baud rate(bps)
The default setting is 96, indicating 9600 bps.
6.4.14
Address of the analyser
The device address is set on the next page; the address number must be very carefully entered
in order to avoid duplication of addresses already assigned. Duplication causes communication
problems.
FIG 52 - S etting the device address.
37
SMART96 Piú
DUCATI energia S.p.A.
The default setting is 31. Using the Ducati protocol, any number ranging between 1 and 98 can
be entered, while with the Modbus-RTU protocol, the number must range between 1 and 247.
6.4.15
Serial communication protocol
The user can choose the serial protocol type by skipping to the next page and setting by means
of the SELECT key:
•
0 to use the Ducati protocol
•
1 to use the M odbus-RTU protocol
FIG 53 - S etting the protocol type parameter
Note that communication protocols feature of this analyser have new functions, very useful
when instruments are used in networks.
The DUCATI protocol features a serial command, the “Freeze” broadcast, which can be sent
at the same time to all analysers to “freeze” the value of a quantity at a given moment, so that it can
be read later: this allows you to have the value of a quantity acquired by all instruments in network
at the same time.
The serial broadcast command “Mean Reset” is also available for network operation. This is
sent to all analysers at the same time and allows you to synchronise the calculation of mean values
over the same time interval for all instruments.
The Modbus-RTU protocol features a programmable “custom” memory map which allows you
to obtain a mix of six non contiguous quantities “in one go”.
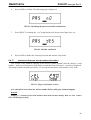
6.4.16
Password setting
Press PAGE again to enter the following page:
FIG 54 - Password setting/modification page
Press PAGE again to exit this menu leaving the password disabled and unchanged with respect
to the default value, i.e. PAS = ---. On the other hand, with SELECT you can enter a password
composed of three decimal digits ranging between 001 ÷ 999.
How to enable a password:
38
SMART96 Piú
1.
DUCATI energia S.p.A.
Press SELECT to set any password. In the example, the selected value is 003:
FIG 55 - S electing the password
2.
Press PAGE to confirm. The following page is displayed:
FIG 56 - Password, initial confirmation
3.
Press SELECT to change the “no” string displayed in the previous figure into “yes”:
FIG 57 - Password: yes
4.
Press PAGE to enable the selected password and exit this setup menu
Once the password is enabled, it is requested every time the user tries to enter the setup menu; if
an incorrect value is entered using SELECT, the systems goes back to measurement pages; on the
other hand, if a correct value is entered, the user can enter the setup menu and change configuration
parameters.
If the password is forgotten, an emergency procedure, via hardware, can be performed, to
disable the password.
How to remove a password:
5.
Enter the setup menu where the password will be requested; use SELECT to change
the values in the field on the right until three dashes are displayed:
FIG 58 - Disabling the password
39
SMART96 Piú
6.
DUCATI energia S.p.A.
Press PAGE to confirm. The following page is displayed:
FIG 59 - Disabling the password, initial confirmation
7.
Press SELECT to change the “yes” string displayed in the previous figure into “no:
FIG 60 - Disable confirmed
8.
Press PAGE to disable the selected password and exit this setup menu
6.4.17
Instrument firmware version and serial number
The version of the firmware running on the device (release number) and the analyser serial
number – made up of the numeric fields on the second line from the bottom – can also be displayed.
The example shows the firmware release, V2.90, and the instrument serial number, 14/01-1098
FIG 61 - Page for firmware release
It is advisable to note down the release number before asking for technical support.
Remark:
Dashes (----) instead of the serial number mean that internal memory data are lost; contact
DUCATI Energia for help.
40
SMART96 Piú
6.5
DUCATI energia S.p.A.
INI page(InI)
When installing the device for the first time, or following certain events or wrong manoeuvres,
you may find that the configuration is not correct. In this case, the instruments stops and the InI
page will be displayed, requiring initialisation, i.e. reconfiguration with the correct parameters.
Pressing any key will set the default parameters, which may be changed by the user as required. If a
code is also displayed (e.g. INI 3), this could help to explain which operation has provoked this
condition.
Note that “INI 6” indicates that the instrument’s non-volatile memory (E2prom) is not efficient
and, therefore, some data could be lost in time: contact Ducati Energia for maintenance.
41
SMART96 Piú
7.
DUCATI energia S.p.A.
PERFORMANCE AND TECHNICAL CHARACTERISTICS
7.1
Acquired quantities
Frequency
3 floating point digits (read from L1)
40 ÷ 500 Hz
Phase-to-neutral Voltage True rms
40 ÷ 500 Hz (-0.1dB)
Phase Current
True rms
40 ÷ 500 Hz (-0.1dB)
Active Power
Integral of the
voltage * current
instant
value
of 40 ÷ 500 Hz
M easurement rate = 2 per second
7.2
Calculated measurements
•
Three-phase equivalent voltage
•
Voltage between phases
•
Three-phase equivalent current
•
Three-phase power factor (with conventional sign)
•
Three phase active power
•
Three phase active mean power and maximum mean value
•
Three phase reactive power
•
Three phase apparent mean power and maximum mean value
•
Three phase active energy
•
Three phase reactive energy
•
ThdF
•
Power factor for each phase, with indication of the type of load, Inductive or Capacitive (with
conventional sign)
•
Active and reactive energy for each phase
Computation rate = 2 per second
42
SMART96 Piú
7.3
DUCATI energia S.p.A.
Interfaces
•
High-contrast backlit LCD display
•
2-key keyboard (keys: PAGE, SELECT)
•
Password protecting the access to setup data, with 999 possible values
•
RS485 Serial port (9600 bit/s max.) with galvanic isolation; available protocols
• M odbus-RTU Protocol
•
•
“DUCATI energia” Protocol
Two Pulsed Outputs or simple-threshold alarm outputs (“2P” model only)
• Contact:
Solid-state relay
• Pulse duration:
50 ms off (min) / 50 ms on
• M ax. frequency:
10 pulses/second
• Contact max. I:
100 mA (DC or peak AC)
• Contact max. V:
48 V (DC or peak AC)
• M ax. power dissipation (W):
450 mW
•
750 V max
Isolation:
7.4
7.4.1
Inputs
Voltmeter inputs
Range:
Max. non-destructive value:
Remarks
5 ÷ 300 V rms (L-N)
550 V rms
M easured between L1, L2, L3 and N
L-N input impedance:
greater than 2M Ω
7.4.2
Between each phase (L) and neutral (N)
Ammeter inputs
Range:
Overload:
Remarks:
50mA ÷ 5A rms
1.4 permanent
Current measured with built-in CTs
Max dispersed power
Condition
75mW
With Imax = 5A rms
Direction of current:
43
For each phase input
Detection and automatic adjustment at power up, independent for
each phase
SMART96 Piú
7.4.3
DUCATI energia S.p.A.
Out-of- range visualisation
For values outside the ranges indicated (i.e. 5% greater than full scale), the digits in number
fields are replaced by dashes (---).
7.5
Energy count
M ax value for the single phase energy
4294.9 M Wh (or M VArh)
with KA and KV = 1
M ax value for three-phase energy
4294.9 M Wh (or M VArh)
with KA and KV = 1
M in. quantum of energy that can be 1Wh (or 1VArh) x KA x KV
displayed (by means of display or through
serial line)
Beyond the max value, energy meters carry out a roll-over.
7.6
Configurable measurement mode
•
Three-phase
•
Single-phase
•
Balanced three-phase
7.7
Accuracy of the measurement
Voltages
± 0.25% ± 0.3% F.S.
Currents
± 0.25% ± 0.3% F.S.
Active power
± 0.5% ± 0.1% F.S. (from cosϕ = 0.3 Ind. to cosϕ = 0.3 Cap.)
Power factor (cosϕ)
± 0.5% ± 0.005 (from cosϕ = 0.3 Ind. to cosϕ = 0.3 Cap.)
Frequency
40.0 ÷ 99.9Hz: ±0.2% ± 0.1Hz
100 ÷ 500 Hz: ±0.2% ± 1 Hz
44
SMART96 Piú
7.8
DUCATI energia S.p.A.
Power supply
Voltage:
230 V rms (+15% -10%) /
240 V rms (+10% -15%)
Frequency:
Power
consumption
Fuse
Fit external fuse
45 ÷ 65 Hz
< 6 VA
T0.1A
115 V rms (+15% -10%) /
120 V rms (+10% -15%)
7.9
Operating Conditions
Operating temperature
0°C ~ 50°C
Relative Humidity
90% max.(non-condensing) at 40°C
Storage temperature
-10°C ~ 60°C
7.10
Normative references
•
Compliance with the following EU directives:
•
LOW VOLTAGE – EC directive No. 73/23/CEE: compliance with EN 61010-1 regarding
hygroscopic pre-conditioning, dielectric rigidity and residual voltage – Cat III
•
ELECTROMAGNETIC COMPATIBILITY – EC directive No. 89/336/CEE: compliance with
generic standard EN 61326-1 and in particular:
45
•
Flicker and voltage fluctuations
EN 61000-3-3
•
Harmonic distortion
EN 61000-3-2
•
Conducted and radiated emission
CISPR 16-1 – CISPR 16-2
•
Electrostatic discharges
EN 61000-4-2
•
Radiated immunity
EN 61000-4-3 – ENV50204
•
Surge
EN 61000-4-5
•
Conducted immunity
EN 61000-4-6
SMART96 Piú
7.11
DUCATI energia S.p.A.
•
Burst (fast transient)
EN 61000-4-4
•
Voltage dips and voltage variations
EN 61000-4-11
•
50Hz magnetic fields
EN 61000-4-8
Further information
•
Weight:
0,50 Kg
•
Dimensions:
length: 96 mm, height: 96 mm., width: 117 mm
46
SMART96 Piú
8.
DUCATI energia S.p.A.
TIPS FOR A CORRECT INSTALLATION
In order to avoid misreadings and miscalculations of the data processed by SMART96 Piú
beware of the following:
S ETUP
Both KV (voltmeter constant) and KA (ammeter constant) must be correctly entered to get a
correct calculation of the processed parameters. K expresses the ratio between the primary and the
secondary of the transformer, be it voltmeter or ammeter. Example: with 2000/5 CT, KA will be
2000/5=400.
INS TALLATION
Stick to the procedure as provided in the user's manual. As a rule, take special care that CT
polarity is respected. CT terminals are normally defined as S1 and S2. The cable circuit from the
CT to the ferrule of the SM ART96 Piú and back is thus to begin from S1 and to end on S2. The
SM ART96 Piú features a function consisting in the automatic adjustment of the CT to the current
direction. Therefore, any fitting mistake is automatically compensated. Anyway, it is always
advisable to check that the current is read in the right direction, since inverting the cable direction
entails a wrong calculation of the reactive energy which, when capacitive, is not measured by the
corresponding meter. In fact, as in the case of electricity meters, the device does not balance the
consumption of inductive reactive energy with the capacitive reactive energy. The problem is easily
identified if noting some reactive power kVAr and very low or zero reactive energy kVArh. It
should be remembered that in a system with Power Factor of 0.9, reactive energy kVArh amounts to
half of active energy kWh (VArh/Wh = 0.5); when Power Factor exceeds 0.9, this ratio decreases,
but will increase with Power Factor of less than 0.9.
Another possible error regards correspondence between CTs: as a rule, reference voltage V1 and
reference current I1 should be connected to line L1. If this requirement is not respected, the Power
Factor is wrongly calculated, leading to errors in the calculation of all quantities it contains (kW,
kWh, etc.). A good indicator of such problem may be a PF whose value differs greatly to that
usually found in the type of system on which the SM ART96 Piú has been installed.
REMARK on PF and Cosϕ
ϕ
SM ART96 Più provides accurate measurement of the Power Factor (PF), calculated as power
ratio:
P.F . =
Pactive
Papparent
It should be noted that this quantity corresponds to the Cosϕ, without harmonics or in normal
cases with limited distortion. When faced with high levels of harmonic distortion, the Cosϕ is
meaningless, since the phase shift for each order of harmonic components must de defined. In these
cases, it would be more appropriate to talk about Cosϕ1, i.e. the phase shift between the voltage
fundamental and the current fundamental, and therefore the phase shift between order “1”
harmonics. But this quantity does not contain details regarding the entire spectrum content of the
power, since it considers only that originating from the fundamental.
47
SMART96 Piú
DUCATI energia S.p.A.
The examplevi below shows a waveform in which the phase shift between voltage and current
fundamental is virtually none (Cosϕ1 = 0.990) (in fact, their peak occurs simultaneously), while the
Power Factor (PF) is calculated as 0.646.
vi
The measurements indicated are obtained using a high-range harmonic analy zer (B10) w ith DSP and FFT (F ourier
transform)
48
SMART96 Piú
DUCATI energia S.p.A.
DUCATI energia S.p.A. shall not accept no liability for damage or personal injury arising from
incorrect or improper use of its equipment.
In line with a policy of continuous improvement, DUCATI energia S.p.A. reserves the right to
implement changes to this manual without prior notice.
This manual refers to firmware versions V3.10 and higher.
Document code: SM ART96Più_ING_V101b.doc – Ver.1.01b – January 2003
Via M.E. Lepido, 182 - 40132 BO LOGNA – P.O. box 4052 Borgo Panigale
Tel.: 051 404140 - Fax: 051 402040 - WEB: www.ducatienergia.com
49