1
TRAVELTRAX DESKTOP
REPORTING
Training Guide v6.5
March 26, 2013
TABLE OF CONTENTS
Agenda...................................................................................................................................... 5
TRAVELTRAX Overview .......................................................................................................... 9
Agency ETL (DataMan) ............................................................................................................................. 9
Credit Card ETL (CreditCardMan) ........................................................................................................... 10
Process Scheduler (Auto Processor) ...................................................................................................... 11
Hotel Name Normalization....................................................................................................................... 12
Currency Converter (MoneyMan) ............................................................................................................ 13
TTX Desktop Reporting (TravelMan) ...................................................................................................... 14
Data Quality Manager (QualityMan) ........................................................................................................ 15
Airline Contract Management .................................................................................................................. 16
TTX Web Reporting (WebMan) ............................................................................................................... 17
Executive Overview Dashboard ........................................................................................................... 17
TRX Healthcare Reporting ................................................................................................................... 17
TRAVELTRAX Portal ............................................................................................................................... 18
Database Overview .................................................................................................................19
PNR ......................................................................................................................................................... 19
RELATIONAL DATABASES.................................................................................................................... 20
Primary Keys ........................................................................................................................................... 21
Entity Relational Diagram ........................................................................................................................ 24
Configuring ODBC and BDE ..................................................................................................25
Overview .................................................................................................................................................. 25
Layer Names ........................................................................................................................................... 26
Configure ODBC ...................................................................................................................................... 27
Configure BDE ......................................................................................................................................... 31
Point BDE aliases to ODBC connections ................................................................................................ 34
Create Reports ........................................................................................................................35
Introduction .............................................................................................................................................. 35
Main Menu Overview ............................................................................................................................... 36
Tool Bar ................................................................................................................................................... 37
Menu Bar ................................................................................................................................................. 39
Tools ........................................................................................................................................................ 40
Databases ............................................................................................................................................ 40
System Setup ....................................................................................................................................... 41
Licensing .............................................................................................................................................. 41
Help ...................................................................................................................................................... 42
Right Clicking Options.......................................................................................................................... 42
Report Options ..................................................................................................................................... 43
Master Data Dictionary ............................................................................................................................ 44
Profiles Overview ..................................................................................................................................... 45
Profile Exercise .................................................................................................................................... 45
Group Profile ........................................................................................................................................ 47
Reports Overview .................................................................................................................................... 48
Page 2
Confidential TRX, Inc.
Report 1 – Detail Report .......................................................................................................................... 49
Create Report ...................................................................................................................................... 50
Report Properties ................................................................................................................................. 50
Section Properties ................................................................................................................................ 51
Query ................................................................................................................................................... 52
Calculations ......................................................................................................................................... 53
Expression Builder ............................................................................................................................... 53
Filters ................................................................................................................................................... 54
Paradox Design Overview ....................................................................................................................... 57
Bands ................................................................................................................................................... 58
Containership ....................................................................................................................................... 62
Data Model ........................................................................................................................................... 64
Properties ............................................................................................................................................. 65
Report 1 Design ................................................................................................................................... 66
Report 2 – Summary Report.................................................................................................................... 80
Create Report ...................................................................................................................................... 81
Query ................................................................................................................................................... 82
Summary Types ................................................................................................................................... 82
Design .................................................................................................................................................. 85
Report 3 – Ranking Report ...................................................................................................................... 91
Create Report ...................................................................................................................................... 92
Query ................................................................................................................................................... 92
Ranking ................................................................................................................................................ 93
Design .................................................................................................................................................. 94
Create a Custom Calculation Field .......................................................................................................... 96
Report 4 – Multi-level Ranking Report .................................................................................................... 97
Create Report 4 ................................................................................................................................... 98
Query ................................................................................................................................................... 99
Design ................................................................................................................................................ 100
Linking Reports ...................................................................................................................................... 104
One to Many Link Overview ............................................................................................................... 105
One to One Link Overview ................................................................................................................. 105
Data Dictionary Help Pages .................................................................................................................. 106
Report 5 – Linking Report...................................................................................................................... 109
Query ................................................................................................................................................. 110
Design ................................................................................................................................................ 111
Create link in Paradox........................................................................................................................ 116
Delete Design ........................................................................................................................................ 116
Report 6 – One to One Link................................................................................................................... 117
Query ................................................................................................................................................. 118
Design ................................................................................................................................................ 120
Unioning................................................................................................................................................. 121
Page 3
Confidential TRX, Inc.
Report 7 - Union .................................................................................................................................... 122
Query ................................................................................................................................................. 122
Excel Design Overview.......................................................................................................................... 124
Detach Excel Design.......................................................................................................................... 126
Design ................................................................................................................................................ 126
Re-attach Excel Design ..................................................................................................................... 128
Report 8 ................................................................................................................................................. 130
Query ................................................................................................................................................. 130
Design ................................................................................................................................................ 131
Report 9 ................................................................................................................................................. 135
Query ................................................................................................................................................. 135
Design ................................................................................................................................................ 136
Batch Generator .................................................................................................................................... 141
Create a Batch Exercise .................................................................................................................... 142
Prompts ................................................................................................................................................. 144
Regular Prompts ................................................................................................................................ 144
Default Prompt ................................................................................................................................... 144
Pick List Prompt ................................................................................................................................. 145
Pick List report: .................................................................................................................................. 146
Char Index Prompt ............................................................................................................................. 147
SQL Statements .................................................................................................................................... 148
ISNULL .............................................................................................................................................. 148
Month ................................................................................................................................................. 148
Year.................................................................................................................................................... 148
Month and Year ................................................................................................................................. 148
Customization ........................................................................................................................................ 149
Calculations ....................................................................................................................................... 149
Filter Assist ........................................................................................................................................ 150
Reporting Periods .............................................................................................................................. 151
Category Editor .................................................................................................................................. 152
Lookups ............................................................................................................................................. 153
Lists .................................................................................................................................................... 156
Import/Export ..................................................................................................................................... 158
Portal .....................................................................................................................................160
Home Page ............................................................................................................................................ 160
Licensing................................................................................................................................................ 161
Documentation ...................................................................................................................................... 162
Create a Support Request ..................................................................................................................... 163
View an Incident .................................................................................................................................... 166
Search for an Incident ........................................................................................................................... 167
Report Examples...................................................................................................................168
Page 4
Confidential TRX, Inc.
Agenda
Day One
1. Introductions
2. Course Objectives
3. TRAVELTRAX Overview
4. Review of the data flow
5. Understanding relational databases
6. Understanding the Data Dictionary
7. A Tour of TRAVELTRAX Desktop Reporting
o Main Menu
o Menu and Toolbar options
8. Running a Report
9. Profiles
10. Exercise on your own – build a Profile
11. Create a detailed Report
o Properties
o Query
o Build a calculation
o Filtering using Filter Assist
12. Create the design for a detailed report.
o Paradox Report Design
o Field Tool
o Column Headings
o Report Totals
o Sorting in design
o Report Header and Footer
o Assign Report to Profile
Page 5
Confidential TRX, Inc.
Day Two
1. Review of yesterday
2. Create a summary Report
o Understand Query Calc
o Table Frame Tool
o Build a calculation in Design
o Add a graph
3. Create a ranking Report
o The Rank rules
o Use calculated field from Data Dictionary
4. Create a Batch
5. Create a multi-rank Report
o Group Band
o Page Break
6. Customization
o Building a Calculation in the Data Dictionary
o Create or modify report periods
o Category Editor
7. Lookups
o Build a Lookup
8. Troubleshooting and Tips
o Export
o Import
o Understanding Segment Data and City Pairs
Page 6
Confidential TRX, Inc.
Day Three
1. Review of yesterday
2. Understanding Linking
3. Create a one-many linked Report
o About DART sections
o Rules of linking
o Section filters vs. Global filters
o Designing with “Format, Layout”
4. Create a one-many linked ranking Report
5. Create a one-one linked Report
6. Understanding Unions
7. Modify the one-one linked Report to add section
8. Working with the Data Model
9. Create a cross-tab Report
10. Directed exercises (report builds)
Page 7
Confidential TRX, Inc.
Day Four
1.
2.
3.
4.
5.
6.
7.
Review of yesterday
Excel Designer
Basic Excel formulas
TRAVELTRAX Desktop Reporting and Excel (how they interact)
Introduction to macros
Build a two section Excel Design report with macros
Review / Exercise on your own
Day Five
1. TTX Portal
Licensing
Documentation
Support Requests
2. Incidents
3. Review of yesterday
4. Cover remaining items if required
5. Practice, Practice, Practice
6. Final Review
Page 8
Confidential TRX, Inc.
TRAVELTRAX Overview
Agency ETL (DataMan)
Agency ETL is the data management tool used to convert data from back-office systems into a format
that TRAVELTRAX Desktop Reporting can recognize and use. The menu options in Agency ETL provide
the user a high level of flexibility in customizing the way data is imported into TRAVELTRAX Desktop
Reporting.
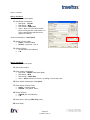
Request Options
This tab provides the ability to designate how
daily car rates are derived, how the Advance
Purchase Group data is calculated and
Archive Options.
Parsed Fields
This Tab provides a means to parse data from
an existing data field, provided by your backoffice system, and place it in a reserved
TRAVELTRAX Desktop Reporting field.
An example of this can be explained with the
data entry Low Fare. Normally, this value
resides in a field reserved for miscellaneous
information like a UDID (User Defined
Interface Data) or Sort field. TRAVELTRAX
Desktop Reporting has a Low Fare field within
its data dictionary that needs to be filled with
the data from the UDID field in order to be
used on a report that uses Low Fare. This is
accomplished by properly filling out this Tab.
Download Purge
These options are used when performing a download directly from your back-office or purging data
previously imported into the TRAVELTRAX Desktop Reporting database. Multiple profiles may be
created that limit the data downloaded from the back office system or purged from the TRAVELTRAX
Desktop Reporting database.
Internet Transfer
This tab permits users to utilize the Internet or Email to transfer files downloaded via Agency ETL
Download.
Page 9
Confidential TRX, Inc.
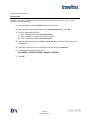
Credit Card ETL (CreditCardMan)
Credit Card ETL is the data management tool you’ll use for credit card consolidation, to perform the
following functions:
1. Extract data from credit card agency-provided transaction files.
2. Import credit card transactions to the TRAVELTRAX Client database.
3. Match Booking information (Air Ticket, Car and Hotel Reservations) to Credit Card Transactions
for subsequent reporting by the TRAVELTRAX Client reporting application.
Credit Card ETL Processing – Detailed instructions on how to successfully use Credit Card
ETL to import and/or transfer data for local or data consolidation services provided by TRX.
Match Process Descriptions – A high level explanation of the processes that occur during
the matching of booking information to credit card transactions.
Command Line Options – A complete list of command line options for users who may want
to call Credit Card ETL from other applications, such as Windows Scheduler.
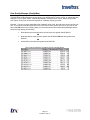
Credit Card Record Types – A list of all record types imported by the Credit Card ETL
application into the TRAVELTRAX Client database, a well as their corresponding Industry
codes and a brief description of each.
Page 10
Confidential TRX, Inc.
Process Scheduler (Auto Processor)
Process Scheduler is a highly scalable system for securely transferring, processing, and tracking file
based data in an automated, timely, and consistent manor. It includes a number of significant
enhancements that further automate manual processes, validate, track, and troubleshoot data feeds.
The Process Scheduler functions as both a set-up tool, for defining users and scheduled events, as well
as for monitoring the progress of those events. A scheduled event is set up in the Auto-Processor as a
Request Set, which is a set of parameters that defines the scheduled event – and includes the definition
of files to be received, where to find them, where to put them, how to process them, when to process
them, who to alert when the event occurs, etc.
The Process Scheduler performs 2 primary functions: it defines and monitors the receipt of Extract files
from an originator, such as a credit card agency or a travel agency, and it automatically schedules and
monitors the processing of those files by one of two applications – Agency ETL or Credit Card ETL. It is
typically used in a Service Bureau setting. The Process Scheduler capabilities include the following:
1. Allows Data Services personnel the ability to define Users, identify their email contact information,
and provide a means to enable their access to the Data Services file delivery mechanisms.
2. Monitors the receipt of data and transaction files from Travel Agencies, Credit Card providers,
etc. Works in conjunction with the TRAVELTRAX FTP monitor application, as well as third party
applications such as those provided by American Express for Secure Internet File Transfer
(SIFT).
3. Schedules the import of those files into a central database.
4. Initiate the data import processes, including the support of ancillary processes such as data
normalization, file movement, data verification, etc.
5. Provides a means for File Services Personnel to monitor the progress of each scheduled
process.
6. Provides a structured logging facility to document the progress of scheduled process and to
provide an audit trail that supports timely manual intervention and correction, in the event of
errors.
7. Provides a means of sending electronic alerts (emails) to multiple recipients as to the receipt of
files and the progress of each scheduled process.
Page 11
Confidential TRX, Inc.
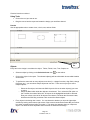
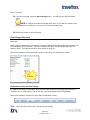
Hotel Name Normalization
The Hotel Name Normalization tool is used to take all the different ways that a hotel property can be
displayed in your data and change it into one standard hotel property name. The problem with hotel data
is that it comes from many different sources and those sources don’t always display the hotel information
the exact same way.
Agency Data – will pull hotel information
from the Hotel Table
Card Data – will pull hotel information
from the CCHotel and CCMerchant
Tables.
Preferred Data – will pull hotel information
from the PreferredHotels Table.
Property Data – will pull hotel information
from the HotelProperty Load Table.
Reparse Property – This process will
reparse the tokens in the HotelProperty
table that are used in the matching
process.
Property Updates check box – Will caus the HotelProperty table to be updated with the information from
the source data if the source data field has more information.
Property Inserts check box - This inserts new properties into the HotelProperty table.
Page 12
Confidential TRX, Inc.
Currency Converter (MoneyMan)
Currency Converter is a tool that will allow a user to enter currency code tables in their TRAVELTRAX
Desktop Reporting tables for specific dates.
Page 13
Confidential TRX, Inc.
TTX Desktop Reporting (TravelMan)
TRAVELTRAX Desktop Reporting is a data reporting tool. This tool allows your company to build your
own reports, as well as build profiles, lookup lists and batches. You will also be able to customize things
such as reporting periods, category names, and corporate structures.
Page 14
Confidential TRX, Inc.
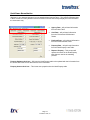
Data Quality Manager (QualityMan)
Data Quality Manager is a state of the art database management program. It complements
TRAVELTRAX Desktop Reporting by providing a user friendly tool to correct, modify, or append the data
displayed on your report results. Data Quality Manager fixes data at the source, before you generate
your reports, saving you the time and expense of constantly redoing your work.
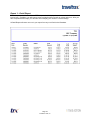
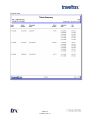
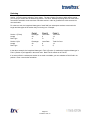
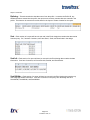
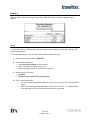
Example: You have a report that displays the Validating carrier code, the total ticket amount and the low
fare. If you want to keep that report like it is but you want to edit it just this one time so you can run the
report and ONLY return the following data, you can create those edits in Data Quality Manager and the
results will only display the following:
Delta Airline ticket amounts where the low fares were greater than $1000.00
OR
Northwest Airline ticket amounts greater than $1500.00 AND low fares greater than
$300.00
OR
United Airline ticket amounts greater than $1000.00
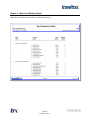
The result set might look something like the example below:
Page 15
Confidential TRX, Inc.
Airline Contract Management
TRX's Airline Contract Management program provides an end to end solution for companies to manage
their airline contracts; from planning, performance evaluation and utilization to compliance and ROI
measurement. The result is improved contracts and maximized savings through enhanced forecasting
and negotiation, on-going optimization, monitoring and compliance auditing.
The foundation of the Airline Contract Management System (ACM) is TRX's ability to acquire and
consolidate detail global travel spend data from virtually all travel data sources to TRX’s industry leading
travel management data warehouse. Traditional travel transaction data is sourced from the travel
management company(s)’s back office (post trip or ticketed data) and GDS systems (pre-trip or planned
travel).
ACM functions are enhanced with additional benchmark data such as QSI or Fair Market Share and
vendor provided data when available (flown or lifted data). The ability to integrate detail level data with
the terms and conditions of a company’s airline agreements distinguishes TRX from all others providing
airline contact management services. This important ACM feature allows travel managers to include all
the variables and factors that effect performance, compliance and ultimately savings to the company.
WebMan provides the ability to deliver real time, actionable information and analytics to decision makers.
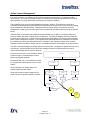
The Airline Contract Management (ACM) system is used to profile a corporation’s agreements with one or
more airlines. ACM is designed to accommodate multiple contracts for different airlines as well as
contract with multiple airlines or airline alliances.
Each contract has one or more exhibits to define
a particular type of contracted discount and
performance (goals) program.
Customer
Each exhibit has one or more markets to define
the city pairs and market specific rules for each
exhibit.
Contract
Contract
All rules defined in an exhibit apply to all
markets attached to that exhibit.
Exhibit
Goals and discounts may be assigned to an
overall contract or specific exhibits or markets.
Exhibit
Exhibit
Market(s)
Market(s)
Market(s)
Market(s)
Exhibit
Market(s)
Sales
Data
Flown
Data
Page 16
Confidential TRX, Inc.
TTX Web Reporting (WebMan)
TRAVELTRAX Web Reporting provides you the ability to access and run reports via the Internet. Reports
can be run quickly to share throughout your organization or set up as automated report distributions. With
Web Reporting access to your travel related information is limited only by your access to the Internet.
Reports are returned to you in numerous formats, including Microsoft Excel, a Printable Document Format
(PDF), Xcelsius dashboard (Adobe Flash).
Executive Overview Dashboard
This is a multitude of reports put together into one report. Not all clients purchase this report.
TRX Healthcare Reporting
Most of what we’ve already seen has been for travel information. We do also have one account that we
do reporting for that has health information. The tools are the same, but the data is different.
Page 17
Confidential TRX, Inc.
TRAVELTRAX Portal
The TRAVELTRAX Portal is a site for our clients to use to enter a support request when they have a
problem with any of the TTX applications. The client can then track the incident to find the status and
communicate with the TRX Helpdesk about the incident.
Page 18
Confidential TRX, Inc.
Database Overview
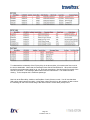
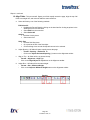
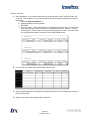
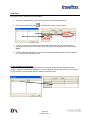
PNR
1.1HOWARD/JOHN S*110158-C85412
1 CO1687T 30JAN M SEAIAH*HK1 622A 1230P HRS /DCCO*ABQXNQ /E X
2 CO1079T 30JAN M IAHSAT*HK1 245P 351P HRS /DCCO*ABQXNQ /E O
3 CAR ZL 30JAN M HK1 SAT/03FEB/FCAR/ARR-4P/ID-78607 /DCZL
7471/CD-5555501/RET-5A/RG-¤USD39.50 UNL DY XD39.50 UNL XH13.17
UNL/AP-¤USD209.30 UNL 4DY 0HR 51.30MC/BS-26582183/RC-J2429/CF-6
70967723COUNT4 HHL ES HK1 SAT IN30JAN M-OUT03FEB 4NT 117734 EM /DCES
BASSY SUITES RIVE 1A0CA1X -1/ 164.00USD/AGT26582183/GCA5569240
000269179EXP 11 15-HOWARD/ID-244434061/CD-0001636000/C24H/ARR-1
551/DEP-0530/SI-RQ KING BD.SMK RM-CF-880027205 CO1136T 03FEB F SATIAH*HK1 530A 629A HRS /DCCO*ABQXNQ /E X
6 CO1705T 03FEB F IAHSEA*HK1 920A 1211P HRS /DCCO*ABQXNQ /E O
7 OTH AA 03MAY Q GK1 COMMENTS/BOEING TRAVEL APPRECIATES YOUR
TICKET RECORD
INV:2886517
CUST:412600
PNR:FSLQOT
TKT:0058737956395 ISSUED:23JAN12 PCC:9S20 IATA:26582183
NAME:HOWARD/JOHN
FF:COXW928381
NAME REF:110158-C85412
TOUR ID:800JV
FOP: CAXXXXXXXXXXXX9211*XXXX /052641 S
CPN A/L FLT
1
2
3
4
CO
CO
CO
CO
CLS DATE
1687
1079
1136
1705
BRDOFF TIME
T 30JAN SEAIAH 622A
T 30JAN IAHSAT 245P
W 03FEB SATIAH 530A
W 03FEB IAHSEA 920A
ST
F/B
STAT
OK
OK
OK
OK
TA7KN/8N02
TA7KN/8N02
LA7KN/8N02
LA7KN/8N02
OPEN
OPEN
OPEN
OPEN
Page 19
Confidential TRX, Inc.
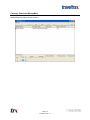
RELATIONAL DATABASES
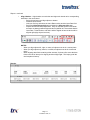
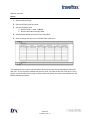
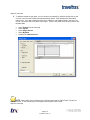
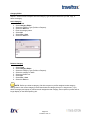
TRAVELTRAX Desktop Reporting retrieves the data it displays on reports from a relational database.
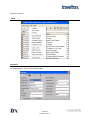
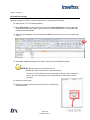
Within a database like Tman.db there exits TABLES where the data is stored. In TRAVELTRAX Desktop
Reporting those tables might look similar to the screenshot below.
These tables are similar to a spreadsheet in that the data is stored in a tabular format.
Each column in a table is referred to as a DATA FIELD.
Within each table you will normally find many data fields.
Each data field must have a unique name (e.g. TicketNum, ClientCode, etc.).
The rows are usually called RECORDS or ROWS and are made up of these unique fields.
Within each data field, the values for the rows are stored.
Each record contains a complete set of data for a specific occurrence. In the example above,
each row represents an individual ticket.
Page 20
Confidential TRX, Inc.
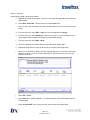
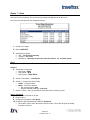
Primary Keys
Every table contained in a relational database must have one or more fields that will uniquely identify a
record. These unique fields are called the PRIMARY KEYS. Using our example above, the primary keys
for the invoice detail table is made up of the RecordKey, IataNum, and SeqNum.
RecordKey
Record key is a unique code assigned by the system when the data is being imported. It
is used to link together various tables such as invoices to transeg, car and hotel.
IataNum
IATA number is the main IATA number for the client which is filled in at time of extract
from the back office.
SeqNum
This sequence number links together the invoice header with detail records.
The purpose of these Primary Keys is critically important in a relational database structure. In the
Tman.db, there are many tables (e.g. Ticket, Car, Hotel, etc.). Each of these tables contains data from
thousands of invoices. However, each table contains only that portion of the invoice that is related to it.
(E.g. INVOICE DETAIL contains air travel data, CAR contains car rental data, and HOTEL contains data
on hotel stays.) To keep track (within the relational database) of which row of invoice detail data goes
with which row of car data and/or hotel data the Primary Key is used.
Page 21
Confidential TRX, Inc.
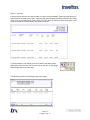
To understand the relationship of the Primary Keys in the above tables, let’s examine the first record in
the invoice detail table. Notice that the Passenger Name field is Estroff/Alison M. When this individual
booked her travel plans they called for air, car, and hotel reservations. Now look at the first record of the
hotel and car tables. The Passenger Name field entries are Estroff/Alison. The middle initial M is
missing. To the computer this is a different passenger.
Now look at the RecordKey, IataNum, and SeqNum of each of these records. You will see that these
field entries match between the tables. Using these unique Primary Keys, the computer is able to select
the matching car and hotel records that go with Alison Estroff’s invoice detail (ticket) record.
Page 22
Confidential TRX, Inc.
Automated Global Travel Data Consolidation
Page 23
Confidential TRX, Inc.
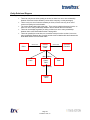
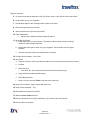
Entity Relational Diagram
This diagram shows you the basic relationship structure of our 5.03 database.
There can only be one client (code) per invoice so there is a one to one relationship
between Client and Invoice Header (a client is the company, not the passenger).
There is only one set of common remarks per client, so there can only be on set of
common remarks per invoice header.
The Invoice Detail table holds ticket data. There can be multiple tickets per invoice, so
there is a one to many relationship between Invoice header and Invoice Detail.
There can be multiple segments per ticket, so there is a one to many relationship
between the Invoice Detail table and the Transeg table.
There can possibly be more than one car and/or hotel per invoice so there is a one to
many relationship between the Car table and the Invoice Header table and between the
Hotel table and the Invoice Header table.
One to One
Client
Invoice
Header
Table
One to One
One to Many
Hotel
Table
Invoice
Detail
Table
One to Many
Transeg
Table
Page 24
Confidential TRX, Inc.
Car
Table
Common
Remarks
Configuring ODBC and BDE
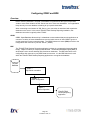
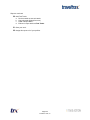
Overview
Microsoft SQL Server
Data is stored in databases. The data in a database is organized into the logical components
visible to users. Each instance of SQL Server has one or more user databases. Your organization
likely has only one user database containing all your post-ticketed data.
When connecting to an instance of SQL Server, your connection is associated with a particular
database on the server. In the normal TRAVELTRAX Desktop Reporting installation, this
database connection is typically called “TMAN”.
ODBC
ODBC - Open Database Connectivity is a database access standard that permits applications to
connect to a variety of external database servers and other sources of data. ODBC's goal is to
provide seamless access to enterprise data. The ODBC data source name (DSN) will refer to the
configuration that connects to your SQL Server (“TMAN”).
BDE
The TRAVELTRAX Desktop Reporting application is written in a programming language called
Delphi. Delphi is made by a company called Borland. The Borland Database Engine (BDE) is
what Delphi uses to access desktop and client/server databases. The BDE alias refers to the
configuration that connects to your ODBC data source name. It is the BDE alias that is used
within the TRAVELTRAX Desktop Reporting application to recognize the database.
Physical
Database
“TMAN” =
SQL Server connection
“TMAN5” =
ODBC configuration
“TMAN” =
BDE configuration
TRAVELTRAX
Desktop Reporting
application
Page 25
Confidential TRX, Inc.
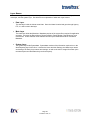
Layer Names
When connecting to a client, you have three possible connections: a connection to the data layer, the
meta layer, and the system layer. See below for an explanation of what each layer houses:
Data Layer
The data layer holds the clients actual data. Once their data is loaded and goes through Agency
ETL, it is held on their data layer.
Meta Layer
The meta layer holds the Metadata. Metadata consists of the system files required for application
operation. It houses the Report Name, Report Definition, Report Design, Data Dictionary, and
Calculations. A table that lists all the tables that make up the database would be considered
Metadata.
System Layer
The system layer holds Systemdata. Systemdata consists of the information required to run the
Web Reporting site for the client. It houses the Users and their Settings, the Meta Layer names
and settings, the Entity Layer names and settings, as well as the client’s usage information (who
ran what reports and what dates they ran those reports).
Page 26
Confidential TRX, Inc.
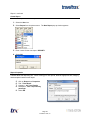
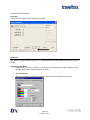
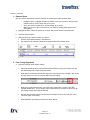
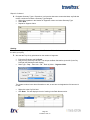
Configure ODBC
In this step you are creating the connection to the server as well as a connection to the client’s database
on that server.
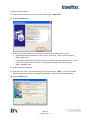
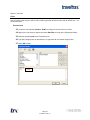
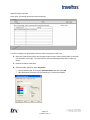
1. On your Desktop, click the BDE Administrator icon (if it’s not on your desktop, go to Start – Control
Panel).
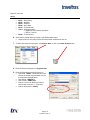
2. From the menu bar, select Object (or right-click on the
Database tab) and select ODBC Administrator.
If you don’t see these options when selecting Object on
the menu bar, make sure that you’re on the Databases
tab. If you’re not, click on the Databases tab and do this
again.
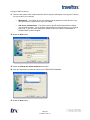
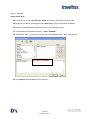
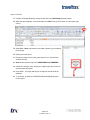
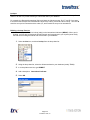
3. From the ODBC Data Source Administrator window, select the System DSN tab.
4. Select the Add button.
Page 27
Confidential TRX, Inc.
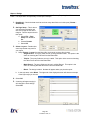
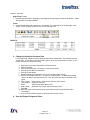
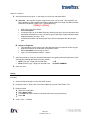
Configure ODBC continued
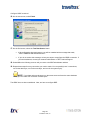
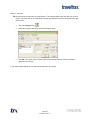
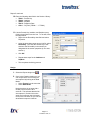
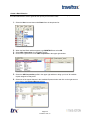
5. Select the driver for which you want to set up a data source - SQL Server.
6. Select the Finish button.
7. In the Create a New Data Source to SQL Server window, give the data source a name.
Our standard naming convention is client’s name_ layer name_ Server number (example:
MOOL_Data_899).
If the data and meta layers are on the same server and have the same database name, you can
create one connection for both of them. Just put that information in the name (example:
MOOL_DataMeta_899)
8. Enter a description (optional).
9. Enter the server name or select the server from the drop-down list. NOTE: If you don’t know the
server number/name, contact your network administrator or TRAVELTRAX technical support.
10. Select the Next button.
Page 28
Confidential TRX, Inc.
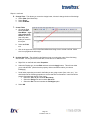
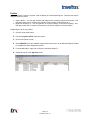
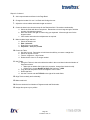
Configure ODBC continued
11. There are two options under ‘How should SQL Server verify the authenticity of the login ID?’ Use the
one you need for your company.
Windows NT – This option will use your network login & password to check and see if you
have permission to connect to the server you added.
SQL Server authentication – This opens up the Login ID and Password fields to display
(see screenshot below). This is the login and password to access the server you’re trying to
connect to. If you don’t know what that is, please contact your network administrator or
TRAVELTRAX Technical Support.
12. Select the Next button.
13. Select the Change the default database to checkbox.
14. From the drop-down list, select the name of your TRAVELTRAX database.
15. Select the Next button.
Page 29
Confidential TRX, Inc.
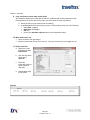
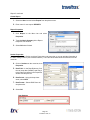
Configure ODBC continued
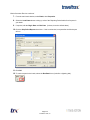
16. On the next screen, select Finish.
17. On the final screen, select the Test Data Source button.
If the configuration is properly test up, you will be rewarded with a message that reads,
‘TESTS COMPLETED SUCCESSFULLY’.
If you do not receive this message, review your steps to reconfigure the ODBC connection. If
you need assistance, contact your network administrator or TRX Technical Support.
18. Select OK on the following screens until you return to the BDE administrator window.
19. Repeat these steps for every connection you need to make. You can possibly have 3 connections;
one for the data layer, one for the meta layer, and one for the system layer).
NOTE: If your data and meta layers are on the same server and have the same database
name, you can create one connection for both layers.
The ODBC has now been established. Next, we have to configure BDE.
Page 30
Confidential TRX, Inc.
Configure BDE
Normally, your system is built with 3 BDE aliases as defaults: TMAN for the data layer, TMAN_META for
the meta layer, and TMAN_SYSTEM for the system layer. You can use these BDE aliases and just point
your connections to them, or you can create new BDE aliases for each of your layers.
To create a BDE alias, follow the steps below:
Create BDE Alias
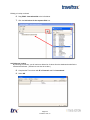
1. In the BDE window, click on the Databases tab. You should see your ODBC aliases.
If your ODBC alias does not appear, right-click on the Databases tab and select Refresh (or
close and reopen BDE).
2. Right-click on the ODBC alias name for the correct layer.
3. Select Save As…
4. The Save as window defaults to show the same name. Change the name to the BDE name you
want displayed (see example below).
5. Select OK.
Page 31
Confidential TRX, Inc.
Configure BDE continued
Make sure the settings for this BDE are correct by going through the following steps:
Definitions of BDE
6. The new BDE alias name is now included in the list. Click on the BDE alias to display the
definitions (settings).
7. On the Definition tab, change the parameters for the following::
BLOB SIZE = 1000
BLOBS TO CACHE = 1024
8. Repeat steps 6-7 for each BDE alias.
9. Select the Configuration tab.
10. From the Configuration tab, expand Systems by clicking the plus sign (+) to the left of it.
11. Click on INIT.
Page 32
Confidential TRX, Inc.
Configure BDE continued
12. On the Definition tab, change the parameters
as follows:
LOCAL SHARE = FALSE
MAXBUFSIZE = 16384
MAXFILEHANDLES = 512
MEMSIZE = 205
MINBUFSIZE = 2048
SHAREDMEMLOCATION = 4E90
SHAREDMEMSIZE = 65536
13. From the Configuration tab, expand Configuration, Drivers, and
Native by clicking the plus sign (+) to the left of each.
14. Select Paradox.
15. On the Definition tab, change the parameters as follows:
NET DIR
BLOCK SIZE
LEVEL
C:\Users\Public (Windows7)
C:\ (Windows XP)
16384
7
16. From the toolbar, select the Apply icon (blue right-curved arrow)
Page 33
Confidential TRX, Inc.
Point BDE aliases to ODBC connections
In order to connect to the correct server and database, your BDE aliases need to be pointed to the correct
ODBC connections. Follow the steps below to point the BDE aliases to the correct ODBC connections for
all layers needed:
1. Click on the BDE alias for your data layer (example: TMAN).
2. Click on the ODBC DSN in the right column.
3. Click the drop down and select the correct connection for the data layer for this client.
4.
5.
6.
7.
Click the apply button
and click OK.
Click on the BDE alias for your meta layer (example: TMAN_META)
Click on the ODBC DSN in the right column.
Click the drop down and select the correct connection for the meta layer for this client.
8. Click the apply button
and click OK.
9. Click on the BDE alias for your system layer (example: TMAN_SYSTEM).
10. Click on the ODBC DSN in the right column.
11. Click the drop down and select the correct connection for the system layer for this client.
12. Click the apply button
and click OK.
NOTE: If you only have one ODBC connection for both the data and the meta layer, you still
have to connect the BDE alias for the data layer and the BDE alias for the meta layer to that connection.
NOTE: You’ll always have one BDE alias for the data layer and one for the meta layer.
Page 34
Confidential TRX, Inc.
Create Reports
Introduction
TRAVELTRAX Desktop Reporting is a data reporting tool. This tool allows your company to build your
own reports, as well as build profiles, lookup lists and batches. You will also be able to customize things
such as reporting periods, category names, and corporate structures.
During implementation, TRX will work with you to download and configure everything needed for this
system to work. TRX will also work with your company to create your Data Dictionary according to your
unique data.
During this training, you will learn how to do the following:
Create queries
Design reports using the Paradox design tool (PDF)
Create Profiles
Create and run Batches
Create a Lookup
Create a List that can be used when creating your query
How to customize your category names and reporting periods
How to Import and Export reports for troubleshooting
NOTE:
The training will be conducted using a training database and will, therefore, not have the same Data
Dictionary as your company.
Page 35
Confidential TRX, Inc.
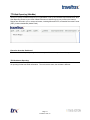
Main Menu Overview
The Main Menu is the primary operating screen for TRAVELTRAX Desktop Reporting. From it, you
initiate most of the main functions within the program. It provides an easy to read platform that displays
information in a standard windows format; customizable to your needs.
The following information is provided to enhance the learning process within the TRAVELTRAX training
environment. If you require detailed information about a specific TRAVELTRAX function, please refer to
the TRAVELTRAX User Guide.
Main Menu
Page 36
Confidential TRX, Inc.
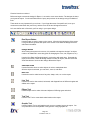
Tool Bar
The Tool Bar is a shortcut method of performing many of the functions associated with the main menu.
Exit TRAVELTRAX – This closes TRAVELTRAX and returns to Windows.
New – This displays a drop-down list to choose new Report, Profile, Batch, Lookup, List,
Dictionary, and Script.
Copy – Allows you to copy any highlighted Report, Profile, Batch, Lookup, List, Dictionary,
and Script.
Delete - Allows you to delete any highlighted Report, Profile, Batch, Lookup, List, Dictionary,
and Script.
Data Dictionary – Displays the master Data Dictionary (more information to follow).
TRAVELTRAX Export - Allows you to export to a directory of your choice any highlighted
Report, Profile, Batch, Lookup, List, Dictionary, or Script.
TRAVELTRAX Import - Allows you to import previously exported Reports, Profiles, Batches,
Lookups, Lists, Dictionaries, or Scripts.
Run – Provides a quick method to generate any highlighted report.
Page 37
Confidential TRX, Inc.
Toolbar continued
The following seven icons allow you to display any combination of Reports, Profiles, Batches, Lookups,
Lists, Dictionaries, and Scripts in the main window.
Show Reports – Will display a list of all reports each user is allowed to see.
Show Profiles – Will display a list of all profiles each user is allowed to see.
Show Batch Requests – Will display a list of batch requests.
Show Lookups – Will display a list of lookup tables.
Show Lists – Will display customized lists that can be used when building a query
Show Dictionaries – Will display a list of dictionaries.
Show User Exit Scripts – Will display a list of exit scripts
Views – Drop-down list to choose the way you want to display your Reports, Profiles,
Batches, etc. The options are:
Large Icons
Small Icons
List
Details
Arrange (By Name, By Description, By Category, By Type, and By Date)
Page 38
Confidential TRX, Inc.
Menu Bar
The Menu Bar accomplishes many of the same functions as the Icon Bar, but requires more steps.
However, there are other functions that are only available from the Menu Bar. A description of the
functions that will be covered in training follows:
File
New – From the New icon, click on the drop-down menu to create the following:
Reports
Profiles
Batches
Lookups
Lists
Dictionaries
Scripts
Open, Copy, Delete
1. To open, copy, or delete a file (report, lookup, etc.), click on that file.
2. Select File on the menu bar.
3. Select Open, Copy, or Delete. This will either open, copy, or delete the file you have
highlighted.
View
The View Drop Down list accomplishes
the same function as the icons covered
earlier. It changes how you display the
lists of Reports, Profiles, Batches, etc.
Refresh is used to update the main
window. When you create a new
Report, Profile, Batch, etc. it will not be
visible until you select Refresh. You
can also select the F5 keyboard key.
Page 39
Confidential TRX, Inc.
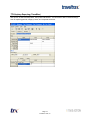
Menu Bar continued
Tools
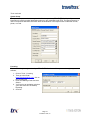
Databases
Use this window to configure the databases TRAVELTRAX is connected to. Normally, this only needs to
be completed when you first install TRAVELTRAX.
Page 40
Confidential TRX, Inc.
Tools continued
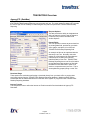
System Setup
The system setup screen is also completed the first time you setup TRAVELTRAX. Much of the
information is used for product identification when you are coordinating with TRX. The Export Directory is
used in conjunction with Batch Generator when the destination of the report results is other than screen,
printer, or e-mail.
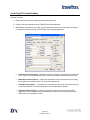
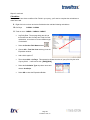
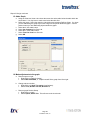
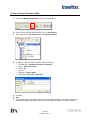
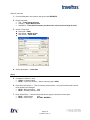
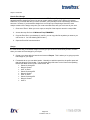
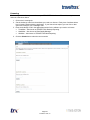
Licensing
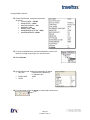
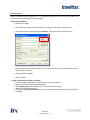
This is used during the registration of your TRAVELTRAX software. When you need to register your
software,
1. Click on Tools – Licensing
2. Then go to the Portal
https://portal.traveltrax.com/, click on
the Licensing tab.
3. Enter the Challenge Code and click
Submit.
4. You’ll receive an activation code that
you’ll then enter here in Desktop
Reporting.
5. Click OK.
Page 41
Confidential TRX, Inc.
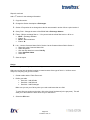
Help
This is a standard Windows help menu that will assist you in finding answers to your TRAVELTRAX
questions.
Right Clicking Options
A. When you right click on a batch or a profile, TRAVELTRAX allows you to do the following:
Edit – Brings up the window associated with the item you chose so you can make changes to it.
Copy – Allows you to make an exact copy of the selected item.
Delete – Removes the selected item from TRAVELTRAX.
Export – Activates the export window.
B. When you right-click on Lookups and Lists, TRAVELTRAX allows you to edit, copy, or delete.
C. When you right-click on Dictionaries, TRAVELTRAX allows you to edit or delete.
Page 42
Confidential TRX, Inc.
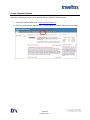
Report Options
When you right-click on a report, you get a list of options associated with Reports. Many, like Copy and
Delete, have already been covered. Below are the other options:
Edit Query – Opens the query window for the report you have selected so you can make
changes to it.
Edit Design – Opens an existing report design or allows you to create a new one if one doesn’t
already exist.
Delete Design – Deletes any existing design for the selected report.
Assign To – Allows you to assign reports to existing Profiles without having to open the
designated Profile.
Run – Generates the selected report to the screen for the default date period you’ve setup in the
master Reporting Periods window. This report will include data for all clients by default.
Run With – Same as Run, except the report pulls data for the Profile you select.
Export Report – Activates the export window.
Page 43
Confidential TRX, Inc.
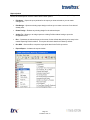
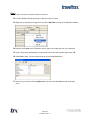
Master Data Dictionary
The Data Dictionary is used extensively throughout TRAVELTRAX. It contains fields from each of the
tables in your database. These fields directly correspond to data element columns within the table. Your
company’s Master Data Dictionary can be accessed from the Main Page in Desktop Reporting. Click on
the Data Dictionary icon. You can then click on the Data Dictionary icon.
Example: When you use ID021 - VendorName in a report, you are simply asking to pull selected data
st
from the 21 column in the Invoice Detail table of your database and the column is called VendorName.
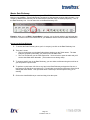
How to use the Data Dictionary
1. To access the Data Dictionary when you’re in a report, just click on the Data Dictionary icon.
2. There are 2 views:
The List view shows you the data fields without showing you the Table names. The data
fields are grouped by their table, you just don’t see the table name.
The Tree view shows you the Table names first. You then have to open the table and you’ll
see the data fields within that table. (This is what we use during class).
3. To locate a specific item in the Data Dictionary, you can either scroll down using the scroll bar or
you can perform a quick locate.
4. To perform a quick locate, left click on any item in the Data Dictionary and type the first one or
two letters of the field # you are looking for. This will take you to the first occurrence of the field #
starting with those letters. Then just scroll down a short way to find the specific entry you’re
seeking.
5. Click on the data field # that you need and drag it into the report.
Page 44
Confidential TRX, Inc.
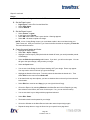
Profiles Overview
The building of Profiles is critical to the generation of Reports in TRAVELTRAX. If you want to run reports
for a specific client, agent, group, or your company as a whole, build a Profile for that client and/or group
and/or company.
A Profile can be defined with any field from the Data Dictionary: Client codes, agent sines, passenger
names, employee numbers, region codes, location names, etc…
Profiles can be defined with multiple values. For example, a profile with multiple agent codes or a Profile
with multiple account numbers is a group because all data is consolidated.
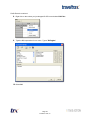
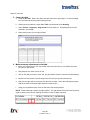
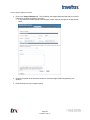
Profile Exercise
In this exercise you will build a company profile based on a location. Let’s say we want this profile for the
Arlington, Va office of our company.
1. Select the New icon drop-down arrow.
2. Select Profile.
3. When the new Profile window appears, type.
4. Select OK.
5. Fill in the appropriate
text boxes:
a. Click in the
description box and
type Arlington
office.
b. Click in Heading 1
and type your
company name.
c.
Click in Heading 2
and type your
Profile Name
(Arlington)
6. Click on the Data
Dictionary icon to
make it appear.
7. Using the Data
Dictionary, locate CL007 - City and drop it in the first column of filters.
Page 45
Confidential TRX, Inc.
Profile Exercise continued
8. Right click on the column you just dropped CL007 into and select Edit Filter.
9. Type the SQL expression for one value. Type = ‘Arlington’
10. Select OK.
Page 46
Confidential TRX, Inc.
Profile Exercise continued
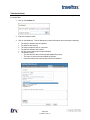
Group Profile
Let’s say your company does travel for many different corporate clients and you sell them a specific group
of reports. You’d like a profile that will only access those corporate clients. Here is how to create a
profile for more than one value.
1. Select the New icon and then Profile from the drop-down list.
2. When the New Profile window appears, type Corporate Clients then select OK.
3. Fill in the appropriate text boxes:
Click in Description and type Corporate Clients.
Click in Heading 1 and type your company’s name.
Click in Heading 2 and type Corporate Clients.
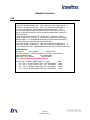
4. Using the Data Dictionary locate CL001 - ClientCode and drop it in the first column of the
filters window.
5. Right-click on the column you just dropped CL001 into and select Edit Filter.
.
6. In the Expression Builder window, type
IN (‘B20660’,’0L00854’,’0L00856’,’5R06200’,’6802822’)
7. Click OK.
Page 47
Confidential TRX, Inc.
Reports Overview
In this class, you will learn the process of building custom reports. In each report, you will learn different
procedures and techniques important in building any report. The process of learning these reports is
progressive. The techniques learned in each successive report are carried over to the next report.
You will learn what the Report Properties are used for and what the Section Properties are used for. You
will also learn how to add query fields and filters. Then you will learn how to use Paradox to design PDF
type reports and you will learn how Excel design works with Desktop Reporting.
You will build 9 reports in all:
Detailed Report
Summary Report
Ranking Report
Summary Ranking Report
One to many Linked Report
One to one Linked Report
Unioning Report
Crosstab Designed Report
Excel Designed Report
Page 48
Confidential TRX, Inc.
Report 1 – Detail Report
The first report you will build will be a DETAIL report. It will display selected transaction information at the
invoice level. In addition, you will learn to remove voided invoices as well as cruises and tours. After you
have completed these steps, you will learn how to display your results in a custom design.
A Detail Report will return one row in your report for every row it finds in the Database.
Page 49
Confidential TRX, Inc.
Report 1 continued
Create Report
Here are the steps to create a new report:
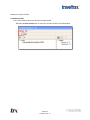
1. Select the New icon.
2. Select Report from drop-down menu. The New Report pop-up window appears.
3. Enter a name for the new report: REPORT1
4. Select OK.
Report Properties
Report properties will set up what the customer will see if the report is going to be used on the
TRAVELTRAX Web Reporting site. When creating your own reports, enter the appropriate title, category
and description based on each report.
5.
6.
7.
8.
Click on Report then Properties.
Title –Ticket Detail
Category – Air Travel Details
Description - Fare comparison by
passenger
9. Select OK.
Page 50
Confidential TRX, Inc.
Report 1 continued
Section Properties
Section Properties will set up the date properties, links, unions, etc for each section of a report. Since a
report can have more than one section when needed, these properties could possibly be different for the
different sections.
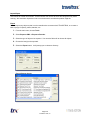
10. From the menu bar, select Section then Properties (or right click on the Section 1 tab and
choose Properties from the pop-up menu).
11. Date Field – In the floating data dictionary, scroll down and find the Issue Date field (ID006).
Drag and Drop it into the Date Field.
12. Date Period – Using the drop-down arrow, select MTD from the list.
13. Date Format – Select ODBC from the drop-down-list.
14. Select OK.
15. Description – Ticket Detail Data
Page 51
Confidential TRX, Inc.
Report 1 continued
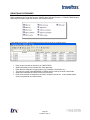
Query
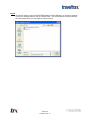
Now you will be selecting the data elements you want to see in your report. You will drag and drop fields
from the Data Dictionary to the Fields area of your query window.
Query Fields
16. Place the following fields in your first seven Query Fields:
ID006
IssueDate
ID015
DocumentNumber
ID021
Vendor Name
ID029
TotalAmt
ID035
Full Fare (this may be called something else on your screen)
ID033
Fare Compare2 (this may be called something else on your screen)
CAL2
CALCNUM
17. Change the names of the following Field Headings:
Change ID015 to Ticket Number
Change ID021 to Airline Name
Change ID035 to Full Fare
Change ID033 to Low Fare
Change CalcNum to Lost Opportunity.
NOTES
If you drag a field from the dictionary and place it on top of an existing field in your query, it will push
that field to the right and take its position.
If you want to remove an existing field, right click on it and select Delete Field.
If you want to change the order of fields, click on the field number and drag the column to the right or
left.
Page 52
Confidential TRX, Inc.
Report 1 continued
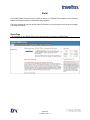
Calculations
This is where a value is assigned to a calculated field. A value is normally some form of a mathematical
function. In this exercise (Report1), we want to calculate the Amount Saved. This is accomplished by
subtracting the Total Amount (ID029) from the Full Fare (ID035).
Anytime you place a CAL field in your query it means that you are creating a calculation instead of just
pulling up the data. You must complete the calculation or you will get an error when you run the report.
18. Right click anywhere in the CAL2 column and select Calculation from the pop-up menu.
Expression Builder
When you get the expression builder box, you have to enter a SQL statement. Expression Builder is
used when creating calculations or filters.
19. Locate TotalAmt (ID029) in the Data Dictionary and drag it to the Expression Builder window.
20. Add a minus sign after ID029 with the keyboard or the on-screen keypad.
21. Locate Low Fare (ID033) in the Data Dictionary and drag it to the Expression Builder window and
drop it after the minus sign.
22. Select OK to save your work.
(ID029)-(ID033)
Page 53
Confidential TRX, Inc.
Report 1 continued
Filters
The next step is to filter the data you want displayed on your report. In a standard ticket report, you’ll
want to remove voids and you need to select vendor types that will return airline and rail tickets only. You
do this with filters.
Exclude Voids
23. Locate the void indicator (VoidInd - ID007) and drag it to the first column in Filters.
24. Right-click on the field you pasted and select Edit Filter to bring up the Expression Builder.
25. Drag the operator equal to the Expression area.
26. Type ‘N’ (a single quote (an apostrophe), an uppercase N, and another single quote).
27. Select OK to finish.
= ‘N’
Page 54
Confidential TRX, Inc.
Report 1 continued
Airline Vendor Only
28. Locate the Vendor Type (VendorType - ID018) and drag it to the second column of Filters.
29. Right-click on the field you pasted and select Edit Filter to bring up the Expression Builder.
30. Drag the operator in list to the Expression area (or you could just type IN).
31. Click between the parentheses and type: (‘BSP’, ‘NONBSP’)
32. Select OK to finish. You have now built the query and established filters. Now, save your work.
IN (‘BSP’,’NONBSP’)
33. Select Report and then Save from the menu bar.
Page 55
Confidential TRX, Inc.
Report 1 continued
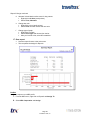
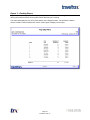
34. Run the report to make sure you receive data. This is a good habit to get into after you create a
report. You don’t want to go in and build a design that may take hours only to find that your data
won’t pull up.
Click the run report icon
Select the output for the report and select the date range.
Click OK. The report will run in Excel (Excel is the default when you have not created a
design for your report).
.
If your report shows data, then you can start the design for your report.
Page 56
Confidential TRX, Inc.
Report 1 continued
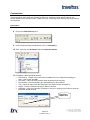
Paradox Design Overview
This is where you will design the look of the report. There are two ways to access the report design.
Right-click on the name of the report from the Main Menu of TRAVELTRAX.
If you have the query pulled up, follow the steps below:
1. Click on the Report Design icon. This means that you are in the EDIT DESIGN mode.
2. Select Paradox x.0.
3. Select OK.
Page 57
Confidential TRX, Inc.
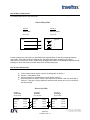
Bands
Bands are Horizontal Bars which appear in the Report Design. There are three default bands:
Report Band – Objects placed here print once at the beginning or ending of a report (header and
footer).
Page Band – Objects placed here print once per page (header and footer for each page).
Record Band – This is the body of the report where all the data appears
You can also add a band to the report. This is accomplished through a button called Add Group
Band. These bands allow you to break your data into groups.
Page 58
Confidential TRX, Inc.
Paradox Overview continued
Before we begin to create the design for Report 1, we need to cover some basics. The designer is where
you layout the report. You choose fields from the query and put them in the design using a multitude of
tools.
These tools are very important for you to learn. If you forget the name of a specific tool, hover your
mouse across the button bar (tool icons), and the name of the tool will appear as a hint.
Let’s now define each of the tools you’ll be using in your report design.
Run Report Button
Use this button to see the report on the screen. After the initial designing of the report,
it’s a good idea to generate the report to the screen to see what the design looks like
with data in the tables.
Design Button
After viewing the report on the screen, it is possible to change the design if an object
needs to be redefined in some way (such as changing the color, size, alignment, etc.).
Use the View Data and Design buttons in conjunction with each other. Generate the
report to the screen, select the Design button to modify an object, and then select the
View Data button to see how the change affected the report.
Selection Arrow
Use the Selection Arrow to select objects in order to manipulate them.
After the object is selected, you can size it, move it, and edit it.
Box Tool
Use the box tool to make boxes of any size, shape, color, etc. on the report.
Line Tool
Use the line tool to draw vertical, horizontal, and diagonal lines of different lengths and
widths on the report.
Ellipse Tool
Use the Ellipse tool to make circles and ellipses of differing types and sizes.
Text Tool
Use the Text Tool to create hard-coded words on the report.
Graphic Tool
Use the Graphic Tool to add graphics such as your company logo to the report. You
can paste them from the clipboard or bring them in using a graphic file.
Page 59
Confidential TRX, Inc.
Paradox Overview continued
OLE Tool
Use the OLE Tool to add a linked object to the report design.
You can bring in charts and graphs from other software programs.
As the linked object gets updated in the other programs, it will also change in your
design.
Field Tool
Use the Field Tool to put fields from the Query in the report design. Each Query field is
laid out individually using this object.
Table Frame Tool
Use the Table Frame Tool to add all of the fields from a section to your report design.
This object allows you to select every field at once (if you wish). When the report is
printed, it will appear in a Tabular Format.
Multi-Record Tool
Use the Multi-Record Tool to layout repeating values in the report design. The layout is
set for one record and then you specify how many times you want the record to repeat
down and/or across the page.
Mailing labels are generally laid out using this format.
It is also used quite a bit to put segment data on the design because, if a ticket has
more than one segment, you generally want it to repeat down the page.
The Table tool also repeats data down the page. It is not as flexible as the Multi-Record
Took because it only repeats down, not across.
Chart Tool
Use this tool to show data as a chart or graph in the report design.
Crosstab Tool
Use the Crosstab Tool to show your data in a spreadsheet like format.
Add Group Band Tool
Use this tool to break your data into groups.
Data Model
Use the Data Model to show what tables are included in the design and to show a
diagram of the relationships between those tables.
Page 60
Confidential TRX, Inc.
Paradox Overview continued
Using Tools
Click on the tool you want to use.
Drag the mouse into the report and create the design you need from that tool.
Practice
Use the appropriate tools to create a box, a circle, text, and two fields.
Status
Bar
Objects
Every item in the design is considered an object: Tables, Fields, Lines, Text, Graphs, etc.
Select an object by clicking on the Selection Arrow icon
Click on the object in the report. The selected object(s) will have little black boxes called Handles
around them.
To perform the same task to many objects at one time (i.e. change font sizes, align fields, change
field sizes, etc.), you can select multiple objects at one time. There are many ways to select
multiple objects.
o
o
on the toolbar.
Select the first object, hold down the Shift Key and click on the other object(s) you want
to select.
Select the Band which holds the objects to be selected. Then, select the Edit option on
the Text Bar, then select Select-All. All objects in the highlighted band will be selected.
Rest your mouse to the left of all objects to be chosen, hold down the left mouse button,
hold down the Shift Key, and draw a box around the chosen objects.
Every object in the design has a name. You can determine whether you have the right object
selected by looking at the bottom right corner of the screen that shows the Status Bar (see callout
box under screenshot above) after you select it. The name also appears when you inspect an
object. The name becomes important when formulas are defined in the design.
Page 61
Confidential TRX, Inc.
Paradox Overview continued
Containership
Containership has to do with the way objects interact with one another. As we stated before, every item
on a report is an object. You can have objects within objects (this is where Containership comes into
being). If you have one object within another object, the surrounding object by default contains the inner
object.
If one object is contained within another, you must click multiple times in order to get to the inner
object. For example, you could have a Box, an Ellipse, and a line on the report. If the Line is
within the Ellipse, which is within the Box, the Box could contain both the Ellipse and the Line,
while the Ellipse could contain the Line. In order to select the Line, you need to point at the line
and click three times.
While Containership is turned on, when the Box moves, the Ellipse and Line also move.
You can turn Containership off. You do this by Inspecting (right-clicking) on the Box, selecting
Properties, Design, and Left-Clicking on Contain Objects. The option is selected if there is a
Checkmark out beside in it.
If we turn Containership off the Box, but leave it on the Ellipse, we can move the Box without
moving the Ellipse and the Line, but we can’t move the Ellipse without moving the Line.
As another example, a table is an object in the design. Within the table, you have the Record
(which is a row) and within the Record, you have a Field. In order to get to the Field, you need to
point the mouse at it and then click once to select the table, again to select the record, and again
to select the field.
You must be aware of which object is selected when laying out the report design.
Page 62
Confidential TRX, Inc.
Paradox Overview continued
Containership Practice
1. Draw a large Box in the record band.
2. Draw an Ellipse inside the Box - By default, the Box will contain the Ellipse.
3. Draw a Line inside the Ellipse - By default, the line will have the handles.
4. Press [Esc]. - The Ellipse is selected.
5. Press [Esc] again. - The Box is selected.
6. Pressing [Esc] - Moves you back one level.
7. With handles around the Box, move the Box with the arrows of the Keyboard. The Ellipse and
the Line move with it (containership).
8. Select the Ellipse - You know you have selected it by seeing handles on it and by seeing Ellipse
in the status bar.
9. Move the Ellipse with the keyboard arrows the Ellipse and Line move but not the Box.
10. Select the Box.
11. Right-click the mouse to inspect the box.
12. Select Properties, Design from the menu.
13. Click on Contain Objects to remove the check mark. (No � = Turned Off)
14. Move the Box. Notice that the Ellipse and Line do not move.
Page 63
Confidential TRX, Inc.
Paradox Overview continued
Data Model
The Data Model contains the query information, the date information, and some profile information. It will
always have at least 3 tables listed on the right hand side of the screen:
Sec1.db -You have to have at least one section for each report. If you right-click this button, a list
of all the fields from this section will display. These are the data fields that can be entered into
the design.
If your report contains more than one section, you will have one button for each section in the
data model. For example, if you have 3 sections in your report, you will see Sect1.db, Sect2.db,
and Sect3.db.
Sect1dt.db -This is added to the design when you add a Reporting Period in the section
properties. The fields are the Beg Date, End Date, and the Date Range. This table enables you
to reference date ranges in your design.
If you have 3 sections to a report, with reporting periods in all three section properties, you will
have Sect1dt.db, Sect2dt.db, and Sect3dt.db in the Data Model.
Rpthdng.db – This is automatically added to the Data Model. It will allow you to reference
information from a profile (if the user runs the report against a profile) add prompt information to
the design, and add the title and/or name of the report to your design. This data is usually
entered into a page header or onto a cover sheet.
Page 64
Confidential TRX, Inc.
Paradox Overview continued
Formulas
A formula is a calculation that is defined in the design.
Properties
Properties are selections which can be defined for all objects in the design. Some properties are the font
size, color, font style, word wrap, format, etc... Properties affect the way the data looks when the report is
printed.
Activate Property Menu
Right-click on an object (or objects – if you want to do the same thing to multiple objects). Using
the right mouse button means to Inspect an object.
Select Properties.
Select the properties needed for that object to make it look the way you’d like it to look.
Page 65
Confidential TRX, Inc.
Report 1 Design
If you need the complete steps to create a design, please see the Desktop Reporting User Guide on the
Portal. The steps below are specifically for this report example.
1. Data Model – Check the data model to see how many data fields are in this report (Format –
Data Model).
2. Set Page Setup – This is where
you select the orientation and
size of the page as well as the
margins. Use the steps below for
this report:
a. Select File – Page
Setup from the Menu
Bar.
b. Choose Portrait.
c. Select OK.
3. Select a Layout – Paradox has
some layouts that may work for
your report.
a. Select Format – Layout from the Menu Bar. Under style you have four choices:
- Single Record - The query fields are set up using individual fields. This option is the
same as choosing the Field tool from the Button Bar.
-
Tabular - The query fields are set up in a table. This option is the same as choosing
the Table Frame tool from the Button Bar.
-
Multi-Record - The query fields are laid out in a Multi-Record. This option is the
same as choosing the Multi-Record tool from the Button Bar.
-
Blank - The design is blank. No data will appear when you print the report.
b. In the style area, select Blank. The right side of the displayed screen will show an example
of the layout style you choose.
4. Select OK.
5. A warning will appear saying it
will change the entire design.
Select OK.
Page 66
Confidential TRX, Inc.
Report 1 continued
6. Change View – This allows you to see the design better, it doesn’t change the size of the design.
a. Select View (from Menu Bar).
b. Select Zoom.
c. Select Fit Width.
7. Create Fields
a. Go into the Data
Model (Format –
Data Model – right
click on Sect1.db
button) to find out
how many data
fields you need for
this report.
b. Select the Field
tool.
c.
Click in the upper left corner of the Record Band and drag a box to create one field. Make
sure it is up against the left margin.
8. Un-label the Field – The default for this field has it set up to show the name of the field along
with the data. We only need to see the data, so we have to un-lable the field.
a. Right-Click on the field and select Properties.
b. Under the Display type, choose Edit and then select the Apply button. This will now allow
you to edit this field. (Notice that the property choices are different after you choose
Edit/Apply).
c.
Set all other properties you want for the fields you are going to enter (font, color, etc.). You
should also set the following properties to ensure that all the information in each field will be
properly formatted and display in the report:
Select the Text Tab and uncheck Word wrap.
Select the Design Tab and uncheck Size to fit.
Select the Run Tab and unselect the Fit Height option.
d. Select OK.
Page 67
Confidential TRX, Inc.
Report 1 continued
9. Copy and Paste to create other similar fields.
We could have drawn seven fields with the field too, unlabeled and set the properties for each
field separately, but to save time and to make your work easier, use the copy feature.
a. Select the field you just created (look for handles).
b. Copy/Duplicate the field 6 times (so you have 7 fields total) by doing one of the following:
Select Edit – Copy or
Right-click and Copy or
Ctrl C or
Click on the Duplicate objects button from the alignment toolbar.
10. Move fields into a row
Move one field to the right margin.
Move the other fields so they are in one row. They do not need to be in a straight line yet.
11. Define each field
a. Right-click on the
first field and select
Define Field.
b. Click the drop-down
arrow next to
sect1.db.
c.
Select the
information from the
report needed in
each field.
d. Repeat these steps
for each field.
Results:
Page 68
Confidential TRX, Inc.
Report 1 continued
12. Align Fields - This process will: Space your fields equally across the page, align the top of all
fields in a straight line, and make all fields the same thickness.
a. Select all fields by one of the following methods:
Edit Select All
Highlight the Record Band by clicking on the band itself or clicking anywhere in the
white space in the record band.
Select Edit from the menu bar.
Select Select All.
Ctrl Key
Hold the Ctrl Key down.
Select each field.
Shift – Box
Hold the Shift Key down.
Go up and to the left of the first object.
Click and drag a box around all objects that need to be selected.
b. Adjust Spacing: All fields will space equally across the page.
- Format – Spacing – Horizontal. Or
- Click on the Adjust Horizontal Spacing (1) button on the Alignment toolbar.
c.
Align to Top – All fields will line up across the top.
- Format – Alignment – Align Top.
- Click on the Align Objects to Top button on the Alignment toolbar.
d. Adjust Size – All fields will be the same height.
- Format – Size – Minimum Height
- Click on the Adjust to Minimum Height button on the Alignment toolbar.
Results
Page 69
Confidential TRX, Inc.
Report 1 continued
13. Create Column Headers
As the report stands now, we have the data on the page but no labels to indicate what each piece
of data indicates. Our data will be displayed in columns, so we need a label above each column
to make our report make sense
a. Select the Text Tool.
b. Click near the left hand margin in the Page Band where you want your text to begin. A
place holder will appear on the Ruler. This is the starting point for the first header label.
c.
Deselect the Text box (click outside of it)….trust me.
d. Right-click text box and set the properties for the text box. Choose the font size 9 bold
and set the properties (Run Time tab – uncheck Fit Height).
e. Click the first text box and type in the longest header TICKET NUMBER. This will insure
that the text box you create will fit all headers.
- You may need to click 2 times before you get the cursor and are able to type.
- You can make it a two line label by using clicking Enter on your keyboard after
you type TICKET. This makes sense for some long header label names.
f.
Resize the text box so there’s very little white space below and to the right of the column
header name
- Click on the text box
- Grab the bottom-middle handle and drag it until the box is right below the word
DATE.
- Grab the right side handle and drag it until the box is close to the end of the word
NUMBER.
g. Copy the text box and paste 6 times, one for each field. Make sure one text box is on the
left margin and one is on the right margin.
h. Change all headers to the correct header names.
Page 70
Confidential TRX, Inc.
Report 1 continued
i.
Align Headers – Align headers to each other and align each header to its corresponding
data field in the record band.
- Select all text boxes and align objects to bottom.
- Deselect all text boxes.
- Hold your Ctrl key and select the Issue Date text box and the Issue Date field.
- Select the Align Objects left button and then the Align text left button.
- Repeat this for each data field/header. Keep in mind that numbers and dollar
amounts are always justified Right and text is justified left. That means that the
Issue Date, Ticket Number, and Airline will be aligned left and all others will be
aligned right (align objects and text).
NOTES:
- When you align objects left, right, or center, all objects must be in a vertical plane.
- When you align objects top, bottom, or middle, all objects must be in a horizontal
plane.
- When aligning data fields containing dollar amounts, it’s best to first move the data
fields to the left of what you’re aligning and then Align Right. This helps get all the
decimal places lined up.
Results:
Page 71
Confidential TRX, Inc.
Report 1 continued
14. Create the Report Header and Footer
Your company will most likely have a standard header and footer that they want to use for all
reports. Instead of creating these headers and footers for every report, you should just find one
of each and copy them into each report design.
NOTES:
- You should consider whether the header/footer is portrait or landscape so it matches the
report.
- Then you’ll find a report that contains the header and footer you need.
- Then you’ll open the DESIGN of that report so you can copy and paste the header and
footer.
a. Create space above the column headers in the page band so the header will fit.
Select the Page Band by clicking on the band itself or by clicking in the white space
within the band.
Move your mouse up until you see a double-arrow.
Once you see the double-arrow, click and drag up.
Make sure you’re in the correct band or you could be creating white space in the
wrong band.
b. Select File – Open – Report.
c.
Highlight the report needed. (The instructor will advise you of the location of the report during
class.)
d. Select the edit the report design radio button. (If you do not do this, the report will run and you
will only see the report results, not the design.)
e. Select the Open button. You are now in the report design for the Report Header…NOT the
report design for the report you are creating.
Page 72
Confidential TRX, Inc.
Report 1 continued
Create Report header and footer continued
a. Highlight the header of the report. To do this, click inside the Page band, but outside the
actual header.
b. Select Edit – Select All. This will select your header and footer.
c.
Since we only need the header, we need to deselect the footer (click Ctrl and click on the
footer).
d. From the menu bar, select Edit – Copy (you can also right-click and Copy).
e. From the menu bar, select Window and click on your report. You are now back in your
report design with the page band selected (not the Header design).
f.
From the menu bar, select Edit – Paste.
g. Go back to Window on the Menu Bar and select the report design again.
h. Repeat the steps above to copy the footer into your report’s lower page band.
i.
When you are finished, go back to the report design and close it. There are more design
steps we could do here, but it is best to generate our report first to see if we have any
problems to resolve.
j.
Select File – Close.
k.
Select Save when question appears. You should be back at the DART main window in
TRAVELTRAX.
l.
Select the Exit DART icon to save your work and to return to the Main Menu.
Page 73
Confidential TRX, Inc.
Report 1 continued
In this part of the exercise, we need to make our report more presentable. Notice the great amount of
space between our data rows? This is caused by the space between the different bands in the design
mode. Also, notice how that the Total Amount, Full Fare, and Low Fare don’t have dollar signs? How
about the format for the Issue Date? We need to fix all this.
To make changes to our design you must go back to the design mode.
Remember, to do that once you’ve run the report, just click on the Design
Report button at the top of the page.
This will bring you back to the design page of the report.
Page 74
Confidential TRX, Inc.
Report 1 continued
1. Remove Space
We can remove white space in a band just like we created more space within a band.
o
Highlight a band. Highlight the band and either move your mouse up until you see a
double-arrow or move it down until you see one.
o Once you see the double-arrow, click and drag up (or down).
o Make sure you’re in the correct band or you could be creating white space in the
wrong band.
a. Highlight the band. Move the mouse up or down until you see double, vertical arrows.
b. Left-Click and hold down.
c.
Drag the band up or down to where you want it.
Practice and experimentation is needed here.
See below for an example of what your design should look like when done.
2. Fine Tuning Alignments
a. Data not centered under Header Labels.
Select the offending object. (Amount Saved data field) by moving your mouse over the
left handle field until you get horizontal arrows.
Hold down the left mouse button and drag to the right until the box is smaller. We do this
because there is no room to move left without a size change.
Now, using keyboard arrow keys, move the object a little right of center of the AMT
SAVED header label. You’re going to have to estimate this; you have to allow room for
the average length of the data in that field.
Go back and view the report by clicking the Run Report Tool icon and see your result.
Fine tune again if necessary.
When satisfied, repeat the process for the other objects.
Page 75
Confidential TRX, Inc.
Report 1 continued
b. Header Labels too long for corresponding data.
c.
Click on the ISSUE DATE object (the header name).
Click again till you get a flashing cursor. Click after the E in ISSUE. This allows you to
use your keyboard.
Select ENTER on your keyboard and put DATE on a second line.
Repeat processes until all objects are lined up and centered.
3. Make Headers Bold
a. Select Page Band.
Select Edit – Select All (All headers have handles).
b. Place mouse pointer over one of the selected objects.
Right-Click.
Properties - Font – Bold.
Page 76
Confidential TRX, Inc.
Report 1 continued
4. Add Totals to last page of report
a. Select the Field Tool.
b. In the Report Band, create a new field under, and aligned with, the Total column. Make
space if needed.
NOTE: Putting the totals in the Report Band will display the totals on the last page of the
report, not on every page of the report. If you had wanted to put the totals on every page of
the report, you would put them in the Page Band.
c.
Right-Click on the field and un-label it (Properties – Display Type – Edit).
d. Right-Click on that field and select Define Field.
e. Select Sect1.db drop-down-arrow, and select Total Amt from the drop-down list.
f.
In the Summary area, use the drop-down arrow and select Sum.
g. Select OK. Your new field now has SUM as the prefix.
h. Copy your new field and paste it three times under your other value fields (Full Fare, Low
Fare, Amt Saved). Notice the new fields also have a SUM prefix.
i.
Right-Click on each of the other new fields and select Define Field.
j.
Repeat the previous process you accomplished on the Tkt Amt total field for the remaining
totals fields.
Add a label for TOTALS.
a. Select the Text Tool.
b. Click to the left of your total fields and type TOTALS.
Make Totals Bold
a. Highlight all totals fields using mouse and holding down shift key. You can’t use Report Band
because the items in the upper band would also be selected.
b. Right-Click on any selected field.
c. Select Properties – Font (font style) – Bold.
Page 77
Confidential TRX, Inc.
Report 1 continued
Align Fields (Totals)
Repeating the process for aligning top and aligning left/right, align the fields in the Report
with the fields in the Record Band.
Band
Finish
a. View data and make final adjustments. Remember, your totals will be on the last page of the
report. On the Paradox menu bar, click on the Last Page icon
RESULTS
5. Change the format for the Issue Date
For any date field, Paradox uses the Windows date as the default date. This includes the time
and the date. In this report in the Issue Date column, we do not need the time of issue, so we
need to change the format for this field.
a.
b.
c.
d.
e.
f.
g.
h.
i.
j.
k.
l.
m.
n.
Right-click on the Issue Date field in the Record band.
Select Properties
Click on the Format tab. We need to create a new format.
Click the Create New Format button.
Click the Create button
Name this Date format (whatever you & your company want it to be).
Click the Permanent check box – do this if you want all other TTX Desktop Reporting
users to be able to use this new format. If not, the format will only be available in this
report.
Time Format: In this section, uncheck Hour, Minute, and Seconds.
Time System: Change to 24 hours.
Order:
Take out everything but the %D.
Date Format: Select the day, month, and year format you like.
Click OK.
Select the name of the new format you just created (or the format will still be Win
Timestamp).
Click on the Run Report button to verify that the format is correct.
6. Save the Report Design and Close.
Page 78
Confidential TRX, Inc.
Profiles
Unless you assign a report to a profile, it will not display on a Web Reporting site. There are two ways to
assign a report to a profile:
1. Open a profile – You can open a profile and assign all the necessary reports to that profile. Use
this option when you’ve created a new profile & need to assign several reports to it.
2. Right-click & Assign To – You can right-click on a report & Assign To the correct profile(s). Use
this option when you’ve created a new report & you need to assign it to several profiles.
Assign Report1 to all your profiles.
1. Click the View profile button.
2. Find the Corporate Client Profile and open it.
3. Click on the Report List tab
4. Select REPORT1 from the available reports window and move it to the Selected Reports window
to complete the report assignment process.
5. From the Main Menu, right-click on Report1 and select Assign To.
6. Assign this report to the Agencies profile.
Page 79
Confidential TRX, Inc.
Report 2 – Summary Report
Report two is a summary report. A summary report will summarize data instead of returning each row of
data. This report will display car data summarized by car chain name. Filtering the data to remove voided
car invoices will be required as well as building an appropriate design.
Page 80
Confidential TRX, Inc.
Report 2 continued
Create Report
1. Select the New icon and select Report from drop down menu.
2. Enter name for new report: REPORT2.
Report Properties
1. Click Report on the Menu bar and select
Properties.
2. Type Car Chain Summary in the Report
Properties Title window.
3. Select OK when finished.
Section Properties
You can either click on Section, and then Properties on the menu bar or you can add the information in
the Date Settings section (see screenshot below). The instructions below follow the Sections from the
menu bar.
4. Click on Sections on the menu bar, then
Properties.
5. Date Field – In the Data Dictionary, find
the car issue date (CAR007) and drag it
to the Date Field space in the Properties
window and drop it there.
6. Date Period – Using the drop-downarrow, select MTD.
7. Date Format – Select ODBC from the
drop-down-list.
8. Select OK.
Date Settings
Page 81
Confidential TRX, Inc.
Report 2 continued
Query
1. In the Description text box type Car Data.
2. Click on the Data Dictionary icon
.
Query Fields
3. Drag the following fields you want displayed in your report from the Data Dictionary into the
FIELDS position of your DART Query window:
CAR016 – ChainName
CAL2 – Calc Number
CAL2 – Calc Number
CAL2 – Calc Number
4. Click in the field heading of each column and rename the fields as follows:
CAR016 – Car Company
CAL2 – Car Days
CAL2 – Total Car Cost
CAL2 – Avg Daily Rate
Summary Types
In all queries that return summarized data, any field that returns a number must have a Summary Type
assigned.
5. Right click anywhere in the Car Days column and select Summary Type.
6. Select Sum from the pop-up menu.
7. Repeat for Total Car Cost.
8. For Avg Daily Rate, select summary type Weighted.
A weighted average is when all units are valued according to the percentage of the total
they represent, not the total number of units.
Example: Four people get on a scale. To calculate the weighted average, each person
is responsible for their own weight, not the total weight divided by four.
Page 82
Confidential TRX, Inc.
Report 2 continued
Calculation
Since you now have three undefined Calc Fields in your query, you’ll need to complete the calculations to
make them valid.
9. Right click in the column and select Calculation then add the following calculations:
10. Car Days:
CAR023 * CAR024
11. Total car cost: CAR023 * CAR024 * CAR027
Avg Daily Rate: The average daily rate will use
the results from the Car Days and Total Car Cost
calculations, so we have to create a different type
of calculation.
Select the Section Field Names button
Choose 003 – Total Car Cost and drag it into the
Expression window.
Add a divide symbol /.
Then choose 002 – Car Days. This expression divides the value of query field 3 by the value
of query field 2. It will look like this: [#003]/[#002]
Select the Calculation Type drop-down arrow and
choose JavaScript.
Select OK to close the Expression Builder.
.
Page 83
Confidential TRX, Inc.
Filters
The next step is to filter out (exclude) voided car invoices.
12. Locate CAR008 (VoidInd) and drag it to the first column in Filters.
13. Right-click on the field you dropped it in and select Edit Filter to bring up the Expression Builder.
14. Drag the word equal to the Expression area (or type in an equals sign from your keyboard).
15. Type a single quote (apostrophe), an uppercase N, and close with another single quote. ‘N’
16. Select OK to finish. You have now built the query and established filters.
17. Now, save your work by selecting Report from the menu bar and Save from the drop-down
menu.
Page 84
Confidential TRX, Inc.
Report 2 continued
Design
1. Select the Report Design icon from the DART window.
2. Set the Page Layout
Page Layout - Select File from the Menu Bar.
Select Page Setup.
Choose Portrait.
3. Set the Report Layout
Select Format – Layout.
In the Style, select Tabular.
Select OK at the bottom of the Layout window. Warning appears.
Select OK - We want to update our design.
NOTE: In lieu of using Design Layout, you could draw a table in the record band using your
Table Frame tool. After you’ve drawn it, you’ll need to define the table as everything in Sect1.db.
The result will be the same.
4. Create the report header and footer
Highlight the Page Band.
Select File – Open – Report.
Highlight a canned report (.RSL) that holds the header & footer you need (remember portrait
or landscape).
Select the Edit the report design radio button. If you don’t, you will run the report. You can
still get to the report design, it will just take you longer.
Select the Open button.
You are now in the Design for the Report Heading, NOT your design. Errors may appear.
You may need to click on OK until you get to the design.
Highlight the Header of the report. To do this, select the band that the header is in. Then
select Edit from the menu bar and Select All.
If the band holds any other objects, you have to deselect them so that all you have selected
is the header.
Select Edit from menu bar and Copy (or you can right click and Copy).
Go back to Report 2 by selecting Window in the Menu Bar and click on Report2 (you may
have a button in the bottom, left corner for this report. If so, you can click the button).
You are now back in your design with the page band selected.
Select Edit - Paste.
The header should now be pasted in your design.
Go back to Window on the Menu Bar and select the canned report design again.
Repeat the steps above to copy the footer into your report’s lower page band.
Page 85
Confidential TRX, Inc.
Report 2 continued
5. Center the table.
a. Using the line tool. Draw a line above the table from left to right margin. To draw a straight
line, hold down the shift key while drawing the line.
b. Holding down the shift key, select Line, Table, and both parts of the Heading.
c.
Select Format – Alignment - Align Center from the main bar. Everything should now be
centered in your design.
d. Delete the line since it’s no longer needed.
6. Make necessary adjustments to the table.
a. Move your mouse pointer over any vertical column line (See Arrow 1) or header horizontal
line until you get arrows.
b. Drag target line to resize column or row.
c.
Click on the field you want to move until you get handles around it (remember Containership).
d. Move the mouse pointer to the left edge of the field until you get horizontal arrows.
e. Drag it to the right until you make the field the size you want. Leave the field large enough to
hold the number of numerical digits expected in that column.
f.
Using your keyboard arrows, move the field left to the desired position.
NOTE: Fields containing numbers are right justified. The right border of the field must be placed
(right of center) of the column, allowing for half the number of digits expected.
Page 86
Confidential TRX, Inc.
Report 2 Design continued
7. Align data and headers.
8. Make headers bold.
a.
b.
c.
d.
Click on the header row until selected.
Select Edit, Select All to get handles around all headers.
Right-Click on one of the headers selected.
Select Properties, Font, (Font Style) Bold.
9. Remove grid lines in the table.
a. Select the Table.
b. Right-click, select Properties – Grid – None.
10. Add totals.
a. Create Totals Fields: Use the Field tool to draw a box below the table in the Record band
under the Car Days column.
b. Un-label: Right click, select Properties, and choose the Display type Edit then select the
Apply button.
c. Select the font, etc.
d. Copy this field and paste it below the Total Car Cost column and the Avg Daily Rate column.
e. Define the Car Days total field by right-clicking and selecting Define Field. From Sect1.db,
select Car Days. In Summary, select Sum.
f. Define Total Car Cost field field and use Sum.
g. Define Field for Avg Daily Rate Total. This requires a formula:
Right-click, Define Field. Click in the Calculated box at the bottom of the Define Field.
This will place an X inside the box.
Select Total Car Cost.
Select the Copy Field button. This copies to the blank field at the bottom of the window.
Place a divide-by sign ( / ) at end of first copied field.
Select Car Days from the Sect1.db drop-down list.
Select the Copy Field button.
Select OK. Result: Calculated formula is placed in field you designated and the field is
named formula.
h. Use the Text tool and type TOTALS to the left of your newly defined totals fields.
11. Align totals vertically.
a. Select a totals field and corresponding data field.
b. Select Format, Alignment, Align Right.
c. Note: Move the total field to the left of the data field before aligning. This prevents you from
inadvertently moving the data field that you already centered.
d. Repeat for other two fields.
Page 87
Confidential TRX, Inc.
Report 2 continued
12. Align totals horizontally.
a. Select all fields in the totals row including the text field.
b. Select Format, Alignment, Alight Top.
13. Make totals bold.
a. With totals still selected, select on of the fields and right-click.
b. Select Properties, Font, (Font Style) Bold.
14. Remove decimals from Car Days.
a. Right-click on the field.
b. Select Properties, Format, Integer.
c. View data and make final adjustments
Page 88
Confidential TRX, Inc.
Report 2 Design continued
15. Add a Graph
a. Using the Chart tool, draw a box about the same size as the table below the table within the
record band. You may have to make room below the table first.
b. Define the graph. Select the graph by right-clicking and selecting Defining Chart. You know
you are addressing the graph if you have a large mouse pointer within the graph. A small
pointer means you are addressing objects within the graph.
c. Select the X Axis radio button.
d. Select Car Company from Sect1.db.
e. Select the Y-Value radio button.
f. Select Total Car Cost from Sect1.db.
g. Select OK.
16. Make adjustments to the graph.
a. Remove space to right.
Right-Click on graph (in design).
Select MIN X-VALUES, 1. Graph bars will fill the graph from left to right.
b. Change values to dollars
Right-Click on Y-Axis Tick marks (small pointer).
Select Ticks, Number Format, Windows $.
c.
Remove graph Section Stamp
Right-Click on graph.
Select Option, Show Title. This will remove the check mark.
Page 89
Confidential TRX, Inc.
Report 2 Design continued
d. Alternate X-Axis labels to allow room for long names.
Right-click on X-Axis (small pointer).
Select Ticks, Alternate.
e. Change bar color
Right-Click on bar (small pointer).
Select Color and then choose the new color.
f.
Change type of graph
Right-Click on graph.
Select Chart Type and choose from the list.
After you’ve tried a few, select 2D rotated bar.
17. Save report
Save the report & return to the main menu.
This completes the design for Report2.
.
Profiles
Assign this report to your ABC profile.
7. From the Main menu, right-click on Report2 and Assign To.
8. Select ABC Corporation and Assign.
Page 90
Confidential TRX, Inc.
Report 3 – Ranking Report
Report three is a ranking report. Ranking requires you to enter a field called ranking, then enter the
ranking information and then tell the system which data field you’re ranking.
This report will display the top 10 City Pairs based on the Segment Value. We will filter the data to
remove voided invoices and select the correct vendor types to display on the report.
Page 91
Confidential TRX, Inc.
Create Report
In this section, you’ll be creating a new report that will rank the top 10 city pairs based on the number of
segments flown to those city pairs.
1. Create a new report.
Select the New icon from main menu.
Select Report from the drop down menu. A pop-up window appears.
Enter REPORT3 for the name of the report.
Select OK.
2. Enter Report Property information.
Click On Report then Properties from the menu bar.
Title – Top City Pairs
Category – Air Travel
Report Description – Top 10 City Pair Ranking
Select OK.
3. Enter Section Property information.
Click on Section from the menu bar.
Select Properties.
Date Field – TS008
Date Period – MTD
Date Format – ODBC
Select OK.
4. Enter the section description: Segment Data
Query
In this section, you’ll be creating the query for the report.
1. Enter City Pairs in the Description text box type.
2. Drag the fields you want displayed in your report from the Data Dictionary in the Fields position of
your DART Query window.
CAL4 – CALC TEXT
CAL2 – Calc Number
TS030 – SegSegmentValue
3. Click in the Field Heading of each column and rename the fields as follows:
CAL4 – City Pair
CAL2 – Number of Segments
TS030 – Segment Value
Page 92
Confidential TRX, Inc.
Report 3 Continued
4. Designate Summary Types. Remember, in all queries that return summarized data, any field that
returns a number must have a Summary Type Assigned.
Right-click anywhere in the Number of Segments column and select Summary Type.
Select Sum.
Repeat for Segment Value.
Ranking
To rank something in a report, you have to add the Rank data field and it has to be the first data field on
the left in your query.
5. We want the Top 10 city pairs based on the number of segments.
Pull up the Dictionary and find Rank.
Drag it on top of the City Pair field. This will put the Rank field before (to the left of) the City
Pair field (the Ranking box will display).
Rank Type – Top…..Item Limit – 10…..Rank by Value….Segment Value.
The system needs to know what information to rank, so we have to designate the field we need it
to rank.
Right-click in the City Pair field.
Click Rank. This will display the level of ranking in the Rank Name section.
Page 93
Confidential TRX, Inc.
Report 3 Continued
6. Add Calculations to the report. In this report, we’ll have two calculated fields.
A. City Pairs – We want the city pairs using the city name, not the code. The calculation you
will be building is a SQL statement that will be adding together the Origin City Name and the
Destination City Name. [Origin City]+'-'+[Destination City]
[TS009]+’-‘+[TS026]
Right click in City Pairs column.
Select Calculation.
Locate the origin city in the Data Dictionary and drag and drop it into the calculation field.
Add a dash in between the cities. Do this by typing a plus sign, single parenthesis, dash,
single parenthesis, plus sign. +’-‘+
Locate the destination city and drag and drop it into the calculation after the last plus
sign.
B. Number of Segments
This calculation will count each row in the data base where it finds each unique city pair.
Right-click anywhere in the Number of Segments column.
Select Calculation from the pop-up menu.
Type a 1 in the Expression window. That’s it.
7. Add Filters so that no voids are returned and that we’re only getting airline and train tickets. Click
and drag the following data fields to the filter section.
ID007 (Void Ind) – Right click and Edit Filter
ID018 (Vendor Type) – Right click and Edit Filter
= ‘N’
IN (‘BSP’,’NONBSP’)
8. Save your work.
Design
In this section, you’ll create the design for your third report. You will use a table and learn how to define
that table.
1. Select the Report Design icon from the DART window.
2. Design the Layout - Draw a box in the Record Band by using the Table Frame Tool.
3. Define the table.
Right-click on the table.
Select Define Table.
From Sect1.db, select all items in the drop-down list by using the shift key.
Select OK.
4. View – Zoom – Fit Width.
Page 94
Confidential TRX, Inc.
Report 3 Continued
5. Add a report header and footer in the Page Band.
6. Change the header for Level 1 to Rank and left align the text.
7. Adjust the column widths and header height as desired.
8. Center the data in the columns except for the Rank data field. Remember containership.
a. Shrink the fields with the mouse pointer. Remember to leave it large enough to hold the
number of characters expected.
b. Move the fields to the right of center using your keyboard. Allow enough room for the
largest number.
c. View results and make minor adjustments as required.
9. Make headers larger and bold.
a.
b.
c.
d.
Select the Header row.
Edit – Select All.
Right-Click on one header.
Properties – Font (size) 9 bold
10. Center the Table
a.
b.
c.
d.
Use the Line tool. Remember to hold down the shift key to ensure a straight line.
Select all objects to center.
Format – Alignment – Align Center.
Delete the line since it’s no longer needed.
11. Add Totals.
a. Using the Field tool, draw a box below the table in the record band under the Number of
Segments column.
Make this an editable field (right click, properties, change from labeled to edit).
Define Field - choose Number of Segs and Summary – SUM.
b. Copy the field and paste it below the Segment Value column.
c. Define that field.
d. Use the Text tool and add TOTALS to the right of the totals fields.
12. Align Totals vertically and horizontally.
13. Make totals bold.
14. Remove decimals from Number of Segment totals and Rank totals.
15. Assign this report to your profiles.
Page 95
Confidential TRX, Inc.
Create a Custom Calculation Field
To create a calculation that will be saved in the Data Dictionary:
1. Click on the Main Data Dictionary icon (from the Main Menu).
2. In the left column under Data Dictionary, click on Calculations.
3. Then, right-click on Calculations and select New Calculations.
4. Complete the New Calculation window using the following:
Field Number – CAL# (leave whatever # appears)
Name – Htl Traveler Name
Length - 50
Type – A
Heading – Traveler Name
Calculation – [HTL012]+’/’+[HTL011]
5. Click OK
6. Save
7. The data dictionary only updates when you open Desktop Reporting, so we have to close out of
Desktop Reporting & open it back up for the new calculation to display in the data dictionary.
Page 96
Confidential TRX, Inc.
Report 4 – Multi-level Ranking Report
Report 4 is a multi-level ranking report. It will display the top 10 Travelers for the Top 5 Hotel. We will
add a filter so that data will not pull from voided hotel invoices.
Page 97
Confidential TRX, Inc.
Create Report 4
In this section, we’ll enter the report properties and section properties for Report 4.
1. Create a new report.
Select the New icon from main menu.
Select Report from the drop down menu. A pop-up window appears.
Enter REPORT4 for the name of the report.
Select OK.
2. Enter Report Property Information
Click on Report then Properties from the menu bar.
Title – Top Travelers by Hotel
Category – Air Travel
Description – Top 10 Travelers for the Top 5 Hotels
Select OK.
3. Enter Section Property Information.
Click on Section from the menu bar.
Select Properties.
Date Field – HTL007
Date Period – MTD
Date Format – ODBC
Select OK.
4. Enter the Section Description as Top 10 Travelers/Top 5 Hotels.
Page 98
Confidential TRX, Inc.
Report 4 continued
Query
In this section, you’ll be creating the query for this report. Think about the information you’re trying to get
out of this report. You’re looking for the Top 10 Airlines for the Top 5 Travelers. Once you determine the
results you need, then you’ll be able to determine what data fields need to be added to return that
information.
1. Enter the following data fields:
Hotel Property
CAL(HtlTravelerName)
Hotel Spend – Cal2 add calculation
o [HTL030]*[HTL031]*[HTL034]
Num Nights – Rename it Number Nights
2. Add the Summary Type Sum for Hotel Spend and Number Nights.
3. Rank the Top 5 Hotels and the top 10 Travelers
a. Hotels
Select the Rank field and drag it on top of the Hotel Property column. We want the Top 5
hotel properties based on spend.
Set your Hotel Property column to Rank (right-click in the Hotel Property column and
select Rank).
b. Travelers
Select the Rank field and drag it on top of the Traveler Name column. We want the Top
10 travelers based on the hotel spend.
Set your Client column to Rank (right-click in the column Traveler Name column and
select Rank).
HINT: If you haven’t set up your summary types before doing your ranking, you will not see any options
under the Rank by Value box.
4. Add Filters so that no voids are returned and that we’re only getting airline and train tickets. Click
and drag the following data fields to the filter section.
HTL008(Void Ind) – Right click and Edit Filter
5. Save your work.
Page 99
Confidential TRX, Inc.
= ‘N’
Report 4 continued
Design
1. Start the Report Design.
2. Set up the Page Layout as Portrait.
3. Set up the Design Layout
a. Select Format – Layout - Tabular.
b. Remove the fields in the page band.
4. Add the Report Header and Footer in the Page Band.
5. Save the design and return to the TRAVELTRAX main menu.
The organization of this report would be better if we broke out each client and provided a subtotal for
each one. So, we’re going to separate the report by client. We’ll also fix the look of the report. We’re
going to center the report on the page, center the data in the tables, and remove the decimals from the
Rank and Bookings numbers.
Page 100
Confidential TRX, Inc.
Report 4 continued
1. Add Group Band – This will add another band to the design and put the Top Clients field in the
new band. This will allow us to provide the data for each client separately instead of having the
data repeat
a. Select the Add Group Band tool.
b. Highlight Level1 in the Field window.
c. Select OK.
d. View your report. It should be divided into multiple tables based on the Level1 rank field.
Notice that the Level1 field in the table is now redundant so we can delete it. Then we
need to add the Traveler Name to that group band group band as well. Once we do that,
we can delete that column from the table in the Report Band as well.
2. Un-Lable the Top Clients’ data field and make it size 9, bold.
3. Copy the Passenger Name data field from the table and Paste it in the Group band to the right of
the Top Clients’ field.
4. Align the Top Client and Passenger Name data fields.
Page 101
Confidential TRX, Inc.
Report 4 continued
5. In a blank row below the data field of the Top Clients’ column, click until the column turns black.
6. Hit the Delete key on your keyboard.
7. Repeat these steps for the Passenger Name column in the table.
8. Remove the grid lines from the table.
9. Move the table to the right as far as possible.
10. Table Adjustments
Adjust column widths and header height as desired.
11. Align data in columns
a. Shrink fields with your mouse pointer. Remember to leave it large enough to hold the
number of numerical digits expected.
b. Move fields to the right of center using your keyboard. Allow enough room for largest
numbers.
c.
View the results and make minor adjustments as required.
12. Change column headers – size 9 bold.
13. Add Totals.
a. Using the Field tool, draw a box below the table in the record band under the Amount column.
b. Un-label.
c.
Define the field.
From Sect1.db, choose Amount and select SUM as the summary type.
d. Copy that field and paste below Bookings.
e. Define Bookings field.
f.
Use the Text tool and add Totals to the right of the totals field.
14. Align Totals vertically – Right. Repeat with other field.
15. Align Totals horizontally – Top.
16. Select Minimum height for all 3 fields.
17. Make the Client Totals field bold.
18. Remove decimals from the totals of Bookings, Top 3 Clients, and Top 5 Airlines.
19. Remove space in all bands.
Page 102
Confidential TRX, Inc.
Report 4 continued
20. Add Final Totals.
a.
b.
c.
d.
Previous totals are now sub-totals.
Copy sub-totals fields (all at once).
Paste in Report Band.
Edit text in report totals as Final Totals.
21. Save your work.
22. Assign this report to 3 of your profiles.
Page 103
Confidential TRX, Inc.
Linking Reports
With multi-section reports, sections may have data from different tables in the database or data from the
same table for different time periods. Linking is necessary in order to display this data in a meaningful
format.
Example:
Suppose you wanted to produce a report that displayed a list of passengers, the amount of their tickets,
and the air segments they flew. If you put both ticket information and segment information in the same
section (they are in different tables), you would get a report that duplicated the ticket price for each
segment the passenger flew. Also, if there was a passenger with no segment information, the passenger
would not display even though he existed in the ticket table. (This is a function of relational databases.)
If you put ticket information in the first section and segment information in the second section, you
would get a report that made no sense. Passenger names and ticket prices would be displayed
independent of segment information. You would have a hard time determining which segment
information went with which passenger.
To solve these problems a linking report needs to be created. Section one would contain ticket
information and section two would contain air segment information. Section two would then be
linked to section one. The specific procedures will be shown later.
When you want the report to show any part of the itinerary (the actual airline, rail, car, and/or hotel
segments), you need to link them together using the 3 primary keys: RecordKey, IataNum, and SeqNum.
Put each of these data fields in each section that will hold itinerary data and then link them together.
If you’re using Paradox as the design tool, linking can be done within the query and is a 2 step process.
You have to enter the section you want to link back to in the section properties and then you have to link
the data fields from the current section back to the other one.
NOTE: If you’re using Excel as the design tool, you still need to add the three primary keys, you
just wouldn’t create any linking. Excel doesn’t accept the linking. You’d have to create code within Excel
to do the linking.
Page 104
Confidential TRX, Inc.
One to Many Link Overview
One to Many Link should be used when the linked sections’ result tables do not match (e.g. when there
are multiple segments for each ticket row).
One to Many Link
Section 1
Section 2
Ticket Data
Itinerary Data
Result Table
Result Table
Invoice #
Invoice #
Segment #
1
1
2
2
3
3
1
2
3
1
2
1
If these sections were not linked, you would have two separate tables on the report showing separate
sets of data. Each table could be a different size. Because passengers generally have multiple
segments on one ticket, the section 2 table would be bigger than section 1 and individual segments would
probably not be on the same line as the ticket record for each passenger.
One to One Link Overview
One to One Link should be used when the results from the linked sections match row by row.
In the example below, Section 2 and 3 are linking back to section 1.
Section 1 is the Master Table.
Sections 2 and 3 are matching their records back to section 1.
One result field from section 1 links to one result field in section 2 and one result field in
section 3. This type of linking allows the data from each section to be put in one table in
the report design.
One to One Link
Section 1
Ticket Info
Section 2
Refunds
Section 3
Exchanges
Result Table
Result Table
Result Table
Passenger
Total $
Passenger
Total $
Passenger
Total $
Smith
$500.00
Smith
$200.00
Smith
$100.00
Jones
$300.00
Jones
$100.00
Jones
$200.00
Black
$400.00
Black
$100.00
Black
$300.00
Page 105
Confidential TRX, Inc.
Data Dictionary Help Pages
Type
Origin
City
Code
Destination
City Code
Origin City
Name
Destination
City Name
Origin
Region
Code
Destination
Region
Code
All
Connections
TS009
TS026
ORIG003
SDEST003
ORIG005
SDEST005
No
Connections
(NOX)
TS009
TS037
ORIG003
XDEST003
ORIG005
XDEST005
No
Connections
- Minute
Rule
TS009
TS049
ORIG003
MDEST003
ORIG005
MDEST005
Market City
Pairs (All
Connections)
TS034
TS035
SMORIG003
SMDEST003
SMORIG005
SMDEST005
Market City
Pairs (NOX)
TS045
TS046
XMORIG003
XMDEST003
XMORIG005
XMDEST005
Market City
Pairs Minute Rule
TS057
TS058
MMORIG003
MMDEST003
MMORIG005
MMORIG006
Page 106
Confidential TRX, Inc.
Type
Origin
Region
Name
Destination
Region
Name
Return
Indicator
(is not
null)
Segment
Value
Intl/Dom
Ind (D or I )
Seg
Miles
Total
Miles
Selection
Criteria
All Connections
ORIG006
SDEST006
TS036
TS030
TS027
TS031
TS032
None
No Connections
(NOX)
ORIG006
XDEST006
TS048
TS041
TS038
TS042
TS043
TS037>A
No Connections
- Min Rule
ORIG006
MDEST006
TS060
TS053
TS050
TS054
TS055
TS049>A
Market City
Pairs (All
Connections)
SMORIG006
SMDEST006
TS036
TS030
TS027
TS031
TS032
TS035>A
Market City
Pairs (NOX)
XMORIG006
XMDEST006
TS048
TS041
TS038
TS042
TS043
TS046>A
Market City
Pairs - Min Rule
MMORIG006
MMDEST006
TS060
TS053
TS050
TS054
TS055
TS058>A
Page 107
Confidential TRX, Inc.
Tips for Segment Reporting:
If you want to use the segment value that comes from your back office system you can choose that
field from the TranSeg table.
To prorate the segment value based on the segments mileage as compared to the total mileage use
the following formula:
SegmentMileage / TotalMileage x Amount - the amount can be the Ticket Price, Base Fare,
etc.
To make a query with no return segments use the following in selection criteria:
ReturnInd is null
To enter string data (text) you must place it within a SQL statement (e.g. OriginCity + DestinationCity)
You must use the MS SQL Server format function. This function takes the arguments and strings
them together.
argument1 + argument2
To place a separator between the two arguments you must add in the separating characters enclosed
in single quotes.
The result: [ORIG003] + ' - ' + [SDEST003]
Sample Travel Itinerary:
1 DL 928F 07JUN
2 DL 82J 07JUN
3 LX 563C 14JUN
4 LX 64C 14JUN
J *MIAJFK HK1
J JFKNCE* HK1
J *NCEZRH HK1
J ZRHMIA* HK1
235P 545P
700P 940A+1 (08JUN)
1040A 1200N
105P 530P
Flight(s)
A Flight corresponds to a segment flown. Segment 1 above is a flight between MIA (Miami) and JFK
(New York JFK Airport). Reporting flights would be represented by 4 unique city pairs for the sample
itinerary. In TRAVELTRAX refer to "All Connections".
Trip(s)
Some companies might use this term to mean the number of airline tickets, but the strict definition
refers to the true destination. That means an origin city to a destination city where you stay overnight,
not where you connect to another flight.
For the sample above there are 2 trips. One trip is MIA (Miami) to NCE (Nice) and 1 trip NCE-MIA.
In TRAVELTRAX we refer to this as the MIN Destination field.
Market(s)
Similar to a trip, a market is the origin and destination of a trip reflected alphabetically. In this
example, there are 2 trips in the NCE-MIA market (but only one market). In TRAVELTRAX refer to
Min Market Destination.
Page 108
Confidential TRX, Inc.
Report 5 – Linking Report
This report has ticket data and segment data. They need to be put in separate sections so that the ticket
information is not repeated for each airline segment in the itinerary.
1. Create a new report and name it REPORT5.
2. Report Properties
Title – Ticket Summary
Category – Air Travel
Description – Ticket summary including flight segments
3. Section Properties – Enter the following:
Date Field – ID006
Date Period – Monthly
Date Format – ODBC Date
4. Section Description: Ticket Data
Page 109
Confidential TRX, Inc.
Report 5 continued
Query
5. Enter the following data fields in section 1.
ID001 – Record Key
ID002 – IataNum
ID003 – SeqNum
ID006 – Issue Date
ID015 – Ticket Number
CAL4 – Passenger Name
Right-click and create a calculation
ID011+’/’+ID010
ID029 – Ticket Amount
6. Add Filters to Global filters by clicking on the Global radio button.
Use the filters so only airline tickets are returned but voided tickets are not.
7. To add a new section to the report, click Section New, or click on the New Section button.
8. Enter the Section Description of Segment Data.
9. Enter the following properties for Section 2
Date Field: TS008 – IssueDate (since this
section will contain segment data, you pull
the date from that data table).
Date Period: MONTHLY
Date Format: ODBC Date
Enter a 1 in the Link Section to link this
section back to section 1. (First step)
Enter a checkmark in 1>Many.
Page 110
Confidential TRX, Inc.
Report 5 continued
10. Place the following data fields in the Section 2 Query:
TS001 – Record Key
TS002 – IataNum
TS003 – SeqNum
TS015 – Departure Date
CAL4 – City Pair (TS009 +’ - ’+ TS026)
11. Link the Record Key, IataNum, and SeqNum query
fields to those fields in section one. To do that, follow
the steps below.
Right-click the RecordKey data field and select
Properties.
Using the drop-down-arrow next to Link By, select
RecordKey. This links the Record Key in this
section to the RecordKey in the section you
designated in the section properties (in our case,
section 1).
Click OK.
Repeat these steps for the IataNum and
SeqNum
This completes the linking process
Design
1. Select the Report design icon
2. Once in the Paradox design tool, you
can verify that the one-to-many link
was captured by looking at the Data
Model.
Select Format from the menu bar.
Select Data Model.
Notice that there is an arrow with a
double point from sect1.db to
sect2.db. This indicates that the link
was captured. Double-click on the
arrow and it will open the Link button.
Click on the link button so you can see
what field this report is linked on.
Page 111
Confidential TRX, Inc.
Report 5 continued
3. To build the design for this report, you can construct it manually by using the design tools on the
icon bar or you can use Paradox’s automated design feature. We’ll introduce the automated
feature here. If you didn’t delete the Record Key, IataNum, and SeqNum fields in the layout, do
so now. We don’t need to see them in the report. They are only used when the query runs to link
the data fields.
Select Format from the menu bar
Select Layout
Select Single Record
Select By Rows
Uncheck the Label Fields box
NOTE: When doing a One to Many link, the Tabular option and the Table Frame Tool are not
available for use. In the Format Layout, the Single Record option must be used.
Report 5 continued
Page 112
Confidential TRX, Inc.
Report 5 Design continued
At this point, your design should look like the following:
To make our design look presentable, there are still a few things we need to do:
4. Move the Ticket Number field to the left margin and line up the other individual fields, in the order
you want them, left to right. You might want to resize the Passenger Name field to make it fit
easier.
5. Delete the headers in the table.
6. Select the table, right-click, select Properties.
On the General page, un-check the Attached Header box and select OK.
After the header is selected, use your delete key to remove the headers.
Page 113
Confidential TRX, Inc.
Report 5 Design continued
7. Delete the 3 objects from the page band. We will enter our own headers later.
8. Shrink the city pair column in the table.
9. Move the table to the right margin and make sure it is higher than the other data fields.
10. Select all data fields (even the ones within the table), and make the text a size 8.
11. Adjust all data fields to the minimum height.
12. To prevent space from showing up between each record, shrink the table upward so that only the
table’s defined fields are visible and one white row is visible (for now).
13. Align objects and text for all fields.
14. Change the format of both of the date fields so they only show the date, not the time.
15. Change the format of the total amount to show a currency sign (if it doesn’t already have one).
16. Remove the table lines (grid).
17. Create column headers
18. Add a totals field in the report band.
19. Align all objects again.
20. Add a page header and footer.
21. Shrink the table so only one row shows.
22. Shrink any bands to take out unnecessary space.
Page 114
Confidential TRX, Inc.
Finished report
Page 115
Confidential TRX, Inc.
Report 5 continued
Create link in Paradox
If your Data Model did not show the links, you can create them manually by following the steps outlined
below.
1. Left-click and hold down the mouse button on the Sect1.db button.
2. Drag the mouse pointer down until it’s on top of Sect2.db and then release the left mouse button.
If you do this properly, a Define Link window will appear (see below).
3. To establish the link, highlight Recordkey in the left window. Just above it a right facing arrow
will appear. Select it. This will automatically establish the link to Recordkey in section 2. (You
could also double-click on Recordkey). Remember, the object in each section has to be the
same type and size. If it is NOT, you will not be able to create the link.
4. Select OK to return to the data model. Notice that there is now a double headed arrow displayed
between sect1.db and sect2.db. This confirms that you now have a valid one-to-many link
between the two sections. You’re now free to define the table in your design as section 2.
Delete Design
If you’ve created a design for your report and the design doesn’t work or if you’ve selected the wrong
design tool, you have the option to delete the current design and start over. You will not lose your query,
just the design of the report.
1.
2.
3.
4.
Close out of the report.
From the Main Menu, right-click on the report name.
Select Delete Design (be careful not to select Delete as that will delete the entire report).
Now, when you right-click again, you can select Edit Design and select a new design tool.
For this report, let’s see what
Page 116
Confidential TRX, Inc.
Report 6 – One to One Link
This will be a three section report with sections 2 and 3 linking back to section 1. Section 1 will be the
master section containing the main ticket information; section 2 will be similar but will only include
refunds, and section 3 will only include exchanges.
Page 117
Confidential TRX, Inc.
Report 6 continued
1. Go to the Main Menu and create a new report called REPORT6.
2. Report Properties
Title – Ticket Spend Summary
Category – Spend Management
Description – Ticket Spend summary includes ticket, refund, and exchange amounts.
3. Section 1 Properties
Issue Date - ID006
Date Period – Month to Date
Date Format – ODBC Date
4. Section Description – Ticket Data
Query
5. Complete the Section 1 query
CL003 – Customer Name
ID029 – Total Ticket Amount : Set the summary type to SUM
6. Enter filters into Section 1 – This is necessary so that section 1 only returns tickets that have not
been refunded or exchanged.
ID074 – Refund Indicator
= ‘N’
ID047 – Exchange indicator = ‘N’
7. Enter Global Filters – There are filters that need to apply to all sections of the report.
ID007 – Void Indicator
ID018 – Vendor Type
= ‘N’
IN (‘BSP’,’NONBSP’)
Page 118
Confidential TRX, Inc.
Report 6 continued
8. Copy Section 1 by clicking on this icon
. Each of the three sections in this report will contain
the same query fields so you can copy this section.
9. Section Properties – The only property you need to add is the link to section 1. The other
properties were copied from section 1 & will remain the same.
Link – Link section 2 to section 1. Do this by entering a 1 in the Link by section.
We do not want to add a checkmark in the 1>Many box this time because we’re doing a one
to one link.
10. Section Description – Refunds.
11. Query Fields – Change the name of the ID029 field to Refund Amount.
12. Filters – Edit the filter for the refund indicator. There are 3 refund indicators Y, P, and N (P =
partial refund). We want data on any kind of refund, so we can do an IN LIST to list Y and P or
we can say that we do not want N.
ID074 – Refund Indicator
Edit the filter <> ‘N’. This means, ‘does not equal NO’.
13. Link – Link the Client Code field in Section 2 to the Client Code field in Section 1.
Right-click in the Client Code field.
Select Properties.
Click the drop-down box next to Link By.
Select Customer Name.
Select OK.
Page 119
Confidential TRX, Inc.
Report 6 continued
rd
Add a 3 section for the exchange information.
1. Copy this section.
2. Change the Section description to Exchanges.
3. Section 3 Properties do not change since the link was created in section 2 & we copied section 2.
4. Query Field – Change the name of the ID029 field to Exchange Amount.
5. Filters – Edit the exchange filter to = Y for yes and edit the refund filter back to = N for no.
ID047 – Exchange Indicator
Enter = ‘Y’
ID074 – Refund Indicator
Enter = ‘N’
6. Link – Link the Customer Name field in Section 2 to the Customer Name field in Section 1.
Right-click in the Customer Name field.
Select Properties.
Click the drop-down box next to Link By.
Select Customer Name.
Select OK.
7. Save the report.
Design
Select the design icon and go to paradox 8 design.
With a one-to-one link, the design is easier to create because of the type of link it is. Unlike a one-tomany link, everything can go into one table.
1. Create a table with the Table Frame tool.
2. Define your table.
Sect1.db – Add all fields.
Sect2.db – Add Refunds
Sect3.db – Add Exchanges
Make sure you use your Ctrl key since you need to add more than one field.
To move from one section to the other, click to the right of the buttons (in the gray area). This will
allow you to then select the down-arrow for your next section.
3. Select the OK button.
Page 120
Confidential TRX, Inc.
Unioning
The unioning of sections is necessary in order to add data from subsequent sections into a previous
section. You will not have a Union in every report. The type of report you want to build and the results
you’re trying to achieve are the determining factors. In a union, Desktop Reporting takes the result set of
one section and adds it to the result set of another section in order to get data from unlike sources into
one result table.
For unions to work, the length and data types of each field from subsequent sections must match the
length and data types of the section they’re unioning into. Example:
Field 1
Field 2
Field 3
Section 1 (Ticket)
Length
Data Type
Passenger
20
A
Issue Date
8
D
Ticket Amt
14
$
Section 2 (Car
Length
Data Type
Passenger
20
A
Issue Date
8
D
Total Car Cost
14
$
In the above example, the length and data type in Field 1 (Section 1) matches the length and data type in
Field 1 (Section 2) and appears in the same order. Both Field 2s match as do Field 3s.
If an amount field in a subsequent section is not used or available, you can substitute a CAL2 field in its
position. Enter a zero as the calculation.
Page 121
Confidential TRX, Inc.
Report 7 - Union
In this report we want to find out the total amount that a client spent on air tickets, car, and hotel. We
want one total for everything. We have a function called Unioning that will do this for us.
Also, this is the first report we’ll be designing in Excel.
1. Create a new report.
2. Name it REPORT7.
3. Add Report Properties
Title – Travel Spend Summary
Category – Air Travel
Description – Summary of spend per client includes air, car, and hotel spend.
Query
Section 1 will end up holding the Total Spend (air + car + hotel spend).
Section1
4. Add Section 1 Properties
Date Field – ID006
Date Period – MTD
Date Format – ODBC DATE
5. Section 1 Description – Total Spend
6. Section 1 – Enter these Query Fields:
CL003 – Customer Name
ID029 – Total Ticket Amount
o Set summary type to Sum.
o Rename the field heading to Total Cost.
7. Section 1 Filters – We only want airline tickets and we don’t want any voids.
Query – Section 2
Section 2 will hold the air spend on its own.
8. Copy Section 1
9. Change the Description to Air Spend.
10. Change the data field heading for ID029 to Air Spend.
We do NOT need to union this section back to section 1 since the Air spend is already
included in Section 1.
Page 122
Confidential TRX, Inc.
Report 7 continued
Query – Section 3
This section holds the hotel spend.
11. Add Section 3 Properties:
Date Field: HTL007
Date Period: MTD
Date Format: ODBC Date
Union – Enter a 1 in the Union Section.
We’re unioning section 3 with section 1 in
order to add the hotel spend to the air
spend per customer.
Section 3 Description – Hotel Spend
12. Section 3 Query Fields:
CL003 – Customer Name
HTL035 – Hotel Cost. Sum it.
13. Section 3 Filters:
HTL008 (Hotel Void Indicator)
= ‘N’
Query – Section 4
This section holds the car spend.
14. Add another section.
15. Enter section 4 Properties:
Date Field – CAR007 (Hotel Issue Date)
Date Period – MTD
Date Format – ODBC Date
Union – Union section 4 to section 1 by adding a 1 in the union box.
16. Enter Section 4 description: Car Spend
17. Enter Section 4 Query Fields:
CL003 – Customer Name
CAR028 – Car Spend. Sum it.
18. Section 4 Filters:
CAR008 (Car Void Indicator)
= ‘N’
19. Save and run with your ABC Corp profile.
20. Close Excel.
Page 123
Confidential TRX, Inc.
Report 7 continued
21. From the query page, select the Report Design button. This will put you in the Edit Design
mode.
NOTE: If changes are made to the design when ‘Run’ or ‘Run with’ are selected, then
the changes will not be saved. You need to be in the Edit design mode.
22. Below is the outline of an Excel Design.
Excel Design Overview
Selecting Excel as the design tool for your report is different than having Desktop Reporting do an Excel
data dump.
When a report is created and no design tool is selected, TRAVELTRAX Desktop Reporting defaults to an
Excel data dump (Excel raw data). There is no design to the report, but the results of the query will
display in Excel. There will be one tab for every section in the query.
Below is an example of a data dump with 4 sections in the query; one tab/sheet per section.
Explanation of tabs for Excel Design
When you select Excel as the design tool, you will see one tab for each section of the report, one tab for
the dates of each section of the report, and one tab for each section for a Multilanguage header (not
currently in use for most clients). You will also see a tab for the profile information (Rpthdng)
Below is an example of the tabs of a report and an explanation of each:
Test – This is the name of the report. This tab contains no data.
Page 124
Confidential TRX, Inc.
Report 7 continued
Rpthdng – This tab contains the data that comes from the profile. It contains the Profile ID, any
headers that were entered into the profile, the report name, and any remarks that were entered in the
profile. This data can be moved to the main sheet for the report to create a header for the report.
Sect – Each section of a report will have its own tab in the Excel design that contains the data results
from the query. So, if we have 3 sections, we’ll have Sect1, Sect2, and Sect3 tabs in the design.
Sect1dt – Each section of a report will have its own tab in the Excel design that contains the date
information. If we have 3 sections, we’ll have Sect1dt, Sect2dt, and Sect3dt tabs.
Sect1MLHdr – Each section of a report will have its own tab in the Excel design that contains any
multi-language header information. If we have 3 sections in the query, then the design will have
Sect1MLHdr, Sect2MLHdr, and Sect3MLHdr.
Page 125
Confidential TRX, Inc.
Report 7 continued
Detach Excel Design
You could design the entire report while attached to the TTX Desktop Reporting application, but we
always detach the design from the tool so we can create multiple versions of the design if necessary.
With Excel, if you create VBA and you make a mistake, you’ll probably lose the entire design and have to
start over. However, if you detach the design from our tool and you keep doing a Save As to save
multiple versions of the design every time you create new VBA code, then you won’t lose all your work.
1. Close out of Excel. When you run a report, a temp file of that report is stored in a temp folder.
2. Access the temp file from C:\Windows\Temp\TMANPRIV.
3. Copy the Excel file to your desktop (In real life, you can copy this file anywhere you want so you
can work on it. You’ll be deleting this file later.)
4. Open the Excel file from that location.
Design
For this first report, we’re going to manually create the design instead of using VBA. This is certainly not
the most efficient way to create the design, but it will give you an idea of what usually needs to be done
when you create an Excel design for your report.
5. Create a new sheet after the last tab and rename it Report. This is where you’re going to put the
final design for your report.
6. Format this tab so you can add a header. Normally we add the report title, the profile name and
that date range(s) in the header. The report title and profile name can be found in the Rpthdng
tab and the dates can be found in each SectDT tab.
Select A1 through E1
Merge & Center
Arial, 14, Bold
Select A2 through E2
Merge & Center
Arial, 12, Bold
Select A3 through E3
Merge & Center
Arial 11
Page 126
Confidential TRX, Inc.
Report 7 continued
7. Reference the data you’ll need for your headers.
In A1 through E1, type =
Select the Rpthdng tab
Select the Report title (cell 2E) and Enter
In A2 through E2, type =
Select the Rpthdng tab
Select the profile name (2C) and Enter
In A3 through E3, type =
Select the Sect1DT tab
Select the date range (2C) and Enter
8. Type in the column headers that you’ll need and format them
You need Client, Total Spend, Air Spend, Hotel Spend, and Car Spend.
9. You need add the data from section 1. This is your main section.
In cell 6A, type =
Select Sect1
Select the first line of data (2A) and enter.
Fill over to the right one column
Fill down about 20 rows. It will have the same data in each cell until you auto calculate.
Hit your F9 key on your keypad to auto-calculate.
You can then delete all the lines rows you don’t need.
10. To get your Air, Hotel, and Car Spend, you’ll have to find the corresponding data for each client
so you’ll have to create a VLOOKUP.
=VLOOKUP($A6,Sect2!$A$1:$B$6,2,FALSE)
Fill down that column and auto-calculate (F9)
Repeat these steps for the hotel and the car spend. Just make sure to change the
VLOOKUP so it references the correct section.
11. Add Totals
Add totals below each column.
12. If you have VBA in your design, you always have to make sure the report is kept in its preprocessed form (the macro has not run and all sheets are visible). This does not apply to this
report since we didn’t use VBA.
13. Save your report and exit out of Excel.
Page 127
Confidential TRX, Inc.
Report 7 continued
Re-attach Excel Design
Since you created (or changed) the design outside the TTX Desktop Reporting tool, you’ll need to reattach your design to the tool. Follow the steps below to re-attach an Excel design:
14. Open Report 7 in TTX Desktop Reporting.
15. Select Edit Design from the main menu or click on the Report Design button if you opened the
report and are on the query page (you have to be in the edit design mode). Use the ABC Corp
profile and the default dates.
16. When the report displays, close the workbook but NOT Excel (click the lower X in the upper-right
corner).
17. Select File – Open and browse to the folder containing your modified Excel design.
NOTE: Do not open the document outside of Excel
Do not go to Recent documents to open the Excel file.
You need to do File-Open so you have the ability to open the report, activate the
macros, but not run them (how you do that depends on what version of Excel
you have).
18. Select your Excel report.
19. Prevent any macros from running and clear most, or all, data from
each Section tab.
Page 128
Confidential TRX, Inc.
Report 7 continued
20. Save As and save the report to
C:\WINDOWS\Temp\TMANPRIV.
21. Instead of entering a name, select your original report and
choose to overwrite when prompted.
22. Close Excel. This has reattached you design to TTX DR.
The report with all your changes is now saved to the
database.
23. To verify this, go back into TRAVELTRAX Desktop Reporting
and run the report.
Page 129
Confidential TRX, Inc.
Report 8
In this report, you’ll learn how to create an Excel design using VBA code within Excel. You will learn
basic concepts of VBA code and you’ll learn how to apply those basic concepts to different report
designs.
Query
You’re going to start looking at a report yourself to determine what fields are needed, whether the report
is a summary report or a detailed report, how many sections are needed, and what data fields you need
to put into each section.
Look at the report above to enter the information needed to create this report.
1. Create a new report and name it REPORT8
2. Add the Report Properties
Enter Executive Summary as the report title.
Select a category that makes sense to you.
Enter a description based on the report you see above.
3. Add the Section Properties
IssueDate
Months’ worth of data for the current month
4. Enter a section description
You need to start thinking about what you’d want to see if someone else was creating this
report.
Enter a description of the data that will be entered into this section. You should already
know what data you’ll enter into this section before you get started.
Page 130
Confidential TRX, Inc.
Report 8 continued
5. Enter the data fields and filters necessary to create the report you see on the screen in class.
Enter the data field numbers below for the following:
Air Spend
______________
Number of Tickets
______________
Full Fare
______________
Low Fare
______________
6. Add Filters – Using filter assist, add the filters we normally add for ticket data. Enter the data
fields needed and the SQL for the filter.
____________
________________________________________
____________
________________________________________
Design
7. Select Excel as the design tool (when it asks you to run the report, run it with the default dates
and use the ABC Corp profile).
8. Close out of Excel and you’ll be taken back to the query.
9. Access the Temp folder: C:Windows\Temp\TMANPRIV
10. Copy the Report8 Excel file and copy it to your desktop.
11. Open Report8 from your desktop. Now you’re ready to create the Excel design.
12. Determine what you’ll need for the report header. List what you think/know your company wants
in your report header.
_______________________________
_______________________________
_______________________________
_______________________________
_______________________________
Page 131
Confidential TRX, Inc.
_______________________________
_______________________________
Page 132
Confidential TRX, Inc.
Report 8 continued
13. Determine what columns/rows you’ll need and add the column/row headers.
Since the column/row headers are static, you can just type them in.
You will need to format the text (font size, font type).
Add borders if necessary.
14. Think about the other things you’ll need to do to get the data from both sections into the Report
sheet. Write them below:
15. Access VBA code using one of the following options:
Right click any sheet and View Code.
2003: Tools – Macros
2007: Developer – Visual Basics (in the code section)
16. Insert a module – You can separate your code into different modules if you want to.
In the top, left box under VBAProejct, right click and select Insert – Module.
Page 133
Confidential TRX, Inc.
Report 8 continued
17. Create a sub routine.
Sub Name() – Type the word Sub then type in the name of the sub routine. You can name
the sub routine anything you want. You’ll have to refer to this name later in the code.
Example: Sub DoNotRun()
The trainer will give you the VBA code for this report. Copy & paste it into this module.
Page 134
Confidential TRX, Inc.
Report 9
This is a report to show the Airline Spend for Month to Date and Year to Date. We will select Excel as the
design tool.
We’re going through all the steps a report developer would normally take when creating an Excel design.
We hit on them briefly in the last report, but we’ll go into those steps more in depth during this report.
Query
24. Create a new report called REPORT9.
25. Report Properties
Title
Category
Description
Air Spend Comparison
Air Travel Summary
Ticket Summary Comparison MTD & YTD
26. Section Properties
Date Field
Date Period
Date Format
ID006
MTD
ODBC Date
27. Section Description
Ticket Summary MTD
28. Query Fields
ID021
ID045 (Sum)
ID029 (Sum)
Rank – Top 25 Airlines by TotalAmt
29. Add Filters
ID007 = ‘N’
ID018 IN (‘BSP’,’NONBSP’)
30. Add a new section
31. Section Properties
Change Date Period to
YTD
32. Section Description
Ticket Summary YTD
33. Add Query Fields (You will not rank the data in this section)
ID021
ID045 (Sum)
ID029 (Sum)
34. Run the report and use the default reporting periods.
This is a data dump and will only display 2 tabs: one for each section.
Page 135
Confidential TRX, Inc.
Report 9 continued
35. Close Excel.
36. From the Query page, select the Report Design button (or Tools – Report Design) and select
Excel as the design tool. This is the Edit Design Mode.
When you select Excel as the design tool, Desktop Reporting forces you to run the report, so
select the default dates and the ABC Corp profile.
Design
When doing an Excel design using VBA, you may need to create many copies of the design just in case
some of the code doesn’t work. These are the steps to follow to copy the report design to a location on
your computer that is outside of the TTX Desktop Reporting tool.
37. Close Excel again. This will bring you back to the Query page.
38. Go to the temp folder and copy report9: C:\Windows\Temp\TMANPRIV
Right click on the Report9 and Copy.
39. Paste it on your Desktop (remember that you can paste your file anywhere you want…we’re just
pasting them to the desktop in class).
40. Open the Excel file for this report from your desktop. Now the design is detached and you can
create as many copies as you need.
If you’re using VBA, create a new copy of the report for every piece of VBA you create. That
way, you can always take a step back if the VBA code doesn’t work and you won’t have lost
any of your previous work.
41. Select the first sheet and rename it Main.
We usually start out the design in this sheet and then copy it to the REPORT tab that we’ll
create. When you do this, the formulas you create won’t display to the users.
42. Select cell A2 in the Main sheet and reference the first airline from Section 1 of this report
Type =
Select the Sect1 sheet
Select cell A2
Enter
43. Select cell B2 in the Main sheet and reference the Bookings for that first airline.
Type =
Select the Sect1 sheet
Select cell B2
Enter
44. Select cell B2 in the Main sheet and reference the amount for that first airline.
Type =
Select the Sect1 sheet
Select cell C2
Enter
Page 136
Confidential TRX, Inc.
Report 9 continued
45. Select cell D2 in the Main sheet and reference the bookings from Sect2 for that first airline (you’ll
have to find the airline name to get the cell reference).
Type =
Select the Sect2 sheet
Select cell B(line nbr that the airline is on)
Enter
46. Select cell E2 in the Main sheet and reference the bookings from Sect2 for that first airline (you’ll
have to find the airline name to get the cell reference).
Type =
Select the Sect2 sheet
Select cell C(line nbr that the airline is on)
Enter
47. Create a new sheet after all other sheets and name it REPORT.
This is where we always move our final design for our report.
48. Add formatting for the report header: We’ll merge & center and change the font style & size for
the header. The header will include the Report Title, the Profile used and the dates you ran the
report for.
Select A1 through D1
Merge & Center
Arial, 14, Bold
Select A2 through D2
Merge & Center
Arial, 12, Bold
Select A3 through D3
Merge & Center
Arial 11
Select A4 through D4
Merge & Center
Arial 11
49. Create Date Headers for MTD and YTD
Select Cells 5B & C
Merge & Center
Type MTD
Arial 11 Bold
Select Cells 5E & F
Merge & Center
Type YTD
Arial 11 Bold
50. Create column headers: Type in the column headers that you’ll need and format them.
Cell 6A – Add Airline
Cell 6B – Add Bookings
Cell 6C – Add Air Spend
Cell 6E – Add Bookings
Cell 6F – Add Air Spend
Page 137
Confidential TRX, Inc.
Report 9 continued
51. Create VBA code – Right click any tab/sheet at the bottom of the page and select View Code
(you can also click on your Developer tab at the top of the page and select Visual Basic in the
Code section).
52. In the left column under VBAProject, right-click and Insert – Module. This is where you’ll enter
your VBA code.
In class, we’re going to give you some code that you’ll be able to copy and paste into this
module. We’ll also send the file to you so you can use later.
53. Paste the VBA code given to you into this module.
Auto Open – This subroutine will prevent the report from running when the user first
opens it. It will then find the last data row in Sect1. Then it will fill down in the Main sheet
and turn on the Auto Calculation to paste the data from Sect1.
Copy Paste Data – This subroutine will copy the data from the Main sheet and paste it
into the Report sheet starting at row 8, column A (or 1).
Header Add – This subroutine will enter the report title, name, the YTD dates and the
MTD dates and the report Name.
DelSheets – This subroutine will delete all sheets/tabs except for the last one. This is
why we put our final design in the last sheet. You also have the option to hide sheets
instead of deleting them, but we’re deleting them in our example.
54. Before you run through the VBA to make sure it works, make a copy of the report (Save As). This
way you’ll have a copy of the report with all the VBA code, but it will be in its pre-processed form,
which is what you’ll need later.
55. In the newest version, step through the VBA code to make sure it works.
To do this, pull up the code (right-click one of the sheets and View Code), double click on
the word Module.
Minimize Excel and the VBA so you can see both on your screen at the same time.
F8 Key – We’re going to walk through the code to see what it does. The cursor should
be before Sub Auto_Open. If not, put the cursor there and click on the F8 key on your
keyboard. This will walk through the code line by line.
56. Once you’ve determined that the code is correct and it does what you want it to do, then copy the
code, pull up the previous version of the report design and paste the code into that. We have to
do that because we need a version of this report that is in its pre-processed form (the macro has
not run and all sheets are visible).
When you pull up the previous version of the report, you have to browse to pull it up.
You cannot pull up a copy by going to Recent Documents. Access your libraries/my
computer and find the document from there.
Click on the previous version of the report, hold down your shift key on your keyboard
and then click Open.
It will ask you to enable or disable macros. Hold down your shift key again and click
on Enable macros. This will allow you to pull up the document and enable the
macros without the macros actually running.
Pull up the VBA code, and paste in the entire code that you copied.
Click Save and remember that this is your final report design.
Page 138
Confidential TRX, Inc.
Close out of Excel
Page 139
Confidential TRX, Inc.
Report 9 continued
57. Go back to Desktop Reporting, and go to this report and Edit Design (Design Report).
58. When the report displays, close the workbook but NOT Excel (click the lower X in the upper-right
corner).
59. Select File – Open and browse to the folder containing your modified
Excel design.
60. Select your Excel report.
61. Prevent any macros from running and clear most, or all, data from
each Section tab.
62. Save As and save the report to C:\WINDOWS\Temp\TMANPRIV.
63. Instead of entering a name, select your original report and choose to
overwrite when prompted.
64. Close Excel. The report with all your changes is now saved to the
database.
65. To verify this, go back into TRAVELTRAX Desktop Reporting and
run the report.
Page 140
Confidential TRX, Inc.
Batch Generator
The Batch Generator is where you setup which profiles and associated reports you want to generate. It
provides the means to produce one to hundreds of unattended reports in several formats.
You can elect to output all or any combination of your reports in any combination of the following ways:
Report Output
Printer
Screen
E-Mail
Compress using ZIP
Standard output.
Send to any available printer.
Send to your computer monitor.
Electronic transmission of PDF file with MailMan installed.
Compresses the PDF file(s) into a single zip file.
Text Output
Delimited
Fixed Length
E-Mail
Compress using ZIP
Raw text data output.
Data elements separated by a common text element [e.g. comma].
Data elements are located in a fixed position on each row.
Electronic transmission of text file.
Compresses the text file(s) into a single zip file.
Spreadsheet Output
E-Mail
Compress using ZIP
For use with Microsoft Excel.
Electronic transmission of Excel file.
Compresses the Excel file(s) into a single zip file.
Page 141
Confidential TRX, Inc.
Create a Batch Exercise
In this exercise you will learn how to create a new batch from which you can run existing reports. Later,
this same batch will be used to generate the reports you will build in class.
1. Select the New icon and then select Batch from the drop-down list.
2. When the New Batch window appears, type MONTHLY then select OK.
3. Select ABC Corporation from Available Profiles.
4. Click on the right arrow to move ABC Corporation to the upper right window.
5. Select the ABC Corporation profile in the upper right window to bring up a list of all available
reports assigned to that profile.
6. Select two of the reports that are in the Available Reports window and click on the right arrow to
move them to the Selected Reports window.
Page 142
Confidential TRX, Inc.
Batch Generator Exercise continued
7. From the main batch window, select Batch, then Properties.
8. Select the Load Dates button to bring up a list of the Reporting Period labels for all reports in
your batch.
9. If required, edit the Begin Date and End Date. (In class, leave the default dates.)
10. Click the Skip Failed Reports check box. If this is unchecked, no report after the failed report
will run.
11. Click OK.
12. To run the reports in the batch, select the Run Batch icon (looks like a lightning bolt).
Page 143
Confidential TRX, Inc.
Prompts
This section will show you how to create prompts in a report. To give a user the ability to select specific
data within a data field, you can create a prompt that allows them to enter the data or to choose the data
from a list. Below are the different types of prompts that you can create along with an example and an
explanation.
When you enter a prompt into the data fields, it is mandatory for the user to select/add a value.
When you enter a prompt into the filter section, it is not mandatory. The user has the option to
override the prompt and still return all data for that specific data field.
The prompt string cannot exceed 30 characters. This means that the length of the text you add
cannot be more than 30 characters long. In the first example below, the text is Airline Code.
Regular Prompts
This type of prompt will display when the user runs the report.
=’~{Airline Code}’
The format is explained as:
Equals sign, single quote, tilde, left French brace , the words you want to display for the
prompt (in this example it is Airline Code), right French brace, single quote.
The equals prompt above will display the name of the prompt (in this example Airline Code) and
allow the user to enter one specific data field.
IN (~{Airline Code})
The format is:
The word IN, open parenthesis, single quote, tilde, left French brace, the words you want
to display for the prompt, right French brace, single quote, close parenthesis.
The In List prompt above will display the name of the prompt (in this example, Airline Code) and
allow the user to enter multiple, specific data fields.
Default Prompt
Default prompts will display the name of the prompt AND display a default value for that prompt. The
user has the option to leave the default value or change it if necessary.
= '~{Airline Code},AA}'
This format is:
Equals, single quote, tilde, left french brace, prompt name, right french brace, a comma,
the default value, right French brace, single quote.
The example above will give the user a prompt that has a default value of AA. They can change
this value or leave the default value. This prompt will not allow a blank value, thus returning ALL
values.
Page 144
Confidential TRX, Inc.
Pick List Prompt
A Pick List prompt will display a list of values that the user can select from. This option allows the user to
pick from the list or enter a value(s) manually. The list has to be created before doing the steps below.
In the filter section, click and drag the data field that holds the value needed.
Right-click in that column and select Pick List.
Select List Object and the pick list box will activate.
Select the list you need from the options that display.
Click OK.
Right-click the filter and select Edit Filter.
Enter the SQL that will give you the prompt you want.
Page 145
Confidential TRX, Inc.
Pick List report:
A Pick List report is a separate report you create to run a query and return data that will then be used to
display a list that the user can select from. The advantage of using this is that it will only allow the user to
select from a list of values that currently have data.
Create Pick List Report
Create a new report.
Name it using a naming convention that will let everyone know this is a pick list report.
Access the section properties and select Distinct. This will only show each value once.
Select the data field that will return the value you need for the list (you can add multiple values in
this one Pick List report).
Enter any filters necessary.
Save the report.
Create a Pick List from a Pick List Report
Click and drag the data field you need for the list into the filter section.
Right-click that data field and select Pick List.
Select DART report and click OK. A list of all your reports will display.
Select the correct pick list report.
Then select the Return Value From field you need (the data field entered into the pick list report.
Click OK.
Page 146
Confidential TRX, Inc.
Char Index Prompt
The CHARINDEX function is used to search a character string for a specific character or set of
characters. If the character string being searched contains the characters being searched for, then this
function returns a non-zero integer value. This integer value is the starting location of where the character
string being searched for is located within the string being searched.
CHARINDEX ( expression1 , expression2 [ , start_location ] )
Where expression1 is the string of characters to be found in expression2, and start_location is the
position where the CHARINDEX function will start looking for expression1 in expression2.
start_location is an optional field. If you don't specify a start location or if you specify 0 or negative
number, the search starts from beginning of expression2.
Here is an example of a charindex:
CHARINDEX('~{Airline Code1}',[ID020])*[ID029]
CHARINDEX
the statement expression
{‘~{Prompt Name}’
A prompt will display for the user to add the value they want to search for.
In the example above, the user will enter an airline code and the query will
search for that airline code in the ID020 data field.
,[ID020]
This is expression 2 of a charindex statement – The query will look in this data
field, ID020, for the value that has been added in the prompt.
*[ID029]
In this example, every time the query finds each airline code the user added in
the prompt, it will return a value of 1. Then it will multiply 1 times ID029 which is
the ticket amount. This will give us ticket amounts for specific airlines only. If the
airline code chosen in the prompt is not in the data, it will return a 0 (zero) and
when it multiplies 0 x ticket amount, it will return 0 as the result.
Page 147
Confidential TRX, Inc.
SQL Statements
SQL is used when creating calculations and filters. This section will show you the most common SQL
statements used in reports.
ISNULL
The ISNULL function is used to replace NULL values with another value. Here is an example of an
ISNULL statement:
ISNULL([ID021],’Unknown’)
ISNULL
([ID021]
,’Unknown’)
SQL expression
The data field to check for Null values (ID021
The replacement value for any results that are returned with a Null value.
IN (‘BSP’,’NONBSP’)
This SQL statement is used to select air and rail as the only vendor types returned in a report. BSP and
NONBSP are vendor types that will return air and rail tickets that were issued through ARC, BSP, or were
consolidator tickets.
IN
(‘BSP’
,’NONBSP’)
SQL Expression to start an IN-List. Use this when you have more than one value.
Open parenthesis, single quote, value, single quote.
Comma to separate each value, single quote, value, single quote, close
parenthesis.
Month
This SQL statement is used to show the first three letters a month. It is used when you only want to see
the abbreviation of a month instead of the full issue date.
Calc 4
SUBSTRING(CONVERT(CHAR(12),DATENAME(MONTH[ID006])),1,3)
Year
This SQL statement is used to show the two digit year.
Calc 2
YEAR([ID006])
Month and Year
Calc 4
substring(convert(char(12),datename(month,[ID006])),1,3)+’‘+substring(convert(varchar(4),year([ID006])),3,2)
Page 148
Confidential TRX, Inc.
Customization
Within the Desktop Reporting tool, each company is able to customize certain things. They can create
custom calculation fields, their own reporting periods, their own filters for filter assist, and their own
lookups based on their individual needs. Below are some of the things within Desktop Reporting that they
can customize.
Calculations
To create a calculation that will be saved in the Data Dictionary:
8. Click on the Data Dictionary icon.
9. In the left column under Data Dictionary, click on Calculations.
10. Then, right-click on Calculations and select New Calculations.
11. Complete the New Calculation window.
Field number – Default is the next number available but can be changed to anything you
want. It has to start with CAL.
Field name – Name the field so people know what data will be returned.
Field heading – Enter the heading you want displayed for this data field.
Type – select the type of field this will be (see User Guide for type descriptions).
Length – Enter the maximum length you want for this field.
Calculation – Enter the calculation by typing it in the box or clicking on the button to open the
Expression Builder window.
Expression
Builder Icon
Page 149
Confidential TRX, Inc.
Filter Assist
If you use the same filters over and over again in reports, you may want to put them into the Filter Assist
so you don’t have to create them for each report.
1. You have to add the filters to your query page and enter the SQL statements.
2. Click on the Filter Assist button
. It will display the box on the left, below.
3. To enter an entire row of filters (if you want to add multiple filters at one time) click at the
beginning of the row where you see the word ‘Filter’ and you drag that into the left box called
Rows.
4. To enter each filter separately, click on the name of the data field and drag it into the Columns
box. The filters are then ready to use.
To Use the filters in Filter Assist
Once the filters are in Filter Assist, they can be used by anyone in that particular company that has
access to TRAVELTRAX Desktop Reporting. To enter a filter that exists in Filter Assist, click on the filter
(or row of filters) you need to add and drag & drop it into the filter field.
Page 150
Confidential TRX, Inc.
Reporting Periods
This screen contains the master Reporting Periods for TRAVELTRAX. Batch Generator uses these
reporting periods when you generate reports.
Add Reporting Period
Follow the instructions below to add a reporting period
1. Click on Tools.
2. Select Reporting Periods.
3. Select the Add icon.
4. Enter the Date Name.
5. Enter the Beginning Date and Ending Date.
Add
Copy
Delete
Delete Reporting Period
If a report period is no longer needed, it can be deleted from the list.
1.
2.
3.
4.
Click on Tools.
Select Reporting Periods.
Select the reporting period to delete.
Select the Delete icon.
NOTE: If you delete the reporting period any report that contains that reporting period will not have
default dates set. It would be a good idea to find all the reports that use a reporting period and change
them in the report before you delete the reporting period from this list.
Page 151
Confidential TRX, Inc.
Category Editor
Use this screen to add, copy, or delete categories. You can create categories for both Profiles and
Reports. Select Profiles or Reports from the Category Type drop-down list before you add, copy, or
delete a category.
Add a Category
1. Select Tools.
2. Select Category Editor.
3. Select the Category Type (Profiles or Reports).
4. Select the New icon.
5. Enter the category name.
6. Select OK.
7. Select File – Save.
8. Select the Exit icon.
Delete a Category
1.
2.
3.
4.
5.
6.
7.
8.
Select Tools.
Select Category Editor.
Select the Category Type (Profiles or Reports).
Select the category to delete.
Select the Delete icon.
Select OK.
Select File – Save.
Select the Exit icon.
NOTE: Before you delete a category, find all the reports or profiles assigned to that category,
change them to the correct category first and then delete the category that you no longer need. If you
delete a category and reports or profiles are still assigned to that category, those reports or profiles will no
longer display on the Web Reporting site.
Page 152
Confidential TRX, Inc.
Lookups
The Lookup option allows you to build a new field based on an existing field in the Data Dictionary. One
reason to do this is to provide meaning to coded fields within your database.
For example, the Domestic/International field could have the following codes: D, I, T, and F. If you want
to see the words Domestic and International instead of the codes, you would build a Lookup. The code D
would be set up to be Domestic and the codes I, T, and F would be set up to be International.
Building a Lookup Exercise
In this exercise you will build a Lookup (table) on the International Indicator (IND025). When you’re
finished, you’ll be able to display the words Domestic and International in your reports just as easily
but with more meaning than the D and I that reside in your database.
1. Select the New icon, and then Lookup from the drop-down list.
2. Using the drop-down-list, select the Alias associated to your database (usually TMAN).
3. In Lookup Name text box, type DOMINT.
4. Add a description: International Indicator.
5. Select OK.
Page 153
Confidential TRX, Inc.
Building a Lookup continued
6. Drag ID025 - InternationalInd to the left window.
7. Click the Add values for the topmost field icon.
Add Values to Lookup
By selecting load values, you will retrieve a distinct list of values from the database that define the
International Indicator. (A blank row can also be a value.)
8. Complete the Text column with D for Domestic and I for International.
9. Select OK.
Page 154
Confidential TRX, Inc.
Building a Lookup continued
Completed Lookup
Your Lookup window should now look like the figure below.
10. Select the Exit Lookups icon to save your work and to return to the Main Menu.
Page 155
Confidential TRX, Inc.
Lists
This option allows you to build a list of data that can be used to build SQL expressions. Lists can be used
anywhere you enter a SQL expression such as Calculations or Filters in reports or in profiles. Please see
the steps below to create a new list.
Build a List Exercise
1. Select the New icon (or File – New ) and select List.
2. Enter the name of the list (example: Preferred Airlines).
3. Enter a description of the list.
Page 156
Confidential TRX, Inc.
4. Click the Add Value button and enter one value. Repeat this step for every value that needs to
be added.
5. When the list is complete, either click on List – Save, or click on the Exit List Editor button and it
will prompt the user to save the list.
How to Use a List
To use the list, either within a calculation or a filter, you will have the Expression Builder box open. Enter
the other parts of the SQL statement and then click on the name of the list and drag it into the expression
box.
Reminder: You still have to create
the rest of the SQL statement in
the expression box. When you use
a list, you’re just inserting that list
into your SQL statement instead of
having to type it out manually.
Page 157
Confidential TRX, Inc.
Import/Export
You can export or import reports, profiles, lookups, scripts, batches, lists, and dictionaries to/from your
environment to another environment. External clients can use this to send TRX things that may not be
working. We would then import them into our environment to see what the problem might be.
Export
You can export any object so that it can be transferred to someone else’s TRAVELTRAX, or to create a
back-up copy of reports, profiles, batches, etc.
1. From the main menu, choose Tools.
2. Select Export to XML or Export to Paradox.
3. Select the type of object to be exported. You can also Select All to choose all objects.
4. Choose the item(s) to be exported.
5. Select the Export button. It will prompt you to choose a directory.
Export Reports Screen
Page 158
Confidential TRX, Inc.
Import
Choose this option to Import TRAVELTRAX Reports, Profiles, Batches, etc. that were exported
from your or another person’s copy of TRAVELTRAX. You must select the directory where the
files are located before you can begin the import process.
Page 159
Confidential TRX, Inc.
Portal
The TRAVELTRAX Portal gives you the ability to license your TRAVELTRAX software, review incidents,
submit new Support requests, and download documentation.
The site is designed to help you quickly find the information you are looking for and to help you manage
your Support incidents.
Home Page
The Homepage of the TRAVELTRAX Portal gives general information on TRAVELTRAX.
Page 160
Confidential TRX, Inc.
Licensing
The licensing section allows you to re-license your TRAVELTRAX software. To use this tool, please
follow the instructions below.
1. Click on the Licensing tab.
2. Get the challenge code from the software you need to re-license. Each piece of software below
has a licensing option within the application. If your license has expired, you can click on that
option and it will give you a challenge code.
3. Enter the challenge code in the appropriate section for the software you need to re-license.
TravelMan – Also known as TRAVELTRAX Desktop Reporting.
QualitMan – Also known as Data Quality Manager.
WebMan – Also known as TRAVELTRAX Web Reporting.
4. Click the Submit button under the correct section.
Page 161
Confidential TRX, Inc.
Documentation
In this section you will find documents that cover various TRAVELTRAX subjects. Click on the name of
the document to download it.
Page 162
Confidential TRX, Inc.
Create a Support Request
Below are the steps to take when you need to create a TRAVELTRAX Incident/Ticket. These tickets
should be created when you are having problems with any TRAVELTRAX application.
1. Access the TRAVELTRAX Portal: https://portal.traveltrax.com.
2. Enter your email address and password. This will display the TRAVELTRAX Portal home page.
Page 163
Confidential TRX, Inc.
Create a Support Request continued
3. Click on the Support Request tab. This will display the Support Request page with your contact
information pre-filled according to your login.
If any contact information needs to be changed, please make the changes in the appropriate
boxes.
4. Click the drop down area and select the area of customer support that best applies to your
situation.
5. Enter the subject for your support request.
Page 164
Confidential TRX, Inc.
Create a Support Request continued
6. Enter a summary of your problem/issue in the Comments’ box. Put in as much detail as possible
so the problem can be researched and resolved.
7. If more detail is needed (such as screenshots, word documents, etc.), please enter the file(s) by
clicking on the Browse button, selecting the file(s) and clicking the Upload button.
8. Once all information is entered, click on the Submit button. The Support Request will
automatically be sent to the TRAVELTRAX helpdesk and research will begin.
Page 165
Confidential TRX, Inc.
View an Incident
Once a support request form has been entered, the user may check the status of the incident by following
the steps below:
1. Click on the Incident tab.
2. Enter the Incident number.
3. Click on the Go button. This will display the incident information which includes the following:
The date this incident was last updated.
The status of this incident.
The target completion date or comments.
The date this incident was created.
The title of the incident when it was submitted.
The incident history
o The date and time the incident was last updated by anyone.
o The name of person that last updated the incident.
o Comments entered the last time the incident was updated.
Page 166
Confidential TRX, Inc.
Search for an Incident
If you do not have the incident number, you can search for any incidents that have been created by
anyone in your company. Follow the steps below to search for an incident:
1. Click on the Incident Search tab.
2. Enter one or more of the following (this will depend on what information you have to search
with/for):
Search Comments – enter the search comments to pull up an incident that includes
those comments.
Date Range – enter a date range (start & end date). This will search for incidents that
were created by someone in your company within those dates.
Search Incident Number – enter the incident number if you have it.
3. Click on the Search button. This will display the incident or a list of incidents that match the
search criteria.
List of incidents
that match the
search criteria.
Page 167
Confidential TRX, Inc.
Report Examples
Page 168
Confidential TRX, Inc.
Page 169
Confidential TRX, Inc.
Page 170
Confidential TRX, Inc.
Page 171
Confidential TRX, Inc.