1
Placing Grid Labels and Tick Marks
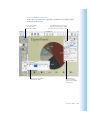
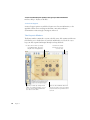
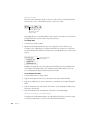
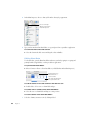
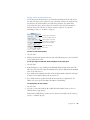
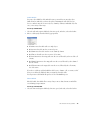
The X-Axis and Y-Axis pop-up menus in the Axis pane of the Chart Inspector provide an array
of options for placing tick marks and labels along the value axis or the series axis. These popup menus, pictured below, contain different options depending upon which kind of chart
you have selected.
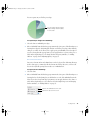
For vertical bar charts (column charts), line charts, and area charts, the Y-axis is the value
axis, while the X-axis is the series axis; for horizontal bar charts, the X-axis is the value axis.
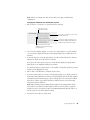
Here, pop-up menus are pictured as they appear when a column chart is selected.
X-Axis Markings (or Series Axis Markings)
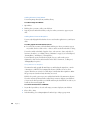
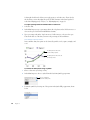
To place grid labels and tick marks along the series axis:
m For a column chart, choose options from the X-Axis pop-up menu in the Axis pane of the
Chart Inspector. (For horizontal bar charts, choose from among these same options in the
Y-Axis pop-up menu.)
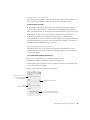
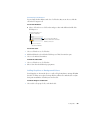
Set the text direction for
the series axis labels.
Place tick marks along
the X-axis.
Show or hide the X-axis gridlines.
Show or hide the minimum
data value on the series axis.
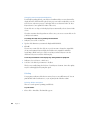
Y-Axis Markings (or Value Axis Markings)
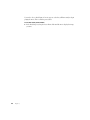
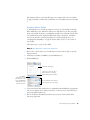
To place grid labels and tick marks along the value axis:
m For column charts, choose options from the Y-Axis pop-up menu in the Axis pane of the
Chart Inspector. (For horizontal bar charts, choose from among these same options in the
X-Axis pop-up menu.)
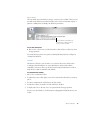
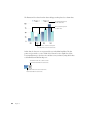
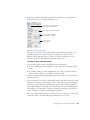
Show or hide the value axis labels.
Place tick marks
along the Y-axis.
Show or hide the
Y-axis gridlines.
68
Chapter 6