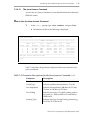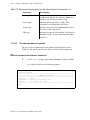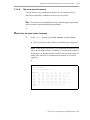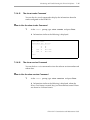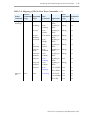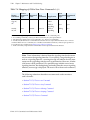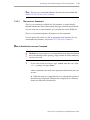
1
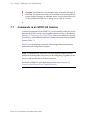
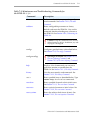
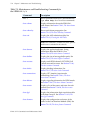
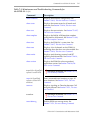
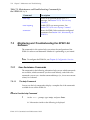
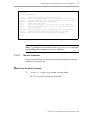
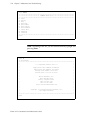
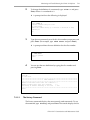
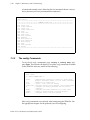
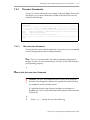
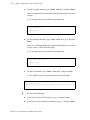
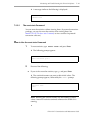
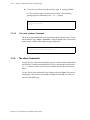
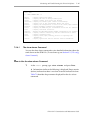
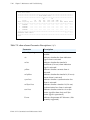
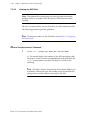
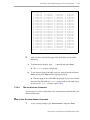
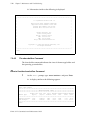
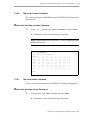
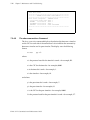
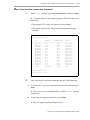
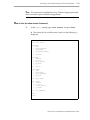
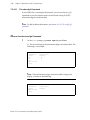
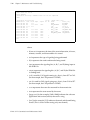
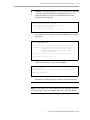
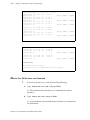
Chapter 7 Maintenance and Troubleshooting T his chapter covers post-installation maintenance instructions for the SP201-SA. It describes the commands that will help you troubleshoot the SP201-SA and keep it operating smoothly. It also presents a list of problems that could occur during installation or maintenance, and suggests actions to try before calling Technical Services. This chapter includes the following sections: • Section 7.1, Commands in an SP201-SA Session • Section 7.2, Monitoring and Troubleshooting the SP201-SA Software • Section 7.3, Troubleshooting the SP201-SA Hardware If you have tried all recommended actions but still have not resolved the problem, contact Encore Networks Technical Services at [email protected], 703-318-4350 (voice), or 703-318-4371 (fax). Be prepared to furnish your currently installed hardware configuration, the software release you are using, and detailed information about the problem. SP201-SA™ Customization and Maintenance Guide 7-2 Chapter 7: Maintenance and Troubleshooting ! 7.1 Caution: The SP201-SA is not designed to be serviced in the field. If the SP201-SA malfunctions and you are unable to isolate the problem, contact Encore Networks as indicated above. Do not remove the cover or disassemble the SP201-SA, as doing so may void its warranty. Commands in an SP201-SA Session To execute commands for the SP201-SA, you first need to establish a session between the SP201-SA and a user-supplied control console, as described in Section 1.5, Connecting to the Control Console. After you establish this session, you will use a command line interface to execute the operational commands listed in Table 7-1. Table 7-1 lists monitoring commands. The configuration commands are discussed in the configuration chapters. Note: In all commands, make sure you type the port number or trunk number that corresponds to the port you are configuring, regardless of the port or trunk number shown in the instructions. For details of SP201-SA port numbering, see the Note in Section 1.3, Connecting the SP201-SA to the Telephony Network. SP201-SA™ Customization and Maintenance Guide Commands in an SP201-SA Session 7-3 Table 7-1. Maintenance and Troubleshooting Commands for the SP201-SA (1 of 4) Command Description alias Defines numbers 0–9 to represent frequently used commands. See Section 7.2.1.2, The alias Command. coldstart Resets configurable parameters to factory defaults and resets the SP201-SA. You use this command after downloading new software to the SP201-SA. See Section 2.4.3, Coldstarting the SP201-SA. ! config x Caution: Using this command causes all userdefined settings to be lost. In addition, any calls in progress are dropped. Configures specified items as described below. See Section 7.2.2, The config Commands. config traceflags ! help Displays a list of commands you can use to provision, monitor, or troubleshoot the SP201-SA. See Section 7.2.1.1, The help Command. history Lists the most recently used commands. See Section 7.2.1.3, The history Command. reset x Resets specified items as described below. Type reset help for a list of reset commands. reset chan Resets specified channels to their initial states. See Section 7.2.3.1, The reset chan Command. reset stats Resets statistical counters to initial values. See Section 7.2.3.2, The reset stats Command. reset systimer Resets the relative clock time to 0 (zero). See Section 7.2.3.3, The reset systimer Command. No Longer Available. See Section 7.2.5.3, The trace isdnmsg Command, and Section 7.2.5.4, The trace isupmsg Command. SP201-SA™ Customization and Maintenance Guide 7-4 Chapter 7: Maintenance and Troubleshooting Table 7-1. Maintenance and Troubleshooting Commands for the SP201-SA (2 of 4) Command Description show x Shows specified information as described below. Type show help for a list of show commands. show alarms Displays information about the SP201-SA’s trunk alarms. See Section 7.2.4.1, The show alarms Command. show almrelay Shows trunk alarm propagation. See Section 7.2.4.2, The show almrelay Command. show ani Displays the ANI substitution table. See Section 7.2.4.3, Viewing the ANI Table. Note: This command is available only if the optional ANI feature is included in the software. show banner Displays the application banner, listing information about the SP201-SA. See Section 7.2.4.4, The show banner Command. show buffers Displays the size of message buffer pools. See Section 7.2.4.5, The show buffers Command. show ccstates Displays each ISDN channel’s SS7–ISDN Call Control state and last event. See Section 7.2.4.6, The show ccstates Command. show clocks Displays clocking information. See Section 7.2.4.7, The show clocks Command. show connections Displays CIC/timeslot/peer timeslot relationships. See Section 7.2.4.8, The show connections Command. show dchans Displays signaling information for ISDN trunks. See Section 7.2.4.9, The show dchans Command. show events Displays a list of the events and states for each protocol. See Section 7.2.4.10, The show events Command. show fgd Displays the information digits translation table for Feature Group D. See Section 7.2.4.11, The show fgd Command. show framers Displays the configuration and status of the trunks on the Line Interface Module (LIM). See Section 7.2.4.12, The show framers Command. SP201-SA™ Customization and Maintenance Guide Commands in an SP201-SA Session 7-5 Table 7-1. Maintenance and Troubleshooting Commands for the SP201-SA (3 of 4) Command Description show hardware Displays the hardware configuration. See Section 7.2.4.13, The show hardware Command. show states Displays the current states for all trunks and timeslots. See Section 7.2.4.14, The show states Command. show stats Displays the reset statistics. See Section 7.2.4.15, The show stats Command. show template Displays the IAM & ACM template numbers configured for all channels. See Section 7.2.4.16, The show template Command. show time Displays the SP201-SA’s system time. See Section 7.2.4.17, The show time Command. show trace Displays a list of channels on the SP201-SA, indicating those that have tracechan enabled. See Section 7.2.4.18, The show trace Command. show trunks Displays trunk framing, protocol, and SS7 signaling link information. See Section 7.2.4.19, The show trunks Command. show version Displays the SP201-SA software product’s application version. See Section 7.2.4.20, The show version Command. trace (before SignalPath software version 1070) ! No Longer Available. See Section 7.2.5.2, The trace isup Command. trace (in SignalPath software version 1070 and later) Starts automated trace functions or stops all trace functions. See Section 7.2.5.5, The trace Command. trace cas Displays signaling on Timeslots between CAS and peer protocol. See Section 7.2.5.1, The trace cas Command. tracechan trace isdnmsg ! No Longer Available. See Section 7.2.5.1, The trace cas Command. Enables ISDN raw message traces. See Section 7.2.5.3, The trace isdnmsg Command. SP201-SA™ Customization and Maintenance Guide 7-6 Chapter 7: Maintenance and Troubleshooting Table 7-1. Maintenance and Troubleshooting Commands for the SP201-SA (4 of 4) 7.2 Command Description trace isup Traces all or specified details of SS7/C7 messages. See Section 7.2.5.2, The trace isup Command. trace isupmsg Enables ISUP raw message traces. See Section 7.2.5.4, The trace isupmsg Command. warmstart Resets the SP201-SA but maintains configured parameters. See Section 2.4.1, Warmstarting the SP201-SA. Monitoring and Troubleshooting the SP201-SA Software The commands in this section help you review the configuration of the SP201-SA software and determine whether it is performing as you intend. Note: To configure the SP201-SA, see Chapter 2, Configuration Overview. 7.2.1 User Assistance Commands The commands in the following subsections help you see which commands are available, which commands you have used recently, and which alias commands you can use. Another command dumps (i.e., shows most recent values) for a channel. 7.2.1.1 The help Command You can use the help command to display a complete list of the commands available for use on the SP201-SA. How to Use the help Command 1 At the user> prompt, type help and press Enter. Information similar to the following is displayed: SP201-SA™ Customization and Maintenance Guide Monitoring and Troubleshooting the SP201-SA Software 7-7 user> help *** MAIN COMMAND HELP *** assign coldstart config dumpchan help reset show trace tracechan traceiw warmstart - Assign the CIC range to be used on this card Reset configurable parameters to factory defaults and reset card Configure specified items - use "config help" for more information Dump CAS channel data for troubleshooting Display this help screen Reset specified item(s) - use "reset help" for more information Show specified information - use "show help" for more information Trace SS7 messages Displays information about the CAS protocol for troubleshooting Displays messages between the Q767 and CAS state machines Reset card while maintaining configurable parameters user> Note: To get additional information on the config, show, or reset commands, type config, show, or reset without any arguments. 7.2.1.2 The alias Command The alias command lets you define the numbers 0 through 9 to represent frequently used commands. How to Use the alias Command 1 At the user> prompt, type alias and press Enter. The list of alias commands is displayed. SP201-SA™ Customization and Maintenance Guide 7-8 Chapter 7: Maintenance and Troubleshooting user> alias ****************************************************************************** ***************************** COMMAND ALIAS LIST ***************************** ****************************************************************************** 0: alias 1: history 2: help 3: show help 4: show banner 5: show version 6: show hardware 7: config help 8: warmstart 9: coldstart ****************************************************************************** user> Note: According to this list, you can see the banner by typing 4 and pressing Enter. user> 4 4: show banner ****************************************************************************** * * * +++ SignalPath Product Line +++ * * * * Application: ETSI ISDN/R2 Standalone * * Application Part Number: 15174.0097 * * Package Part Number: 15175.0097 * * Release Date: 11/07/02 16:57:57 * * * * * * Encore Networks, Inc. * * 45472 Holiday Drive * * Dulles, Virginia 20166 * * TEL: 703-318-7750 * * FAX: 703-787-4625 * * http://www.encorenetworks.com * * * * * * Copyright (c) 2002-2003 Encore Networks, Inc. * * All Rights Reserved * * * ****************************************************************************** user> SP201-SA™ Customization and Maintenance Guide Monitoring and Troubleshooting the SP201-SA Software 2 7-9 To change the definition of a command, type alias a and press Enter, where a is a number 0 to 9. A prompt similar to the following is displayed. user> alias 4 Current command string for alias 4: show banner Enter new command string [1-76 chars/# to delete/CR to keep current]==> 4: 3 Type the new command you wish this alias number to represent, and press Enter. (For example, type show stats and press Enter.) A prompt confirms the new definition for the alias number. 4: show stats Alias 4 updated user> 4 You can test the new definition by typing the alias number and pressing Enter. user> 4 4: show stats ****************************************************************************** ****************************** CARD STATISTICS ******************************* ****************************************************************************** Number of non-error exits since last coldstart = 0 Number of error exits since last coldstart = 0 Percentage of buffers remaining at last exit = 100% ****************************************************************************** user> 7.2.1.3 The history Command The history command displays the most recently used commands. To use the command, type history and press Enter. The console displays the list SP201-SA™ Customization and Maintenance Guide 7-10 Chapter 7: Maintenance and Troubleshooting of commands recently used. (Note that the last command shown is always history, because you have just entered that command.) user> history ****************************************************************************** **************************** COMMAND HISTORY LIST **************************** ****************************************************************************** 035: assign cics 036: config timeslots 037: config cics 038: config connections 039: reset 040: reset chan 041: reset stats 042: reset systimer 043: dumpchan 044: show connection 045: show connections 046: show almrelay 047: reset 048: reset systimer 049: history ****************************************************************************** user> 7.2.2 The config Commands To see a list of config x commands, type config or config help and press Enter. The console will display a list of the config commands available in the SP201-SA software, similar to the following. user> config *** CONFIG COMMAND HELP *** alarms - Enable/Disable reporting of alarms on a trunk (span) Warning: Interrupts traffic if a live trunk is disabled cics - Modify the CIC connectivity clocks - Select a clock source for framing connections - Configure timeslot and CIC mapping - Auto & manual modes dt - Configure the channel parameters for the selected channel(s) framer - Configure the framer parameters for a trunk (span) logging - Enable or disable display of logging messages sp200 - Configure several card level options Most config commands are used only when configuring the SP201-SA. See the appropriate chapters for the protocols you are configuring. SP201-SA™ Customization and Maintenance Guide Monitoring and Troubleshooting the SP201-SA Software 7.2.3 7-11 The reset Commands To see a list of reset commands, type reset and press Enter. The console will display a list of reset commands available in the SP201-SA software, similar to the following. user> reset ****************************************************************************** ***************************** RESET COMMAND HELP ***************************** ****************************************************************************** chan - Reset CAS channel(s) [trunk/timeslot(s)] back to their initial state stats - Reset card statistics systimer - Reset the relative time clock back to 0 ****************************************************************************** user> 7.2.3.1 The reset chan Command You can perform a reset at the channel level. You use the reset chan command to reset a designated channel or multiple channels. Note: The reset chan command is not used to implement configuration changes. Use the reset chan command only for cases in which the channel is not responding properly. How to Use the reset chan Command ! Caution: The reset chan command causes all calls on the specified channels to be dropped. In addition, the specified channels will drop any loopbacks and any disable statuses. If a specified channel range intersects but does not encompass a disabled span, the reset chan command will be rejected, and no channels will be reset. 1 At the user> prompt, do one of the following: SP201-SA™ Customization and Maintenance Guide 7-12 Chapter 7: Maintenance and Troubleshooting a To reset a specific channel, type reset chan m:n and press Enter. where m represents the trunk and n represents the timeslot you want to reset. A message similar to the following is displayed: user> reset chan 1:4 channel reset b To reset multiple channels, type reset chan m:n p:r and press Enter. where m:n is the beginning of the range of trunks:timeslots you wish to reset, and p:r is the end of the range. A message similar to the following is displayed: user> reset chan 1:4 2:23 channels reset c To reset all channels, type reset chan all and press Enter. The SP201-SA asks for confirmation to reset all channels. user> reset chan all Are you sure you want to reset ALL channels on this card (y or n)? : 2 Do one of the following: a If you want to reset the channel(s), type y and press Enter. b If you do not want to reset the channel(s), type n and press Enter. SP201-SA™ Customization and Maintenance Guide Monitoring and Troubleshooting the SP201-SA Software 7-13 A message similar to the following is displayed: channels reset 7.2.3.2 The reset stats Command You can reset the statistics without viewing them. (In protocol-conversion packages, you can also reset the statistics after viewing them. See Section 7.2.4.15, The show stats Command, to view statistics for protocolconversion software.) How to Use the reset stats Command 1 To reset statistics, type reset stats and press Enter. The following prompt appears: Reset statistics? (y/n) : 2 Do one of the following: a If you wish to reset the statistics, type y and press Enter. The statistical counters are reset to their initial values. The following prompt appears, followed by the user> prompt. statistics reset user> Note: Resetting the statistics merely sets the counters to initial values. Accrual of statistics continues whenever the SP201-SA is running. SP201-SA™ Customization and Maintenance Guide 7-14 Chapter 7: Maintenance and Troubleshooting b If you do not wish to reset the statistics, type n and press Enter. The statistics remain at their current values. The following prompt appears, followed by the user> prompt. statistics NOT reset user> 7.2.3.3 The reset systimer Command The reset systimer command resets the relative clock time to 0 (zero). To use the command, type reset systimer and press Enter. The system clock resets to zero, and the following message is displayed. System relative time clock reset to 0 7.2.4 The show Commands You use the show commands to display current, snapshot information about the SP201-SA’s hardware configuration. The show commands use the format show x, where x can be any of several variables, discussed in the sections below. To see a list of show commands, type show and press Enter. The console will display a list of show commands available in the SP201-SA software, similar to the following. SP201-SA™ Customization and Maintenance Guide Monitoring and Troubleshooting the SP201-SA Software 7-15 user> show *** SHOW COMMAND HELP *** banner - Display application banner buffers - Display the size of message buffer pools clocks - Display current clock source for framing connection - Display CIC/timeslot/peer timeslot relationships events - Display list of the statemachine Events and States framers - Display the configuration & status of the trunk (span) framers hardware - Display hardware configuration information states - Display the DTMF and Q767 statemachine states for all channels stats - Display card reset statistics template - Display the IAM & ACM template number configured for all channels timeslots - Display timeslot connectivity and data translation in effect trace - Display tracechan status trunks - Display trunk (span) framing, protocol & signaling link information version - Display application and boot monitor version information 7.2.4.1 The show alarms Command You use the show alarms command to view detailed information about the trunk alarms on the SP201-SA. (To set alarms up, see Section 2.3.5, The config alarms Command.) How to Use the show alarms Command 1 At the user> prompt, type show alarms and press Enter. Information similar to the following is displayed. Empty entries (dashes) indicate that there is no alarm. Asterisks indicate an alarm. Table 7-2 describes the parameters displayed for the show alarms command. SP201-SA™ Customization and Maintenance Guide 7-16 Chapter 7: Maintenance and Troubleshooting user> show alarms ****************************************************************************** ***************************** TRUNK ALARM STATUS ***************************** ****************************************************************************** MF MF Alarm MF YEL YEL SYNC SYNC CARR FS Trunk Reporting AIS AIS LOW LOW LOSS LOSS LOSS ERRS MAJOR MINOR ****************************************************************************** 1 ENABLED ---- ---- ---- ---- ---- ---- ---- ---------2 ENABLED ---- ---- ---- ---- ---- ---- ---- ---------3 ENABLED ---- ---- ---- ---- ---- ---- ---- ---------4 ENABLED ---- ---- ---- ---- ---- ---- ---- ---------****************************************************************************** AGGREGATE ALARM STATUS: ------****************************************************************************** user> Table 7-2. show alarms Parameter Descriptions (1 of 2) Parameter Description Alarm Reporting Indicates whether the trunk’s alarms are enabled. ais Indicates whether the alarm indication signal alarm is activated. mf ais Indicates whether the timeslot 16 multiframe (if in use) alarm indication signal is activated. yellow Indicates whether a remote alarm is activated. mf yellow Indicates whether the timeslot 16 (if in use) remote alarm is activated. sync Loss Indicates whether a synchronization loss alarm is activated. mf Sync Loss Indicates whether a timeslot 16 (if in use) synchronization loss alarm is activated. carr Loss Indicates whether carrier loss is on (the carrier signal has been lost) or off (the carrier signal is operational). Fs errs Indicates the presence of F-bit errors. (Not currently supported.) SP201-SA™ Customization and Maintenance Guide Monitoring and Troubleshooting the SP201-SA Software 7-17 Table 7-2. show alarms Parameter Descriptions (2 of 2) Parameter Description ALARM STATUS: Major (also called a red alarm) Indicates an active major alarm. Major alarms are Fs errs, carrLos, syncLos, mfSynLs, ais, and mtais. Minor (also called a yellow alarm) Indicates an active minor alarm. Minor alarms are yellow and mf yel. Aggregate Alarm Status 7.2.4.2 Shows the alarm status for the SP201-SA (i.e., where there are major and/or minor alarms on trunks on the SP201-SA). The show almrelay Command This command lists the alarm relays set up on the SP201-SA. (To configure alarm relays, see Section 2.3.6, The config almrelay Command.) How to Use the show almrelay Command 1 At the user> prompt, type show almrelay and press Enter. The alarm relay display for this SP201-SA appears. user> show almrelay ****************************************************************************** ************************* ALARM RELAY CONFIGURATION ************************** ****************************************************************************** Trunk With Alarm Alarm Propagated to Trunk 1 - 2 - - - - - 2 - - - - - - - 3 1 2 - - - - - 4 - - - - - - - ****************************************************************************** Alarm Relay Timer = 25 secs ****************************************************************************** user> SP201-SA™ Customization and Maintenance Guide 7-18 Chapter 7: Maintenance and Troubleshooting 7.2.4.3 Viewing the ANI Table Note: The commands for configuring and viewing Alternate Number Insertion (ANI) are available only if the optional ANI Feature has been installed. The show ani command lets you see the ANIs in the ANI substitution table. The following procedure provides guidelines. Note: To configure numbers in the ANI table, see Section 5.3.1, Configuring ANI Substitution. How to Use the show ani Command 1 At the user> prompt, type show ani and press Enter. The console displays the contents of the ANI substitution table, one page at a time. If you have reached the end of the ANI table, the user> prompt follows the table. The display is similar to the following. Note: The table is listed in four columns. Each column holds a pair of numbers. Within each pair, the number on the left identifies the table position, and the number on the right is the ANI. SP201-SA™ Customization and Maintenance Guide Monitoring and Troubleshooting the SP201-SA Software 7-19 user> show ani 1 1234567890 2 1234567891 3 1234567892 4 1234567893 5 1234567894 6 1234567895 7 1234567896 8 1234567897 9 1234567898 10 1234567899 11 1234567900 12 1234567901 13 1234567902 14 1234567903 15 1234567904 16 1234567905 17 1234567906 18 1234567907 19 1234567908 20 1234567909 21 1234567910 22 1234567911 23 1234567912 24 1234567913 25 1234567914 26 1234567915 27 1234567916 28 1234567917 29 1234567918 30 1234567919 31 1234567920 32 1234567921 33 1234567922 34 1234567923 35 1234567924 36 1234567925 37 1234567926 38 1234567927 39 1234567928 40 1234567929 41 1234567930 42 1234567931 43 1234567932 44 1234567933 45 1234567934 46 1234567935 47 1234567936 48 1234567937 49 1234567938 50 1234567939 51 1234567940 52 1234567941 53 1234567942 54 1234567943 55 1234567944 56 1234567945 57 1234567946 58 1234567947 59 1234567948 60 1234567949 61 1234567950 62 1234567951 63 1234567952 64 1234567953 65 1234567954 66 1234567955 67 1234567956 68 1234567957 69 1234567958 70 1234567959 71 1234567960 72 1234567961 73 1234567962 74 1234567963 75 1234567964 76 1234567965 77 1234567966 78 1234567967 79 1234567968 80 1234567969 81 1234567970 82 1234567971 83 1234567972 84 1234567973 85 1234567974 86 1234567975 87 1234567976 88 1234567977 89 1234567978 90 1234567979 91 1234567980 92 1234567981 Press . to exit, any other character to continue: 2 After you have viewed this page of the ANI table, do one of the following: a To terminate the display, type . (a period) and press Enter. The user> prompt is displayed. b To see the next page of the table, type any other character and press Enter (or just press Enter without typing anything). The next page of the ANI table is displayed. If you have reached the end of the ANI table, the user> prompt follows the table. If you do not see the user> prompt, repeat Step 2. 7.2.4.4 The show banner Command You use the show banner command to view manufacturer identification and release information. How to Use the show banner Command 1 At any system prompt, type show banner and press Enter. SP201-SA™ Customization and Maintenance Guide 7-20 Chapter 7: Maintenance and Troubleshooting Information similar to the following is displayed: ****************************************************************************** * * * +++ SignalPath Product Line +++ * * * * Application: ETSI ISDN/R2 Standalone * * Application Part Number: 15174.1020 * * Package Part Number: 15175.1020 * * Release Date: 02/14/03 05:17:06 * * * * * * Encore Networks, Inc. * * 45472 Holiday Drive * * Dulles, Virginia 20166 * * TEL: 703-318-7750 * * FAX: 703-787-4625 * * http://www.encorenetworks.com * * * * * * Copyright (c) 2002-2003 Encore Networks, Inc. * * All Rights Reserved * * * ****************************************************************************** user> 7.2.4.5 The show buffers Command The show buffers command indicates the sizes of the message buffers and the operating system buffers. How to Use the show buffers Command 1 At the user> prompt, type show buffers and press Enter. A display similar to the following appears. user> show buffers ****************************************************************************** *************************** MESSAGE BUFFERS STATUS *************************** ****************************************************************************** Buffer Size Total Size Total Buffers Buffers Buffers Buffers Buffer Type (bytes) (bytes) Buffers Used Free Used% Free% ****************************************************************************** General messages 0536 1094512 2042 0018 2024 0.8% 99.2% CAS messages 4032 0040320 0010 0000 0010 0.0% 100.0% ****************************************************************************** user> SP201-SA™ Customization and Maintenance Guide Monitoring and Troubleshooting the SP201-SA Software 7.2.4.6 7-21 The show ccstates Command This command displays each ISDN channel’s SS7–ISDN Call Control state and last event. How to Use the show ccstates Command 1 At the user> prompt, type show ccstates and press Enter. Information similar to the following is displayed. Note: Square brackets enclose the AGC’s software application part number and version. user> show ccstates State - Last Event) Trunk/ts 1 2 3/1 1-0 1-0 3/9 1-0 1-0 3/17 1-0 1-0 3/25 1-0 1-0 4/1 1-0 1-0 4/9 1-0 1-0 4/17 1-0 1-0 4/25 1-0 1-0 [14598.0705] 3 4 5 1-0 1-34 1-0 1-0 1-0 1-0 1-0 1-0 1-0 1-0 1-0 1-0 1-34 1-0 1-0 1-0 1-0 1-0 1-0 1-0 1-0 1-0 1-0 1-0 6 1-0 1-0 1-0 1-0 1-0 1-0 1-0 1-0 7 1-0 1-0 1-0 1-0 1-0 1-0 1-0 1-0 8 1-34 1-0 1-0 1-0 1-0 1-0 1-0 1-0 user> 7.2.4.7 The show clocks Command The show clocks command displays the SP201-SA’s clocking configuration. How to Use the show clocks Command 1 At the prompt, type show clocks and press Enter. Information similar to the following is displayed. SP201-SA™ Customization and Maintenance Guide 7-22 Chapter 7: Maintenance and Troubleshooting user> show clocks ********************************************************* *********** FRAMER CLOCK SOURCE CONFIGURATION *********** ********************************************************* Clock source configured: INTERNAL CLOCK Clock source being used: Trunk 1 PRIMARY clock source: Trunk 1 SECONDARY clock source: Trunk 7 TERTIARY clock source: LOCAL OSCILLATOR ********************************************************* user> 7.2.4.8 The show connections Command The show connections command displays the relationship between a timeslot and its CIC for each side of the connection. It also indicates the connectivity between a timeslot and its peer timeslot. The display uses the following format: a-u m:n p:q w-b where: a is the protocol used for the timeslot’s trunk—for example, R2. u is the CIC for the timeslot—for example, 00001. m is the timeslot’s trunk—for example, 1. n is the timeslot—for example, 01. and where: p is the peer timeslot’s trunk—for example, 5. q is the peer timeslot—for example, 01. w is the CIC for the peer timeslot—for example, 00001. b is the protocol used for the peer timeslot’s trunk—for example, C7. SP201-SA™ Customization and Maintenance Guide Monitoring and Troubleshooting the SP201-SA Software 7-23 How to Use the show connections Command 1 At the user> prompt, type show connections and press Enter. A display similar to the following appears. Each line shows the following: • The protocol, CIC, trunk, and timeslot for the channel • The trunk, timeslot, CIC, and protocol for the connected peer channel user> show connections CIC Timeslot peerTimeslot peerCIC ----------------------------------------------------------R2-00001 1:01 5:01 00001-Q767 R2-00002 1:02 5:02 00002-Q767 R2-00003 1:03 5:03 00003-Q767 R2-00004 1:04 5:04 00004-Q767 R2-00005 1:05 5:05 00005-Q767 R2-00006 1:06 5:06 00006-Q767 R2-00007 1:07 5:07 00007-Q767 R2-00008 1:08 5:08 00008-Q767 R2-00009 1:09 5:09 00009-Q767 R2-00010 1:10 5:10 00010-Q767 R2-00011 1:11 5:11 00011-Q767 R2-00012 1:12 5:12 00012-Q767 R2-00013 1:13 5:13 00013-Q767 R2-00014 1:14 5:14 00014-Q767 R2-00015 1:15 5:15 00015-Q767 none 1:16-OOS none none Enter for next page... any other key to exit... 2 After viewing the connections indicated, do one of the following: a To exit the show connections command, type any character and press Enter. The show connections command aborts, and the user> prompt is displayed. b To view the next page of connections, press Enter. The next page is displayed. Repeat Step 2. SP201-SA™ Customization and Maintenance Guide 7-24 Chapter 7: Maintenance and Troubleshooting CIC Timeslot peerTimeslot peerCIC ----------------------------------------------------------R2-00017 1:17 5:17 00017-Q767 R2-00018 1:18 5:18 00018-Q767 R2-00019 1:19 5:19 00019-Q767 R2-00020 1:20 5:20 00020-Q767 R2-00021 1:21 5:21 00021-Q767 R2-00022 1:22 5:22 00022-Q767 R2-00023 1:23 5:23 00023-Q767 R2-00024 1:24 5:24 00024-Q767 Enter for next page... any other key to exit... 7.2.4.9 The show dchans Command The show dchans command displays information and status about the signaling timeslot (D-channel) on each ISDN trunk. How to Use the show dchans Command 1 At the prompt, type show dchans and press Enter. Information similar to the following is displayed. user> show dchans ****************************************************************************** *************************** ISDN D-CHANNEL STATUS **************************** ****************************************************************************** Trunk FAS/ Signaling Interface Time # of D-Channel Trunk Type Protocol NFAS Type Type Slot Failures Status ****************************************************************************** 3 E1 ETSI ISDN FAS D-Channel Network 16 0000 Inactive 4 E1 ETSI ISDN FAS D-Channel Network 16 0000 Inactive ****************************************************************************** user> 7.2.4.10 The show events Command You use the show events command to display a numbered list of defined events and the states they cause. This list is useful when analyzing trunk/ timeslot problems. SP201-SA™ Customization and Maintenance Guide Monitoring and Troubleshooting the SP201-SA Software 7-25 Note: This command is intended for use by Technical Support personnel when customers report troubleshooting problems. How to Use the show events Command 1 At the user> prompt, type show events and press Enter. The current list of available events, similar to the following, is displayed. user> show events R2 EVENTS 0 NONE 1 EVT_ACK_TIMEOUT 2 EVT_ANSWER 3 EVT_ANSWER_TIMEOUT ... 78 EVT_BOGUS R2 STATES 0 INVALID 1 R2_IDLE 2 R2_NO_SERVICE 3 R2_RESET ... 24 R2_BUSY Q767 EVENTS 0 NONE 1 EVT_ACK_REC 2 EVT_ACK_TIMEOUT 3 EVT_ACM ... 66 EVT_Q7CLEAR Q767 STATES 0 INVALID 1 S7_IDLE 2 S7C_NO_SERVICE 3 S7_RESET ... 16 S7C_CLEARBACK Done ! user> SP201-SA™ Customization and Maintenance Guide 7-26 Chapter 7: Maintenance and Troubleshooting 7.2.4.11 The show fgd Command If your SP201-SA is running the R1 protocol, you can use the show fgd command to view the current entries in the Feature Group D (FGD) information digits translation table. Note: To add or delete table entries, see Section 3.3.3.2, The config fgd Command. How to Use the show fgd Command 1 At the user> prompt, type show fgd and press Enter. The system displays the information digits translation table. The following is an example. information digits 23 04 24 End of table user> calling party category 8 12 3 Note: If the informations digits translation table is empty, the display is similar to the following. information digits End of table user> calling party category SP201-SA™ Customization and Maintenance Guide Monitoring and Troubleshooting the SP201-SA Software 7.2.4.12 7-27 The show framers Command You use the show framers command to view detailed information about the SP201-SA trunks. How to Use the show framers Command 1 At the user> prompt, type show framers and press Enter. Information similar to the following is displayed. user> show framers ****************************************************************************** **************************** FRAMER CONFIGURATION **************************** ****************************************************************************** Trunk Line Line Framing Haul Line Trunk Trunk Type Impedance Coding Type Type Length State ****************************************************************************** 1 E1 120 Ohms HDB3 CAS-CRC Short N/A Initialized 2 E1 120 Ohms HDB3 CAS-CRC Short N/A Initialized 3 E1 120 Ohms HDB3 CCS Short N/A Initialized 4 E1 120 Ohms HDB3 CCS Short N/A Initialized ****************************************************************************** LIM type: 2 E1 120 Ohm/2 E1 120 Ohm ****************************************************************************** user> Table 7-3 describes the parameters displayed when you execute the show framers command. Table 7-3. Parameter Descriptions for the show framers Command (1 of 2) Parameter Description Trunk Lists the trunk numbers (1–8). Trunk Type Indicates whether the connection is T1 or E1. Line Impedance Indicates the impedance (100 ohms for T1 lines; 75 ohms or 120 ohms for E1 lines). Line Coding Indicates the types of T1 and E1 coding used on the trunk (i.e., AMI or B8ZS for T1 and AMI or HDB3 for E1. Framing Type Indicates the type of trunk framing selected (e.g., D4 SF for T1 or 704 for E1). SP201-SA™ Customization and Maintenance Guide 7-28 Chapter 7: Maintenance and Troubleshooting Table 7-3. Parameter Descriptions for the show framers Command (2 of 2) 7.2.4.13 Parameter Description Haul Type The general line length that the software configuration reflects. The default is Short, for a cable 0 to 133 feet (0 to 41 meters) long. Line Length Indicates the length of the T1 cable. (This parameter is not applicable for E1 lines.) Trunk State Indicates the trunk state. Initialized means that the trunk is fully operational. LIM type Indicates the type of LIM installed. The first entry describes trunks 1–4; the second entry describes trunks 5–8. The show hardware Command The show hardware command lists the hardware specifications for the SP201-SA. The command shows the device and its trunk configuration. How to Use the show hardware Command 1 At the user> prompt, type show hardware and press Enter. A display similar to the following appears. user> show hardware ****************************************************************************** *************************** HARDWARE CONFIGURATION *************************** ****************************************************************************** Platform: SP201-SA Configuration: 4 Trunks/0 Receive DSPs/1 QUICC LIM Type: 2 T1 100 Ohm/2 T1 100 Ohm ****************************************************************************** user> SP201-SA™ Customization and Maintenance Guide Monitoring and Troubleshooting the SP201-SA Software 7.2.4.14 7-29 The show states Command You use the show states command to display a list of current states for timeslots on the trunks, whether in service or out of service. Note: This command is intended for use by Technical Support personnel when customers report troubleshooting problems. How to Use the show states Command 1 At the user> prompt, type show states and press Enter. The list of current states, similar to the following, is displayed. Note: In the display for the show states command, channels that are out of service display blanks. In addition, T1 trunks show timeslots 25 through 31 as blank because T1 trunks have only 24 channels. E1 trunks show timeslot 16 as blank because timeslot 16 is used for signaling. user> show states States (S7state-DTstate) Trunk/ts 1 1/1 3-3 1/9 3-3 1/17 3-3 1/25 3-3 2/1 3-3 2/9 3-3 2/17 3-3 2/25 3-3 user> 2 3-3 3-3 3-3 3-3 3-3 3-3 3-3 3-3 3 3-3 3-3 3-3 3-3 3-3 3-3 3-3 3-3 4 3-3 3-3 3-3 3-3 3-3 3-3 3-3 3-3 5 3-3 3-3 3-3 3-3 3-3 3-3 3-3 3-3 6 3-3 3-3 3-3 3-3 3-3 3-3 3-3 3-3 7 3-3 3-3 3-3 3-3 3-3 3-3 3-3 3-3 8 3-3 3-3 3-3 3-3 SP201-SA™ Customization and Maintenance Guide 7-30 Chapter 7: Maintenance and Troubleshooting 7.2.4.15 The show stats Command This command displays the statistical counters on the SP201-SA. This command also lets you reset the statistical counters. How to Use the show stats Command 1 At the user> prompt, type show stats and press Enter. The statistical counters for the SP201-SA are displayed. A prompt also asks whether to reset the statistical counters to zero. user> show stats number of resets since last coldstart 3 number of calls to msExit since last coldstart 0 percentage of buffers remaining at last msExit 9 reset statistics? (y/n) : 2 Do one of the following: a To let the counters continue incrementing, type n and press Enter. The user> prompt is redisplayed. b To reset the statistical counters, type y and press Enter. The routine indicates that the counters have been reset, and the user> prompt is redisplayed. reset statistics? (y/n) : y statistics reset user> SP201-SA™ Customization and Maintenance Guide Monitoring and Troubleshooting the SP201-SA Software 7.2.4.16 7-31 The show template Command The show template command indicates which IAM template and ACM template are being used on each channel of the DTMF, R1, R2, or N5 trunks. How to Use the show template Command 1 At the user> prompt, type show template and press Enter. The system displays the numbers of the IAM templates and ACM templates used on each CAS channel, similar to the following: user> show template Template (IAM No.-ACM No.) Trunk/ts 1 2 3 4 1/1 1-1 1-1 1-1 1-1 1/9 1-1 1-1 1-1 1-1 1/17 1-1 1-1 1-1 1-1 1/25 2/1 1-1 1-1 1-1 1-1 2/9 1-1 1-1 1-1 1-1 2/17 1-1 1-1 1-1 1-1 2/25 user> 5 1-1 1-1 1-1 6 1-1 1-1 1-1 7 1-1 1-1 1-1 8 1-1 1-1 1-1 1-1 1-1 1-1 1-1 1-1 1-1 1-1 1-1 1-1 1-1 Note: Each CAS channel can use one of five templates for IAM and one of five template for ACM. Usage of IAM and ACM templates is assigned in the procedures in Section 3.3.2.1, The config dt Command; Section 3.3.3.1, The config r1 Command; Section 3.3.4.1, The config r2 Command; and Section 3.3.5.1, The config n5 command. 7.2.4.17 The show time Command The show time command displays the SP201-SA’s current system time. (If you wish to set the system time, see Section 2.3.1, The config time Command.) How to Use the show time Command 1 At the user> prompt, type show time and press Enter. SP201-SA™ Customization and Maintenance Guide 7-32 Chapter 7: Maintenance and Troubleshooting If the SP201-SA’s time has not been set previously, the following message appears. Warning! System date/time has not been set! In any case, then the following information is displayed: user> show time ****************************************************************************** ****************************** SYSTEM DATE/TIME ****************************** ****************************************************************************** System Date and Time = Sat 2000/01/01 00:03:36.354 ****************************************************************************** user> 7.2.4.18 The show trace Command This command displays the status of the traces on the SP201-SA, indicating the traces that are enabled on each channel. Note: To enable or disable traces, see Section 7.2.5, Traces. How to Use the show trace Command 1 At the user> prompt, type show trace and press Enter. A list of debug traces is displayed, indicating their statuses. Note: The traces listed depend on the software on the SP201-SA. • If there is only one trace available on the SP201-SA, the listing may be short (depending on the trace itself), as shown in the following example. SP201-SA™ Customization and Maintenance Guide Monitoring and Troubleshooting the SP201-SA Software 7-33 user> show trace **************************** TRACE CONFIGURATION ***************************** ****************************************************************************** Traces Status ****************************************************************************** isup: on Point code: all CIC: 102 MSG: acm [2130/08/25 18:22:44]: Command "show trace" completed • If there are several traces available on the SP201-SA, the initial list is short, but the details may be quite long (depending on the traces), as shown in the following example. user> show trace ****************************************************************************** **************************** TRACE CONFIGURATION ***************************** ****************************************************************************** Traces Status ****************************************************************************** ccdebug: off ccerror: off cchigh: off ccmed: off isdncir0: off ****************************************************************************** Display more traces? (y/n): 2 To see detailed trace information (for user and debug commands), type y and press Enter. The user traces for the channels on trunks 1 and 2 are displayed. Note: The traces shown depend on the software on the SP201-SA. SP201-SA™ Customization and Maintenance Guide 7-34 Chapter 7: Maintenance and Troubleshooting Trunk 1 0 1 1 2 2 3 Traces (Enabled = T) 5 0 5 0 5 0 ****************************************************************************** ccccb: - - - - - - - - - - - - - - - - - - - - - - ccfsm: - - - - - - - - - - - - - - - - - - - - - - isdnfsm: - - - - - - - - - - - - - - - - - - - - - - isdnmsg: - - - - - - - - - - - - - - - - - - - - - - isupfsm: - - - - - - - - - - - - - - - - - - - - - - isupmsg: T T T T T T T T T T T T T T T T T T T T T T T ****************************************************************************** Trunk 2 0 1 1 2 2 3 Traces (Enabled = T) 5 0 5 0 5 0 ****************************************************************************** ccccb: - - - - - - - - - - - - - - - - - - - - - - ccfsm: - - - - - - - - - - - - - - - - - - - - - - isdnfsm: - - - - - - - - - - - - - - - - - - - - - - isdnmsg: - - - - - - - - - - - - - - - - - - - - - - isupfsm: - - - - - - - - - - - - - - - - - - - - - - isupmsg: T T T T T T T T T T T T T T T T T T T T T T T ****************************************************************************** Display more trunks? (y/n): 3 To see user trace information for the next two trunks (if this is an SP201-SA with more than two trunks), type y and press Enter. The user traces for the channels on trunks 3 and 4 are displayed. Trunk 3 0 1 1 2 2 3 Traces (Enabled = T) 5 0 5 0 5 0 ****************************************************************************** ccccb: - - - - - - - - - - - - - - - - - - - - - - ccfsm: - - - - - - - - - - - - - - - - - - - - - - isdnfsm: - - - - - - - - - - - - - - - - - - - - - - isdnmsg: - - - - - - - - - - - - - - - - - - - - - - isupfsm: - - - - - - - - - - - - - - - - - - - - - - isupmsg: T T T T T T T T T T T T T T T T T T T T T T T ****************************************************************************** Trunk 4 0 1 1 2 2 3 Traces (Enabled = T) 5 0 5 0 5 0 ****************************************************************************** ccccb: - - - - - - - - - - - - - - - - - - - - - - ccfsm: - - - - - - - - - - - - - - - - - - - - - - isdnfsm: - - - - - - - - - - - - - - - - - - - - - - isdnmsg: - - - - - - - - - - - - - - - - - - - - - - isupfsm: - - - - - - - - - - - - - - - - - - - - - - isupmsg: T T T T T T T T T T T T T T T T T T T T T T T ****************************************************************************** [2020/09/07 23:58:48]: Command "show trace" completed 15694.1100-slot7-user> SP201-SA™ Customization and Maintenance Guide Monitoring and Troubleshooting the SP201-SA Software 7.2.4.19 7-35 The show trunks Command You use the show trunks command to display the information about the trunks configured on the SP201-SA. How to Use the show trunks Command 1 At the user> prompt, type show trunks and press Enter. Information similar to the following is displayed: user> show trunks Trunk Dchan Type Protocol ------------------------1 T1 R2 2 T1 R2 3 D24I T1 ETSI ISDN 4 D24I T1 ETSI ISDN user> 7.2.4.20 The show version Command You use the show version command to view the software version number and release date. How to Use the show version Command 1 At the user> prompt, type show version and press Enter. Information similar to the following is displayed, where the Release Date format is month/day/year hour:minute:second. Hours are shown in a 24-hour format. SP201-SA™ Customization and Maintenance Guide 7-36 Chapter 7: Maintenance and Troubleshooting user> show version ************************************************************* ************** APPLICATION VERSION INFORMATION ************** ************************************************************* Application: DTMF/ITU Q.767 C7 Standalone Application Part Number: 14752.0705 Package Part Number: 15141.0705 Release Date: 10/18/01 20:45:15 ************************************************************* user> 7.2.5 Traces Traces are diagnostic commands; they are used only for debugging purposes. Each type of trace monitors a specific part of transmissions. In most cases, trace information should be collected and sent to Technical Services at Encore Networks, Inc., for analysis and problem detection. ! Caution: Traces are disruptive; they affect system performance. They consume resources, slowing processing speed. Run a trace only to help analyze problems. You can run more than one trace simultaneously. However, running multiple traces may cause the SP201-SA to reset. Use of traces is not meant for a live network. Contact Technical Services before you use a trace command. In SignalPath software version 1070, the trace commands changed from those of previous software versions. The former trace commands are not available in version 1070 and later. Table 7-4 lists the mapping of former trace commands (before software version 1070) to new trace commands (version 1070 and later). SP201-SA™ Customization and Maintenance Guide Monitoring and Troubleshooting the SP201-SA Software 7-37 Table 7-4. Mapping of Old to New Trace Commands (1 of 2) Former Command config traceflags 1 trace on/ off 4 Former Command Supported Type Trace New Command user cc ccb trace ccCcb anything to ISDN debug 2 n.a. 3 cc debug trace ccdebug anything to ISDN debug n.a. cc error trace ccerror anything to ISDN debug n.a. cc state machine trace ccfsm anything to ISDN debug n.a. cc tracehi trace cchigh anything to ISDN debug n.a. cc tracemed trace ccmed anything to ISDN debug n.a. isdn raw cir 0 trace isdncir0 anything to ISDN debug n.a. isdn state machine trace isdnfsm anything to ISDN debug n.a. isdn raw trace isdnmsg anything to ISDN user yes isup state machine trace isupfsm anything to ISDN debug n.a. isup raw trace isupmsg CAS to ISDN user no SS7 to ISDN user yes trace isup CAS to SS7 user yes CAS to ISDN user no SS7 to SS7 user yes user trace Application New Command Automated Type Use SP201-SA™ Customization and Maintenance Guide 7-38 Chapter 7: Maintenance and Troubleshooting Table 7-4. Mapping of Old to New Trace Commands (2 of 2) Former Command Supported Type Trace New Command tracechan tk:ts on/ off 5 user trace cas traceiw on/off user Former Command tracechan traceiw trace iw Application New Command Automated Type Use CAS bulk caller user yes CAS to anything user yes CAS to anything debug n.a. 1. The former config traceflags command has been divided into its constituent parts. 2. To use debug commands, contact your Encore Networks, Inc., sales representative. 3. Automated use applies only to user commands; “n.a.” means “not applicable.” 4. As indicated, the former trace command has become the new trace isup command. There is also a new trace command. In the new trace command, trace on enables automated trace functions, and trace off stops all traces. To use the new trace command, see Section 7.2.5.5, The trace Command. 5. In this command, tk represents the trunk number and ts represents the trunk’s timeslot. Note: Trace information is derived from the signaling timeslots but traces are not run on the signaling timeslots. If you specify a range that begins or ends on a signaling timeslot, a warning message will indicate that the trace cannot run on a signalling timeslot or on its peer timeslot. However, all other valid traces will be performed. (If a specified range includes one or more signaling timeslots, but the beginning and ending timeslots are not signaling timeslots, no message is displayed. The trace is run without such comment.) The following subsections describe trace commands used to monitor a card’s channels: • Section 7.2.5.1, The trace cas Command • Section 7.2.5.2, The trace isup Command • Section 7.2.5.3, The trace isdnmsg Command • Section 7.2.5.4, The trace isupmsg Command • Section 7.2.5.5, The trace Command SP201-SA™ Customization and Maintenance Guide Monitoring and Troubleshooting the SP201-SA Software 7-39 Note: The show trace command indicates the traces that are enabled. See Section 7.2.4.18, The show trace Command. 7.2.5.1 The trace cas Command The trace cas command, available for CAS protocols, is used to display detailed information about interworking messages sent between protocols. You can trace one or more timeslots, up to all timeslots on the SP201-SA. The trace cas command replaces the former tracechan command. You can specify this trace; it is also an automated trace function. (To use automated trace functions, see Section 7.2.5.5, The trace Command.) How to Enable the trace cas Command ! 1 Caution: Do not use the trace cas command for more than one channel on a card when the card is passing a large volume of traffic; otherwise, you may lose calls. If you want to turn tracechan on, type trace cas m:n on at the user> prompt, and press Enter, where m represents the trunk and n represents the timeslot you want to trace. While the trace for a single timeslot is on, information similar to the following is displayed. (Information is displayed in a different format for more than one timeslot.) SP201-SA™ Customization and Maintenance Guide 7-40 Chapter 7: Maintenance and Troubleshooting user> trace cas 1:2 on Trace enabled [2004/08/02 19:37:19]: Command "trace cas 1:2 on" completed user> [2004/08/02 19:37:19.326] hh:mm:ss:ttt task tk/ts 19:37:19.328 DT 1:2 19:37:19.328 DT 1:2 19:37:19.328 S7--> 5:2 19:37:19.328 S7 19:37:19.328 DT 1:2 19:37:19.328 DT 1:2 19:37:19.328 DT 1:2 19:37:19.328 DT 1:2 19:37:19.328 DT 1:2 19:37:19.328 DT 1:2 etc. input output 0000 0000 0000 0000 0000 0000 0000 0000 0000 0000 0000 1000 1000 1000 in out dt dt - [14914.1100] [1:2] event state [1:2] NONE DT_RESET EVT_RELEASE DT_IDLE iam on CIC 2 EVT_C_IAM S7C_SEIZE EVT_C_IAM CDT_PREP CALL EVT_C_IAM CDT_SEIZE EVT_NEXT_STATE CDT_DIALDT 1 2 where: • hh:mm:ss.ttt represents the time of the trace information, in hours, minutes, seconds, and thousandths of a second. • task represents the type of signaling being performed. • tk/ts represents the trunk and timeslot being traced. • input represents the signaling bits (A, B, C, and D) being input to the SP201-SA. • output represents the signaling bits (A, B, C, and D) the SP201-SA is sending back. • in dt is used for CAS signals coming in—that is, from SS7 to CAS. (In the example, the CAS protocol is DTMF.) • out dt is used for CAS signals going out—that is, from CAS to SS7. (In the example, the CAS protocol is DTMF.) • event represents the event that occurred in the transmission. • state represents the state caused by the event. • [yyyyy.zzzz] (in the example, [14914.1100]) indicates the software application and version (release) the card is using. • [m:n] (in the example, [1:2]) indicates the trunk and channel being traced. (This is shown when tracing only one channel.) SP201-SA™ Customization and Maintenance Guide Monitoring and Troubleshooting the SP201-SA Software ! 7-41 Caution: You can enable trace cas for more than one timeslot, as shown in the following list of formats for the trace cas command; however, this is not advised because of the possibility of losing calls. usage: or or or trace trace trace trace cas cas cas cas [trk:ts] [on/off] [trk:ts] [trk:ts] [on/off] [trk] [on/off] all [on/off] If you enable trace cas for more than one timeslot, a warning is displayed. user> trace cas all on ************************************************************ * WARNING!!! Multi-channel tracing is NOT intended for * * operational use! Its use in high traffic * * may cause improper operation and may even * * cause a program reset. * ************************************************************ Do you wish to continue (y/N) : y Then, if you answer y, the trace is enabled. Traces enabled [2130/08/25 18:57:02]: Command "trace cas all on" completed 15586.1100-slot4-user> Information will be displayed, similar to that shown below. Note: If you enable trace cas for more than one timeslot, and later wish to stop the trace, type trace cas off and press Enter. SP201-SA™ Customization and Maintenance Guide 7-42 Chapter 7: Maintenance and Troubleshooting user> 18:57:17.263 18:57:17.264 S7<-18:57:17.265 S7 18:57:17.267 S7--> 18:57:17.267 S7<-18:57:17.268 S7 18:57:17.270 S7--> 18:57:17.270 S7<-18:57:17.271 S7 . . . 18:57:17.337 S7--> 18:57:17.338 S7<-18:57:17.338 S7 18:57:17.340 S7--> 18:57:17.341 S7<-18:57:17.341 S7 . . . 18:57:17.453 18:57:17.453 18:57:17.454 . . . 18:57:17.571 18:57:17.571 18:57:17.572 S7--> 5:01 5:01 rsc rel on CIC 1 on CIC 1 5:02 5:02 rel rsc on CIC 2 on CIC 2 5:03 5:03 rel rsc on CIC 3 on CIC 3 5:24 5:24 rel rsc on CIC 24 on CIC 24 6:01 6:01 rel rsc on CIC 32 on CIC 32 S7--> 7:12 S7<-- 7:12 S7 rel rsc S7--> 8:24 S7<-- 8:24 S7 rel rsc EVT_T17_TIMEOU S7_RESET EVT_T17_TIMEOU S7_RESET EVT_T17_TIMEOU S7_RESET EVT_T17_TIMEOU S7_RESET EVT_T17_TIMEOU S7_RESET EVT_T17_TIMEOU S7_RESET EVT_T17_TIMEOU S7_RESET on CIC 74 on CIC 74 on CIC 117 on CIC 117 trace cas off All channel traces are now off [2130/08/25 18:57:47]: Command "trace cas off" completed How to Turn Off the trace cas Command 1 If you want to turn trace cas off, do one of the following: a Type trace cas m:n off and press Enter. This command turns off the trace cas command for trunk m, timeslot n. b Type trace cas off and press Enter. As shown below, this command turns off the trace cas command for all channels. SP201-SA™ Customization and Maintenance Guide Monitoring and Troubleshooting the SP201-SA Software 7-43 trace cas off All channel traces are now off [2130/08/25 18:57:47]: Command "trace cas off" completed c Type trace off and press Enter. All traces are stopped. user> trace off [2129/01/06 23:05:25]: Command "trace off" completed user> 7.2.5.2 The trace isup Command The trace isup command, available for SS7 protocols, allows you to trace all or specified details of ANSI SS7 or ITU C7 messages. The trace isup command replaces the former trace command. (To use the new trace command, see Section 7.2.5.5, The trace Command.) You can specify this trace. In CAS-to-SS7 signaling or SS7-to-SS7 signaling, this is also an automated trace function. (To use automated trace functions, see Section 7.2.5.5, The trace Command.) Note: If you wish to trace more than one detail but not all details, you must enter the trace isup command once for each detail. How to Enable the trace isup Command 1 To trace an SS7 message type, type trace isup on at the user> prompt, and press Enter. The trace starts. One of the following messages is displayed. • If the card’s SS7 software is only for ANSI SS7 or only for ITU C7 (or a variant), the following prompt is displayed. Go to Step 3. SP201-SA™ Customization and Maintenance Guide 7-44 Chapter 7: Maintenance and Troubleshooting Point Code : • If the card has software for ANSI SS7 to ITU C7 (or a variant), a prompt asks which side (ANSI or ITU) to configure. Enter 'ansi' or 'itu' if point code to be used : 2 Do one of the following: a If you do not wish to enter a point code, press Enter without typing anything. Note: We recommend the default (that is, not typing a point code), so that the trace will accept transmissions from all point codes. If you want to use a point code, the system will filter transmissions to accept messages only from the point code you enter. The following prompt is displayed. Go to Step 4. CIC : b If you wish to enter a point code for ANSI SS7 connections, type ansi and press Enter. c If you wish to enter a point code for ITU C7 connections, type itu and press Enter. If you typed ansi or itu, the following prompt is displayed: SP201-SA™ Customization and Maintenance Guide Monitoring and Troubleshooting the SP201-SA Software 7-45 Point Code : 3 Type the point code, in the format x-y-z, and press Enter. Note: We recommend the default (that is, not typing a point code), so that the trace will accept transmissions from all point codes. If you want to use a point code, the system will filter transmissions to accept messages only from the point code you enter. Note: Get all point codes from your network administrator. The following prompt appears. CIC : 4 Type the number of the CIC you wish to trace, and press Enter. The following prompt, for message type, is displayed: Message Type (enter "?" for list): 5 Do one of the following: a If you know the code for the message type you wish to trace, go to Step 6. b If you wish to abandon the trace, type exit and press Enter. SP201-SA™ Customization and Maintenance Guide 7-46 Chapter 7: Maintenance and Troubleshooting The trace aborts and the user> prompt is displayed. Go to Step 7. c If you wish to see a list of codes for message type, type ? and press Enter. The following list appears, followed by the prompt for message type: message type, one of ALL acm anm cgba cqm cqr con cot cpg cvt drs exm grsa iam inf res rlc rsc usr blo cgu cqm faa inr sam bla cgua cqr far lpa sus ccr cmc cra fot olm uba cfn cmr crm frj pam ubl cgb cmrj cvr grs rel ucic enter "exit" to abort command Message Type (enter "?" for list): 6 Do one of the following: a To trace all SS7 messages on this CIC, type all and press Enter. b To trace a specific message type, type its code (for example, iam) and press Enter. The following message appears, followed by the user> prompt. Command "trace isup on" completed 7 If you wish to enable trace isup for another message type, go to Step 1. How to Disable the trace isup Command 1 You may turn off trace isup at any point. To do so, type trace isup off and press Enter. SP201-SA™ Customization and Maintenance Guide Monitoring and Troubleshooting the SP201-SA Software 7-47 All trace isup routines stop, and the user> prompt is displayed. Command "trace isup off" completed user> 7.2.5.3 The trace isdnmsg Command The trace isdnmsg command, available for ISDN protocols, is used to enable or disable display of the ISDN raw message trace. You can specify this trace; it is also an automated trace function. (To use automated traces, see Section 7.2.5.5, The trace Command.) Note: The trace isdnmsg command is a constituent part of the former config traceflags command. How to Use the trace isdnmsg Command 1 To start an ISDN raw message trace, do one of the following at the user> prompt, where trk represents the trunk number and ts represents the timeslot (channel) number: a To start an ISDN raw message trace for a specific timeslot, type trace isdnmsg trk:ts on and press Enter. b To start an ISDN raw message trace for a range of timeslots, type trace isdnmsg trk1:ts1 trk2:ts2 on and press Enter, where trk1:ts1 represents the range’s beginning trunk and timeslot and trk2:ts2 represents the ending trunk and timeslot. c To start an ISDN raw message trace for all timeslots on a single trunk, type trace isdnmsg trk on and press Enter. d To start an ISDN raw message trace for all timeslots on all trunks, type trace isdnmsg all on and press Enter. SP201-SA™ Customization and Maintenance Guide 7-48 Chapter 7: Maintenance and Troubleshooting The ISDN raw message trace is started. A message similar to the following is displayed. Command "trace isdnmsg 3:4 7:4 on" completed 2 To end an ISDN raw message trace, do one of the following at the user> prompt, where trk represents the trunk number and ts represents the timeslot (channel) number: a To stop an ISDN raw message trace for a specific timeslot, type trace isdnmsg trk:ts off and press Enter. b To stop an ISDN raw message trace for a range of timeslots, type trace isdnmsg trk1:ts1 trk2:ts2 off and press Enter, where trk1:ts1 represents the range’s beginning trunk and timeslot and trk2:ts2 represents the ending trunk and timeslot. c To stop an ISDN raw message trace for all timeslots on a single trunk, type trace isdnmsg trk off and press Enter. d To stop an ISDN raw message trace for all timeslots on all trunks, type trace isdnmsg all off and press Enter. The ISDN raw message trace is stopped. A message similar to the following is displayed. Command "trace isdnmsg all off" completed 7.2.5.4 The trace isupmsg Command The trace isupmsg command, available for ISDN protocols, is used to enable or disable display of the ISUP raw message trace. You can specify this trace; in SS7-to-ISDN signaling, it is also an automated trace function. (To use automated traces, see Section 7.2.5.5, The trace Command.) SP201-SA™ Customization and Maintenance Guide Monitoring and Troubleshooting the SP201-SA Software 7-49 Note: The trace isupmsg command is a constituent part of the former config traceflags command. How to Use the trace isupmsg Command 1 To start an ISUP raw message trace, do one of the following at the user> prompt, where trk represents the trunk number and ts represents the timeslot (channel) number: a To start an ISUP raw message trace for a specific timeslot, type trace isupmsg trk:ts on and press Enter. b To start an ISUP raw message trace for a range of timeslots, type trace isupmsg trk1:ts1 trk2:ts2 on and press Enter, where trk1:ts1 represents the range’s beginning trunk and timeslot and trk2:ts2 represents the ending trunk and timeslot. c To start an ISUP raw message trace for all timeslots on a single trunk, type trace isupmsg trk on and press Enter. d To start an ISUP raw message trace for all timeslots on all trunks, type trace isupmsg all on and press Enter. The ISUP raw message trace is started. A message similar to the following is displayed. Command "trace isupmsg 2:14 7:9 on" completed 2 To end an ISUP raw message trace, do one of the following at the user> prompt, where trk represents the trunk number and ts represents the timeslot (channel) number: a To stop an ISUP raw message trace for a specific timeslot, type trace isupmsg trk:ts off and press Enter. SP201-SA™ Customization and Maintenance Guide 7-50 Chapter 7: Maintenance and Troubleshooting b To stop an ISUP raw message trace for a range of timeslots, type trace isupmsg trk1:ts1 trk2:ts2 off and press Enter, where trk1:ts1 represents the range’s beginning trunk and timeslot and trk2:ts2 represents the ending trunk and timeslot. c To stop an ISUP raw message trace for all timeslots on a single trunk, type trace isupmsg trk off and press Enter. d To stop an ISUP raw message trace for all timeslots on all trunks, type trace isupmsg all off and press Enter. The ISUP raw message trace is stopped. A message similar to the following is displayed. Command "trace isupmsg all off" completed 7.2.5.5 The trace Command Note: The new trace command, in SignalPath software version 1070 and later, is not a revision of the former trace command; it is a different command. Please read this section carefully for details. To use the replacement for the former trace command, see Section 7.2.5.2, The trace isup Command. The trace command, available for all protocols, turns on the automated trace functions available on the SP201-SA. The specific trace functions available depend on the software in the SP201-SA. The following sections discuss trace functions that are automated. (Table 7-4 indicates the software in which specific traces are automated.) • Section 7.2.5.1, The trace cas Command • Section 7.2.5.2, The trace isup Command • Section 7.2.5.3, The trace isdnmsg Command • Section 7.2.5.4, The trace isupmsg Command SP201-SA™ Customization and Maintenance Guide Monitoring and Troubleshooting the SP201-SA Software 7-51 The following sections discuss use of the trace command: • Section 7.2.5.5.1, Using trace off • Section 7.2.5.5.2, Using trace on 7.2.5.5.1 Using trace off The trace off command is used to end all trace functions, not just automated trace functions. When you use this command, you can stop all traces on specific trunks and timeslots, or you can stop all traces on all timeslots. Note: If you wish to start automated traces, see Section 7.2.5.5.2, Using trace on. How to Use the trace off Command 1 To end all trace functions, do one of the following at the user> prompt, where trk represents the trunk number and ts represents the timeslot (channel) number: a To stop automatic trace functions for a specific timeslot, type trace off trk:ts and press Enter. b To stop automatic trace functions for a range of timeslots, type trace off trk1:ts1 trk2:ts2 and press Enter, where trk1:ts1 represents the range’s beginning trunk and timeslot and trk2:ts2 represents the ending trunk and timeslot. c To stop automatic trace functions for all timeslots on a single trunk, type trace off trk and press Enter. d To stop automatic trace functions for all timeslots on all trunks, type trace off and press Enter. If you used trace off without specifying trunks or timeslots, all traces on all timeslots on the card stop. If you specified trunks and timeslots on the card, traces on the specified trunks and timeslots stop. A message similar to the following is displayed. SP201-SA™ Customization and Maintenance Guide 7-52 Chapter 7: Maintenance and Troubleshooting Command "trace off" completed 7.2.5.5.2 Using trace on The trace on command is used to start all automated trace functions that are available in the card’s software. When you use this command, you can start automated traces on specific trunks and timeslots, or you can start automated traces on all timeslots. How to Use the trace on Command 1 To start automatic trace functions, do one of the following at the user> prompt, where trk represents the trunk number and ts represents the timeslot (channel) number: a To start automatic trace functions for a specific timeslot, type trace on trk:ts and press Enter. b To start automatic trace functions for a range of timeslots, type trace on trk1:ts1 trk2:ts2 and press Enter, where trk1:ts1 represents the range’s beginning trunk and timeslot and trk2:ts2 represents the ending trunk and timeslot. c To start automatic trace functions for all timeslots on a single trunk, type trace on trk and press Enter. d To start automatic trace functions for all timeslots on all trunks, type trace on all and press Enter. If you used trace on all, the automatic trace functions are started on all timeslots on the card. If you specified trunks or timeslots, the automatic trace functions are started on the specified trunks and timeslots. A message similar to the following is displayed. Command "trace on 1:20" completed SP201-SA™ Customization and Maintenance Guide Troubleshooting the SP201-SA Hardware 7-53 To end all trace functions, follow the procedure in Section 7.2.5.5.1, Using trace off. 7.3 Troubleshooting the SP201-SA Hardware The following sections contain tables that list problems you may encounter, possible causes of those problems, and recommended solutions when installing, configuring, and maintaining the SP201-SA equipment. 7.3.1 Troubleshooting during Installation of the SP201-SA Table 7-5 describes problems you could encounter during installation, along with possible solutions. Table 7-5. Possible Installation Problems (1 of 2) Problem Possible Cause Possible Solution The unit is not receiving power. • Unit is not connected to power source. • Make sure the power cord is plugged into a power source. See Section 1.4, Connecting to the Power Source. • A power supply is not functioning properly. • Call Technical Services. • The power supply temperature has reached or exceeded 212° F (100° C). • Determine the cause of the elevated temperature and lower it. • The power supply voltage is below the minimum required voltage. • Check and adjust the incoming voltage to match the SP201-SA requirements. SP201-SA™ Customization and Maintenance Guide 7-54 Chapter 7: Maintenance and Troubleshooting Table 7-5. Possible Installation Problems (2 of 2) Problem Possible Cause • Connector pins are The control incorrectly set. console is not communicating with the SP201-SA. • The RS-232 configuration parameters are set incorrectly. • You are incorrectly connecting a DTE or DCE device. SP201-SA™ Customization and Maintenance Guide Possible Solution • Refer to Section 1.5, Connecting to the Control Console, for correct pinouts. • Check the settings against those recommended in Section 1.5, Connecting to the Control Console. Then check the documentation for your PC or terminal. • Refer to Section 1.5, Connecting to the Control Console, for options you can use to establish communication. Troubleshooting the SP201-SA Hardware 7.3.2 7-55 Troubleshooting during Configuration and Maintenance of the SP201-SA Table 7-6 describes possible solutions to problems you could encounter while configuring, operating, and maintaining the SP201-SA. Table 7-6. Possible Configuration Problems Problem Possible Cause Possible Solution Signaling conversion is behaving erratically. • Trunks may be down or in alarm states. • Check the trunks for alarm status. • The software configuration may need adjustment. • Review the settings for each parameter. Revise settings as needed. In particular, check any manual configuration of connections, timeslots, or CICs. • If necessary, warmstart the SP201-SA. • The hardware configuration does not match the software configuration. • After checking that the hardware configuration is correct, warmstart the SP201-SA. • If necessary, execute the coldstart command to reset the SP201-SA parameters to factory defaults. ! Caution: If you perform a coldstart, you will lose all custom settings, and you will need to reconfigure them. SP201-SA™ Customization and Maintenance Guide 7-56 Chapter 7: Maintenance and Troubleshooting SP201-SA™ Customization and Maintenance Guide