1
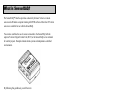
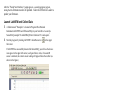
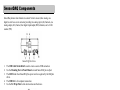
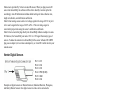
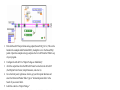
Vernier SensorDAQ™
User’s Manual
Vernier Software & Technology
13979 SW Millikan Way
Beaverton, Oregon 97005-2886
(503) 277-2299
Toll Free (888) 837- 6437
FAX (503) 277-2440
www.vernier.com
[email protected]
Vernier SensorDAQ User’s Manual Copyright 2007 by Vernier
Software & Technology. All rights reserved. You are entitled to
reproduce parts of this manual for use in your educational system
only. No part of this manual may be used or reproduced in any
other manner without written permission of Vernier Software &
Technology, except in the case of brief quotations embodied in
critical articles or reviews.
Vernier and caliper design are our registered trademarks in the
United States. Vernier, Vernier Software & Technology,
Vernier.com, and SensorDAQ are our trademarks or trade dress.
National Instruments, NI, ni.com, and LabVIEW are trademarks of
National Instruments Corporation. Refer to the Terms of Use
section on ni.com/legal for more information about National
Instruments trademarks. For patents covering National Instruments
products, refer to ni.com/patents.
All other marks not owned by Vernier Software & Technology that
appear herein are the property of their respective owners who may
or may not be affiliated with, connected to, or sponsored by us.
Published by
Vernier Software & Technology
13979 SW Millikan Way
Beaverton, Oregon 97005-2886
(503) 277-2299
FAX (888) 837-6437
www.vernier.com
[email protected]
First Edition
First Printing
Table of Contents
What is SensorDAQ? ................................................................................................ 1
SensorDAQ Equipment List..................................................................................... 1
Quick Start ................................................................................................................ 2
Install Software ...................................................................................................... 2
Install National Instruments application software: LabVIEW 7.1 or newer. ......... 2
Connect Equipment ................................................................................................ 2
Launch LabVIEW and Collect Data....................................................................... 3
SensorDAQ Components.......................................................................................... 4
Providing Power to SensorDAQ .............................................................................. 4
Software ..................................................................................................................... 5
Connecting Sensors and Signal Lines...................................................................... 5
Vernier Analog Sensors.......................................................................................... 5
Vernier Digital Sensors .......................................................................................... 6
Screw Terminal ...................................................................................................... 6
Sample Experiments (VIs) in LabVIEW ................................................................ 8
Data Collection with Vernier Analog Sensors ....................................................... 8
Feedback and Control (Digital Out Lines)........................................................... 10
Working with Block Diagrams ............................................................................. 11
Resources ................................................................................................................. 16
Troubleshooting ...................................................................................................... 16
Appendix A - Sample VIs ....................................................................................... 17
Appendix B - Data Collection Analysis Tools ....................................................... 22
What is SensorDAQ?
The SensorDAQ™ interface provides connectivity between Vernier or custom
sensors and a Windows computer running LabVIEW software. More than 50 Vernier
sensors are available for use with the SensorDAQ.
You can also combine the use of sensors connected to the SensorDAQ with the
output of Vernier's Digital Control Unit (DCU) or the SensorDAQ's screw terminal
for control projects. Examples include alarm systems and temperature-controlled
environments.
By following this guidebook, you will learn to:
•
•
•
•
Set up and collect data using Vernier sensors.
Set up and control devices.
Collect data using the provided sample programs.
Create custom engineering programs.
SensorDAQ Equipment List
The SensorDAQ package contains the following equipment:
•
•
•
SensorDAQ interface
User’s Manual
Vernier Voltage Probe
•
CD containing SensorDAQ VIs
and executable for installing
NI-DAQmx driver
• USB cable
Quick Start
Install Software
Install National Instruments application software LabVIEW 7.1 or newer.
1. The SensorDAQ CD contains necessary drivers and sample programs that you
can use to get started collecting data and programming with SensorDAQ.
•
Place the CD in the CD-ROM drive of your computer.
Installation will launch automatically. If not, choose
Settings→Control Panel from the Start menu. Double-click
Add/Remove Programs. Click the Install button in the dialog
box.
• The installer will launch, and a series of dialog boxes will
step you through the installation of the NI-DAQ software. We
recommend that you accept the default directory.
• Copy the VI sample folder “SensorDAQ” from the CD to the
user.lib folder located in the most recent version of LabVIEW
– National Instruments\LabVIEWxx\user.lib
Note: If you have Windows 2000, change the property of the
SensorDAQ folder so that it is not Read Only.
• Proper installation of the driver requires that you reboot your
computer.
•
Connect Equipment
2. Connect a Vernier sensor to
SensorDAQ. If you get a “Found New
Hardware” message, choose Next.
3. Connect the USB cable to SensorDAQ.
4. Attach the other end of the USB cable to any
unused USB port on your computer. The green
LED next to the USB cable port on the
SensorDAQ should be blinking.
2
SensorDAQ User's Manual
After the “Found New Hardware” popup appears, a second popup may appear,
stating that the firmware needs to be updated. Allow the USB-6xxx Loader to
update your firmware.
Launch LabVIEW and Collect Data
5. A folder named “Examples” is located in Program Files\National
Instruments\LabVIEW\user.lib\SensorDAQ on your hard drive. Locate the
1
SensorDAQ example VI called SDAQ Data Collection VI.vi and open it.
6. Start the program by clicking LabVIEW’s white Run arrow
in the upper
left corner.
If LabVIEW has successfully detected the SensorDAQ, you will see the device
icon appear in the upper left corner (see figure below). Also, if an auto-ID
sensor is attached, the current sensor reading will appear below the toolbar (as
shown in the figure).
7. Click
. LabVIEW will begin plotting data in the graph.
Once data have been collected, click and drag the mouse on the graph to highlight
data. Use LabVIEW’s various analysis features, such as zoom, statistics, and curve
fits to study your data. These features are described in Appendix B.
Stop the VI by selecting Exit from the File menu.
You have now successfully set up your equipment, collected data, and performed
analysis. Keep reading for instructions on the various ways to collect data, set up
customized sensors, and customize VIs.
1
If you are using LabVIEW Base Package, you cannot open this VI. Open SensorDAQ Data
Collection.exe instead. See the information for running this application in the Software section
of this manual
3
SensorDAQ User's Manual
SensorDAQ Components
SensorDaq features four channels to connect Vernier sensors (three analog, one
digital) as well as a screw connector providing two analog input (AI) channels, one
analog output (AO) channel, four digital input/output (DIO) channels, and a 32-bit
counter (PFI).
SensorDAQ back view
1.
2.
3.
4.
5.
The USB Cable Strain Relief is used to ensure a secure USB connection.
Use the Mounting Slot and Panel Mount to mount SensorDAQ to an object.
The LED blinks when SensorDAQ has power and is recognized by the DAQmx
driver.
The USB Port is for computer connection.
Use the Tie Wrap Point to lock down and secure the device.
SensorDAQ side view
1.
2.
3.
4.
Ch.1–Ch.3 BTA (British Telecom Analog) channels for Vernier analog
sensors. The Vernier voltage probe is an analog sensor.
Use the Mounting Slot and Panel Mount to mount SensorDAQ to an object.
The Screw Terminal Connector is available for customized input and output.
The screw terminal can be removed after being wired for specific experiments.
Replacement terminals are available separately from Vernier.
DIG BTD (British Telecom Digital) input/output channel for Vernier digital
sensors.
Providing Power to SensorDAQ
SensorDAQ is powered by the USB cable from the computer.
4
SensorDAQ User's Manual
Software
Note: NI LabVIEW 7.1 or newer must first be installed.
The SensorDAQ CD contains LabVIEW example programs that you can use to get
started programming with SensorDAQ, as well as driver subVIs for building custom
programs. The examples are in a folder called SensorDAQ that is located in your
user.lib directory. The driver VIs can be accessed from your User Libraries function
palette.
The CD also contains an executable of SensorDAQ Data Collection. You do not
need LabVIEW to run this, but you must have the DAQMX driver software and the
LabVIEW 7.1 Run Time Engine installed (find the installer on the CD or on the
National Instruments web site). Then copy the folder called “SDAQ Data Collection
App” to a convenient folder on your computer. Run SDAQ Data Collection App.exe
found inside this folder.
The low-level driver NI-DAQmx supports Windows 2000/XP. For users that are
familiar with programming DAQmx, LabVIEW examples implementing DAQmx
functions have been provided. And for those users familiar with Measurement and
Automation Explorer (MAX), there is also some functionality for testing
SensorDAQ using MAX.
For information on the driver subVIs, turn on the “Show Context Help” feature and
move your cursor over the driver subVIs.
Connecting Sensors and Signal Lines
Vernier Analog Sensors
Sensors can be divided into two basic types—analog and digital. Examples of analog
sensors are Voltage, Temperature Probes, pH Sensors, Force Sensors, and Oxygen
Gas Sensors. Up to three analog sensors can be connected to SensorDAQ at any
2
time . The channels for the analog sensors (Ch.1–Ch.3) are located on the left side.
The analog ports accept British Telecom-style plugs with a right-hand connector.
Pin 1 = Sensor output (+/-10V)
Pin 2 = GND
Pin 3 = Vres (resistance reference)
Pin 4 = AutoIDENT (used for auto-ID
of most Vernier sensors)
Pin 5 = Power (+5VDC)
Pin 6 = Sensor output (0-5V)
2
Due to the high power consumption of some Vernier CO2 Sensors, only one CO2 Sensor
can be used at a time with SensorDAQ.
5
SensorDAQ User's Manual
Most sensors provided by Vernier are auto-ID sensors. When you plug an auto-ID
sensor into SensorDAQ, the software will be able to identify it and set up the file
accordingly. Auto-ID information includes default settings for data collection rate,
length of collection, and calibration coefficients.
Most Vernier analog sensors send a raw voltage signal in the range of 0-5V on pin 6.
A few send a signal in the range of ±10V on Pin 1. The raw voltage signal is
converted to proper units using the sensor’s calibration coefficients.
Most Vernier sensors that plug directly into SensorDAQ without an adapter are autoID. However, the SensorDAQ can read a 0-5V or ±10V signal from many types of
sensors. To make the connection to SensorDAQ with a sensor without a BTA/BTD
plug, use an adapter (www.vernier.com/adapters/), or a bare BTA cable wired to your
custom sensor.
Vernier Digital Sensors
Pin 1 = I/O1
Pin 2 = I/O2
Pin 3 = I/O3
Pin 4 = PWR (5.08V)
Pin 5 = GND
Pin 6 = I/O4
Examples of digital sensors are Motion Detectors, Radiation Monitors, Photogates,
and Rotary Motion Sensors. One digital sensor at a time can be connected to
SensorDAQ. The digital channel (DIG), which accepts British Telecom-style plugs
with a left-hand connector, is located on the opposite side of the analog channels.
The SensorDAQ’s DIG Channel also accepts a Vernier Digital Control Unit. This is a
small box with a short cable that uses the DIG channel to provide output (up to 600
mA of current) for controlling electrical devices. For examples of how to use the
DCU and the other digital sensors in LabVIEW, see Appendix A.
Screw Terminal
SensorDAQ screw terminal connectors can be used for input or output. When used
for output, these connectors provide a limited current (see specs below); therefore, in
some cases you will have to provide an external power source. The +5V terminal can
be used as your voltage source. This source can only supply 200 mA maximum.
Note: A convenient option for running devices using digital output lines is the
Vernier Digital Control Unit (DCU). The DCU plugs directly into the DIG channel
and can supply up to 600mA of useful current to output lines.
The table below describes the signals available on the screw terminals.
6
SensorDAQ User's Manual
Screw terminal connector pinout
Terminal
Signal Name
Reference
Direction
Description
5,8,10
GND
11,12
AI <0..1>
Varies
Input
Analog Input Channels 0 and 1:
For single-ended measurements,
each signal is an analog input
voltage channel. For differential
measurements, AI 0 and AI 1 are
the positive and negative inputs,
respectfully, of differential analog
input channel 0.
9
AO 0
GND
Output
Analog Output Channel 0: Supplies
the voltage output of AO channel 0.
1-4
P0.<0.3
GND
Input or
Output
Digital I/O Signals: You can
individually configure each signal
as an input or output.
6
+5 V
GND
Output
+5 V Power Source: Provides +5 V
power.
7
PFI 0
GND
Input
PFI 0: This pin is configurable as
either a digital trigger, an event
counter input, pulse generation
output, or as a period, semi-period,
two edge separation timer.
—
—
Ground: Reference point for singleended AI measurements, bias current
return point for differential mode
measurements, AO voltages, digital
signals at the I/O connector, +5 VDC
supply, and the +2.5 VDC reference.
Analog Input Wiring
In the differential input setting, connect the the positive lead of the source to the AI(0)
terminal, and the negative lead to the AI(1) terminal. The differential input mode
allows the SensorDAQ to measure a voltage difference on these terminals up to +20V
or –20V in the ±20V range; however, the maximum voltage on any one terminal
cannot exceed ±10 V with respect to GND. In the referenced single-ended input mode
setting, connect the positive lead of the source to either AI channel terminal, AI(0) or
7
SensorDAQ User's Manual
AI(1), and the ground or negative lead to the GND terminal.
Analog Output Wiring
The SensorDAQ has one AO channel that can generate an output from 0–5V. The
AO has an output current drive value of 5 mA. To connect loads to the SensorDAQ,
connect the positive lead of the load to the A0 terminal, and connect the ground lead
of the load to a GND terminal.
Digital I/O
In addition to supporting Vernier digital sensors, the SensorDAQ has four digital
lines, P0.<0..3>, which comprise the DIO port. GND is the ground-reference signal
for the DIO port. The default configuration of the SensorDAQ DIO ports is open
collector, allowing 5 V operation, with an onboard 4.7 kΩ pull-up resistor. An
external, user-provided, pull-up resistor can be added to increase the source current
drive up to 8.5 mA limit per line.
Counter/Timer
SensorDAQ has a counter/timer that can be configured for pulse output, timing input,
event counting, or as a digital trigger.
For examples of how to use the screw terminal signals in LabVIEW, see Appendix A.
Sample Experiments (VIs) in LabVIEW
Sample experiments are provided as starting points for writing custom VIs. For
purposes of getting started, below are examples of the most basic features of
SensorDAQ. These include data collection with Vernier analog sensors, feedback and
control, and adjusting VIs.
Details about all the sample experiments are available in Appendix A.
Data Collection with Vernier Analog Sensors
Over 50 Vernier sensors are supported by SensorDAQ, which comes packaged with
the Vernier Voltage Probe. The following experiment uses that probe to test the voltage
of a 9 V battery.
For a complete list of supported Vernier sensors, see
http://www.vernier.com/probes/chart.html
1.
Open the example VI “AnalogInEx01_Ch1.vi” located in the Analog Channels
folder – Program Files\National
Instruments\LabVIEW\user.lib\SensorDAQ\EXAMPLES to launch LabVIEW. A
generic time graph will be displayed, along with instructions.
8
SensorDAQ User's Manual
Data Collection with one vernier analog sensor
2.
Connect the Vernier Voltage Probe to Ch.1 of SensorDAQ. Attach the leads to a
9V battery.
3.
to begin data collection. LabVIEW will identify the
Click the run arrow
sensor and adjust the graph and axes labels accordingly.
4.
Allow the data collection to complete after 18 seconds, or you may stop it early
by clicking the STOP button.
In this example, Ch.1 is used and the sample rate, samples to be read, and collection
time are all defaults read from the auto-ID sensor. In this example, these defaults
cannot be adjusted. Additional example VIs are available that allow you to adjust the
9
SensorDAQ User's Manual
data-collection parameters and use a wide variety of both Vernier and custom
sensors with the available channels and screw terminal.
Feedback and Control (Digital Out Lines)
Combining sensors with control via the SensorDAQ screw terminal or DIG channel
allows you to experiment with feedback. There are almost limitless possibilities
when using sensors to control output. This is the essential principle behind robotics.
In this example, we use a Vernier Stainless Steel Temperature Probe. As the data
rises to a preset threshold, a connected LED will light up. It will also help you
familiarize yourself with SensorDAQ's output lines.
1.
Open the example VI “ControlEx01_ControlDigOutWithSensor.vi” located in
Program Files\National Instruments\LabVIEW\user.lib\SensorDAQ\
EXAMPLES\Feedback and Control to start LabVIEW. The following VI will
appear along with instructions.
Digital out control with one Vernier analog sensor
2.
Connect a Stainless Steel Temperature Probe to Ch. 1. (The Voltage Probe
included with SensorDAQ could also be used in this example. Set the threshold
accordingly.)
10
SensorDAQ User's Manual
3.
Wire an electronic device, such as an LED with resistor, to the screw terminal.
Connect the positive wire to screw terminal 1 (P0.0) and the negative wire to
screw terminal 5 (ground).
Note: You can control which lines are activated when the threshold is reached by
clicking the LINES boxes. This is handy when you are connecting multiple devices.
4.
Set the “Threshold” value in the control above to 25 (as in Celsius).
5.
Run the VI by clicking the start button
6.
Hold the temperature probe in your hand. The LED connected to the screw
terminal will light up when the sensor's value rises to 25 ºC.
7.
Data will be collected until you click the STOP button.
.
Working with Block Diagrams
The example VIs included on your CD are meant to show you the basic functionality
of SensorDAQ, and how to program these functions in LabVIEW. Most users will
eventually need to create their own custom LabVIEW VI. One method for creating
your own custom VI is to build off of an existing example. The following steps show
how to take an existing program and modify it to fit the requirements of an
experiment.
Consider an experiment which requires a user to control SensorDAQ’s output
voltage, while monitoring this voltage with a Voltage Probe connected to Ch. 1. If
this output voltage goes above a certain threshold value, a digital output line is
turned high, lighting an attached LED warning light.
Hardware setup:
1.
2.
3.
4.
Attach wires to AO and GND terminals of the screw terminal.
Connect the Vernier +-10V Voltage Probe to Ch. 1
Connect the Voltage Probe leads to AO and GND wires to monitor analog
output.
Wire the LED with resistor to PO.0 and GND.
Create Program:
Note: You can find the completed VI (ControlEx10_Ch1MonitorsAnOut.vi) in your
EXAMPLES\Feedback and Control folder.
Start with a simple VI that can collect data from Ch. 1 and send it to a chart.
11
SensorDAQ User's Manual
Create this starter VI by opening AnalogInEx01_Ch1.vi and removing the code for
setting chart properties, removing the documentation, and altering the code in the
While Loop so that the loop ends only when the Stop button is pressed. Or, start with
a brand new VI and create this simple VI from scratch using the Setup, Start, Read,
and Stop SensorDAQ driver subVIs. You have easy access to the driver subVIs in
the SensorDAQ palette found in the Use Libraries function palette.
This program is already configured for collecting from sensors connected to Ch.1–3.
We must also configure for doing analog output and digital output tasks. The first
subVI, SensorDAQ_Setup.vi, provides input nodes to setup these tasks.
1.
Locate your mouse above the “Config AO Terminal (OFF)” node (located at the
bottom, left corner of the Setup subVI) and right click your mouse. A pop-up list
appears; Select Create>Constant. The default input for this node appears; click
on it and select “ON” to configure the SensorDAQ to perform Analog Output.
2.
Move your mouse to the “Config DIO Terminals” node (bottom right of the
Setup subVI) and right click your mouse. Select Create>Constant. A cluster of
four elements appears. The top element is the control for the PO.0 screw
terminal, the element below that is the control for the PO.1 screw terminal, etc.
Each of these elements has a default setting of “OFF”. Click on the top element
and choose “ON-Digital Out”. The PO.0 screw terminal is now configured to
perform digital output.
In the overview of the program, turn on an LED if the SensorDAQ’s analog output
voltage goes above a certain threshold value. We will now create the threshold
control and compare the threshold value to our analog output voltage (as read by the
12
SensorDAQ User's Manual
voltage probe in Ch. 1).
1.
First, resize the While Loop to provide more room for the additional code.
2.
Then add the Index Array function (Find this function by right clicking your
mouse in the block diagram to get your functions palette to appear, then press
the “Search” button at the top of the palette and type in “Index Array”).
a. Right click on the “Index” node and select Create>Constant. Leave this
input as 0. This code is used to pull out the first value of the array of data
points read from the Voltage Probe in Ch.1. In this example there is only
1 data point in the array, but we still need to use the Index Array function
to pull out that data point. The reason that Ch. 1 data is in an array format
is because in some cases the VI may be set up to read an array of data
points each time the SensorDAQ_Read.vi is called.
3.
Next, find the Greater? function in the block diagram palette and place it in your
While Loop. Wire the Ch. 1 data point into the Greater? function’s top node.
4.
Right click on the bottom node of the Greater? Function and select
Create>Control.
a. Label this control as “threshold”.
b. Go to the Front panel to find the threshold control
The comparison code above will tell us if the analog output voltage is greater than
the threshold value. If it is, turn on an LED by turning on the digital output line of
the screw terminal; if it is not, turn off the LED. This same type of code is performed
in ControlEx01_ControlDigOutWithSensor.vi. Copy and paste this code into the VI.
13
SensorDAQ User's Manual
1.
Open example ControlEx01_ControlDigOutWithSensor.vi, found in the
Feedback and Control folder.
2.
Select the SensorDAQ_DIO.vi, the Select function, and the two Boolean arrays
(or get the DIO subVI from the sensorDAQ palette). An easy way to do this is to
hold down the Shift key on your keyboard and click the mouse on the code that
you wish to select.
3.
Copy the selected code.
4.
Go back to your VI and make room in the While Loop by enlarging the Loop.
5.
Paste the selected code into the While Loop of your VI.
6.
Fix any broken wires and wire the result of the Greater? function into the “s”
node of the Select function.
7.
All of the output lines from the Read subVI must be wired into the DIO subVI
(the DAQmx Task Cluster, Setup Parameters, and error in).
8.
Make sure the DIO subVI is configured with “Out-Lines on Indefinitely”.
9.
The DIO subVI requires an array of four Boolean elements as an input, to tell it
which lines are turned on and which are turned off. The first element in the array
sets the On/Off state of PO.0; the second element sets the On/Off state of PO.1,
etc. We want lines PO.1,PO.2, and PO.3 Off at all times, so these elements are
kept False. The first element (PO.0) we want to be True if the Greater? function
returns a True (Analog Output is greater than the threshold); we want it to be
False if Greater? function returns a False. Make sure that two Boolean arrays are
set up this way (where the dark green with white letter represents which state is
active).
Finish the program by adding code to allow the user to control SensorDAQ’s analog
output voltage.
14
SensorDAQ User's Manual
1.
First add the subVI that performs analog output (SensorDAQ_AO.vi). This can be
found in the example called TerminalEx02_AnalogOut.vi or in the SensorDAQ
palette. Open this example and copy and paste the AO subVI into the While Loop
of your program.
2.
Configure the AO subVI to “Output Voltage on Indefinitely”.
3.
All of the output lines from the DIO subVI must be wired into the AO subVI
(the DAQmx Task Cluster, Setup Parameters, and error in).
4.
Go to the front panel, right mouse click to get your front panel functions and
select the Horizontal Pointer Slide. Type in “horizontal pointer slide” in the
Search if you can not find it.
5.
Label this control as “Output Voltage.”
6.
Double-click on the maximum value of this control to highlight and change the
value to 5 (since this control will be controlling the SensorDAQ’s analog output
voltage, which is in the range of 0-5 volts).
7.
Go back to the Block Diagram, find the Output Voltage control, and move it
into the While Loop.
8.
Wire this control into the Output Voltage node of the AO subVI.
Go to the Front panel and set the threshold to 2 and the Output Voltage to 0. Run the
program, and slowly increase the Output Voltage. Watch the graph as the Voltage
Probe reads the voltage. Increase the voltage to a value above 2 and look at the LED
wired to PO.0, it should now be turned on. Click the Stop button to end the program
15
SensorDAQ User's Manual
Resources
The following manuals and resources provide detailed information about
SensorDAQ and LabVIEW. In particular, the LabVIEW tutorials are a great way to
get to realize the full potential of SensorDAQ.
Check the Vernier web site for SensorDAQ support:
www.vernier.com/mbl/sensordaq.html
SensorDAQ Specifications
This guide, available on the SensorDAQ CD, describes SensorDAQ technical
specifications.
DCU Manual
The Digital Control Unit (DCU) gives you an easy way to use SensorDAQ's digital
channel for exciting, do-it-yourself projects.
Math Machines
Math Machines www.mathmachines.net creates customized connector and control
experiments for teachers using SensorDAQ.
LabVIEW Support
The National Instruments web site is a complete resource for LabVIEW software
support.
Troubleshooting
• If the SensorDAQ LED does not blink, the driver may not be properly installed.
Try re-installing the driver. Reboot the computer after installing the driver.
• If the SensorDAQ LED is blinking, but the LabVIEW examples do not detect
SensorDAQ, unplug SensorDAQ's USB cable, reboot the computer, then reinsert
the USB cable to SensorDAQ.
16
SensorDAQ User's Manual
Appendix A - Sample VIs
Sample experiments are provided as starting points for writing custom VIs. These
provide the building blocks for data collection using Vernier sensors, custom sensors
and devices, and for experimenting with feedback.
SensorDAQ Analog Channel
AnalogInEx01_Ch1.vi
Vernier auto-ID sensors have chips with calibration information loaded on them.
When this VI is run (by clicking the white arrow) LabVIEW will detect all auto-ID
capable sensors and calls up appropriate units and data-collection parameters.
AnalogInEx02_AdjustRate.vi
Simple data-collection VI using a Vernier sensor. The user can adjust the sample rate
and total number of samples to be read.
AnalogInEx03_FastRate.vi
Particular sensor and experiments benefit from faster sampling rates (microphone
and oscilloscope for example). The Repeat feature allows data to be continuously
read.
AnalogInEx04_Triggering.vi
When triggering is used, the VI waits for the user-defined condition to be met prior
to data collection.
AnalogInEx05_ModifyWithPopups.vi
This example allows you to select the sensor's units and configure the data-collection
parameters with the use of dialog popups.
AnalogInEx06_Ch1WithAI0Terminal.vi
SensorDAQ screw terminal lines AI0 and AI1 are analog-in lines. This example uses
the analog-in lines for reading voltage.
AnalogInEx07_CalibrationFromFile.vi
Vernier auto-ID sensors have chips with calibration information loaded on them.
This example VI allows you to manually enter calibration values for your sensor or
select calibration values on file. In most cases, the values stored in this file will be
different than the values stored on auto-ID sensors.
AnalogInEx08_CustomProbe.vi
This example allows you to configure non-auto-ID sensors, typically custom sensors.
The voltage, calibration, and units are manually entered.
AnalogInEx09_Averaging.vi
This example demonstrates the noise reduction of a signal with the use of averaging.
AnalogInEx10_Customize.vi
This example demonstrates a few of the unlimited possibilities of using LabVIEW
17
SensorDAQ User's Manual
software to customize your SensorDAQ program.
SensorDAQ Digital Channel
DIGEx01_DCU.vi
The DCU (Digital Control Unit) provides current (up to 600 mA) for controlling
electrical devices. It connects to the DIG channel of SensorDAQ. Inside the DCU are
LEDs that indicate the status of the six output lines. In this example, you can control
the duration of current sent to the output lines.
DIGEx02_PhotogateCount.vi
This example performs simple event counting of blocked gates.
DIGEx03_PhotogateTimedCount.vi
This example performs timed counting between blocked gates.
DIGEx04_PhotogateTiming.vi
In Photogate Timing mode, the counter sends back the timing measurements.
DIGEx05_PhotogatePicketFence.vi
This VI demonstrates how to use the Vernier Picket Fence and the Photogate to
study free fall. The Picket Fence is dropped through the Photogate and the motion
timing is measured from the leading edge of one bar blocking the beam until the
leading edge of the next bar blocks the beam (period measurement). This timing
continues as all eight bars pass through the Photogate.
DIGEx06_PhotogateObjectVelocity.vi
This VI demonstrates how to use the Photogate to determine the velocity of an
object. The time when the object first enters the Photogate until it completely exits
the Photogate is measured (blocked to unblocked semi-period measurement). The
length of the object can then be used to calculate the object's velocity.
DIGEx7_RotaryMotionSensor.vi
The Vernier Rotary Motion Sensor can be used with the DIG channel to measure
angular position.
DIGEx8_RadiationTimedCount.vi
The Vernier Radiation Monitor can be used with the DIG channel of SensorDAQ to
measure radiation. The reading will be in counts.
DIGEx9_MotionDetector.vi
The Vernier Motion Detector (MD) can be connected to the DIG channel to measure
distance.
Feedback and Control
ControlEx01_ControlDigOutWithSensor.vi
Combining sensors with control via the SensorDAQ screw terminal or DIG channel
allows you to experiment with feedback. In this example, as the sensor data rises to a
preset threshold, a connected LED will light up.
18
SensorDAQ User's Manual
ControlEx02_StartCollectWithDigIn.vi
In this example, the DIG input signal triggers the sensor to begin data collection.
ControlEx03_TempControl.vi
In this example, a Vernier Stainless Steel Temperature Probe (input), and a heating
source and fan (outputs) are used to create a temperature-controlled environment.
ControlEx04_MoveThenMeasure.vi
You can manually activate the digital-out lines of the screw terminal or DIG channel
in addition to taking the current data reading from a sensor. In this example, two DC
motors and a sensor are completely controlled by the user.
ControlEx05_TurnStepperMotor.vi
Stepper motors are used in cases where you want to have exact control of motion. In
this example, the stepper motor is controlled by the data threshold levels monitored
by a sensor.
ControlEx06_BuzzerWarning.vi
SensorDAQ can be used as a simple alarm system. In this example, it monitors an
analog sensor connected to Ch 1 and sets off a buzzer, connected to terminal 1
(P0.0), when the reading reaches a pre-determined limit.
ControlEx07_ControlAnOutWithSensor.vi
In this example, the reading of a sensor controls the Analog Out voltage.
ControlEx08_ControlAnalogOut.vi
The Analog Out feature allows you to command screw terminal 9 (AO.0) to output
an analog signal in a number of different patterns. SensorDAQ's analog out can only
update output voltage when called by software, at a maximum update rate of 150 Hz.
This example simulates the device performing an output waveform by outputting
one value at a time, at 150 Hz.
ControlEx09_AnInAnOutDigOutvi.vi
Demonstrates doing multiple input/output tasks simultaneously.
ControlEx10_Ch1MonitorsAnOut.vi
This example demonstrates how to control SensorDAQ's analog output, while at the
same time monitoring the analog output using a Voltage Probe connected to Ch. 1. A
Trigger Threshold control is also used to generate a digital out signal when the
analog-out voltage rises above the threshold level.
ControlEx11_ServoMotorControl.vi
This example demonstrates how to control a small servo motor using the
SensorDAQ's ability to create a pulse train output from the screw terminal #7 (PFI
0).
ControlEx12_MotionAlarm.vi
The Vernier Motion Detector can be connected to the DIG channel to measure
distance. In this example, the Motion Detector is monitoring to make sure no one
19
SensorDAQ User's Manual
enters a given space. If they do, an LED light (or buzzer) is turned on as an alarm.
ControlEx13_PhotogateTrap.vi
The Vernier Photogate can be connected to the DIG channel and used as a monitor to
trap flies, bugs, or mice. In this example, we use the Photogate as a sensor to detect
when the insect of animal is in position to be captured. When this happens, line P0.0
is turned on for 2 seconds (to turn a motor to close the trap door), followed by line
P0.1 flashing on and off (to warn that something is in the trap).
Screw Terminal
TerminalEx01_DigOut.vi
SensorDAQ's screw terminals 1-4 are digital-in and digital-out lines. This example
allows you to control the state of the digital-out lines.
TerminalEx02_DigIn.vi
SensorDAQ's screw terminals 1-4 are digital-in and digital-out lines. This example
allows you to monitor the state of the digital-in lines.
TerminalEx03_AnalogOut.vi
Control terminal 9 to output a voltage between 0-5 volts.
TerminalEx04_AnalogIn.vi
In this example, you will be using SensorDAQ's analog in lines 11 and 12 (AI0 and
AI1) to measure voltage.
TerminalEx05_CounterTiming.vi
The Counter feature allows you to command screw terminal 7 (PFI 0) to measure
timing of a pulse signal (semi-period, period, and 2 edge separation).
TerminalEx06_CounterCounting.vi
The Counter feature allows you to command screw terminal 7 (PFI 0) to perform
simple event counting.
TerminalEx07_CounterPulseTrain.vi
The Counter feature allows you to command screw terminal 7 (PFI 0) to create a
pulse-train output.
Data Collection
SDAQ Data Collection VI.vi
This is a LabVIEW program for use with the Vernier SensorDAQ. Channels 1-3 are
used to collect data with Vernier analog sensors, and the screw terminal inputs AI0
and AI1 can be used to collect data with custom analog sensors. These five analog
inputs can be configured, and the calibration coefficients modified, with options in
the Configure Channels menu (after running the VI). The data-collection rate, length
of the experiment, as well as any triggering can be configured by clicking on the
Data Collection button (which has the Clock in the Graph icon). Once data have
been collected, there are some analysis features that can be used. If you would like to
20
SensorDAQ User's Manual
analyze a small portion of the data, simply click and drag your mouse to highlight
the region, or use the Zoom tool to zoom in or zoom out. Data can be stored and
deleted to compare against other runs, as well as saved to file. These options can be
found in the menu selection.
Analysis tools are described in Appendix B.
Using DAQmx
For users with a programming and LabVIEW background, DAQmx example VIs are
available as templates for configuring measurement tasks, channels, and scales.
21
SensorDAQ User's Manual
Appendix B - Data Collection Analysis
Tools
Data collected in SDAQ Data Collection VI.vi are displayed graphically. Powerful
data analysis tools are provided, including curve fits, tangent lines, and integrals.
One analysis function may be used at a time.
The Toolbar provides quick mouse access to many tools used in this VI.
Live Readouts
, the icon for the SensorDAQ device
After clicking the white arrow to run the VI
appears, followed by live readouts for the detected sensor.
Most sensors provided by Vernier are auto-ID sensors, that is, when you plug that
sensor into SensorDAQ, LabVIEW will be able to identify it and set up the file
accordingly. This includes a default data collection setting. Generally, most sensors
that plug directly into SensorDAQ without an adapter are auto-ID.
Zoom
This command zooms to the selected area within a graph.
To zoom in on a portion of a graph, click on the Zoom In button on the toolbar, then
click and drag the mouse to select a region on the graph. The graph will rescale,
expanding the selected region to fill the plotting area. In addition, there
are other zoom options that appear in the upper left corner of the graph.
Use these options to zoom in and out of the display, autoscale your data,
or pan (pick up the plot and move it around in the display).
Statistics
The statistics feature calculates the minimum, maximum, mean, standard deviation,
and number of points of the selected data. A floating box that contains the statistics
is added to the graph.
You can calculate statistics for either the entire graph or just a selected portion of the
graph. Black brackets mark the beginning and end of the selected range.
To remove the statistics from the graph, click the close box in the upper corner of the
integral floating box.
Integral
The integral function calculates the area under a segment of the graph. The area is
filled on the graph and a floating box displays the numeric result.
Select the portion of the graph that you want to integrate. The direction you move
the mouse is not significant.
22
SensorDAQ User's Manual
To remove the integral from the graph, click the close box in the upper corner of the
integral floating box.
Curve Fit
The curve fit command is used to fit a function to all or part of your data. Five
adjustable parameters are available, and you can adjust the polynomial order.
Select the portion of the graph on which you want fit performed.
To remove the curve fit from the graph, click the close box in the upper corner of the
curve fit floating box.
Data Collection
Clicking on this icon calls up the data-collection dialog where you can adjust the
experiment length and sampling rate. Checking the repeat box collects data but
immediately starts a new collection upon finishing.
When the Trigger box is checked in the Triggering Tab, LabVIEW waits for the
user-defined condition to be met prior to data collection. For example, you can have
LabVIEW collect temperature data only until the temperature raises (or falls to) to
35 ºC.
Pre-Trigger Data
You may also set the number of points to be collected before the trigger condition
is met. A blank entry is equivalent to zero.
Configure Channels
This VI contains several customized menu selections. The most important one for
setting up sensors on channels 1-3, AI0 and AI1 is the "Configure Channels" menu
option. The submenu options from this selection include:
Change Sensor Units: Auto-ID sensors may store up to three sets of calibration
coefficients. Use this submenu to view and change the units.
Select and Modify Calibration Units from File: Here you can assign a sensor to
a channel. This is especially useful if your sensor is not auto-ID. Calibration
coefficients that are stored on file (which may be different than ones stored on the
sensor) can be selected, modified, and even saved for future use. In addition,
screw terminal channels AI0 and AI1 can be configured with this menu selection.
Zero: Sets the current reading of a sensor to zero.
23
SensorDAQ User's Manual