1
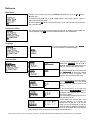
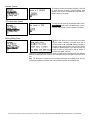
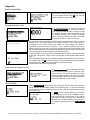
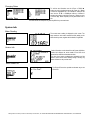
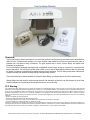
Your In-Home Display Overview The In-Home Display by Aztech Associates Inc. is a user-friendly product for monitoring energy consumption and its associated cost within the home. It communicates wirelessly to the smart electricity meter installed on your home to present electricity used, its estimated cost, and historical energy consumption. This guide explains how to use the In-Home Display and outlines what information can be displayed. The In-Home Display is lightweight and compact and is supplied with a power supply, so that you can place it in a convenient and easy-to-view location. The color of the Light Bar (green, yellow, or red) is used to display different electricity rates at a glance and the “speed” of its motion is proportional to the amount of energy you are consuming. The LCD display clearly shows numerical and graphical information with the option to adjust backlight intensity for better visibility. This manual reflects all the features available in the Aztech In-Home Display, your display may not have all the features shown. Although efforts have been made to provide accurate electricity cost information, all electricity cost data displayed by the In-Home Display is estimated for informational and educational purposes only and not for billing. FCC Warning This equipment has been tested and found to comply with the limits for a Class B digital device, pursuant to Part 15 of the FCC Rules. These limits are designed to provide reasonable protection against harmful interference in a residential installation. This equipment uses and generates radio frequency energy and, if not installed and used in accordance with the instructions, may cause harmful interference to radio communications. However, there is no guarantee that interference will not occur in a particular installation. If this equipment does cause harmful interference to radio or television reception, which can be determined by turning the equipment off and on, the user is encouraged to try and correct the interference by one or more of the following measures: • Reorient or relocate the receiving antenna. • Increase the separation between the equipment and receiver. • Connect the equipment into an outlet on a circuit different from that to which the receiver is connected. • Consult the dealer or an experienced radio / TV technician for help. Changes or modifications not expressly approved by the party responsible for compliance could void the user's authority to operate the equipment. To comply with FCC RF exposure compliance requirements, a separation distance of at least 20 cm must be maintained between the antenna of this device and all persons. This device must not be co-located or operated in conjunction with any other antenna or transmitter. Although efforts are made to provide accurate electricity cost information, ALL COSTS ARE ESTIMATES FOR INFORMATIONAL PURPOSES ONLY, NOT FOR BILLING. Contents Your In-Home Display ........................................................................................................................... 1 Overview ............................................................................................................................................... 1 FCC Warning ................................................................................................................................. 1 Powering On ......................................................................................................................................... 3 Setting Language and connect to your meter .................................................................................... 3 Start up .......................................................................................................................................... 3 How to connect to your meter? ...................................................................................................... 3 IHD features .......................................................................................................................................... 4 Using the Buttons .............................................................................................................................. 4 Light Bar ............................................................................................................................................ 4 Status line.......................................................................................................................................... 4 Using your IHD...................................................................................................................................... 5 Your Summary .................................................................................................................................. 5 Overall Summary ........................................................................................................................... 5 Detailed Summary (▲) .................................................................................................................. 5 Average daily comparison (▲) ....................................................................................................... 5 (√ )Resetting Summaries ............................................................................................................... 5 Your Historical Usage ........................................................................................................................... 6 Last 24 Hours kWh and (▲) $ ....................................................................................................... 6 Last 24 Hours numerical history(▲)............................................................................................... 6 (√ )Last 30 days kWh and (▲) $ .................................................................................................... 6 Last 30 days numerical history (▲)................................................................................................ 6 Your Real-time Usage ....................................................................................................................... 7 Current Usage(▲).......................................................................................................................... 7 Light bulbs(▲) ............................................................................................................................... 7 Instantaneous(√) ............................................................................................................................ 7 Reference ............................................................................................................................................. 8 Main Menu......................................................................................................................................... 8 Preferences Menu ............................................................................................................................. 8 Language ....................................................................................................................................... 8 User Interface ................................................................................................................................ 8 Number Format .............................................................................................................................. 9 12/24 hour time format ................................................................................................................... 9 Setting Billing Date ........................................................................................................................ 9 Appendix ............................................................................................................................................. 10 System Setup Menu ........................................................................................................................ 10 Change activation code ............................................................................................................... 10 Allow meter to connect to IHD ..................................................................................................... 10 Set Time/Date ................................................................................................................................. 10 Set Time zone ................................................................................................................................. 11 Electricity Rates ............................................................................................................................... 11 Changing Rates ............................................................................................................................... 12 System Info ......................................................................................................................................... 12 Meter Reading ................................................................................................................................. 12 Version Info ..................................................................................................................................... 12 Menu Power Off .............................................................................................................................. 12 Although efforts are made to provide accurate electricity cost information, ALL COSTS ARE ESTIMATES FOR INFORMATIONAL PURPOSES ONLY, NOT FOR BILLING. Powering On Powering the In-Home Display and Battery Operation When the AC adapter is plugged into the In-Home Display, it will automatically turn on. Alternately, when the In-Home Display is off, pressing the middle button will turn the device on. The device may be turned off by holding the middle button until the screen turns blank. The AC power adapter should be used under normal operating conditions. However, the In Home Display also supports battery operation to enable you to go through the home and monitor devices while in the same room as the device. Note: Before operating in battery mode, the In-Home Display must operate on AC power only for at least 8 hours to charge the batteries. Setting Language and connect to your meter Start up If turning on the IHD for the first time you will be asked to select a language. Select the language by using the left ▲ (UP) or right ► (DOWN) buttons to scroll. Press the √ Button to make the desired selection of the language of choice. How to connect to your meter? When the display attempts to connect to your meter, the Initialization Screen will be displayed with the message “Acquiring Data”, indicating that the device is searching for a meter connection. During this time, the Indicator Light Bar will glow red, sweeping back and forth. On the screen an antenna icon will appear to indicate that the IHD is searching. When the meter connection is found, the Summary view will be displayed. If no connection is found after 10 minutes, the message “No Signal Found” will be shown. The device will continue to search for the meter connection. At this point, it is recommended that the user ensure the Activation Code entered into the In-Home Display matches that of the meter as described in the System Setup Menu section found in the Appendix. To set or change the Activation Code during initialization, the Menu screens can be accessed at any time by pressing and holding the right ►button. See System Setup Menu– Activation Code section found in the Appendix. The IHD talks directly to your Elster REX meter. Rex meters can be of two basic types and they talk to the IHD at different rates. Some send values that are updated every minute although, if consumption is low, it may take several minutes or longer to notice any changes. Some send the data every hour, so while instantaneous will give you real time feedback, the average display updates every hour on the receipt of new data. Although efforts are made to provide accurate electricity cost information, ALL COSTS ARE ESTIMATES FOR INFORMATIONAL PURPOSES ONLY, NOT FOR BILLING. IHD features Using the Buttons Once the device is turned on, all viewing and setup functions are done using the three buttons located on the front of the In-Home Display. Viewing and programming instructions are described below. The right button ►moves from one view to another, normally cycling between the Main, History and Summary views. ● Press and Hold to jump to the main menu, preferences and system information; Select Exit to return to the Main, History and Summary views. The middle button √ allows screen specific actions. • In the Main views, pressing the button switches from averaged consumption to instantaneous demand. • In the History views, this button toggles between “Last 24 Hours” and “Last 30 Days”. • In the Summary views, this button accesses the Reset Summaries screen to reset the summary information. • .Allows the unit to be turned off and on by pressing and holding. The left (UP) button ▲ allows additional information to be displayed in the Main, History or Summary views. • In the Main view, this button moves between the kW and light bulb views. • In the History views, this button moves between the kWh, $ and tier summary views. • In the Summary views, this button moves between the Overall Summary, the Daily average compare and the Detailed Summary. Light Bar The Light Bar glows Red, Yellow or Green. The Light Bar light moves from left to right appearing to rotate at a rate that corresponds to the amount of energy being consumed. The higher the rate of consumption, the faster the light will “turn”. For Time-of-Use (TOU) the color is usually determined by the rate period and for volumetric use the colors are determined by which block you are in as described in the typical example below. • Green is typically used for the least expensive ($) TOU period or first volumetric block; • Yellow is typically used for the mid-rate ($$) period or next volumetric block; • Red is typically used for the most expensive ($$$) TOU period or volumetric block. For single rate applications, the light bar glows one color only. For more information about rates, see Electricity Rates in the Appendix. Status line The top status line (outlined in yellow)on this summary screen indicates the following: MHS -Three possible views- Main, History or Summary. The highlighted letter is the current view. Today’s date. This value is obtained automatically from the smart meter.* An antenna icon indicates connection is established. When flashing, the signal is weak. When there is no icon, the signal is lost. AC indicator Battery indicator. Note: A solid battery icon indicates battery operation only, not the amount of charge remaining in the battery. The present rate period indicator symbol is displayed • eg. For TOU rates: $ = Off-Peak, $$ = Mid-Peak, $$$ = Peak, $$$$ = Critical Peak. • eg. For volumetric $ = first block $$ = next block $$$ = etc. * User entry required except for REX2 meters Although efforts are made to provide accurate electricity cost information, ALL COSTS ARE ESTIMATES FOR INFORMATIONAL PURPOSES ONLY, NOT FOR BILLING. Using your IHD Your Summary Your Aztech In-Home Display provides a choice of informative summary views. These screens enable you to track your usage from a particular starting date and to how much energy you are using in different in different scenarios. Overall Summary presents your total energy used in KWh and $. Both Overall and Detailed Summary information are automatically set to your billing date, but can be adjusted to any date in the past if you want to monitor a specific period. To reset the summary screens, see Resetting Summaries. For more information about changing the billing date, see Setting the Billing Date in the Appendix. The average daily comparison screen is always based on a running week average and is not affected by the reset. The electricity rates are factory programmed. To view or edit the costs, see Electricity Rates Overall Summary The Overall Summary view. The upper left highlights the “S” for the Summary view. The total energy consumed and its associated estimated cost, since last Summaries Reset as shown on the bottom line, is displayed. (This includes any base period rates such as a fixed monthly fee or a per billing period fixed amount) Detailed Summary (▲) This screen displays the total energy consumed and its respective cost for each tier. This information is as of the last Summaries Reset as shown on the bottom line. The sum of the kWh and $ columns add up to the amounts displayed in the Overall Summary view (excluding monthly base charges). . Average daily comparison (▲) This view has two values shown. The upper “Today“ reflects the amount of electricity used today since midnight. (up to the last complete hour - e.g. at 4:25 PM it shows use to 4PM) The bottom value “Week Avg.” has the average of all the days in the last week for the same “midnight until now” period for comparison. When your daily consumption for today is lower than the week’s average, a happy face will appear. NOTE: each value reads “0.0” when first turned on. (√ )Resetting Summaries Pressing the √ button in the Overall or Detailed Summary views accesses this menu. NOTE: Each billing period the summaries will automatically be reset to your billing date. This can be manually adjusted to any date in the past if you wish to monitor different period. Now resets both the Overall and Detailed Summary views to zero. The Summary views will then begin immediately with new cost and usage information effective from the moment of reset. NOTE: The dollar cost includes consumption only unless the current day is a billing cycle start, in which case applicable base costs will be included in the total dollar cost for that billing cycle. By Date, causes a different screen to appear. The user will be asked to “Set Start Date”, which is the date the Summary information will be effective from, beginning at 12:01 a.m. on that date. For example, if March 1, 2008 is selected for the reset date, then the Overall and Detailed Summary views will display the electricity consumed in kWh and $ from March 1, 2008 until today. (the dollars is per kWh only unless the selected period includes a billing cycle start, in which case any base costs will be included) Any dates chosen before the date of installation for your In-Home Display will not contain any electricity usage information. The date shown when viewing the Set Start Date screen is the last reset date used. (typically billing period start) Dates cannot be set into the future. NOTE: The difference between resetting to today’s date vs. resetting Now is the amount and cost of electricity consumed from 12:01 a.m. today until now. (the dollars is per kWh only unless the selected period includes a billing cycle start, in which case any base costs will be included) Although efforts are made to provide accurate electricity cost information, ALL COSTS ARE ESTIMATES FOR INFORMATIONAL PURPOSES ONLY, NOT FOR BILLING. Your Historical Usage The Aztech In-Home Display allows you to view your historical energy consumption in a number of different ways. This allows you to track your consumption goals in the short term (24hour) or long term (30 days). Last 24 Hours kWh and (▲) $ The History view – Last 24 Hours kWh. The upper left highlights the “H” for History view. This screen displays up to 24 vertical bars showing hourly consumption (kWh) for the last 24 hours. As the day progresses the graph adjusts such that the most recent 24 hours of data is always displayed. When a new bar of data is added to the right side of the graph every hour, the oldest data is removed. The current time is shown near the top and the total amount (kWh) for the 24 hour time period is displayed at the bottom left of the screen. This screen displays up to 24 vertical bars showing the cost associated with the hourly consumption cost ($) for the last 24 hours. Each bar contains the cost of electricity consumed during each hour-long interval. The current time is shown near the top and the total cost for the time period (not including any monthly charges) is displayed at the bottom left of the screen Last 24 Hours numerical history(▲) This screen displays the consumption for the last 24 hours by TOU or volumetric block. Each row contains the amount in kWh and cost of electricity consumed in $ for each TOU or volumetric block shown. TOUs or blocks are shown in order. This does not include any monthly base charges. (√ )Last 30 days kWh and (▲) $ This screen displays up to 30 vertical bars showing the daily consumption (kWh) for the last 30 days, excluding any data from the current day. As the week progresses, the graph adjusts such the most recent day of data is always added to the right side of the graph and the oldest day’s data is removed from the left.. The current date is shown near the top and the and the total amount of electricity consumed in kWh for the 30 day time period is displayed at the bottom left of the screen. The bottom scale is marked with “MWF” to identify the Monday, Wednesday and Friday daily bars; while the bars for Saturday and Sunday are joined together into a double bar to easily distinguish weekends. History – Last 30 Days $. This screen displays up to 30 vertical bars showing the cost of the daily consumption in $ for the last 30 days. Each bar contains the cost of electricity consumed in each daylong interval. The current date is shown near the top and the total $ amount for electricity consumed during the time period (not including any monthly charges) is displayed at the bottom left of the screen. Last 30 days numerical history (▲) This screen displays the consumption for the last 30 days by TOU or volumetric block. Each row contains the amount in kWh and cost of electricity consumed in $ for each TOU or volumetric block. TOUs or blocks are shown in order. This does not include any monthly charges. Although efforts are made to provide accurate electricity cost information, ALL COSTS ARE ESTIMATES FOR INFORMATIONAL PURPOSES ONLY, NOT FOR BILLING. Your Real-time Usage Your Aztech In-Home Display provides the unique ability to show your real time usage in three viewing options. Your real time usage is updated at a rate determined by your meter although, if consumption is low, it may take several minutes or longer to notice any changes on the Current Usage and Light Bulb views. The instantaneous view always gives immediate response. Current Usage(▲) The Main view – Current Usage. The value is typically updated every few minutes and represents the average amount of electricity in kilowatts that is presently being used. (Demand) The bottom number in the smaller font represents the cost of electricity use per hour at the present rate of consumption. (based only on variable costs) Light bulbs(▲) Each light bulb represents 100W of electricity being used and corresponds to the number displayed in the previous screen rounded down to the nearest 100W increment. If the amount of electricity is greater than the number of light bulbs that can be displayed (60 bulbs, >6000 W), the view will revert to the Current Usage view. Instantaneous(√) In this display, the smart meter is queried once every six seconds and each real-time electricity demand value is displayed in kW. After a total of five queries over approximately 30 seconds, the display reverts back to the average demand in Current Usage view shown above. Although efforts are made to provide accurate electricity cost information, ALL COSTS ARE ESTIMATES FOR INFORMATIONAL PURPOSES ONLY, NOT FOR BILLING. Reference Main Menu The Menu can be accessed by pressing and holding the ►button from any of the Main, History or Summary views. In all menus use the left ▲ (UP) or right ► (DOWN) buttons to scroll (scroll). Press the √ Button to make the desired selection (select). In all menus selecting Exit will return to the previous menu or, in the case of the main menu, it will return back to the main views. Preferences Menu The preferences menu allows you to select the way the IHD is set up, including the way numbers and time are displayed. Select Exit from within the Preferences Menu to return to Main Menu. Language To change the language for all screens, select Language. Then scroll and select √ the desired language. User Interface To change the LCD contrast levels, select User Interface and Set Contrast. Use the UP ▲ or DOWN ► buttons to change the contrast. then press the √ Button to select the new setting. To adjust the backlight select User Interface and then Set Backlight, Use the UP ▲ or DOWN ► buttons to change the brightness. Then press the √ Button to select the new setting. To turn the tone on or off select User Interface and then Tone On / Off, Scroll to the desired option and press the √ Button to select the new setting. To turn the light bar On or Off, select User Interface and then Light Bar On / Off Scroll to the desired option and press the √ Button to select the new setting. It is recommended to leave the light bar on for best conservation awareness as it reinforces the knowledge of current electricity use. To help reduce power consumed and to keep night time distraction to a minimum, the backlight and the light bar of the In-Home display can turn off automatically at night. By default this feature is disabled by setting the on time to match the off time, but it can be adjusted in this menu to suit your schedule. While in the night time mode pressing any button will temporarily turn the light bar and backlight back on. Although efforts are made to provide accurate electricity cost information, ALL COSTS ARE ESTIMATES FOR INFORMATIONAL PURPOSES ONLY, NOT FOR BILLING. Number Format To change the number format between European (1 000,00 $) vs. North American ($1,000.00) number formatting, select Number Format, scroll to the desired option and press the √ Button to select the new setting 12/24 hour time format To change the clock format on all applicable screens, select 12/24 hour clock format, scroll to the desired option (12 hour or 24 hour) and press the √ Button to select the new setting Setting Billing Date The Billing Date allows you to choose the day of the month and the number of months in your billing cycle. (max 9 months) Use the UP ▲ or DOWN ► buttons to increase or decrease the day of month setting. Then press the √ Button to make the desired selection. If you have more than one month per cycle you will be able to edit the number of months in the “repeat every” line. Pressing the √ Button after the setting the number of months moves to the bottom line which indicates when the next billing date will be. If you are on a multi month period you can adjust to the correct month here. Note: This information is normally used for any fixed period charges to be added, and to reset any volume based counters for volumetric rates. It also provides a default for the summaries reset. Although efforts are made to provide accurate electricity cost information, ALL COSTS ARE ESTIMATES FOR INFORMATIONAL PURPOSES ONLY, NOT FOR BILLING. Appendix System Setup Menu The System Setup menu allows you to select the way the IHD connects to a meter, adjust time and date as well as the rates charged per kWh. Select Exit from within the System Setup Menu to return to Main Menu. Change activation code If you have new meter placed on your home you may have to Change Activation Code to connect to the meter you have. Scroll to this option and select. The ability to change this activation code may be password protected. To enter the numerical password, use the UP ▲ or DOWN ► buttons to increase or decrease the number for each digit. Then press the √ Button to move to the next digit. The activation code menu screen allows for programming the unique identifier of the radio in your smart electricity meter. This unique identifier must be properly entered for your In-Home Display to communicate with your smart electricity meter. Note: This unique identifier may already be programmed into your device when you received it. If not, it should be provided by your In-Home Display provider. If you do not have it, consult your In-Home Display provider. Once the activation code has been successfully entered, it should not be changed. Entering a wrong activation code will prevent your In-Home Display from communicating to your smart electricity meter. To enter the activation code, use the UP ▲ or DOWN ► buttons to increase or decrease the number for each digit. Then press the √ Button to move to the next digit. The digits include numbers and most letters. When the last digit has been entered, a confirmation message will be displayed. If you wish to correct your activation code, select No to go back and correct it. If you are satisfied that you have entered the correct number, select Yes to continue. You will then move to the start-up screen. Note the activation code shown is an example only. Allow meter to connect to IHD The Allow Meter Connect can be selected from the setup menu This allows the utility company to connect the correct meter to your IHD. This menu screen allows for the utility company to send a command to your IHD to be recognized by your meter. Note: This process may take several hours to a day to be completed by your utility company. Set Time/Date Although Set Time / Date allows for manual setting of Date and Time this is normally not required, as the date and time are automatically obtained from the electricity meter. In cases where the meter provides time and / or date, any manually entered time and / or date will be overwritten by the values from the smart meter. To Set Date, scroll to this option and select. A Set the date screen will appear. Use the UP ▲ or DOWN ► button to select the desired year, month and day. To help verify the date selected, the day of the week will be automatically displayed. Press √ to select and advance to the next entry, or to complete the date setting and return to Set Time / Date menu. Although efforts are made to provide accurate electricity cost information, ALL COSTS ARE ESTIMATES FOR INFORMATIONAL PURPOSES ONLY, NOT FOR BILLING. To Set Time, scroll to this option and select. A new Set the time will appear. Use the UP ▲ or DOWN ► button to select the desired hour, minute and second. Press √ to select and advance to the next entry, or to complete the time setting and return to the Set Time / Date menu. Set Time zone Select a Time Zone Offset to match the time in your local area. This is done in minutes. Use the UP ▲ or DOWN ► buttons to select the desired time offset from UTC (Greenwich time) to obtain your local time. Press √ to select and return back to the Set Time / Date menu. For Eastern Time Zone enter - 300 For Central Time Zone enter - 360 For Mountain Time Zone enter - 420 For Pacific time Zone enter - 480 Electricity Rates The preprogrammed Electricity Rates are viewable in this screen. A flat rate refers to a pricing structure that charges a single fixed fee per kWh, regardless of how much electricity is consumed or when it is consumed. Volumetric or block rates typically increase with each higher volume step of consumption; the more you use, the higher the price becomes. With Time-OfUse rates, your cost varies according to the time of day you use the electricity. If you use electricity when demand is high (on-peak), your cost will be higher for that electricity. In all cases a Base rate may be applied. Electricity costs are calculated and stored using the IHD’s rates in effect at the time the electricity is consumed. New electricity rates will impact electricity costs as of their effective date and time. A rate change will not alter stored electricity costs. Electricity usage and cost data are stored every 15 minutes. This information is displayed in various ways in the History and Summary views. The Time-of-Use (TOU) rates appear on this screen. In this example, there are three tiers with increasing cost. Typically the tiers may be referred to as: $ = Off-Peak $$ = Mid-Peak $$$ = Peak or On-Peak The second example shows a Base rate of $32 that is applied once per billing period, irrespective of quantity or time of use. The values shown are examples only and may differ from your actual rates. For volumetric (or block) applications, the rates shown are for each block, together with the kWh level they are valid from. The $ symbol is for the first block, (e.g. 0-499 kWh) with each successive level represented by an additional $. (e.g. $$ 500-1199kWh, $$$ > 1200kWh). The values listed are examples only and may differ from the actual. The second example shows four blocks and a Base rate of $8 that is applied once per billing period – irrespective quantity of use. The values shown are examples only and may differ from your actual rates. Although efforts are made to provide accurate electricity cost information, ALL COSTS ARE ESTIMATES FOR INFORMATIONAL PURPOSES ONLY, NOT FOR BILLING. Changing Rates To edit the rate information use the UP ▲ or DOWN ► buttons to scroll to the desired rate to edit. Press the √ Button to select the highlighted rate. This example is editing the $$ rate. Use the UP ▲ or DOWN ► buttons to increase or decrease the value for each digit. Press the √ Button to move to the next digit. When complete you may edit another rate or exit. The values shown are examples only and may differ from your actual rates. System Info Meter Reading The current meter reading is displayed on this screen. The large number on this screen matches the kWh reading on the smart electricity meter, together with tier details, if applicable. Version Info Version information can be viewed from the System Info Menu. Version Info displays the serial number for the IHD circuit board and its software and hardware versions. The other lines contain troubleshooting information and the bottom corner shows internal Battery voltage. Pressing any button will return to the previous menu. Menu Power Off The Power Off menu item provides an alternate way to turn off the IHD. Although efforts are made to provide accurate electricity cost information, ALL COSTS ARE ESTIMATES FOR INFORMATIONAL PURPOSES ONLY, NOT FOR BILLING.