1
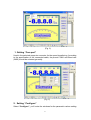
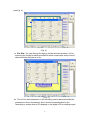
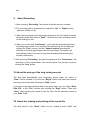
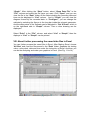
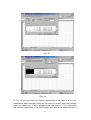
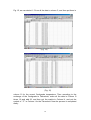
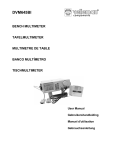
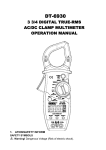
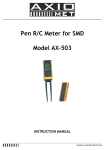
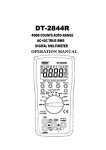
TP4000ZC DATA LOGGER
USER MANUAL
With the high technology of the integrated Σ-∆ converter, Data Logger
provides the high accurate way on the data testing and data logging which
can conveniently change the ACV, DCV, ACA, DCA, Resistant, Capacitance,
Frequency, Temperature, etc. to the digital signals for computer. With the
highly insulated optical RS-232 connector, you can transfer the records to the
computer for further processions.
The Data Logger can automatically test and adjust the suitable values on
each range accordingly. During the voltage, resistance and current testing, it
can also be set to test a specified range by the push buttons.
The Data Logger can easily test and log the data on the voltages from 0.1mv
to 600V, resistance from 0.1Ω to 40MΩ, currents from 10µA to 10A,
capacitance from 10pF to 100µF, frequencies from 1Hz to 10M Hz,
temperatures from –50°C to 750°C.
Not all the data transferred to the computer can be viewed on the digital and
analogue ways, but can also be recorded, saved, automatically graphed and
then processed and printed.
As it has the advantages of - the best in function, flexible and convenient in
usage as well as cheap in price, it can be widely used in different fields. Not
only greatly used in industrial test, scientific research, environmental
protecting fields, it’s also suitable for university and middle school students or
families for scientific testing, data processing and analyzing. If accessed with
some periphery circuit or induction blocks, it can also be a changeable data
logging and analyzing system on the station.
Without connecting to the computer, this model can also be used separately
as a multimeter.
I. Installing the system
1. About RS-232 Connector
The RS-232 on DMM is connected with the optical isolated connector for high
isolation between the DMM and computer. For safety, the attached RS-232
connector is required for the connection.
2. Installing the software
1
Open the ‘Setup’ file in Win95 or other Windows versions, select the right
version for your computer and open the file. Double click “Setup” and then
follow the instructions for the installation. After the installation, go to ‘Program’
on the Start menu and enter the ‘Data Logger’ software. Then the following
screen will appear:
(Fig. 1)
3. Use of the system
After installing the attached software and connecting the DMM to the
computer with the RS-232 connector, start the computer and the DMM. Then
start the RS-232 function on the Data Logger until the "RS-232" display
appears on the screen. Select the " Data Logger " software after starting the
computer. Push the "Begin" button on the right upper side and go into the
measuring status with the connections. Then the "Begin" button has been
changed to "Stop". And later you can also turn it off by pushing the "Stop"
button.
If the operation is abnormal, please check the cable connection and refer to
the description at "Option".
II. About “Option”
In the pulling box menu under the “option” item, you can finish the following
selections:
2
(Fig. 2)
1. Setting “Com port”
Used in the selected computer connector for the speed transferring. According
to the specification of the connected cable, the preset COM1 and Baud rate
(2400) should be selected generally.
(Fig. 3)
2. Setting “Configure”
Select “Configure”, you’ll enter the windows for the parametric values setting.
3
(see Fig. 4)
(Fig. 4)
a. File Size: You can change the figures on the selected windows. It’s for
selecting the length for each recorded file which means how many lines of
data should be included in a file.
(Fig. 5)
b. The unit for each parameter in the recording can be selected inside the
parametric column accordingly. And it should be standardized in the
recording no matter what unit it displays in the digital LCD or analogue part.
4
e.g. In Fig. 6, the arrow points to “V”, which means the unit is Volt (V) in the
voltage measuring. As the same in Fig. 6, the recording unit is set to “k
ohm” for the Resistance measuring, “nF” for the Capacitance and “mA” for
the Current, etc.
If you want to change the unit in the recorded data, you should choose by
pointing to another unit in the range accordingly. And then click “OK” to
confirm.
(Fig. 6)
c. The range of the ordinate for “Graph” can be selected by choosing the
figures inside the long column of each parameter. E.g. (in Fig. 6) the
setting has fixed the range for the ordinate of the graph from (–500mV )
to (+500mV). See Fig7.
With this function, you can zoom the graph and view the minor changes of
the records. E.g. When you’re checking the changes of the temperature
under the previous fixed control, it looks like a straight line because the
ordinate range is 0~200°C (see Fig. 8). But if we change the temperature
range to 10~50°C in Fig. 6, the graph and the detailed changes of the
temperature can be viewed clearly. (See Fig. 9)
5
(Fig. 7)
(Fig. 8)
6
(Fig. 9)
The data that has already been recorded and saved in the file can also be
viewed in the software by changing the range of the ordinate for a clear and
specific graph as per your required.
d. In the temperature measuring, Fahrenheit and Centigrade can be
exchanged during the temperature measuring by selecting” °C” or” °F”.
e. In the temperature test, select “K Type” and the calibrating function is
activated for the nonlinear K type thermocouple. It can automatically
calibrate the readings on the display and the records according to the
standard of the K Type thermocouple so the accuracy of the temperature
measuring can be greatly improved. Now the reading in the computer is
different from the one on the Data Logger. But it’s more accurate !
f. In the Frequency measuring, after connecting with the Adapter for the 128
pre-division, you can choose the “Adapter 128” button so the correct
reading can appear and be recorded automatically without the calculation
by yourself.
3. Setting “Color”
The color of the letters and drawings on the screen of the computer can be set
to whatever color you like. You can make the display a colorful and unique
one of your own.
7
(Fig. 10)
III. About
“Display”
After the installation of the software and entering into the operation
environment, you’ll see four windows - Digital, Analog, List and Graph on
the screen of the computer except the main window. On the bottom of the
main window, there are four kinds of data displaying automatically: the Max.,
Min. and the average values as well as the air time. Therefore, there should
be max. eight kinds of different data displaying at the same time.
You can also select the switch of the four windows by clicking the pull-down
menu under the “Display” column: And you can randomly open/close the
windows by clicking the four buttons on your right hand side.
IV. About “MAX., MIN., and AVG values”
1. During the real time sampling, the software will automatically continue
calculating and displaying the Min., Max., and Average values.
2. The Min., Max. and Average values will be automatically calculated and
display when you read the previous records in the software.
3. The calculation of the Min., Max. and Average values will be re-started if
you double-click the left side button of the left-hand mouse in the operation
8
bar.
V.
About Recording
1. After choosing “Recording”, the results of the test can be recorded;
2. The recording can be proceeded no matter the “List” or “Graph” button
has been clicked or not;
3. When the recordings reach the length as preset in the file, they’ll be saved
temporally under the name of “Data.* ” And then the next recording comes
on the analogy of this.
4. When go on choosing “Continuous”, you’ll enter the automatically timed
recording environment. You can select the total time for the recording by
clicking the “Time” column. And the “Sample interval” provides the
selection of the time gap between the two recordings. The system will
automatically make it the way for long time recording and receiving the
records continuously.
5. After choosing “Recording”, but without pressing on the “Continuous”, the
recording is in the manual state. You can also have it for just one record by
clicking the “One” button.
VI. About the saving of the long lasting records
The files that automatically and temporally saved under the name of
“Data.*”will be cleared if you click the “Begin” button and enter into another
working environment after clicking the “Stop” button.
If you want to save the temporal files for long-tem uses, you can select “Save
Data File” in the “File” column after clicking the “Stop” button. Then click
“Save” after inputting the name for the file. Now the file has been saved in
your “Data” folder.
VII. About the viewing and printing of the saved file
The files saved in the “Data” folder can be viewed in both “List” and
9
“Graph”. After clicking the “Stop” button, select “Open Data File” in the
“File” column and select the file name you want. Click “Open” and you can
view the file in the “Data” folder. All the data including the recording date and
time can be displayed in “List” column. And in “Graph” you can view the
diagram formed by the recorded data. In “Configure”, you can change the
ordinate by selecting the figures in the long bar inside the relevant parameter.
And the data points of the ordinate can be adjusted in “Set X Zoom” which is
on the right-hand side in “Graph” column. Then a clear drawing can be
displayed.
Select “Print” in the “File” column, and select “List” or “Graph”, then the
displays in “List” or “Graph” can be printed.
VIII. About further processing the saved data files in Excel
You can further process the saved files in Excel. After Starting Excel, choose
“All files” and read the files saved in the “Data” folder. Separate the testing
value, unit symbol, date and time under the instruction of Excel. And then you
can do the analyzing and make your graphics in Excel. (See Fig. 11 to 14)
(Fig. 11)
10
(Fig. 12)
(Fig. 13)
In Fig. 14, we can make our further procession on the data. E.g. For the
temperature data recorded in the list, we need to correct them and change
them into Fahrenheit. If we’ve already known the error of +1.5°C caused by
the internal temperature of the Data Logger and need to be deducted, like in
11
Fig. 15, we can deduct 1.5 from all the data in column C, and then put them in
(Fig. 14)
(Fig. 15)
column G for the correct Centigrade temperature. Then according to the
exchange of the Centigrade to Fahrenheit, make all the data in Column G
times 1.8 and add 32, and then put the results in Column H, and put the
symbol of “°F” in Column I for the Fahrenheit. Now the process is completed
easily.
12
IX. About the Auto Power Off Function in the Data Logger
As the Data Logger has the auto power off function, the Data Logger will
automatically power off and get into the shutting down environment in 30
minutes after you stop turning the rotary switch or pressing the button. But if a
long time recording is required, you can press “Select” (or the “SEL” button)
when you turn on the power of the Data Logger. Then the auto power off
function is eliminated.
X. Specifications
1. General specifications
Testing method: Σ-∆
Display :
LCD
Ranges:
Manual or auto-ranged
Polarity:
Automatic
Overload indication: “OL” display
Battery indication: When the battery is lower than 2.4V, a “ ”
symbol will appear for reminding of replacing
the battery.
EMC/LVD. IEC1010 Double Insulation CATII
Safety standards:
.
Operation environment: Temperature 32°F to104°F (0°C to 40°C),
humidity< 85% RH.
Storage environment :Temperature -4°Fto140°F (-20°C to 60°C),
humidity< 95%RH.
Power source
: 2 x 1.5V AA batteries.
Dimension
: 145(H) x 73(W) x 40(D) mm
Weight
: Approx. 260g (including battery and holster ).
2. Electric function specifications
Accuracy is indicated with ±(% reading+ digits), environmental
temperature 23±5°C, Humility < 75%
13
DCV:
400mV, 4V, 40V, 400V
: ± (0.5% + 5)
600V
: ± (0.8% + 5)
Input Impedance
: 10MΩ(about 10GΩ at 400mV range)
ACV:
4V, 40V, 400V
400mV, 600V
Input Impedance
Frequency
: ± (0.8% + 5)
: ± (1.2% + 5)
: 10MΩ (about 10GΩ at 400mV range)
:40—400Hz
Resistance:
400Ω, 4kΩ, 40kΩ, 400kΩ, 4MΩ: ± (1% +5)
40MΩ
: ± (2% +5)
Overload protection
: 250V DC/AC
RMS.
DCA:
400µA, 4000µA
: ± (2% +5)
40mA, 400mA
: ± (1.5% +5)
10A
: ± (2% +5)
Overload protection : Fast speed 0.5A/250V, 10A/250V fuses
ACA:
400µA, 4000µA
: ± (2.5% +3)
40mA, 400mA
: ± (2% +5)
10A
: ± (2.5 % +5)
Overload protection : Fast speed 0.5A/250V, 10A/250V fuses
Frequency
:40—400Hz
Capacitance:
40nF
400nF,4µF, 40µF
100µF
Overload protection
: ± (3.5% +10)
: ± (3% +5)
: ± (3.5% +5)
: 250V DC/AC
RMS.
Frequency and Duty cycle
Frequency 10Hz-10MHz
: ± (0.1% +5)
Duty cycle 0.1%-99.9%
: ± (2.5% +5)
Sensitivity
: Sine wave 0.6V RMS. Max. input 50V
Overload protection
: 250V DC/AC RMS.
Temperature: (For using “K” type thermocouple)
0°C--+40°C
: ±3°C (internal temperature sensor)
-50°C--+200°C
: ± 0.75%± 3°C
+200°C--+750°C
: ± 1.5%± 3°C
14
Remarks: When it’s connected to the computer with RS-232,
there’s an option for “K type” in the software which can start the
nonlinear calibration program of the K type thermometer and
adjust the nonlinear of the thermocouple to 0.5% downwards at
the range of -250°C ~ +1300°C.
Diode testing:
Test current
Test voltage
Overload protection
: 1±0.6mA
: .Approx.. 1.5V
: 250V DC/AC RMS
Continuity testing
There’s a beeper when the resistance is less than (60+20) Ohm in
the tested circuit.
Overload protection
: 250V DC/AC RMS.
XI. OPERATION
CAUTION:
1) When measuring voltage, ensure that instrument is not connected or
switched to resistance range. Always ensure that the correct terminals
are used for the type of measurement to be made.
2) Use extreme care when measuring voltage above 50V, especially from
sources where high energy exists to avoid electric shock.
3) Avoid making connections to "alive" circuits whenever possible.
4) When making current measurements ensure that the circuit is not
"alive" before open it in order to connect the test leads.
5) Before making resistance measurements or diode test, ensure that the
circuit under test is discharged.
6) Always ensure that the correct function and range is selected before
testing. If in doubt about the correct range to use, start with the highest
and then work downwards.
7) Extreme care should be taken when using this meter to measure a
current transformer connected to the terminals where an open circuit
connects with.
8) Ensure that the test leads and probes are in good condition with no
damage to the insulation.
9) Take care not to exceed the over-load limits as given in the
specifications.
10) Before opening the case of the instrument to replace battery,
disconnect the test leads from any external circuit, set the selector
witch to "OFF" position.
15
2.1 Check the 3-volt battery.
If the battery is weak, a "
" symbol will appear on the left of the
display. It means that the battery should be replaced.
2.2 DC and AC Voltage measurement
1) Connect the black test lead to "COM" socket and red test leads to the
"VΩHz" socket.
2) Set the selector switch to desired “ V
” position, and press
“SELECT” key to choose function.(DC or AC)
3) Connect the probes across the source or load under test.
2.3 DC and AC Current measurement
1)Connect the black test lead to "COM" socket and red test leads to the
"VΩHz" socket.
2)For measurement up to 400mA. Set the selector switch to desired “mA
” or “µA
” position, and press “SELECT” key to choose
function.(DC or AC)
3)For current measurement from 400mA to 10A, connect the red test
lead to "10A" socket. Set selector switch to “ A
” position, and
press “SEL” key to choose function.
4)Connect the probes across the source or load under measurement.
2.4 Resistance measurement and Diode, Continuity Test
1) Connect the black test lead to "COM" socket and red test leads to the
"VΩHz" socket.
2) Set the selector switch to "Ω /
" position and press “SELECT”
key to choose function.
3) Connect the probes across circuit to be tested.
Caution: Ensure that the circuit to be tested is "dead". Max. input
over-load: 250V RMS. and<10sec.
2.5 Capacitance measurement
1) Before testing, discharge the capacitor by shorting its leads together.
Use caution in handling capacitors because they may have a charge
on them with considerable power before discharging.
2) Connect the black test lead to "COM" socket and red test leads to the
"VΩHz" socket.
3) Set the selector switch to “
” position.
4) Press “REL” key, you can use the relative function to eliminate the zero
16
error.
5) Connect the probes across capacitor to be tested.
Note: When testing 100µF capacitor, note that there will be approx.
15 sec time lag.
2.6 Frequency and Duty cycle measurement
1) Connect the black test lead to "COM" socket and red test leads to the
"VΩHz" socket.
2) Set the selector switch to “Hz” position and press “Hz/DUTY” key to
choose function.
3) Connect the probes across the source or load under measurement.
4) When using the Adapter, the correct reading should come after the
calculation of the reading on the LCD display times 128.But when
connecting the computer with RS232 and selecting ‘Adapter 128’ box
inside ‘Configure’ column, the correct result will directly come out.
2.7 Temperature measurement
Set the selector switch to the ‘°C’ range and connect the K type
thermocouple’s black test lead to “COM” socket and red test lead to the
"VΩHz" socket.
2.8 Manual range and auto range
1) Default is set to be “Auto” range when the meter first turns on. Press
“RANGE” key the meter
to enter the “Manual” mode. Each press of “RANGE” key increments
the range.
2) Hz/Duty and Capacity and Temperature functions cannot be manually
changed.
3) Press “RANGE” key more than 2 seconds, the meter changes back to
“Auto”.
2.9 Relative value display
Press “REL” key meter to enter relative measurement mode, the present
value will be stored in memory, new display value is equaled
measurement value subtract stored value. All functions are with the
capability except for Hz/Duty function.
Example:
When you test the capacitance, you can use the Relative function to
eliminate the zero error.
2.10 Auto Power Off and disable
1) When the meter has been turned on after 30 minutes without any
action, the meter will automatically change to “OFF” mode.
2) To disable Auto Power Off function, press “SELECT” key when power
on the meter.
17
2.11 RS232 Computer interface
1) Set up your PC under Windows system. Insert the diskette to the
drive. Click “Setup.exe” . Follow up setup massage from the screen.
2) Connect the RS232 cable between the meter’s and the computer’s
serial ports. On the “PROGRAM” menu box, then “DMM” is shown,
click on “DMM” into start.
3) Push “RS232”, RS232 stats and the symbol of ” RS232” appears on
the LCD.
Push “RS232” again, RS232 is disconnected and the symbol of
“RS232” disappears.
For detail information on the computer interfacing, please check the
software comes with the meter.
XII. CARE AND MAINTENANCE
3.1 CARING FOR YOUR MULTIMETER
Your Digital MultiMate is an example of superior design and
craftsmanship. The following suggestions will help you care for the
multimeter so you can enjoy it for years.
1) Keep the meter dry. If it gets wet, wipe it dry immediately. Liquids can
damage or corrode electronic circuits.
2) Use and store the multimeter only in normal temperature environments.
Extreme temperature can shorten the life of electronic devices, damage
batteries, and distort or melt plastic parts.
3) Handle the multimeter gently and carefully. Dropping it can damage the
circuit boards and can cause the multimeter to work improperly even the
holster can provide enough protection.
4) Keep the multimeter away from dust and dirt, which can cause premature
wear of parts.
5) Wipe the multimeter with a damp cloth occasionally to keep it clean Do
not use harsh chemicals, cleaning solvents, or strong detergents to clean
the multimeter.
6) Use only fresh batteries of the required size and type. Always remove old
or weak batteries out. They can leak chemicals that destroy electronic
circuits. Alkaline batteries are highly recommended.
3.2 MAINTENANCE
3-Volt battery replacement or fuse replacement
a) When no use for a while, set the selector switch to OFF position and
remove the test leads from the terminals.
b) To replace the batteries, remove the screw on the bottom case and lift
the bottom case. Remove the used battery and replace it with a battery
18
of the same type.
c) To remove the screws on the bottom case and lift the case. Replace the
fuse with same type and rating: 5×20mm 0.5A/250V fast-blow fuse or
6×25mm 10A/250V fast-blow fuse as the replacements.
For any further assistant, please check the website :
www.multimeterwarehouse.com , for the customer in Northern America,
please call 1-888 524 8676 for more information. For more technical
information regarding multimeter application , please visit our website:
XIII. Accessories
The following items are included in the Data Logger:
1. Holster
2. RS-232 cable connector
3. AA battery
4. Test leads
5. K type thermocouple
6. CD Rom
1 pc
1 pc
2 pcs (installed inside)
1 pair (red & black each)
1 pc
1 pc
http://www.multimeterwarehouse.com/techcenter.htm
19