1
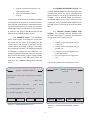
FWRC
Operations
Philip H. Steele
Philip A. Araman
Craig Boden
R e s e a r c h
by
W i l d l i f e
Sawmill
a n d
Hardwood
C e n t e r
Research Bulletin
Choice for
F o r e s t
Economic
The Forest and Wildlife Research Center at Mississippi State University was established by the
Mississippi Legislature with the passage of the Renewable Natural Resources Act of 1994. The mission of the center is to conduct research and technical assistance programs relevant to the efficient
management and utilization of the forest, wildlife, and fisheries of the state and region, and the protection and enhancement of the natural environment associated with these resources. The FWRC
scientists conduct this research in laboratory and forests administered by the University and cooperating agencies and industries throughout the country. Research results are made available to
potential users through the University’s educational program and through Center publications such
as this, which are directed as appropriate to forest landowners and managers, manufacturers and
users of forest products, leaders of government and industry, the scientific community and the general public. Dr. G. Sam Foster is director of the Forest and Wildlife Research Center.
Authors
Philip H. Steele is a professor in the Department of Forest Products at Mississippi State University.
His primary research interest is automated wood processing systems. Philip Araman is a project
leader for the Southern Research Station, USDA Forest Service. Craig Boden is a Research
Associate in the Forest Products Laboratory.
Acknowledgements
Development of this software was funded by cooperative agreements with the Southern Research
Station and the Northeastern Forest Experiment Station, USDA Forest Service.
Disclaimer
This software provides preliminary lumber yield and investment feasibility estimates that the
authors believe to be accurate. These estimates should be confirmed with more detailed analyses.
The authors are not responsible for specific estimates or decisions made on the basis of these
estimates made by users of this software.
To Order Copies
Copies of this and other Forest and Wildlife Research Center publications are available from:
Publications Office
Forest and Wildlife Research Center
Box 9680
Mississippi State, MS 39762
Please indicate author(s), title, and publication number if known.
Publications can also be found on our web site at http://www.cfr.msstate.edu.
Citation
Steele, P.H., P.A. Araman, C. Boden. 2002. Economic choice for hardwood sawmill operations
(ECHO). Forest and Wildlife Research Center, Bulletin FP252, Mississippi State University. 21 pp.
FWRC
Research Bulletin
FP 252
Forest and Wildlife Research Center
Mississippi State University
Economic Choice for
Hardwood Sawmill
Operations
(ECHO)
A program to determine the investment feasibility of
installing reduced-kerf and higher-accuracy sawing
machines in hardwood sawmills.
by
Philip H. Steele
Philip A. Araman
Craig Boden
Forest and Wildlife Research Center
Mississippi State University
Table of Contents
1.
Introduction . . . . . . . . . . . . . . . . . . . . . . . . . . . . . . . . . . . . . . . . . . . . . . . . . . . . . . . . . . . . . . . . . . . . . . . . . . .1
2.
Background . . . . . . . . . . . . . . . . . . . . . . . . . . . . . . . . . . . . . . . . . . . . . . . . . . . . . . . . . . . . . . . . . . . . . . . . . . .1
3.
The Alternative Investment Rate, Inflation and Measures of Investment Feasibility . . . . . . . . . . . . . . . . . . .1
4.
Sensitivity Analysis . . . . . . . . . . . . . . . . . . . . . . . . . . . . . . . . . . . . . . . . . . . . . . . . . . . . . . . . . . . . . . . . . . . . .2
5.
System Requirements . . . . . . . . . . . . . . . . . . . . . . . . . . . . . . . . . . . . . . . . . . . . . . . . . . . . . . . . . . . . . . . . . . .2
6.
Installing ECHO . . . . . . . . . . . . . . . . . . . . . . . . . . . . . . . . . . . . . . . . . . . . . . . . . . . . . . . . . . . . . . . . . . . . . . . .2
7.
File Management . . . . . . . . . . . . . . . . . . . . . . . . . . . . . . . . . . . . . . . . . . . . . . . . . . . . . . . . . . . . . . . . . . . . . .2
8.
ECHO Data Worksheet . . . . . . . . . . . . . . . . . . . . . . . . . . . . . . . . . . . . . . . . . . . . . . . . . . . . . . . . . . . . . . . . . .3
9.
Running ECHO . . . . . . . . . . . . . . . . . . . . . . . . . . . . . . . . . . . . . . . . . . . . . . . . . . . . . . . . . . . . . . . . . . . . . . . .3
10.
ECHO Keyboard Controls . . . . . . . . . . . . . . . . . . . . . . . . . . . . . . . . . . . . . . . . . . . . . . . . . . . . . . . . . . . . . . . .3
11.
ECHO Tutorial . . . . . . . . . . . . . . . . . . . . . . . . . . . . . . . . . . . . . . . . . . . . . . . . . . . . . . . . . . . . . . . . . . . . . . . . .4
11.1
ECHO TITLE SCREEN . . . . . . . . . . . . . . . . . . . . . . . . . . . . . . . . . . . . . . . . . . . . . . . . . . . . . . . .5
11.2
MAIN MENU . . . . . . . . . . . . . . . . . . . . . . . . . . . . . . . . . . . . . . . . . . . . . . . . . . . . . . . . . . . . . . . .5
11.3
SAWMILL IDENTIFICATION . . . . . . . . . . . . . . . . . . . . . . . . . . . . . . . . . . . . . . . . . . . . . . . . . . . .5
11.4
ESTIMATED INCREASED REVENUE OPTION . . . . . . . . . . . . . . . . . . . . . . . . . . . . . . . . . . . . .5
11.5
VARIABLE INPUT . . . . . . . . . . . . . . . . . . . . . . . . . . . . . . . . . . . . . . . . . . . . . . . . . . . . . . . . . . . .6
11.6
CHANGE RESAW KERF OPTION . . . . . . . . . . . . . . . . . . . . . . . . . . . . . . . . . . . . . . . . . . . . . . .6
11.7
CHANGE ROUGH GREEN SIZE OPTION . . . . . . . . . . . . . . . . . . . . . . . . . . . . . . . . . . . . . . . . .6
11.8
PRODUCTION PERCENTAGES . . . . . . . . . . . . . . . . . . . . . . . . . . . . . . . . . . . . . . . . . . . . . . . . .7
11.9
ROUGH GREEN SIZE . . . . . . . . . . . . . . . . . . . . . . . . . . . . . . . . . . . . . . . . . . . . . . . . . . . . . . . .7
11.10 CENTER CANT SPECIFICATION . . . . . . . . . . . . . . . . . . . . . . . . . . . . . . . . . . . . . . . . . . . . . . . .7
11.11 COMPUTER/VIEW SUMMARY . . . . . . . . . . . . . . . . . . . . . . . . . . . . . . . . . . . . . . . . . . . . . . . . . .8
11.12 INCREASED PRODUCTION DISTRIBUTION OPTION . . . . . . . . . . . . . . . . . . . . . . . . . . . . . . .9
11.13 LUMBER PRODUCTION DATA . . . . . . . . . . . . . . . . . . . . . . . . . . . . . . . . . . . . . . . . . . . . . . . . .9
11.14 ESTIMATED INCREASED REVENUE RESULTS . . . . . . . . . . . . . . . . . . . . . . . . . . . . . . . . . .10
11.15 CAPITAL COSTS . . . . . . . . . . . . . . . . . . . . . . . . . . . . . . . . . . . . . . . . . . . . . . . . . . . . . . . . . . . .10
11.16 VARIABLE COSTS . . . . . . . . . . . . . . . . . . . . . . . . . . . . . . . . . . . . . . . . . . . . . . . . . . . . . . . . . .11
11.17 INVESTMENT RATES . . . . . . . . . . . . . . . . . . . . . . . . . . . . . . . . . . . . . . . . . . . . . . . . . . . . . . . .12
11.18 CASH FLOW ANALYSIS RESULTS . . . . . . . . . . . . . . . . . . . . . . . . . . . . . . . . . . . . . . . . . . . . .12
11.19 ANALYSIS SUMMARY . . . . . . . . . . . . . . . . . . . . . . . . . . . . . . . . . . . . . . . . . . . . . . . . . . . . . . .13
11.20 SAVE . . . . . . . . . . . . . . . . . . . . . . . . . . . . . . . . . . . . . . . . . . . . . . . . . . . . . . . . . . . . . . . . . . . . .13
Appendix A
I.
II.
III.
IV.
. . . . . . . . . . . . . . . . . . . . . . . . . . . . . . . . . . . . . . . . . . . . . . . . . . . . . . . . . . . . . . . . . . . . . . . . . .15
Conversion Data . . . . . . . . . . . . . . . . . . . . . . . . . . . . . . . . . . . . . . . . . . . . . . . . . . . . . . . . . . . .16
Capital Costs Data . . . . . . . . . . . . . . . . . . . . . . . . . . . . . . . . . . . . . . . . . . . . . . . . . . . . . . . . . . .17
Variable Costs Data . . . . . . . . . . . . . . . . . . . . . . . . . . . . . . . . . . . . . . . . . . . . . . . . . . . . . . . . . .18
Investment Rates Data . . . . . . . . . . . . . . . . . . . . . . . . . . . . . . . . . . . . . . . . . . . . . . . . . . . . . . .18
Literature Cited . . . . . . . . . . . . . . . . . . . . . . . . . . . . . . . . . . . . . . . . . . . . . . . . . . . . . . . . . . . . . . . . . . . . . . .21
1. INTRODUCTION
ital on installation and require more maintenance and
Reductions in sawkerf on headrigs and
saw filing. Circular headrigs with inserted teeth can
be maintained by the sawyer or other sawmill person-
resaws can dramatically increase lumber recovery.
Research has also shown that lumber target size
nel with a few minutes maintenance each day.
Insertion of teeth and sharpening can be performed
reductions are even more important than kerf reductions in providing increased lumber recovery.
while the saw remains on the arbor. Maintenance of
Decreases in either sawkerf or lumber size, however,
bandsaw blades, however, requires that they be
removed from the saw for sharpening. A full-time filer
always come at some cost in both capital and variable
costs. Determining whether the financial benefits
and capital investment in a filing room and specialized
filing equipment are usually required.
from increased lumber yield outweigh the incurred
costs can be a difficult task.
Some hardwood sawmills will benefit finan-
The Economic Choice for Hardwood Sawmill
cially from circular headrigs. Operations that saw a
high percentage of cants or ties may lose only a small
Operations (ECHO) is a software package developed
to help analyze the economic benefit of installing thin-
amount of wood fiber from a circular saw compared to
a thinner-kerf band saw. Some sawmills may be too
ner-kerf and higher-accuracy sawing machines.
Replacement of headrigs and resaws with reduced
kerfs and increased sawing accuracy can be tested.
small to support the increased per-unit costs required
ECHO will assist in the estimation of the
increased lumber recovery and the resultant
tially thinner kerfs and lower sawing variation than
those available even a decade ago. However, a significant capital outlay for this new technology and
for a band headrig.
Modern resaws are able to saw with substan-
increased revenue from reducing kerf or lumber sizes
on headrigs and resaws. As an alternative, users
may make their own increased revenue estimate.
increased maintenance costs should be expected.
Users must also determine the estimated increased
costs expected from equipment changes. Based on
the estimated increased revenues and costs, a discounted cash flow analysis is performed by ECHO.
The investment feasibility measures of present net
3. THE ALTERNATIVE INVESTMENT RATE,
INFLATION, AND MEASURES OF
INVESTMENT FEASIBILITY
ECHO provides 3 measures of investment
feasibility: payback period, internal rate-of-return, and
present net worth. It is assumed that program users
are generally familiar with these investment feasibility
measures, but for convenience a brief definition of
each is given below.
value, rate of return, and payback period are provided. The software also addresses federal tax implications.
2. BACKGROUND
Payback period: The length of time in years
required to repay the initial investment expense
with the net revenues resulting from the investment. Traditional industry practice is to not discount the cash flows in computing payback period
and ECHO has adopted this practice. A payback
period shorter than the payback period required by
company policy indicates that the investment
should be undertaken.
Circular headrigs can consume 0.131 inch
more wood fiber in sawkerf and sawing variation per
sawline than band headrigs. This increased loss of
wood fiber by circular headrigs translates into a 10 to
12 percent loss in lumber yield for the volume of lumber sawn by the circular headrig. This magnitude of
loss indicates that sawmillers with circular saws
should carefully consider installing a band headrig.
Circular headrigs reduce overhead costs for
hardwood sawmills. Band headrigs require more cap-
1
Internal rate-of-return: The rate-of-return earned
results of an ECHO run based only on such lumber
by an investment. Technically it is the interest rate
that discounts the after-tax cash flows to zero. An
prices. Rerunning the analysis with lumber prices at
the lower levels that may be expected over the next
internal rate-of-return higher than the rate required
to be earned by company policy indicates that the
10 years would be a prudent exercise. The same
holds true for other cost or benefit estimates that may
investment should be undertaken.
be expected to change over time such as interest
rates, log costs, etc.
Present net worth: The summed value of all cash
flows after being discounted to year zero at the
alternative investment rate. A positive value
5. SYSTEM REQUIREMENTS
means that the alternative investment rate has
The minimum system requirements needed to run
been earned and indicates that the investment
should be undertaken.
ECHO are:
z
z
ECHO does not account for monetary inflation over time. For that reason the measures of
investment feasibility are given in real dollars and
should be compared only to competing investments
z
z
that are also stated in real dollars (Bullard and Straka
1998). This also means that the alternative investment rate used in discounting should be in real terms.
IBM® compatible PC
Microsoft® Windows® 95/98/2000/NT/ME,
XP
Monochrome, Color, or VGA Adapter
One 3.5" Floppy Drive and a Hard Disk
Drive
ECHO is written in Microsoft® Visual Basic®
Programming System for MS-DOS®, Version 1.00
(Microsoft Corp. 1992).
ECHO computes internal rate-of-return and
present net worth based on discounting after-tax cash
flows. Therefore, comparisons to other present net
worth values or rates-of-return for comparing investments are only appropriate if these investments are
6. INSTALLING ECHO
To install ECHO on your hard drive, follow these
steps:
given in both real and after-tax terms (Bullard and
Straka 1998). Comparison of the ECHO internal rateof-return should only be compared to bank-rate
returns if these bank rates are adjusted downward to
1. Begin at the Windows desktop.
2. Insert ECHO disk 1 into your floppy
drive.
3. Click the Start button on the taskbar and
choose Run… .
4. Type A:\SETUP in the line labeled Open.
(If your floppy drive is designated by a
letter other than A, substitute that letter
for A.)
5. Click the Ok button and follow the onscreen instructions to install ECHO.
an after-tax rate. For example, a company with a 25percent tax rate that earns a nominal 8-percent rate of
interest from a bank before taxes actually earns a 6
percent after-tax rate.
4. SENSITIVITY ANALYSIS
A properly performed investment analysis
should include a sensitivity analysis. This involves
repeating ECHO runs while varying those cost and
benefit estimates to which some uncertainty may be
attached. For example, if current lumber prices are at
a historically high rate when an investment analysis is
made, it would be unwise to be satisfied with the
7. FILE MANAGEMENT
ECHO uses predetermined file extensions for
2
storing and retrieving data. All input data files have
screen, use one of the following methods:
an .ECO file extension and all output files have an
.OUT file extension. For convenience, it is recom-
z
Press the Tab key. The Tab key moves the
mended that all data files be kept in the same directory and that similar file names be used for input and
z
cursor to the next entity.
Press the Shift-Tab key combination. The
output.
Shift-Tab key combination moves the cursor
8. ECHO DATA WORKSHEET
z
z
Before running ECHO, it may be convenient
to summarize the required input data on the input
data worksheet shown in Appendix A. This will help
Press the Enter key after entering a data
value in a data input field. This will advance
the cursor to the next entity.
z
insure that all necessary data are available before
running the program. The input data worksheet is also
Move the mouse pointer over a data input
field and click the left mouse button. This will
move the cursor to the data input field.
stored as a Microsoft Word for Windows document
(Worksheet.doc) in the ECHO directory on your hard
drive.
®
to the previous entity.
Press the up- or down-arrow key.
®
To enter a value in a data input field:
1. Move the cursor to the data input field and
9. RUNNING ECHO
type the value from the keyboard. The
Backspace key or the Delete key can delete
the value.
To run ECHO, follow these steps:
2. Once the data value has been typed, move
the cursor to the next input field or select an
option button or a command button.
1. Begin at the Windows desktop.
2. Click the Start button and then
point to Programs.
3. Click the ECHO98 menu item to
start the program.
Each ECHO screen consists of a group of three or
more command buttons located at the bottom of the
screen. These command buttons include:
Note: When the program begins, it may appear as a
window on your desktop. To switch to the full-screen
mode, press and hold the Alt key and then press
the Enter key.
Previous
Next
10. ECHO KEYBOARD CONTROLS
Help
ECHO is a menu-driven application requiring
user input on various screens. The ECHO screens
consist of data input fields, option buttons, and command buttons. The keyboard or the mouse can be
used to traverse through these three entities, to enter
data in a data input field, or to select an option button
or a command button.
To traverse through the data input fields, the
option buttons, and the command buttons within a
Exit
Save
Edit
3
Returns ECHO to the
previous screen.
Advances ECHO to the next
screen.
Brings up a help window for
the current screen.
Terminates the ECHO
program.
Brings up a dialog box from
which the input or output data
can be saved to a text file.
Brings up a dialog box from
which the MACRS
depreciation rates can be
changed.
through an ECHO analysis with test values. While
To select an option button or a command button,
the values have been selected to make sense they do
not represent values from an actual sawmill and are
use one of the following methods:
z
z
not intended to be used in subsequent analyses.
Only values that users know to be accurate for their
Move the mouse pointer over the button and
click the left mouse button.
situation should be used for an actual analysis.
Move the cursor over the button using the
ECHO consists of various screens that solicit input data and display the resulting output data. This
Tab key, the Shift-Tab key combination, or
the up- or down-arrow key and then press
z
section shows the steps for entering data and obtaining results by presenting a hypothetical tutorial run.
Enter.
Press and hold the Alt key and then press
The tutorial data is based on an assumed reduction in
the highlighted letter in the name appearing
headrig kerf from 0.280 inch to 0.165 inch and in
rough green size from 1.125 to 1.11 inch for 4/4 lum-
on the command button. For example, to
select the Next button, press and hold the Alt
ber and 1.375 to 1.36 inch for 5/4 lumber. Other
machine and raw material data are not changed for
key and then press the letter N.
this example. Monetary data are based on an initial
Each ECHO screen contains a pop-up Help win-
saw cost of $120,000, an installation cost of $15,000,
a saw brake cost of $5,000, an additional filing room
dow that displays a brief description of the screen,
including a description of the input data solicited by
building cost of $40,000, and an additional filing room
equipment cost of $25,000. Variable costs include an
increase in filer wages of $39,000, an annual saw
the screen. To access the Help window within a
screen, select the Help command button.
replacement cost of $5,000, a maintenance cost of
$2,000, and a grinding wheel resurfacing cost of
$1,000. Corporate, property, and insurance taxes of
28%, 3%, and 1%, respectively, are assumed in addi-
11. ECHO TUTORIAL
The ECHO tutorial is intended to guide users
E
C
H
O
ECHO - MAIN MENU
ECONOMIC CHOICE FOR HARDWOOD
SAWMILL OPERATIONS
Select an option:
A program to determine the investment feasibility of
installing reduced-kerf and higher-accuracy sawing
machines in hardwood sawmills.
Copyright (c) Philip H. Steele, Craig Boden
Forest Products Laboratory
Mississippi State University
and
Philip A. Araman
Southern Research Station
U.S.D.A. Forest Service
April 2002, Version 3.13
Next
<
START A NEW ANALYSIS
>
<
LOAD A PREVIOUS ANALYSIS
>
<
RETURN TO CURRENT ANALYSIS
>
<
EXIT
>
<
HELP
>
Exit
Figure 1. ECHO title screen
Figure 2. MAIN MENU screen
4
tion to an alternative investment rate of 12.5%.
you manually enter the input data throughout the
Thestraight-line depreciation method is assumed for
thistutorial.To begin the tutorial, start the ECHO pro-
ECHO program. Choosing the second option allows
you to load the data file TUTORIAL.ECO. This file
gram as described in Section 9.
resides in the ECHO directory and contains the input
data for this tutorial. If the second option is chosen,
11.1 ECHO title screen.
When ECHO
the LOAD ANALYSIS dialog box will appear. To load
begins, the first screen to appear is the ECHO title
screen (Figure 1). This screen displays the title of the
the file TUTORIAL.ECO from this dialog box, select
the file from the file list box and press the Ok com-
program and other relevant information. To continue,
press any key and ECHO will advance to the MAIN
mand button.
After an option is selected from the MAIN
MENU screen.
MENU, ECHO will advance to the SAWMILL IDENTIFICATION screen.
11.2 MAIN MENU. The MAIN MENU (Figure
2) consists of three options:
11.3 SAWMILL IDENTIFICATION. The
SAWMILL IDENTIFICATION screen (Figure 3) allows
1. Start a New Analysis
you to enter information that identifies the sawmill.
2. Load a Previous Analysis
3. Return to Current Analysis
This information is not required, but is recommended
to facilitate future file storage and retrieval. For this
The first option allows you to enter data for a new
analysis, the second option allows you to load a pre-
tutorial, enter the data shown in Figure 3. Press Next
and ECHO will advance to the ESTIMATED
INCREASED REVENUE OPTION screen.
viously-saved input data file, while the third option
allows you to return to the current analysis. At this
point in the tutorial, you may choose either of the first
two options. Choosing the first option will require that
11.4 ESTIMATED INCREASED REVENUE
OPTION. The ESTIMATED INCREASED REVENUE
OPTION screen (Figure 4) consists of two options:
ECHO - SAWMILL IDENTIFICATION
Sawmill Name:
Sawmill Address:
Previous
Forest Products Laboratory
(z)
Compute increased revenue from conversion
improvement
()
Enter your estimated increased revenue
Box 9820
City:
Mississippi State
State:
MS 39762-9820
Next
ECHO - ESTIMATED INCREASED
REVENUE OPTION
Exit
Previous
Help
Next
Exit
Help
Figure 4. ESTIMATED INCREASED REVENUE
OPTION screen
Figure 3. SAWMILL IDENTIFICATION screen
5
1. Compute increased revenue from con-
11.6 CHANGE RESAW KERF OPTION. The
version improvement
2. Enter your estimated increased
CHANGE RESAW KERF OPTION screen (Figure 6)
consists of two options, Yes and No, that allow you to
revenue
specify whether or not the current resaw kerf will be
changed. If Yes is selected, ECHO will advance to
The first option allows ECHO to compute the estimat-
the RESAW KERF screen. If No is selected, ECHO
ed increased revenue based on conversion improvement data that will be entered in subsequent screens.
will advance to the CHANGE ROUGH GREEN SIZE
OPTION screen. For this tutorial, select No and press
The second option allows you to enter your own estimated value of the increased revenue. For this tutori-
Next.
al, select the first option. Press Next and ECHO will
11.7 CHANGE ROUGH GREEN SIZE
advance to the VARIABLE INPUT screen.
OPTION. The CHANGE ROUGH GREEN SIZE
OPTION screen (Figure 7) consists of four options for
11.5 VARIABLE INPUT. The VARIABLE
INPUT screen (Figure 5) prompts you to enter both
changing the current rough green size:
the current and new values of the headrig kerf, the
1. Change current rough green size for
current value of the average log diameter, and the
current value of the average log length. The headrig
resaw only
2. Change current rough green size for
kerf is measured in inches. The average log diameter
is measured in inches at the log's small end. The
average log length is measured in feet. For each vari-
headrig only
3. Change current rough green size for
resaw and headrig
able, enter the data shown in Figure 5. After the data
have been entered, press Next and ECHO will
advance to the CHANGE RESAW KERF OPTION
screen.
4. Do not change current rough green
size
The first option allows you to change the current
ECHO - CHANGE RESAW KERF
OPTION
ECHO - VARIABLE INPUT
Enter the new and/or current values for the variables
given below.
Current
New
Change resaw kerf?
1) Headrig kerf (0.10 - 0.35 inch):
0.28
( ) Yes
(z) No
0.165
2) Average log diameter (8 - 24 inches): 16
3) Average log length (8 - 18 feet):
Previous
Next
Exit
12
Help
Previous
Figure 5. VARIABLE INPUT screen
Next
Exit
Help
Figure 6. CHANGE RESAW KERF OPTION
screen
6
ECHO - CHANGE ROUGH GREEN
SIZE OPTION
( ) Change current rough green size for resaw only
(z) Change current rough green size for headrig only
( ) Change current rough green size for resaw and
headrig
ECHO - PRODUCTION PERCENTAGES
Thickness
4/4
5/4
6/4
7/4
8/4
Total
Production (%)
50
50
Percentage Processed
at the Headrig (%)
70
70
( ) Do not change current rough green size
Previous
Next
Exit
Help
Previous
Next
Exit
Help
Figure 7. CHANGE ROUGH GREEN SIZE
OPTION screen
Figure 8. PRODUCTION PERCENTAGES
screen
rough green size only for the resaw. The second
option allows you to change the current rough green
size only for the headrig. The third option allows you
Figure 8 and press Next. ECHO will then advance to
the ROUGH GREEN SIZE screen.
to change the current rough green size for both the
resaw and the headrig. The fourth option should be
chosen if you do not wish to change the current rough
green size.
For this tutorial, select the second option.
11.9 ROUGH GREEN SIZE. The ROUGH
GREEN SIZE screen (Figure 9) prompts you to enter
both the current and new rough green size values for
each thickness of lumber that will be processed.
Those unfamiliar with determining rough green lum-
Press Next and ECHO will advance to the
PRODUCTION PERCENTAGES screen.
ber sizes should consult Chapter 9 of "Quality Control
in Lumber Manufacturing" by T. D. Brown (1982).
For this tutorial, enter the data shown in Figure
9 and press Next. ECHO will then advance to the
CENTER CANT SPECIFICATION screen.
11.8 PRODUCTION PERCENTAGES. The
PRODUCTION PERCENTAGES screen (Figure 8)
prompts you to enter the percentage of the total production made up by each lumber dimension (4/4, 5/4,
6/4, 7/4, and 8/4). The percentages of total production
for the lumber thicknesses specified must add to 100.
The percentage of the total production of each thickness processed at the headrig must also be entered.
For example, the input data given in Figure 8 shows
that 50% of the total production will be 4/4 lumber and
70% of the 4/4 lumber processed will be processed at
the headrig. The remaining 50% of production is 5/4
lumber, also with 70% processed at the headrig.
For this tutorial, enter the data shown in
7
11.10 CENTER CANT SPECIFICATION. The
CENTER CANT SPECIFICATION screen (Figure 10)
prompts you to enter the percentage of the average
log volume produced as a center cant that is not subsequently processed at the resaw. For this tutorial,
enter 30 and press Next. ECHO will then advance to
the COMPUTE/VIEW SUMMARY screen.
11.11
COMPUTE/VIEW
SUMMARY.
The
COMPUTE/VIEW SUMMARY screen (Figure 11)
consists of two options:
the INCREASED PRODUCTION DISTRIBUTION
OPTION screen (Figure 13). Choose this option when
you are ready for ECHO to compute the estimated
ECHO - ROUGH GREEN SIZE
Enter the current and new rough green size values for
each thickness of lumber that will be processed.
Thickness
4/4
5/4
6/4
7/4
8/4
increased revenue and continue with the run analysis.
Choosing the second option causes ECHO to
advance
Current Rough Green
New Rough Green
Size (in).
Size (in.)
1.125 (0.75 - 1.25)
1.11 (0.75 - 1.25)
1.375 (1.00 - 1.50)
1.36 (1.00 - 1.50)
(1.20 - 1.75)
(1.20 - 1.75)
(1.50 - 2.00)
(1.50 - 2.00)
(1.75 - 2.25)
(1.75 - 2.25)
Previous
Next
Exit
to
the
CONVERSION
EFFICIENCY
IMPROVEMENT RESULT screen (Figure 12). This
option allows you to view a summary of the input data
that have been entered into the ECHO program up to
this point. This gives you the opportunity to verify the
accuracy of the input data before ECHO computes
the estimated increased revenue. This option also
allows you to view the conversion efficiency improvement result. For this tutorial, select the second
option. Note that the conversion efficiency improve-
Help
ment result for this tutorial is 4.59%. After verifying
the accuracy of the input data, press the OK command button from the CONVERSION EFFICIENCY
Figure 9. ROUGH GREEN SIZE screen
IMPROVEMENT RESULT screen, and ECHO will
return to the COMPUTE/VIEW SUMMARY screen.
From the COMPUTE/VIEW SUMMARY
1. Compute estimated increased revenue
2. View summary of changes and conversion
efficiency improvement result
screen, select the first option. Press Next and ECHO
will advance to the INCREASED PRODUCTION DISTRIBUTION OPTION screen.
Choosing the first option causes ECHO to advance to
ECHO - CENTER CANT
SPECIFICATION
ECHO - COMPUTE/VIEW SUMMARY
( ) Compute estimated increased revenue
Enter the percentage of the average
log volume produced as a center cant
that is not subsequently processed
at the resaw: 30
Previous
Figure 10.
screen
Next
Exit
(z) View summary of changes and conversion
efficiency improvement result
Previous
Help
Next
Exit
Help
Figure 11. COMPUTE/VIEW SUMMARY screen
CENTER CANT SPECIFICATION
8
11.12 INCREASED PRODUCTION DISTRI-
PRODUCTION DATA screen.
BUTION OPTION. The INCREASED PRODUCTION
DISTRIBUTION OPTION screen (Figure 13) prompts
11.13 LUMBER PRODUCTION DATA. The
you to specify the manner in which the increased lumber production will be applied. There are three
LUMBER PRODUCTION DATA screen (Figure 14)
prompts you to enter data about the sawmill's current
options:
lumber production and log purchases. There are a
total of five values that you might be required to enter
depending on the option selected in the previous
1. Increased lumber production only
2. Decreased log cost only
screen, INCREASED PRODUCTION DISTRIBUTION OPTION (Section 11.12). These user-input val-
3. Both increased lumber production and
decreased log cost
ues are:
The first option should be selected if the resulting
1. Current annual lumber production (MBF)
2. Current revenue from lumber sales
conversion efficiency improvement will only increase
lumber production. The second option should be
($/MBF)
3. Reduced overhead on increased production ($/MBF)
selected if the resulting conversion efficiency
improvement will only reduce log purchases. The
third option should be selected if the resulting conversion efficiency improvement will increase lumber pro-
4. Current log cost ($/MBF)
5. Current annual log volume purchased
(MBF)
duction and reduce log purchases. If you select the
third option, ECHO will prompt you to enter the percentage of the lumber production increase that will
reduce log purchases.
All volume values must be specified per MBF and all
monetary values must be specified as dollars per
For this tutorial, select the first option and
press Next. ECHO will then advance to the LUMBER
MBF, where MBF denotes 1,000 board feet.
It is important to provide the average sales
ECHO - INCREASED PRODUCTION
DISTRIBUTION OPTION
ECHO - CONVERSION EFFICIENCY
IMPROVEMENT RESULT
Select the option to which the increased lumber
production will be applied:
The changes which are given below will improve conversion efficiency by an estimated 4.59%
(z) Increased lumber production only
Variable
Headrig kerf (in.)
Resaw kerf (in.)
Rough green size (in.)
Current
New
0.28
--------4/4 = 1.125
5/4 = 1.375
6/4 =
7/4 =
8/4 =
0.165
---------4/4 = 1.11
5/4 = 1.36
6/4 =
7/4 =
8/4 =
( ) Decreased log cost only
( ) Both increased lumber production and decreased
log cost
Previous
Ok
Figure 12. CONVERSION EFFICIENCY
IMPROVEMENT RESULT screen
Next
Exit
Figure 13. INCREASED PRODUCTION
DISTRIBUTION OPTION screen
9
Help
value for only those thicknesses of lumber being
1. Total revenue from lumber sales
considered in the ECHO analysis. Use of a mill-run
value that might, for example, contain lower or higher-
2. Conversion efficiency improvement
3. Estimated increased revenue from
value products will not reflect the true dollar-value
increase from the investment.
increased lumber production
4. Estimated decreased cost as a result of
If option 1, Increased lumber production only,
log purchase reduction
was selected in the INCREASED PRODUCTION
DISTRIBUTION OPTION screen (Section 11.12),
5. Net estimated increased revenue
values will be required only for items 1, 2, and 3
above. If option 2, Decreased log cost only, was
The ESTIMATED INCREASED REVENUE RESULTS
screen also gives you the option of accepting or
selected, values will be required only for items 1, 4,
rejecting the value of the net estimated increased rev-
and 5 above. If option 3, Both increased lumber
production and decreased log cost, was selected,
enue. To accept the value, select Yes from the designated prompt. To reject the value, select No. If No is
values for all five items must be entered.
For this tutorial, enter the data shown in
selected, ECHO will give you the option to either
recompute the estimated increased revenue or to
Figure 14. Press Next and ECHO will advance to the
enter your own estimated increased revenue value.
ESTIMATED INCREASED REVENUE RESULTS
screen.
For this tutorial, select Yes. Press Next and ECHO
will advance to the CAPITAL COSTS screens.
11.14 ESTIMATED INCREASED REVENUE
RESULTS. The ESTIMATED INCREASED REV-
11.15 CAPITAL COSTS. ECHO contains two
CAPITAL COSTS screens (Figure 16 and Figure 17)
ENUE RESULTS screen (Figure 15) displays five
numerical values that summarize the estimated
increased revenue results:
that prompt you to enter various estimated increased
capital costs resulting from equipment replacement.
The first CAPITAL COSTS screen (Figure 16)
prompts you to enter values for:
ECHO - LUMBER PRODUCTION DATA
Current annual lumber production
(MBF) --------------------------------------------->
ECHO - ESTIMATED INCREASED
REVENUE RESULTS
Total revenue from lumber sales -----------> $5,550,000
10000
Conversion efficiency improvement---------> 4.59%
Combined current revenue from 4/4 and
5/4 lumber sales ($/MBF) -------------------->
555
Reduced overhead on increased production
($/MBF) ------------------------------------------>
0
Current log cost
($/MBF) ------------------------------------------>
------
Current annual log volume purchased
(MBF) --------------------------------------------->
------
Use this value for estimated
increased revenue?
Previous
Help
Previous
Next
Exit
Estimated increased revenue from
increased lumber production----------------> $254,745
Estimated decreased cost as a result
of log purchase reduction --------------------> $0
Net estimated increased revenue -----------> $254,745
Figure 14. LUMBER PRODUCTION DATA
screen
Next
(
z
) Yes
Exit
Figure 15. ESTIMATED INCREASED
REVENUE RESULTS screen
10
(
) No
Help
Note:
1. Initial sawing machine cost
A value of zero (0) should be entered for
any capital cost that will not be incurred in
your equipment replacement scheme.
2. Initial saw blade cost
3. Saw installation cost
4. Saw brake cost
5. Debarker cost
11.16 VARIABLE COSTS. ECHO contains
two VARIABLE COSTS screens (Figure 18 and
For this tutorial, enter the data shown in Figure 16.
Press Next and ECHO will advance to the second
Figure 19) that prompt you to enter various estimated
increased variable costs resulting from equipment
CAPITAL COSTS screen.
replacement. The first VARIABLE COSTS screen
(Figure 18) prompts you to enter values for:
The second CAPITAL COSTS screen (Figure
17) prompts you to enter values for:
1. Increase in annual filing room wages
2. Increase in annual sawyer wages
1. Filing room building cost
2. Total additional filing room equipment
cost
3. Cost of additional buildings
For these cost inputs, only the increase in annual
4. Additional equipment cost
entered, not the total amount of annual wages. For
this tutorial, enter the data shown in Figure 18. Press
wages resulting from the investment should be
The third cost input should include, if applicable, the
construction costs for a pit to house the band headrig.
The fourth cost input should include any additional
Next and ECHO will advance to the second VARIABLE COSTS screen.
The second VARIABLE COSTS screen
equipment costs other than filing room equipment
costs. For this tutorial, enter the data shown in Figure
17. Press Next and ECHO will advance to the VARIABLE COSTS screens.
(Figure 19) prompts you to enter values for:
1. Annual saw blade replacement cost
2. Annual grinding wheels and grinding
ECHO - CAPITAL COSTS
ECHO - CAPITAL COSTS
Filing room building cost--------------------->$ 40000
Initial sawing machine cost ----------------->$ 120000
Total additional filing room equipment
cost ---------------------------------------------->$ 25000
Initial saw blade cost ------------------------->$ 5000
Cost of additional buildings as a result of
the investment (including construction costs
for a pit to house the band headrig) ------->$ 30000
Saw installation cost ------------------------->$ 15000
Saw brake cost -------------------------------->$ 5000
Debarker cost ---------------------------------->$ 35000
Additional equipment (other than filing room
equipment) cost as a result of the
investment -------------------------------------->$ 7000
Previous
Previous
Next
Exit
Help
Figure 16. First CAPITAL COSTS screen
Next
Exit
Help
Figure 17. Second CAPITAL COSTS screen
11
ECHO - VARIABLE COSTS
ECHO - VARIABLE COSTS
For the two lines below, enter only the amount of the
increase in annual wages.
Increase in annual filing room wages ----->$ 39000
Increase in annual sawyer wages---------->$ 0
Previous
Next
Exit
Help
Annual saw blade replacement cost-------->$
5000
Annual grinding wheels and grinding room
maintenance cost------------------------------>$
2000
Annual cost to resurface wheels ------------>$
1000
Other increased annual costs --------------->$
0
Previous
Next
Exit
Help
Figure 19. Second VARIABLE COSTS screen
Figure 18. First VARIABLE COSTS screen
room maintenance cost
3. Annual cost to resurface wheels
4. Other increased annual costs
Recovery System (MACRS) depreciation method. If
the straight-line method is used, the amortization will
take place over a 10-year period; buildings will be
For this tutorial, enter the data shown in Figure 19.
Press Next and ECHO will advance to the INVESTMENT RATES screen.
depreciated, however, over a 39-year period. For this
tutorial, select the straight-line method. Press Next
and ECHO will advance to the CASH FLOW ANALYSIS RESULTS screen.
Note:
A value of zero (0) should be entered for
any variable cost that will not be incurred in
your equipment replacement scheme.
11.18 CASH FLOW ANALYSIS RESULTS.
The CASH FLOW ANALYSIS RESULTS screen
(Figure 21) displays the results of a discounted cash
flow analysis calculated from the input data. Values
displayed in tabular form are:
11.17 INVESTMENT RATES. The INVESTMENT RATES screen (Figure 20) prompts you to
enter percentage rates for the following:
1.
2.
3.
4.
1.
2.
3.
4.
5.
Corporate tax rate
Alternative investment rate
Property tax rate
Insurance rate
Amortization year
Net cash flow
After-tax profit
After-tax cash flow
After-tax present worth
The total net cash flow and the total after-tax cash
flow are also displayed. After viewing the results,
select Next and ECHO will advance to the ANALYSIS
SUMMARY screen.
This screen also prompts you to select the method of
depreciation that will be used in the cash flow analysis. You may select either the Straight-line depreciation method or the Modified Accelerated Cost
12
1. Initial investment
2. Payback period
3. Internal rate of return
ECHO - INVESTMENT RATES
4. Present net worth
Years -------------------------------------------> $
10
Corporate tax rate [%] -----------------------> $
28
Alternative investment rate [%] ------------> $
12.5
data to a text file. You can save the data by selecting
the Save button. For this tutorial, select the Save but-
Property tax rate [%]-------------------------> $
3
ton. ECHO will then bring up the SAVE dialog box.
Insurance rate [%] ---------------------------> $
1
Method of depreciation
( z ) Straight-line method
(
This screen allows you to save the input and output
11.20 SAVE. The SAVE dialog box (Figure
23) allows you to save the input data or analysis
results to a text file. To save the data from the SAVE
) MACRS method
dialog box, follow these steps:
Previous
Next
Exit
Help
1. Select either Input Data or Analysis
Results from the Data option box.
2. Type the file name in the File name
Figure 20. INVESTMENT RATES screen
textbox. There is no need to specify an
extension for your file name; ECHO will
automatically attach an extension to the
11.19 ANALYSIS SUMMARY. The ANALYSIS SUMMARY screen (Figure 22) displays four values that summarize the sawmill's investment. The
file name that you enter (see Section 7
for an explanation of file extensions
used by ECHO).
3. Select the Save command button.
values displayed are:
ECHO - ANALYSIS SUMMARY
ECHO - CASH FLOW ANALYSIS
RESULTS
Year
0
1
2
3
4
5
6
7
8
9
10
Total
Net Cash Flow
$ -282,000
$ 202,825
$ 202,825
$ 202,825
$ 202,825
$ 202,825
$ 202,825
$ 202,825
$ 202,825
$ 202,825
$ 202,825
$1,746,250
Previous
After-Tax
Profit
$
0
$152,473
$152,473
$152,473
$152,473
$152,473
$152,473
$152,473
$152,473
$152,473
$152,473
Next
After-Tax
Cash Flow
$ -282,000
$ -129,527
$
22,945
$ 175,418
$ 327,890
$ 480,363
$ 632,835
$ 785,308
$ 937,781
$1,090,253
$1,242,726
$1,242,726
Exit
After-Tax
Present Worth
$ -282,000
$ 135,531
$ 120,472
$ 107,086
$ 95,188
$ 84,611
$ 75,210
$ 66,853
$ 59,425
$ 52,823
$ 46,953
Initial investment ---------------------------->
$282,000
Payback period ------------------------------->
1.85 years
Internal rate of return ----------------------->
53.3%
Present net worth ---------------------------->
$562,154
Previous
Help
Save
Exit
Figure 22. ANALYSIS SUMMARY screen
Figure 21. CASH FLOW ANALYSIS RESULTS
screen
13
Help
SAVE
Data
( ) Input Data
(z) Analysis Results
File name:
Save
TUTORIAL.OUT
Cancel
Help
Figure 23. SAVE dialog box
If you choose to save the input data, all input data
entered in the ECHO program will be saved to the
specified file. If you choose to save the analysis
results, the data displayed in the CASH FLOW
ANALYSIS RESULTS screen (Section 11.18) and the
ANALYSIS SUMMARY screen (Section 11.19) will be
saved to the specified file. For this tutorial, you are
encouraged to save the input data and the analysis
results.
14
Appendix A
ECHO Data Worksheet
15
I. Conversion Data
Your estimated increased revenue: $ _________________
Variable
Current
New
Valid Range
Headrig kerf (in.)
__________
__________
0.10 - 0.35
Resaw kerf (in.)
__________
__________
0.08 - 0.30
Avg. log diameter (in.)
__________
XXXXX
8 - 24
Avg. log length (ft.)
__________
XXXXX
8 - 18
Rough green size (in.)
4/4 = _____
4/4 = _____
0.75 - 1.25
5/4 = _____
5/4 = _____
1.00 - 1.50
6/4 = _____
6/4 = _____
1.20 - 1.75
7/4 = _____
7/4 = _____
1.50 - 2.00
8/4 = _____
8/4 = _____
1.75 - 2.25
Thickness
Total Production (%)
Valid Range
4/4
_________
0 - 100
5/4
_________
0 - 100
6/4
_________
0 - 100
7/4
_________
0 - 100
8/4
_________
0 - 100
16
Thickness
Percentage Processed* (%)
Valid Range
4/4
_________
0 - 100
5/4
_________
0 - 100
6/4
_________
0 - 100
7/4
_________
0 - 100
8/4
_________
0 - 100
* Percentage Processed at ________Headrig ________Resaw
Percentage of average log volume produced as a center cant that is not subsequently
processed at the resaw (0 - 100%): ____________
Percentage of lumber production employed to reduce log purchases (0 - 100%) : ________
Current annual lumber production (MBF) : ___________
Current revenue from lumber sales ($/MBF): __________
Reduced overhead on increased production ($/MBF): __________
Current log cost ($/MBF): _______________
Current annual log volume purchased (MBF): ___________
II. Capitol Costs Data
Initial sawing machine cost: $ __________
Initial saw blade cost: $ __________
Saw installation cost: $ __________
Saw brake cost: $ __________
Debarker cost: $ _________
17
Filing room building cost: $ _________
Total additional filing room equipment cost: $ _________
Cost of additional buildings: $ _________
Additional equipment cost: $ _________
III. Variable Costs Data
Increase in annual filing room wages: $ _________
Increase in annual sawyer wages: $ _________
Annual saw blade replacement cost: $ _________
Annual grinding wheels and grinding
room maintenance cost: $ _________
Annual cost to resurface wheels: $ _________
Other increased annual costs: $ _________
IV. Investment Rates Data
Corporate tax rate: _______ %
Alternative investment rate: ______ %
Property tax rate: ________ %
Insurance rate: ________ %
MACRS depreciation rates year: ________
18
MACRS depreciation rates:
Year 1: ________
Year 5: _________
Year 2: ________
Year 6: _________
Year 3: ________
Year 7: _________
Year 4: ________
Year 8: _________
19
Literature Cited
1. Microsoft Corporation. 1992. Microsoft® Visual Basic® Programming System for MSDOS®, Version 1.00. Redmond, WA.
`
2. S.H. Bullard and T.J. Straka. 1998. Basic Concepts in Forest Valuation and Investment
Analysis, Ed. 2.1. Preceda, LLC. Auburn, AL.
3. T.D. Brown. 1982. Quality Control in Lumber Manufacturing. Miller Freeman Publications,
San Francisco, CA.
21
Mississippi State University does not discriminate on the basis of race, color, religion, national origin, sex, age, disability or
veteran status.
kbrasher 04/02