1
'CAVLAR' manual
Description and interpretation
BTO (s) 2009.003 (EN)
December 2012
'CAVLAR' manual
Description and interpretation
BTO (s) 2009.003 (EN)
December 2012
Version 1.2
© 2012 KWR
All rights reserved. No part of this book may be reproduced, stored in a database or
retrieval system, or published, in any form or in any way, electronically, mechanically, by
print, photoprint, microfilm or any other means without prior written permission from the
publisher.
Postbus 1072 3430 BB Nieuwegein The Netherlands
P +31 30 606 95 11 F +31 30 606 11 65E [email protected]
Colophon
Title
‘CAVLAR’ manual: description and interpretation
Project number
B11.1631-104
Project manager
drs. P.G.G. Slaats
Client
BTO
Quality controllers
Jan Vreeburg
Authors
Martin Meerkerk, George Mesman and Ilse Pieterse-Quirijns
This report (in Dutch) has been distributed among BTO-participants and is publicly available.
Foreword
Valves are crucial for the continuity of drinking water supply and for the protection of customers against
the results of pipe breaks and contamination events. In the event of these kinds of incidents, and during
regular maintenance activities, the capability of isolating sections of the distribution network is essential
if one is to safeguard the quality and quantity of water supplied by the rest of the network. Another
function of valves is the adjustment of water flows, for instance, for the separation of supply areas, the
creation of different pressure areas and the directing of water flows for cleaning purposes.
The location and reliability of valves, the cost of valves (investment and maintenance) and customerminutes-lost (CML) caused by valves are all therefore issues that dominate discussions about valves.
KWR has developed a method to assess valve configurations, both in qualitative and quantitative terms.
The method allows one to determine the effectiveness of valve location and valve reliability
(maintenance), so that one can make well-founded choices. This methodology has been elaborated in the
‘CAVLAR’ software program, which provides a practical and clear tool for the assessment of valve
configurations.
This ‘CAVLAR’ manual consists of two parts: the first part deals with the objectives and functionalities
of ‘CAVLAR’, and the second part is the user-manual, which describes the configuration of ‘CAVLAR’.
For questions and comments about the ‘CAVLAR’ program, you can contact dr. ir. Ilse Pieterse-Quirijns
at KWR in Nieuwegein – by phone: (+31 (0)30) 60 69 672 or e-mail: [email protected]. Your
questions and/or comments could contribute to the program’s further improvement.
The ‘CAVLAR’ software tool, and accompanying test models and manual, are also available on Watnet2,
under ‘Software en Tools’.
User manual 'CAVLAR'
© KWR
-1-
BTO 2009.003 EN
December 2012
Contents
Foreword
1
Contents
2
1
Introduction
4
1.1
‘CAVLAR’
4
1.2
‘CAVLAR’ manual: reading guide
5
2
Insight and analysis of sections (and valves)
7
2.1
Introduction
7
2.2
‘CAVLAR’ preparation and start
7
2.3
2.3.1
2.3.2
2.3.2.1
2.3.2.2
2.3.3
2.3.4
Loading a file
Excel file
Aleid model
Importing an Aleid model and dividing into sections
Indicating feed sections
Importing a file other than Excel or Aleid
Opening an ADF file
7
7
7
7
8
8
8
2.4
2.4.1
2.4.2
Entering settings
Settings via Options-Settings
Settings via Filter and Global adjustment
8
8
9
2.5
2.5.1
2.5.2
2.5.3
2.5.4
2.5.5
Results: the distribution network configuration
Number of valves per section
Number of connections per section
Length per section
Volume per section
Section diagram
9
9
10
11
11
12
3
Determining the critical sections
13
3.1
Introduction
13
3.2
Starting the calculation of critical sections
13
3.3
Status report
13
3.4
3.4.1
3.4.2
Results: critical sections
Advice
Criticality of sections
14
14
14
4
Determining the critical valves
16
4.1
Introduction
16
4.2
Starting the calculation of critical valves
16
4.3
Status report
17
4.4
4.4.1
4.4.2
Results: critical valves
Determining the critical valves
Calculating the effect of maintenance of valves
17
17
18
User manual 'CAVLAR'
© KWR
-2-
BTO 2009.003 EN
December 2012
4.4.3
Calculating the effect of removing valves
18
5
Starting the program
20
5.1
Introduction
20
5.2
‘Help’ in the main menu
20
5.3
‘Windows’ in the main menu
21
6
‘File’ in the main menu
22
6.1
Introduction
22
6.2
New
22
6.3
Open
23
6.4
Save
23
6.5
Save As
23
6.6
6.6.1
6.6.2
Import
Excel file (format I)
Aleid model
23
24
25
6.7
Export
27
6.8
End
27
6.9
6.9.1
6.9.1.1
6.9.1.2
6.9.1.3
6.9.1.4
6.9.2
6.9.3
6.9.4
6.9.5
Tabs in the main screen
The ‘Input’ tab
The section part of the ‘Input’ tab
The valve part of the ‘Input’ tab
Status bar at the bottom of ‘Input’ tab
Notification of incorrect input for sections or valves in the ‘Input’ tab
The ‘Output’ tab
The ‘Advice’ tab
The ‘Section diagram’ tab
The ‘Graphs’ tab
27
28
28
31
34
35
35
36
37
38
6.10
Copying ‘CAVLAR’ data and results
39
7
‘Options’ in the main menu
41
7.1
Introduction
41
7.2
7.2.1
7.2.2
General
Calculation settings
Language
41
41
42
7.3
Section size and section isolation
42
7.4
Section diagram
43
7.5
CFG file
44
8
Bibliography
45
I
Glossary
46
II
‘CAVLAR’ calculation method
49
III
Example of an Excel file, Aleid model and ‘CAVLAR’ file
54
User manual 'CAVLAR'
© KWR
-3-
BTO 2009.003 EN
December 2012
1
Introduction
1.1
‘CAVLAR’
Valves are crucial for the continuity of drinking water supply and for the protection of customers against
the results of pipe breaks and contamination events. In the event of these kinds of incidents, and during
regular maintenance activities, the capability of isolating sections of the distribution network is essential
if one is to safeguard the quality and quantity of water supplied by the rest of the network. Another
function of valves is the adjustment of water flows, for instance, for the separation of supply areas, the
creation of different pressure areas and the directing of water flows for cleaning purposes.
In older networks – where most incidents occur – the reliability of valves is often relatively low. A
valve’s reliability depends on the number of times it has functioned well when inspected. For a valve to
‘function well’ it has to be able to be found, identified, accessed, operated and closed. If any one of these
criteria is not met, the valve fails as a whole. The reliability of valves in the Netherlands ranges from 70%
to 98%. When distribution network sections are isolated in the event of an incident, is it therefore
possible that valves will fail, so that adjacent sections will also be affected by the incident.
A method has been developed within BTO for the analysis of the effect of valve reliability and location
on the continuity of supply to customers. The ‘criticality’1 of valves is determined by expressing their
functioning during a pipe break in terms of performance indicators, such as ‘impact’ and ‘CML’.
‘CAVLAR’ (Criticality Analysis Valve Locations And Reliability) is the corresponding software tool. It
calculates the performance indicators of Impact, Ratio, ‘CML’ and ‘CI’ for a supply area. The software
simulates the isolation of a section and the functioning of the valves in the isolation procedure. If a valve
fails, the section affected cannot be isolated and the adjacent section will also be affected. By
incorporating each section into the calculation, ‘CAVLAR’ can determine which sections, valves and
factors – like valve reliability and pipe failure probability – are critical in a valve configuration.
A complete calculation operation of the ‘CAVLAR’ tool provides the following results for the
distribution network concerned:
• insight and analysis regarding the section configuration;
• the critical sections and advice on section division;
• the critical valves.
During the past few years a number of different versions of ‘CAVLAR’ have been developed. This
document deals with version 2.14 of the program. More background information on ‘CAVLAR’ is
provided in Trietsch and Schaap (2006) and in Rosenthal et al. (2001). A glossary of terms is presented in
Annex I. The method of calculation employed is presented for information purposes in Annex II.
1
A glossary of terms is presented in Annex I.
User manual 'CAVLAR'
© KWR
-4-
BTO 2009.003 EN
December 2012
1.2
‘CAVLAR’ manual: reading guide
This ‘CAVLAR’ manual is divided into two parts:
part I: ‘CAVLAR’ functionality
Part I describes how ‘CAVLAR’ can be implemented for different purposes:
• insight into the section configuration in chapter 2;
• determination of the critical sections in chapter 3;
• determination of critical valves in chapter 4.
part II: ‘CAVLAR’ user-manual
Part II is made up of chapters 5, 6 and 7, which provide a description of the program’s
configuration. In part I, reference is frequently made to the user-manual.
The description and application of ‘CAVLAR’ can be followed with the test models, which are supplied
with the ‘CAVLAR’ software: testmodelCAVLAR.xls, testmodelCAVLAR.pro and
testmodelCAVLAR.adf (Annex III).
User manual 'CAVLAR'
© KWR
-5-
BTO 2009.003 EN
December 2012
Part I:
‘CAVLAR’ functionality
User manual 'CAVLAR'
© KWR
-6-
BTO 2009.003 EN
December 2012
2
Insight and analysis of sections (and
valves)
2.1
Introduction
Immediately after a model of the distribution network is loaded, without conducting any calculation,
‘CAVLAR’ produces an analysis of the configuration of the sections within the distribution network
concerned. This analysis offers insight into particular sections – such as sections that are isolated by a
single valve, or those that are isolated by more than ten valves. It also shows whether the sections comply
with the conditions/guidelines, or standards, of the drinking water company – for example, minimum
and maximum number of connections per section and a section’s pipe length.
This chapter focuses on the insight and the analysis regarding the configuration of the sections which is
produced when a model is loaded. This is in fact required by the chapters that follow, in which the
determination of the critical sections (chapter 3) and of the critical valves (chapter 4) are discussed.
2.2
‘CAVLAR’ preparation and start
The execution of a processing operation with ‘CAVLAR’ requires a sufficiently fast PC in which the
program is installed.
Before the execution of an entirely new operation of the program, a file (outside ‘CAVLAR’) has to be
prepared for use by the program. The formats that are suitable for ‘CAVLAR’ are an Excel file or an
Aleid model. The requirements that the files must satisfy, in terms of configuration and desirable
information, are described in § 6.6. Examples are presented in the ‘test model CAVLAR.xls’ and
‘testmodel CAVLAR.pro’ files presented in Annex III.
‘CAVLAR’ is started by double-clicking on its icon on the desktop. The main menu then appears at the
top of the screen on a grey background. The distribution network data can then be loaded as a model.
2.3
Loading a file
Loading an Excel file or an Aleid model (see § 6.6.1 and § 6.6.2).
2.3.1 Excel file
An Excel file is imported by clicking File and Import. In the dialog box that appears, a file with an XLS
extension is selected and then Open is clicked. In the event that the Excel file contains many worksheets,
the message ‘Select a sheet’ appears in the dialog box. The desired sheet must be indicated. If necessary,
the ‘Names of its XY Coordinates’ box has to be checked in the same dialog box (see § 6.6.1).
2.3.2 Aleid model
2.3.2.1
Importing an Aleid model and dividing into sections
An Aleid model is imported by clicking File and Import. In the dialog box that appears, a file with a
PRO extension is selected and then Open is clicked. A little while after Open is clicked, the ‘Divide into
sections’ dialog box appears. When ‘Start’ is clicked, a wizard is started for the division of the network
into sections. A screen then appears in this dialog box with the following selection options:
User manual 'CAVLAR'
© KWR
-7-
BTO 2009.003 EN
December 2012
• # Connections per meter;
• # Connections per m3/h;
• None.
For more information, see § 6.6.2.
The division is started by clicking ‘Next’. This can take a few minutes depending on the size of a
network. The session is then concluded by clicking ‘Finished’. The ‘Overview’ dialog box then appears
with the ‘Input’ tab. The distribution network is then divided into sections and, if possible, the number
of connections per section is determined.
It is possible to enter changes to the imported data manually. For this, the ‘Filter’ and ‘Global
adjustment’ options need to be selected, as described in § 6.9.1.1 and § 6.9.1.2.
2.3.2.2
Indicating feed sections
The feed sections have to be checked in the ‘Input’ tab. Feed sections are those sections through which
the distribution network is fed, or supplied with water. For an entire supply area, these are the outgoing
sections from a pump station; for a city, they are the transport pipes that feed the city; and for a
neighbourhood, they are the main pipes that feed the neighbourhood.
Because in ‘CAVLAR’ only the section names and valve names are known, the feed sections must be
identified by entering this information. The procedure is the following:
• Step 1
Determine which valves in the network constitute the boundary of the feed section.
• Step 2
Look for these valves in the valve part of the ‘CAVLAR’ input tab.
• Step 3
The section name, which is shown for each valve, is the name of the feed section as recognised in
‘CAVLAR’. If a single valve is on the boundary of a feed node, then the name of the feed section
in ‘CAVLAR’ is the same as the name of the first node located in this section.
• Step 4
Check the feed section in column ‘F’.
2.3.3 Importing a file other than Excel or Aleid
It is possible to add an import or export functionality to ‘CAVLAR’. For this, one must contact KWR in
Nieuwegein.
2.3.4 Opening an ADF file
Models (XLS or PRO) that were earlier loaded into ‘CAVLAR’ and saved as ‘CAVLAR file’ via the ‘Save’
(§ 6.4) and ‘Save As’ (§ 6.5) options, can, for subsequent calculations, be opened in ‘CAVLAR’ via: File –
Open.
2.4
Entering settings
Data related to the situation, such as the characteristics of the network and the operational management,
and which are required for the calculation, can be entered in the following two ways.
2.4.1 Settings via Options-Settings
The different data can be entered via Options and Settings and by using the six tabs in the ‘Program
Settings’ dialog box (for details, see chapter 7):
• General (§ 7.2):
o Shut down Windows automatically after calculation (§ 7.2.1);
o Language (§ 7.2.1);
• Section size and section isolation (§ 7.3), in which all choices are company-dependent:
o Minimum standard section size;
o Maximum standard section size;
o Duration of supply interruption in a section per number of connections;
o Duration of supply interruption in a section per diameter (default calculation setting);
User manual 'CAVLAR'
© KWR
-8-
BTO 2009.003 EN
December 2012
•
•
Section diagram:
The number for the connections is entered in the column with the fields, and the corresponding
color is selected in the column with the buttons (§ 7.4);
CFG file:
By clicking ‘Save’ or ‘Save As’, the file and the location where all the settings are to be saved is
determined (§ 7.5).
2.4.2 Settings via Filter and Global adjustment
For the simultaneous selection and adjustment of input data, the ‘Filter’ and ‘Global adjustment’ options
can be used. In this way, the information on the sections, such as failure probability, can be changed (see
§ 6.9.1.1), as can the information on the valves, such as reliability (see § 6.9.1.2).
Before the filter information can be entered, the filter must be turned on:
• The ‘Filter’ box is checked, which makes the filter’s input fields accessible;
• In the first input field, the parameter to which the filter is to be applied is selected;
• In the second and third input fields, the items that the parameters must satisfy are selected;
button.
• Lastly, the filter is executed by clicking on the
In order to turn off the filter and to have all the information be shown, the ‘Filter’ box has to be
unchecked.
The information in the ‘Input’ tab can be adjusted in bulk via ‘Global adjustment’. For this, the filter
must first be applied to select the sections or valves to be adjusted. Then a ‘Global adjustment’ is applied
as follows:
• The ‘Global adjustment’ option is checked, which makes the filter’s input fields accessible;
• In the first input field, the parameter to which an adjustment is to be applied is selected;
• In the second input field, the items that the parameters must satisfy are selected;
button.
• Lastly, the Global adjustment is executed by clicking on the
In order to turn off the filter and to have all the information be shown, the ‘Global adjustment’ box has to
be unchecked
2.5
Results: the distribution network configuration
After the loading of a file or model, the configuration of the network, in sections, is presented in the form
of the section diagram (‘Section diagram’ tab, § 6.9.4) and in four charts (‘Graphs’ tab, § 6.9.5).
The four charts provide a good overview of the configuration of the distribution network with regard to
the valves and section size, and can be easily used to quickly analyse the configuration in a specific
design/model. They also offer the possibility of comparing one design against another for the same
supply area – for example, to answer the question as to which is better/worse in terms of meeting the
requirements concerning the size (# connections) or length of a section.
2.5.1 Number of valves per section
The chart below (Figure 1) shows the number of sections that contain a specific number of valves. So, for
example, it shows that there are 16 sections with an average of 2 valves/section.
User manual 'CAVLAR'
© KWR
-9-
BTO 2009.003 EN
December 2012
25
Number of sections
20
15
10
5
0
0
1
2
3
4
5
6
7
8
9
10
Number of valves per section
Figure 1 An example of a chart showing the number of sections against the number of valves per section.
The chart provides direct insight into the configuration of the sections:
• Sections with 1 valve (= shut-down of branches) are dependent sections (see Annex I). A large
number of sections with 1 valve means that there are many branches/dependent sections in the
network.
• Avoid sections with a large number of valves: the larger the number of valves per section, the
smaller the chance of a successful shut-down of the section.
2.5.2 Number of connections per section
Drinking water companies frequently set down requirements regarding the number of connections in a
single section (= company standard). The company standard is entered in Options-Settings and the
‘Section size and section isolation’ tab (§ 7.3). The default settings are: a minimum section size of 50
connections and a maximum section size of 200 connections. Figure 2 shows a chart which plots the
number of connections per section against the number of sections. This chart allows one to quickly
determine how many sections meet the requirements concerning minimum and maximum section size.
160
Connections per section
140
120
100
80
60
40
20
0
0
10
20
30
40
50
60
Number of sections
Figure 2 An example of a chart showing the number of connections per section against the cumulative number
of sections.
User manual 'CAVLAR'
© KWR
- 10 -
BTO 2009.003 EN
December 2012
2.5.3 Length per section
Some drinking water companies also have a standard for the (maximum) length of a section. Figure 3
shows the length of a section in meters plotted against the number of sections.
Length per section (m)
2000
1500
1000
500
0
0
10
20
30
40
50
60
Number of sections
Figure 3 An example of a chart showing the pipe length per section against the cumulative number of sections.
2.5.4 Volume per section
Some drinking water companies work with a maximum volume per section. Since a section has to able to
be drained within a manageable period of time, using a standard pump, this volume cannot be too large.
The volume of a section is determined by the length and the diameter of the pipes in the section. Figure 4
shows the volume in m3 for a section as a function of the number of sections.
1000
Volume per section (m3)
100
10
1
0.1
0.01
0.001
0.0001
0
10
20
30
40
50
60
Number of sections
Figure 4 An example of a chart showing the volume per section against the cumulative number of sections.
User manual 'CAVLAR'
© KWR
- 11 -
BTO 2009.003 EN
December 2012
2.5.5 Section diagram
A section diagram (see Figure 5) presents the sections as nodes, and the valves as connecting lines
between the nodes (sections). The number of connections in a section is indicated by a color.
A section diagram provides insight into the valve configuration:
• by revealing the sections with too few, or too many, connections;
• by revealing connecting sections (see Annex I);
• by locating the dependent sections (see Annex I);
• by locating the sections with (too) many valves.
Figure 5 Example of a section diagram.
Figure 5 shows a section diagram. This diagram shows that the configuration has a number of dependent
sections. These are the sections that can be isolated with one valve. In the diagram they appear as nodes
that are connected by a single line with the rest, or that are fed from a single side.
The indicators in the section diagram can be ‘blown up’ using the scroll bar 3, as shown in Figure 27.
The sections in the section diagram can be moved as follows:
• Click on the ‘Section locked’ button, which changes the button into a ‘Section free’ icon;
• Place the cursor above the section to be moved and the cursor will change into a ‘crossed arrows’
cursor;
• Click on the section and move (drag) it to the desired location.
User manual 'CAVLAR'
© KWR
- 12 -
BTO 2009.003 EN
December 2012
3
Determining the critical sections
3.1
Introduction
With the help of ‘CAVLAR’ it is possible to determine which sections contribute the most to ‘CML’. The
sections can be compared with each other by calculating the performance indicators for different valve
reliabilities. This chapter describes the procedure for calculating the criticality of the sections with
‘CAVLAR’.
3.2
Starting the calculation of critical sections
After the loading of a model or file, and the entering the right settings concerning the failure probability
of a pipe and the reliability of the valves, as described in chapter 2, the calculation of the sections can
proceed. This calculation is started by clicking on the ‘Start’ button, located bottom-right in the ‘Input’
tab in the main screen (§ 6.9.1). The ‘Calculate critical valves’ option should not at this point be checked.
3.3
Status report
During the calculation, the status of the ongoing process is presented in the ‘Status Calculation’ dialog
box (see Figure 6).
Figure 6 The ongoing ‘status report’ during the calculation by ‘CAVLAR’.
In the top part of the dialog box, the following successive steps appear, in this order:
• ‘Initializing calculation’;
• ‘Calculating valve impact’;
• ‘Calculating section impact’;
• ‘Calculating CML’;
• ‘Show results’.
While a step is still underway, this is indicated by a small green triangle which appears (to the left of the
text) in the ‘Calculation status’ dialog box. The steps that have already been completed are indicated
with a red check mark.
User manual 'CAVLAR'
© KWR
- 13 -
BTO 2009.003 EN
December 2012
In the middle of the dialog box, in the field below ‘Section’, the number of the section that is the object of
the calculation at that moment is shown (this changes continuously during the course of a calculation
series). The ‘Time remaining’ until the completion of the process is also shown (this also changes
continuously). The small ‘Progress’ scroll indicates that the program is operating and how long the
calculation will still last.
At the bottom of the dialog box the ‘Stop calculation’ button is available to stop the calculation at any
time. If this button is clicked, a dialog box appears with the question: ‘Do you want to stop the
calculation?’. This is confirmed by clicking ‘Yes’. By clicking ‘No’ the calculation will resume.
3.4
Results: critical sections
3.4.1 Advice
The ‘Advice’ tab in the main screen indicates, on the basis of the previously entered company standards
per category and per section, whether a section is too small/large, or whether the impact of a section is
too large. It also provides an indication of possible solutions. The code ‘A’ stands for the Number of
connections per section; ‘I’ is the Impact per section. In § 6.9.3 the different categories and types of
advice are discussed in detail. In the determination of interesting (or critical) sections, it is primarily the
A <50 and I > 200 category that is important. This is the category that includes small sections (with less
than 50 connections) and that, in the event an incident occurs in it, will affect a larger area. By searching
for the relevant sections in the section diagram (and, as the case may be, in the Aleid model), it often
becomes clear why these sections have such a big impact. These sections can, for example, be adjacent to
dependent sections, so that an incident can easily spread. A different structuring of the sections could
thus bring about improvements.
Another important category is A > 200 and I > 200. This category contains sections with too many
connections and thus also has a big impact.
3.4.2 Criticality of sections
After a calculation has been completed on a file or model, the performance indicators for each section are
determined. These are presented in the ‘Output’ tab of the main screen (see Figure 7):
• Impact;
• Ratio;
• ‘CML’ per section (recommended);
• ‘CI’.
The critical sections can be determined on the basis of a performance indicator. In general, the ‘CML’ is
used as the criterion. The section with the largest ‘CML’ is therefore the most critical section. This section
is easily identified by clicking the heading/title of the column, which then shows an ordering of the
sections according to descending ‘CML’ values. The ‘∇’ symbol appears next to the term ‘CML’2.
Another possibility is to copy the calculation results to Excel (see § 6.10). The ‘CML’ format has to be
changed in Excel via Format cells - custom – [h]:mm:ss. Using the sort option in Excel, the sections can
then be ordered according to descending ‘CML’ values.
At times, following operations of more than than 100 hours, the sorting process within ‘CAVLAR’ no
longer operates properly. By copying the calculation results to Excel, the ‘CLMs’ can however be sorted.
2
User manual 'CAVLAR'
© KWR
- 14 -
BTO 2009.003 EN
December 2012
Figure 7 An example of the ‘Output’ tab after the completion of the section calculation.
User manual 'CAVLAR'
© KWR
- 15 -
BTO 2009.003 EN
December 2012
4
Determining the critical valves
4.1
Introduction
‘CAVLAR’ is a valve tool which allows for the determination of the critical valves within (part of) a
drinking water company’s supply area. This chapter describes how the critical valves for maintenance
and management are determined. It also shows how the effect of improvement measures – such as valve
maintenance or the removal of valves – is calculated.
4.2
Starting the calculation of critical valves
After the loading of the model and the entering of the right settings concerning the failure probability of
a pipe and the reliability of the valves, as described in chapter 2, the critical valves can be determined. To
do so, the ‘Calculate critical valves’ option in the ‘Input’ tab of the main screen has to be checked. The
calculation is started by clicking on the ‘Start’ button (§ 6.9.1.1).
During the calculation process the reliability of an individual valve is temporarily set on ‘failure’
(reliability = 0%) and the calculation is rerun for all sections. The average impact and average ‘CML’
caused by the disconnection of the valve is signaled in the valve part of the ‘Output’ tab next to the valve
concerned. The valve is then reset to its original reliability level and the next valve is disconnected; this
process is conducted until the calculation has been run in this way for all the valves. The average impact
is calculated by dividing the total impact by the number of sections. The average ‘CML’ is calculated by
dividing the total ‘CML’ by the total number of connections. On the basis of this calculation a
determination is made of which valve has the greatest influence on the average ‘CML’ of the distribution
network, and therefore of which valve is most critical.
The calculation of the criticality of the valves in a distribution network can take a very long time. This is
because the entire criticality calculation has to be rerun per section for each valve. If the calculation time
is too long, there is the possibility of making a rough estimate of the criticality per valve on the basis of
the criticality per section. This is done by calculating the criticality per section using three separate
(general) valve reliabilities, namely:
• High (for example, P = 95%);
• Average (for example, P = 90% or 80%);
• Low3 (for example, P = 50%).
On the basis of the results of the three calculations, a determination is made of which sections are most
affected (= difference in ‘CML’) by reducing the valve reliability. These sections apparently are located in
an area containing many large sections. It can be concluded that the valves in this area are the most
critical.
Tip
When the calculation time is very long, it is recommended that the computer run the calculation after
office hours or on weekends and to have Windows shut down automatically.
3
If an excessively low reliability is chosen, the calculation time can increase (too much).
User manual 'CAVLAR'
© KWR
- 16 -
BTO 2009.003 EN
December 2012
4.3
Status report
During the calculation, the status of each calculation process is presented in the ‘Calculation status’
dialog box (see Figure 8).
Figure 8 Status of process in the calculation of the critical valves.
4.4
Results: critical valves
4.4.1 Determining the critical valves
The results of a calculation series for valves are shown in the ‘Output’ tab (right-hand side) as in Figure
9. Generally, the ‘CML’ is the criterion used in selecting the ‘critical valves’. The valves that contribute
most to the total ‘CML’ are qualified as critical.
User manual 'CAVLAR'
© KWR
- 17 -
BTO 2009.003 EN
December 2012
Figure 9 An example of the ‘Output’ tab after the completion of the valve calculation.
The critical valves are easily determined by clicking on the heading/title of the column, which then
ordered according to descending ‘CML’ values. The ‘∇’symbol appears next to the term ‘CML’4. Another
possibility is to copy the calculation results to Excel (see § 6.10). The ‘CML’ format has to be changed in
Excel via Format cells - custom – [h]:mm:ss. Using the sort option in Excel, the valves can then be sorted
according to descending ‘CML’ values.
4.4.2 Calculating the effect of maintenance of valves
The effect of carrying out maintenance on (critical) valves is calculated by raising the reliability of the
valves concerned in the valve part of the ‘Input’ tab. Once the reliability is raised, the calculation for the
sections is started by clicking ‘Start’. The ‘Calculate critical valves’ option should not at this point be
checked. By comparing the new average ‘CML’ with the ‘CML’ prior to the maintenance, the effect of the
maintenance can be determined. By multiplying the difference between the average ‘CMLs’ by the total
number of connections, one calculates the total decrease in ‘CML’ which results from carrying out
maintenance on the valves.
4.4.3 Calculating the effect of removing valves
The effect of the removal of (the least critical) valves is calculated by setting the reliability of the valves
concerned in the valve part of the ‘Output’ tab at 0. Once the valves are removed, the calculation for the
sections is started by clicking ‘Start’. The ‘Calculate critical valves’ option should not at this point be
checked. By comparing the new average ‘CML’ with the ‘CML’ prior to the removal of the valves, the
effect of the removal can be determined. By multiplying the difference between the average ‘CMLs’ by
the total number of connections, one calculates the total increase in ‘CML’ which results from the
removal of the valves. In this way, the question is answered as to whether specific valves can be
removed without having an appreciable effect on ‘CML’.
At times, following operations of more than than 100 hours, the sorting process within ‘CAVLAR’ no
longer operates properly. By copying the calculation results to Excel, the ‘CLMs’ can however be sorted
4
User manual 'CAVLAR'
© KWR
- 18 -
BTO 2009.003 EN
December 2012
part II: ‘CAVLAR’ user-manual
User manual 'CAVLAR'
© KWR
- 19 -
BTO 2009.003 EN
December 2012
5
Starting the program
5.1
Introduction
‘CAVLAR’ is started by double-clicking on the corresponding icon on the desktop. A grey background
appears with the main menu (top) with four alternatives (see Figure 10), in the following order:
• File;
• Options;
• Windows,
• Help.
Figure 10‘CAVLAR’ opening screen.
The File and Options alternatives in the main menu are dealt with separately in chapters 6 and 7. The
paragraphs below present a brief explanation of the two last alternatives: Windows and Help.
5.2
‘Help’ in the main menu
By clicking Help, the following three alternatives appear:
• Contents;
• Search;
• About CAVLAR.
Contents presents the complete help function with all its possibilities. Because the help function is quite
typical, this manual does not deal with it further.
A Search is conducted using a keyword.
About CAVLAR presents the version number of the ‘CAVLAR’ program being used (for example 2.14).
User manual 'CAVLAR'
© KWR
- 20 -
BTO 2009.003 EN
December 2012
5.3
‘Windows’ in the main menu
By clicking Windows, the following three alternatives appear:
• Horizontal;
• Vertical;
• Sort.
These are standard options in Windows programs, and offer the possibility of working on different files
using several ‘windows’.
Below Sort there is a solid (horizontal) strip, under which appear the names of the open files.
User manual 'CAVLAR'
© KWR
- 21 -
BTO 2009.003 EN
December 2012
6
‘File’ in the main menu
6.1
Introduction
By clicking File in the main menu, the following seven alternatives appear:
• New;
• Open;
• Save;
• Save As;
• Import;
• Export;
• End.
These seven alternatives are discussed in the next paragraphs. Then, a description is given of the tabs of
the main menu when a model is loaded in ‘CAVLAR’. The chapter concludes with a description of the
possibility of copying data and charts to other programs.
To begin with, it should be noted that ‘CAVLAR’ makes standard use of two types of files:
• A ‘CAVLAR’ model, or an ‘Valve (=Afsluiter) Data File’ (extension ADF), which contains the
model with the calculation results (section and valve data; input and output data) (see § 6.4).
This is created when a valve configuration is entered.
• A configuration file (CFG extension), the contents of which include the calculation settings (see §
7.5). This is created automatically.
Both files are required for the conduct of a calculation.
6.2
New
By clicking File and New, the ‘Overview’ dialog box appears (see Figure 11). Here, the information on
the supply area can be entered manually: on the left-hand side the section information, and on the righthand side the valve information. For information on the meaning of the different columns refer to § 6.9.1.
When the last row is filled in, the next row appears automatically.
Figure 11 File-New dialog box ‘Overview’.
User manual 'CAVLAR'
© KWR
- 22 -
BTO 2009.003 EN
December 2012
6.3
Open
By clicking File-Open, the ‘Select a CAVLAR file’ dialog box appears (see Figure 12) with a file structure
from which a file can be opened.
Figure 12 File-Open dialog box ‘Select a CAVLAR file’.
Here, one opens files with the ADF extension, which were previously loaded in ‘CAVLAR’ and saved as
‘CAVLAR file’ through the ‘Save’ (see § 6.4) and ‘Save As’ (see § 6.5) options.
6.4
Save
By clicking File and Save, the input and output information is saved under the same (existing) file name
as an ADF file.
6.5
Save As
By clicking File and Save As, the input and output information is saved under another file name as an
ADF file.
6.6
Import
By clicking the menu options File and Import, various types of files can be imported (see Figure 13), for
example:
• an Excel file;
• an Aleid model.
User manual 'CAVLAR'
© KWR
- 23 -
BTO 2009.003 EN
December 2012
Figure 13 Menu for the importation of a file.
6.6.1 Excel file (format I)
To import an Excel 97-2003 file (with the extension XLS), the section and valve data have to be entered in
a single sheet and according to a required format. This means that the sections in a distribution network
have to be determined beforehand. In addition, the file must indicate which sections are feed sections.
Figure 14 presents an example of the data needed in, and the format of, an Excel file. The explanation
below can be followed with the help of the attached ‘testmodelCAVLAR.xls’ (see Annex III).
Figure 14 Excel file to enter valve configuration data.
The file begins with the data from the very first cell (row 1 and column 1). The section and valve
parameters to be entered depend on the settings (see § Fout! Verwijzingsbron niet gevonden. and §
Fout! Verwijzingsbron niet gevonden.).
The following columns are standard for the section parameters in an Excel file:
• ‘S’: Specific Section
The default setting is FALSE. Select TRUE if only these sections have to be calculated.
• ‘Section’
User manual 'CAVLAR'
© KWR
- 24 -
BTO 2009.003 EN
December 2012
•
•
•
•
•
•
Section gives the name or the identification code of a section. If a coordinate is entered for the
name, in which the x and y coordinates are separated by a hyphen, these coordinates are used in
the presentation of the section diagram, for example: ‘123456-789123’.
‘#Conn.’
The number of connections in a section.
‘Length’
The cumulative length of all the pipes in a section.
‘V: Feed Section
TRUE if a section is a feed section, otherwise FALSE.
‘Failure Probability’
The probability that an incident will occur in a section, shown by the number of failures per year.
‘Diameter’
The weighted average diameter of a section in mm. If no information is available for this, an
empty column must nevertheless be created.
A column-head named ‘MatOverg’ with no data
These columns are followed by an empty column, which is followed by the columns with the valve
parameters:
• ‘Valve’
The name or identification code of a valve.
• ‘Section 1’
The first section that a valve is connected to.
• ‘Section 2’
The second section that a valve is connected to.
• ‘Reliability’
The reliability of a valve. When a valve is removed, its reliability is 0.0 (0%); when a valve is
completely reliable its reliability is 1.0 (100%). In practice, valve reliability varies between 0.7 and
0.98.
• A column-head named ‘AanlegJaar’ with no data
Every row contains information about one section: there cannot be any blank rows in the Excel file.
In the event that an Excel file has to be opened that contains several worksheets, the ‘Select a sheet’
dialog box appears (see Figure 15). If coordinates are used for the section names, check the ‘Names of its
XY Coordinates’ box. The section names have then to consist of the X and the Y coordinates separated by
a hyphen, for example: 213834-572954.
Figure 15 The ‘Select a sheet’ dialog box when an Excel file to be imported contains several worksheets.
6.6.2 Aleid model
It is possible to import Aleid models (with the extension PRO) into ‘CAVLAR’ if the valves are known in
it. One can follow the explanation below with the help of the attached ‘testmodelCAVLAR.pro’ (see
Annex III).
The models are opened as follows. After clicking File and Import, one selects Aleid project. In the next
dialog box, Start must be clicked to begin the division of the distribution network into sections. In the
next dialog box, ‘Divide into sections’, three selection options appear (see Figure 16):
• #Connections per meter
The number of connections in a section depends on the length of the pipes in the section. In this
User manual 'CAVLAR'
© KWR
- 25 -
BTO 2009.003 EN
December 2012
option, one is asked to enter a conversion factor. This number indicates how many connections
there are per meter of length.
• #Connections per m3/h
The number of connections in a section depends on the consumption at the nodes in the section.
This option is only possible if the Allied model contains information about consumption. In this
option, one is asked to enter a conversion factor. This number indicates what the connection
equivalent is of an average consumption of 1 m3/h (8,760 m3/year). If the consumption per
connection is 125 m3/year, this is equivalent to 70 connections.
• None
The connections are entered manually at a later time for each section.
If there are no data available, the number of connections is an average of all the pipes subject to the
calculation.
The number of options depends on the data in the Aleid model. Thus, the ‘#Connections per m3/h’
option is not available if the Aleid model contains no consumption data.
After the Aleid model is loaded, the feed sections still have to be entered manually in column ‘F’. How
this is done is discussed in part I of this manual (see § 2.3.2.2).
User manual 'CAVLAR'
© KWR
- 26 -
BTO 2009.003 EN
December 2012
Figure 16 The division into sections for an Aleid project.
6.7
Export
By clicking File and Export, the input and output data of the sections are exported (exclusively) to a socalled CSV (Comma Separated Value) file5. The file contains information about ‘LINKS’ (= pipes present
in the section concerned), ‘NODES’ (= nodes present in the section concerned) and ‘VALVES’ (= valves
present in the section concerned).
6.8
End
This closes the ‘CAVLAR’ program.
6.9
Tabs in the main screen
When, via File-New, File-Open or File-Import, a ‘CAVLAR’ model is loaded, the ‘Overview’ dialog box
appears. The dialog box is divided into five tabs:
1. ‘Input’ in which the section and valve data are entered;
2. ‘Output’ in which the calculated performance indicators are shown;
3. ‘Advice’ in which, on the basis of the calculation results and the distribution network
configuration, advice is given for each section;
4. ‘Section diagram’ in which a section diagram is formulated and presented after the importation
of a file (assuming it contains the x and y coordinates);
5. ‘Graphs’ in which the specific characteristics of the valve configuration in the distribution
network are shown, namely: (i) the number of valves per section, (ii) the number of connections
per section, (iii) the pipe length per section and (iv) the internal pipe volume per section.
The explanation below can be followed with the help of the attached ‘testmodel CAVLAR.adf’ (see
Annex III).
The section data are saved in this text file, in which the data for each section are separated from those
for another by a comma.
5
User manual 'CAVLAR'
© KWR
- 27 -
BTO 2009.003 EN
December 2012
6.9.1 The ‘Input’ tab
In the ‘Input’ tab (see Figure 17) the data entered in a file or model are shown. On the left-hand side of
the tab, in tabular form, the section data are shown, and, divided by a grey strip, on the right-hand side,
the valve data are shown. The tab’s ‘section part’ (left) contains the data on the sections. These are used
to make the calculation regarding their criticality. The ‘valve part’ (right) contains the data per valve,
which are necessary to calculate the influence of the particular valve on the ‘CML’ and therefore to
determine the criticality of each valve.
The organisation of the ‘section part’ and then of the ‘valve part’ are described below.
Figure 17 File-New dialog box ‘Overview’ ‘Input tab’.
6.9.1.1
The section part of the ‘Input’ tab
Information table
The following information is shown for sections:
•
‘S’ – Specific section. If one or more sections are checked, only these sections are calculated. If no
section is checked, then all the sections are calculated.
• ‘Section’
The name or identification code of a section. If a coordinate is entered for the name, in which the
x and y coordinates are separated by a hyphen, these coordinates are used in the presentation of
the section diagram, for example: ‘123456-789123’.
• ‘#Conn.’
The number of connections in a section.
• ‘Length (m)’
The length of all pipes in the section (in meters).
• ‘V’
The section that serves as a feed section for the loaded model. ‘V’ must be checked to indicate
that the section is a feed section.
• ‘Failure Probability’
The probability that an incident will occur in a section (in number of failures per km per year).
User manual 'CAVLAR'
© KWR
- 28 -
BTO 2009.003 EN
December 2012
•
‘Diameter’
The weighted average diameter of a section (in mm).
Figure 17 shows an example of a completed section part in the ‘Input’ tab.
One can order the content of the columns alphabetically or by number/size by clicking the column’s
heading/title. A ‘Δ’ symbol appears if the order is ascending and a ‘∇’ if it is descending.
Note
The width of the ‘Section’ column does not adjust automatically to the width of the input data. To avoid
having data disappear behind the frame, the possibility exists of manually adjusting the column width
after entering the data.
Filter
Via the ‘Filter’ option, bottom-left in the ‘Input’ tab, one can select the above sections according to a
characteristic chosen in the option’s drop-down list. By then clicking on ‘Global adjustment’, one can
simultaneously change the characteristics of the selected sections.
By checking the ‘Filter’ box for the section data, three corresponding input fields can be filled (see Figure
18).
Figure 18 ‘Filter’ for section information.
In the first input field, these are the possibilities:
• ‘S’;
• ‘Section’;
• ‘#Conn.’;
• ‘Length (m)’;
• ‘V’;
• ‘Failure Probability’;
• ‘Diameter’.;
Depending on the choices made in the first input field, the second input field then offers more or less the
following possibilities:
• ‘=’;
• ‘>’;
• ‘<’;
• ‘>=’;
• ‘<=’;
• ‘<>’;
User manual 'CAVLAR'
© KWR
- 29 -
BTO 2009.003 EN
December 2012
• ‘Like’.
In the third input field, a choice can be made among the possibilities corresponding to the choices made
in the first input field:
• ‘Checked’/’Unchecked’ for columns ‘S’ and ‘V’;
• a code for the ‘Section’ column;
• a number for the other columns.
right next to the third input field (see, among others, Figure
A filtering process is started by clicking
18).
If one wishes, after the application of a filter, to reapply a filter to all data, then the filter has first to be
turned off (uncheck ‘Filter’) and then turned on again.
The filter works sequentially, that is, the filters requested operate one after the other. If, for example, one
asks for all rows with sections with more than 50 connections and a (pipe) length of more than 100
meters, the filter will first be applied for the connections and then for the length.
Global adjustment
Via ‘Global adjustment’, one can apply a change to section data simultaneously. There are two input
fields for ‘Global adjustment’ (see Figure 19). By checking the ‘Global adjustment’ box, two input fields
appear. In the first input field, the same possibilities appear that were described above in the case of
‘Filter’.
In the second input field, one enters the desired changes:
• ‘Checked’/’Unchecked’ for columns ‘S’ and ‘V’;
• a code for the ‘Section’ column;
• a number for the other columns.
A bulk modification is carried out by clicking
to the right of the second input field (see Figure 19).
Figure 19 ‘Global adjustment’ for section information.
Example of the application of a filter and Global adjustment to sections
In the distribution network loaded in ‘testmodel CAVLAR.adf’ (see Annex III) all the pipes have a
Failure Probability of 0.05. As far as this distribution network is concerned, it is known that the pipes
with a diameter superior to 200 mm have a failure probability of 0.04. This adjustment to the input data
is carried out as follows:
• Select ‘Filter’;
User manual 'CAVLAR'
© KWR
- 30 -
BTO 2009.003 EN
December 2012
•
In the input field select, in order: ‘Diameter’, ‘>=’ and ‘200’;
•
•
•
;
Click
Select ‘Global adjustment’ (Careful: the ‘Filter’ option must stay checked);
In the input field, select, in order: ‘Failure Probability, ‘=’ and ‘0.04’;
to have the adjustment implemented.
• Click
When, afterwards, the ‘Filter’ and ‘Global adjustment’ boxes are unchecked, all the data are again visible,
and all the pipes of more than 200 mm in diameter will have been given a failure probability of 0.04.
6.9.1.2
The valve part of the ‘Input’ tab
Information table
The following information is shown for valves:
•
‘Valve’
The name or identification code of a valve.
• ‘Section 1’
The first section to which the valve is connected.
• ‘Section 2’
The second section to which the valve is connected.
• ‘Reliability’
The reliability of a valve. The minimum value is 0.0 (0%) and the maximum 1.0 (100%). In
practice, valve reliability varies between 0.7and 0.98.
One can order the content of the columns alphabetically or by number/size by clicking the column’s
heading/title. A ‘Δ’ symbol appears if the ordering is ascending and a ‘∇’ if it is descending.
Note
The width of the ‘Valve’, ‘Section 1’ and ‘Section 2’ columns does not adjust automatically to the width of
the input data. To avoid having data disappear behind the frame, the possibility exists of manually
adjusting the column width after entering the data.
Filter
Via the ‘Filter’ option, bottom-left in the valve part of the ‘Input’ tab, one can select the above valves
according to a characteristic chosen in the option’s drop-down list. By then clicking on ‘Global
adjustment’, one can simultaneously change the characteristics of the selected valves.
By checking the ‘Filter’ box for the valve data, three corresponding input fields can be filled (see Figure
20).
User manual 'CAVLAR'
© KWR
- 31 -
BTO 2009.003 EN
December 2012
Figure 20 ‘Filter’ for valve information.
In the first input field for valves, these are the possibilities:
• ‘Valve’;
• ‘Section 1’;
• ‘Section 2’;
• ‘Reliability’;
Depending on the choices made in the first input field, the second input field then offers more or less the
following possibilities:
• ‘=’;
• ‘>’;
• ‘<’;
• ‘>=’;
• ‘<=’;
• ‘<>’;
• ‘Like’.
In the third input field, a choice can be made among the possibilities corresponding to the choices made
in the first input field: a code for the ‘Conn.’, ‘Section 1’ and ‘Section 2’ columns, and a number for
reliability.
right next to the third input field (see, among others, Figure
A filtering process is started by clicking
18).
If one wishes, after the application of a filter, to reapply a filter to all data, then the filter has first to be
turned off (uncheck ‘Filter’) and then turned on again.
Global adjustment
Via ‘Global adjustment’, one can apply a change to the valve data simultaneously. There are two input
fields for ‘Global adjustment’ (see Figure 21). By checking the ‘Global adjustment’ box, two input fields
appear. In the first input field, the same possibilities appear that were described above in the case of
‘Filter’.
User manual 'CAVLAR'
© KWR
- 32 -
BTO 2009.003 EN
December 2012
Figure 21 ‘Global adjustment’ for valve information.
In the second input field, one enters the desired changes: a code for the ‘Valve’, ‘Section 1’and ‘Section 2’
columns, and a number for reliability.
A bulk modification is carried out by clicking
to the right of the second input field (see Figure 19).
Example of the application of a filter and Global adjustment to valves
In the distribution network loaded in ‘testmodel CAVLAR.adf’ (see Annex III) all the valves have a
reliability of 1.0. However, it is known that the reliability of the valves is actually 0.95. This adjustment to
the input data is carried out as follows:
•
•
Select ‘Global adjustment’
In the input fields, select, in order: ‘Reliability ‘=’ and ‘0.95’;
to have the adjustment implemented.
• Click
All valves have now been given a reliability of 0.95, as shown in the table.
Calculating critical valves
To calculate the influence of a valve on the average ‘CLM’ (criticality per valve), the valves are removed,
one by one, from the model by setting a valve’s reliability at 0%, after which a calculation is rerun for the
entire distribution network; the valve concerned is then reinserted. For this calculation, the ‘Calculate
critical valves’ box, at the bottom of this tab, has to be checked (see Figure 22).
This calculation of the critical valves requires that a calculation be run for each valve. This can result in
very long calculation times. It all depends on the size of the distribution network being evaluated.
If the calculation time is too long the criticality of a valve can, if desired, be determined another way:
• A calculation is run for the distribution network at a high valve reliability level (for example,
90%);
• A calculation is run for the distribution network at a low valve reliability level (for example,
60%);
• The sections for which the ‘CML’ differences are the greatest contain the most critical valves.
Start
A calculation is begun by clicking ‘Start’, bottom-right in the tab (see Figure 22). If one clicks ‘Start’ and
the ‘Calculate critical valves’ box is not checked, then a calculation will be run for the sections. This
involves simulating an incident in each section and calculating its influence on the performance
indicators for the given reliability of the valves. In this way the critical sections can be determined. But
User manual 'CAVLAR'
© KWR
- 33 -
BTO 2009.003 EN
December 2012
when the ‘Calculate critical valves’ box is checked, then the procedure for the determination of the
critical valves begins when one clicks ‘Start’.
Figure 22 Check ‘Calculate critical valves’ box and click ‘Start’ in the ‘Input’ tab.
6.9.1.3
Status bar at the bottom of ‘Input’ tab
The lowest bar provides information on a number of matters (see Figure 23):
•
‘CML’
Here, the average ‘CML’ [(time/conn.)/year] is shown in hh:mm:ss. This is calculated by adding
up the ‘CMLs’ of all the sections and then dividing the total by the total number of connections
in the distribution network concerned.
• ‘Status’
If the input data are not changed, then the word ‘Unchanged’ appears here. After changes are
made to the loaded model, the word ‘Changed’ appears.
Figure 23 The ‘CML’ calculated for all sections [(time/conn.)/year] shown in the status bar.
User manual 'CAVLAR'
© KWR
- 34 -
BTO 2009.003 EN
December 2012
6.9.1.4
Notification of incorrect input for sections or valves in the ‘Input’ tab
If incorrect data are entered in a row in one of the dialog boxes, an exclamation mark appears in the first
column of the row, that is, to the left of column ‘S’(see Figure 17), as shown in Figure 24. This check is
conducted before a calculation is conducted.
Figure 24 Exclamation mark notifying that an incorrect entry has been made.
6.9.2 The ‘Output’ tab
The ‘Output’ tab (see Figure 25) shows the results of the calculation for the performance indicators. As is
the case of the ‘Input’ tab, in this case the left-hand side shows the information and results for the
sections, and the right-hand side those for the valves (only after the ‘Calculate critical valves’ box is
checked). The columns shown for the sections are the following:
• ‘Section’;
• ‘Conn.’;
• ‘Impact (conn.)’;
• ‘Ratio’;
• ‘CML (min/section/yr)’;
• ‘CI (1/yr)’.
And for the valves they are:
• ‘Valve’;
• ‘Aver. Impact’;
• ‘CML (min/conn./yr)’;
• ‘CI (1/yr)’.
For the meaning of these concepts, refer to the glossary in Annex I of this manual.
Figure 25 presents an example of the ‘Output’ tab after the completion of a calculation process.
Figure 25 Overview ‘Output’ tab.
User manual 'CAVLAR'
© KWR
- 35 -
BTO 2009.003 EN
December 2012
6.9.3 The ‘Advice’ tab
The third tab in the ‘Overview’ dialog box is ‘Advice’ (see Figure 26). The figure shows that this tab is
split into three parts: a left-hand and a right-hand part, and a part below. The left-hand part shows a
number of ‘categories’ that are based on the water company’s entered standards. These standards are
entered by via Options-Settings and the ‘Section size and section isolation’ tab (see § 7.3). By clicking a
‘+’, the names of the sections within the category concerned appear. If the name of a section is then
clicked, the ‘Section information’ about the section appears in the right-hand part of the tab. This
information involves the following items (which is also available in the ‘Output’ tab), in this order:
• ‘Section name’;
• ‘Number of connections’;
• ‘Impact’;
• ‘CML’;
• ‘CI’.
In the bar at the bottom of this tab, the average ‘CML’ is shown in 0:00:00 (h:min:s).
In the part below, advice is presented regarding the different categories. In any event, the following
sentence appears: ‘Here, you have the following option(s):’ The rest of the text depends on the category,
and may include advice such as:
• ‘Resection: increase number of connections’;
• ‘Increase the VCI’ (Valve Cluster Index):
If the ‘VCI’ has to be increased, this means that the number of valves at a joint has to be reduced.
• ‘Decrease Reliability (less reliable valves)’;
• ‘Here, you don’t have to do anything!’.
Figure 26 File-New dialog box ‘Overview’ ‘Advice’ tab.
Refer to Annex I for the meaning of ‘VCI’ and ‘Reliability’.
In the example of Figure 26, the section size (‘A’, Number of connections) and the impact (‘I’, Impact)
should lie between 50 and 200 connections (company standard), and in the tree diagram the sections are
divided in ranges:
User manual 'CAVLAR'
© KWR
- 36 -
BTO 2009.003 EN
December 2012
•
•
•
•
•
•
•
A < 50, I < 50
Section size and impact are both below the company standard. The sections could be made
larger without having the impact exceed the standard. In addition, the valves in this section
could also have a reduced reliability.
A < 50, 50 < I < 200
The sections are too small, but the impact lies within the acceptable range. By only making the
sections larger the impact could increase; therefore this action would need to be combined with
more reliable valves.
A < 50, I > 200
The sections are too small and the impact is too large. A combination of larger sections and more
reliable valves is necessary.
50 < A < 200, 50 < I < 200
Both the section size and the impact lie within the company standard.
50 < A < 200, I > 200
The section size is good, but the impact is too large. The section’s bordering valves have to
become more reliable, for example, through more frequent or better maintenance.
A > 200, I > 200
The number of connections (and thus the size of the impact) is larger than the company
standard. The main advice in this situation is to reduce the size of the sections.
Secured connections
The connection concerned is located between two valves (3 valves on a T-junction with a branch
to an especially vulnerable customer, like a hospital), so that if a section fails supply to this
connection can be maintained. (see Annex I).
6.9.4 The ‘Section diagram’ tab
The ‘Section diagram’ tab (see Figure 27) shows the section diagram (assuming there are x and y
coordinates) of the loaded distribution network. The sections are represented by colored nodes, the color
indicating the number of connections in the section according to the color code in the legend. The valves
are represented by connecting lines. To the right of the section diagram are shown the input information
and calculation results for a selected valve or section.
Figure 27 ‘Overview’ tab ‘Section diagram’.
User manual 'CAVLAR'
© KWR
- 37 -
BTO 2009.003 EN
December 2012
There are two ways of selecting valves or sections:
• Selecting in the map: valves and sections are selected by clicking on them (part ‘1’ in Figure 27);
• Searching in the button bar (part ‘2’ in Figure 27): this bar has a search field (see Figure 28) which
allows for the quick localisation of valves and sections. When one starts entering the name of the
section/valve one is searching for, a drop-down list appears with the first ten valves or sections
that meet the search criteria. The name can then be selected from this list. The complete name
can also be entered and then ‘Enter’ pressed.
Figure 28 The search field in the ‘Section diagram’ tab.
When a valve or section is found and selected, it appears marked in the section diagram.
In the overview on the right-hand of the section diagram, the size and place of the sections in the
diagram can be changed and, after the selection of a section or valve, the corresponding input
information and calculation results are shown.
Dimensioning or moving sections (part ‘3’ in Figure 27)
In part 3, by using the scroll bar, one can change the size of the node that represents the section. Also, by
using the ‘Section locked’ button, one can change the position of the section – for example, when the
diagram shows the sections crowded against, or even overlapping, each other. The procedure for this is
described in § 2.5.5.
Input information (part ‘4’ in Figure 27)
Here, the information corresponding to a selected section or valve is shown. For a section, the bordering
valves are given as well as the section’s characteristics, such as the number of connections, the length, the
failure probability and the diameter. For a selected valve, the sections that it closes off are shown as well
as its reliability.
Calculation results (part ‘5’ in Figure 27)
For the selected sections, the performance indicators are also shown if the loaded network has been
calculated. For the valves, this is only the case if the ‘Calculate critical valves’ box is checked before the
calculation is run.
6.9.5 The ‘Graphs’ tab
Four charts are created on the basis of the input information (see Figure 29 ):
• Top-left: the number of sections plotted against the number of valves per section (bar chart);
• Top-right: the number of connections per section plotted against the cumulative number of
sections (sorted by number of connections);
• Bottom-left: the pipe length per section plotted against the cumulative number of sections
(sorted by pipe length);
• Bottom-right: the internal volume (pipe volume) per section plotted against the cumulative
number of sections (sorted by volume).
User manual 'CAVLAR'
© KWR
- 38 -
BTO 2009.003 EN
December 2012
Figure 29 File-New dialog box ‘Overview’ tab ‘Graphs’.
The number of sections plotted against the number of valves per section
The chart provides an impression of the number of valves in a section and the general valve
configuration of the entire distribution network; the chart should show a concentration between 2 and 5
valves per section. Sections with a single valve are always dependent sections. Sections with many
valves raise the risk of unsuccessful isolation.
The number of connections per section plotted against the cumulative number of sections
The chart shows the distribution of connections over the sections. The sections with no connections are
generally part of the transport system. The chart makes it very clear where the valve configuration
stands in relation to the conditions defined by the company for a valve configuration – for example, a
minimum of 50 and a maximum of 200 valves per section.
The pipe length per section plotted against the cumulative number of sections
The chart shows the distribution of the pipe lengths in a section and over the sections.
The internal volume (pipe volume) per section plotted against the cumulative number of sections
The chart provides insight into the volume in the sections, which involves using a logarithmic scale to
express volume. The situations in which small volumes occur include cases where small-diameter Tjunctions are equipped with 3 valves, or when two valves are located right next to each other. The latter
case can indicate a mistake in the valve configuration.
6.10 Copying ‘CAVLAR’ data and results
The section diagram, the information table and the charts can be copied to the clipboard and then, if so
desired, entered into a spreadsheet. The buttons for this purpose are found in the top-left corner of the
tabs concerned (excepting the ‘Advice’ tab), as shown in Figure 30.
User manual 'CAVLAR'
© KWR
- 39 -
BTO 2009.003 EN
December 2012
Figure 30 The buttons found in various tabs to copy data.
The copy options however vary depending on the object concerned. Below, an explanation is given for
each object.
‘Input’ and ‘Output’ tabs
It is possible to copy data from the ‘Input’ and ‘Output’ tabs. By going to the desired tab and left-clicking
the mouse (Figure 30), the data are pasted on the desired spreadsheet by pressing Ctrl+V. It is also
possible to select all by using the Ctrl+A key combination. By right-clicking the mouse, one can then
select ‘copy data’. These data can then be entered in a spreadsheet via the Ctrl+V key combination.
In the section part of the ‘Input’ tab there appears, when one right-clicks the mouse, a third option:
‘Paste’. This option can be used to paste data from another file in the desired location in the input field
(see Figure 31). When one copies data from ‘Output’ to Excel, the format of the ‘CML’ must be changed
in Excel to [h]:mm:ss. This is done via Format cells - custom – [h]:mm:ss.
Figure 31 Copying data from ‘CAVLAR’.
‘Section diagram’ tab
A section diagram can only be copied as an image. This is possible either as a bitmap on the clipboard, or
in a file with a bmp-extension, via the two buttons as shown in Figure 30. Also, the section diagram can,
by right-clicking the mouse and clicking ‘copy image’, be copied to the clipboard or as a file.
‘Graphs’ tab
The charts can, in the first place, be copied as data, by right-clicking the mouse over the chart and then
selecting ‘copy data’. Excel will show the data upon which the charts are based. Another possibility is to
copy a chart as a bitmap onto the clipboard, or as a file with a BTM extension, by right-clicking the
mouse or via the buttons at the top of the screen.
User manual 'CAVLAR'
© KWR
- 40 -
BTO 2009.003 EN
December 2012
7
‘Options’ in the main menu
7.1
Introduction
By clicking Options in the main menu, Settings appears, and by clicking this option the ‘Program
settings’ dialog box appears (see Figure 32). If the settings are changed in this manner, the model (with
the ADF extension) has to be entered again.
Figure 32 Options-Settings dialog box ‘Program settings’.
The ‘Program settings’ dialog box contains four tabs, in the following order:
• General: general program and calculation settings;
• Section length and isolation: standards for the section size and isolation duration settings for a
section;
• Section diagram: settings for the section parameters to be entered;
• CFG file: configuration settings (save/load all the above settings).
The five tabs are discussed further in the paragraphs that follow.
7.2
General
In this tab (see Figure 32) the ‘Calculation’ and ‘Language’ settings are entered.
7.2.1 Calculation settings
‘CAVLAR’ determines the effect of isolating a section, which involves closing the section’s valves. The
possibility of isolating a section depends on the reliability of its valves. If a valve’s reliability is < 1 the
section cannot always be isolated, in which case the adjacent sections must also be isolated. This brings
with it an increase in the calculation time. The calculation of the critical valves can also significantly
boost the calculation time. The ‘Shut down Windows automatically after calculation’ option (see Figure
33) is particularly useful when extensive calculation sessions are involved, for example, those for very
large models or for critical valves. With this option, calculations can be started that will run into the
weekend. Once the calculation is complete, the model with the results is saved and the computer shuts
down on its own.
User manual 'CAVLAR'
© KWR
- 41 -
BTO 2009.003 EN
December 2012
Figure 33 Options-Settings dialog box ‘Program settings’ tab ‘General’.
Depending on the computer and the Windows version being used, there are several options which
appear after the completion of the calculation:
• Hibernate – Turns the computer off, but saves the contents of memory for a quick start-up;
• LogOff – Logs off after calculation;
• PowerOff – Shuts the computer down;
• Reboot – Restarts the computer;
• ShutDown – Shuts the computer down;
• Suspend – Puts the computer on standby and saves the contents of memory for a quick start-up.
7.2.2 Language
The language list allows for a choice between English and Dutch. The language is only completely
activated by opening a new file.
7.3
Section size and section isolation
In the ‘Section size and section isolation’ tab, the company standards for the section size and the duration
of supply interruptions are entered (see Figure 34).
Figure 34 Options-Settings dialog box ‘Program settings’ tab ‘Section size and section isolation’.
User manual 'CAVLAR'
© KWR
- 42 -
BTO 2009.003 EN
December 2012
Via the ‘Minimum standard section size’ and ‘Maximum standard section size’ input fields, the company
standards (provided by the drinking water company) are entered as is the most cost-effective section
size. The standard entered applies in the program to both the section size and for the impact.
The duration of the supply interruption is calculated for every incident in a section and converted into
the ‘CML’ performance indicator. The duration depends on the (weighted) average pipe diameter in a
section
7.4
Section diagram
In the ‘Section diagram’ tab (see Figure 35), the sections are shown in different colors. The color of a
section indicates the number of connections in the section.
Figure 35 Options-Setting dialog box ‘Program settings’ tab ‘Section diagram’.
Both the color and the range indicated by a color can be adjusted by clicking the buttons for this purpose
(see Figure 35, right-hand button, under Color) (see Fout! Verwijzingsbron niet gevonden.).
Figure 36 ‘Options-Settings’dialog box ‘Program settings’
tab ‘Section diagram’ dialog box ‘Color’.CFG file
User manual 'CAVLAR'
© KWR
- 43 -
BTO 2009.003 EN
December 2012
7.5
CFG file
In the ‘CFG file’ tab (see Figure 37) one indicates the file type that all the settings are to be saved in.
Figure 37 Options-Settings’ dialog box ‘Program settings’ tab ‘CFG file’.
User manual 'CAVLAR'
© KWR
- 44 -
BTO 2009.003 EN
December 2012
8
Bibliography
Loet Rosenthal, George Mesman and Martin de Koning: ‘Key Criteria for Valve Operation and
Maintenance; AwwaRF-Kiwa workshop, Nieuwegein, March 29-30, 2001’, BTO 2001.155 (s), Kiwa
Water Research, Nieuwegein, December 2001
E.A. Trietsch and P.G. Schaap: ‘Betrouwbaarheid van afsluiters en sectie-isolaties’, BTO 2006.016, Kiwa
Water Research, Nieuwegein, April 2006
User manual 'CAVLAR'
© KWR
- 45 -
BTO 2009.003 EN
December 2012
I Glossary
What follows, in alphabetical order, is a glossary of the key words and concepts pertaining to ‘CAVLAR’.
CI = Customer Interruptions = the number of times per year that a customer in a specific section is
affected by an interruption (unit: number per section per year). CI therefore refers to a specific section. If
a shut-down of a section occurs because of an interruption in another section, the CI is considered
administratively to be of that other section.
CML = Customer Minutes Lost = Supply interruptions are calculated both per section and for the entire
distribution network, and expressed in the number of minutes customers are without water supply. The
‘CML’ calculation makes use of the number of connections affected (= the Impact, see below), how
frequently the section is affected per year by an incident (= interruption frequency or failure probability)
and the length of time the section is isolated.
In ‘CAVLAR’ the distinction is made between CMLaverage, CMLsection and CMLvalve:
the average length of time that a connection experiences a supply interruption
• CMLaverage:
expressed in (min/connection/year);
the total length of time that the whole section experiences a supply interruption
• CMLsection:
expressed in (min/section/year) (average ‘CML’ * number of connections in the section);
• CMLvalve:
the average length of time that a connection experiences a supply interruption
expressed in (min/connection/year) if the valve concerned is removed from the distribution
network.
‘CLM’ refers exclusively to unplanned interruptions that result in a complete shut-down of water
supply. The time during which water is actually supplied, but at a pressure that is too low and/or when
its quality is poor, is not included in the calculation.
Company standard = the minimum and maximum value determined by the drinking water company for
a particular parameter.
Connecting section = A section that connects areas with each other and thus performs a ‘transport
function’ (see Figure I.2). In this figure, section A is the connecting section. If section A is isolated, part of
the network will become dry.
Section
Sectie
Afsluiter
Valve
3
1
2
A
Figure I.2 Connection section in the section diagram.
User manual 'CAVLAR'
© KWR
- 46 -
BTO 2009.003 EN
December 2012
Connection = An administrative connection or supply point.
Criticality = The degree to which a section or valve is critical (or prioritized) in terms of a selected
performance indicator (no measurement unit).
Critical section = A section with the highest values for one of the performance indicators (‘CML’, ‘CI’, ‘I’
or ‘Ratio’).
Critical valve = A valve with high criticality.
Dependant section = A section whose valve(s) is (are) located in one other section (see Figure I.1). In the
top part of the figure, sections B and C are dependant sections because, if section A is isolated (valves 2
and 3), sections B and C become dry.
C
C
B
B
1
1
A
2
2
3
A
3
Section
Sectie
1
B
B
2
1
3
A
4
A
2
Afsluiter
Valve
3
4
Figure I.1 Dependant sections in a distribution network and in the corresponding section diagram.
In the bottom part of the figure, B is a dependant section because, if section A is isolated (valves 1 and 4),
then section B will also be interrupted...
Failure probability = The probability that an incident will occur in a section (unit: interruptions per km
per year).
Feed section = A specially marked section that forms a connection with another distribution network
(which is not contained in the model) and therefore performs a feed function for the distribution network
under consideration (see Figure I.3). In this figure section A is the feed section.
User manual 'CAVLAR'
© KWR
- 47 -
BTO 2009.003 EN
December 2012
Section
Sectie
Afsluiter
Valve
D
D
4
3
A
3
C
C
1
1
B
2
4
A
2
B
Figure I.3 Feed section in the distribution network and the corresponding section diagram.
Impact = The impact refers to the number of connections affected by an incident in a section. The
calculation involves the impact on a section of an incident that takes place within the section. When one
of the bordering valves of the section fails, then the effect extends to the adjacent sections.
Node = The schematic representation of a section in a section diagram.
Performance indicator = Parameter upon which the performance in an area or individual section is
assessed.
Ratio = The proportion between the impact of an incident in a section and the original number of
connections in the section. For example, if an incident occurs in a section with 100 connections and,
because of valve failure, an average of an additional 50 connections (in adjacent sections) are affected,
then the ratio is 1.50 (= 150/100).
Reliability = The reliability of a valve. When a valve is removed, its reliability is 0.0 (0%); when a valve
is completely reliable its reliability is 1.0 (100%). In practice, valve reliability varies between 0.7 and 0.98.
Section = A part of a distribution network that can be isolated by one or more valves.
Section diagram = A graphic representation of a valve configuration, in which the sections are
represented by nodes and the valves between the sections by connecting lines. ‘CAVLAR’ presents
information, like the section name and size, and the valve names, when one clicks on a node (section) or
on a connecting line (valve).
Section size = The size of a section expressed by the number of connections.
Secured connection = The connection concerned is located between two valves (3 valves on a T-junction
with a branch to an especially vulnerable customer, like a hospital), so that if a section fails supply to this
connection can be maintained. An other possibility for backup is to have two connections (dual supply)
on two sections on a certain distance away from each other..
VCI = Valve Cluster Index = The difference between the number of pipes and the number of valves at a
joint.
User manual 'CAVLAR'
© KWR
- 48 -
BTO 2009.003 EN
December 2012
II ‘CAVLAR’ calculation method
‘CAVLAR’ is a calculation program that calculates the performance of a drinking water distribution
network on the basis of performance indicators. This involves isolating each section in the distribution
network (valves closed) and determining the effect of the isolation for a given level of valve reliability.
The ‘CAVLAR’ calculation method is explained in this annex.
A simple schema of a distribution network is shown in Figure II.1. The ‘CAVLAR’ calculation simulates
the isolation of each separate section. For each section isolation, a determination is made as to which
valves isolate the section concerned and whether these valves function well. If a valve does not function
well, then the adjacent section has to be isolated. In this way, a determination is made of how many
connections on average are affected if the section concerned is isolated.
Network: example
If a pipe break occurs in section ‘a’, then an attempt is made to isolate the section by closing valves 1 and
8. On the basis of the given reliability for a valve, a determination is made as to whether that valve will
fail. In the event that valve 1 functions and valve 8 fails, section ‘i’ will also be affected by the pipe break.
Apart from valve 1, valves 7 and 9 will also have to be closed.
Figure II.1.
Example of a simple, schematized distribution network.
This analysis is conducted for each section, so that for each valve concerned a determination is made
anew as to whether it will fail and a determination is made of the number of connections affected.
Directly affected sections
In ‘CAVLAR’, for each section isolation, a determination is made as to whether the adjacent sections are
also affected depending on whether or not the valves concerned fail. If a valve fails, two sections are
‘directly’ affected. Then, a calculation is made as to whether other sections are indirectly affected
through island formation. The total impact and ‘CML’ are calculated and saved.
User manual 'CAVLAR'
© KWR
- 49 -
BTO 2009.003 EN
December 2012
For its calculation, ‘CAVLAR’ uses a tree diagram of the distribution network. The section that is affected
is at the top of the diagram. The tree diagram that corresponds to Figure II.1, in the event that section ‘a’
is affected, is shown in Figure II.2.
a
g
e
i
b
b
f
h
c
j
d
c
d
Figure II.2: Tree diagram of the distribution network if section ‘a ’is isolated.
The tree diagram runs from top to bottom and, for each combination of valves, the probability is
calculated as to whether a section can be properly shut down. From a large number of combinations the
probability that a section can be shut down can be calculated analytically and, therefore, the number of
affected connections can be precisely determined. In the example of Figure II.1, assuming a valve
reliability of 90%, the probability of a successful isolation of section ‘a’ is 81%. With 10,000 iterations,
section ‘a’ would therefore be successfully isolated in 8,100 cases (and thus be the only section affected),
and in 1,900 cases one or more valves will fail, so that more sections will be affected.
First order combinations for section ‘a’ are (+ is a functioning valve, - is a failing one):
• valve 1+, 8+ :
8,100 times
(i)
• valve 1-, 8+
:
900 times
• valve 1+, 8:
900 times
• valve 1-, 8:
100 times
The last three combinations (and therefore 1,900 iterations) can then be recalculated analytically. In the
example, the following second order combinations are possible:
• valve 1-, 8+, 2+, 3+:
729 times
(ii)
• valve 1-, 8+, 2-, 3+
:
81 times
• valve 1-, 8+, 2+, 3:
81 times
• valve 1-, 8+, 2-, 3:
9 times
Altogether 900 iterations
•
•
•
•
valve 1+,
valve 1+,
valve 1+,
valve 1+,
8-, 7+, 9+:
8-, 7-, 9+
8-, 7+, 98-, 7-, 9-
•
valve 1-, 8-, 2+, 3+, 7+, 9+
User manual 'CAVLAR'
© KWR
729 times
81 times
81 times
9 times
:
:
:
:
66 times
- 50 -
(iii)
Altogether 900 iterations
(iv)
BTO 2009.003 EN
December 2012
•
•
•
•
•
•
•
•
•
•
•
•
•
•
•
valve 1-, 8-, 2- 3+, 7+, 9+
valve 1-, 8-, 2+, 3- 7+, 9+
valve 1-, 8-, 2- 3- 7+, 9+
valve 1-, 8-, 2+, 3+, 7-, 9+
valve 1-, 8-, 2- 3+, 7-, 9+
valve 1-, 8-, 2+, 3-, 7-, 9+
(valve 1-, 8-, 2-, 3-, 7-, 9+
valve 1-, 8-, 2+, 3+, 7+, 9
valve 1-, 8-, 2- 3+, 7+, 9valve 1-, 8-, 2+, 3-, 7+, 9(valve 1-, 8-, 2-, 3-, 7+, 9valve 1-, 8-, 2+, 3+, 7-, 9(valve 1-, 8-, 2- 3+, 7-, 9(valve 1-, 8-, 2+, 3-, 7-, 9(valve 1-, 8-, 2-, 3-, 7-, 9-
:
:
:
:
:
:
:
::
:
:
:
:
:
:
7 times
7 times
1 time
7 times
1 time
1 time
0 times)
7 times
1 time
1 time
0 times)
1 time
0 times)
0 times)
0 times)
Altogether 100 iterations
The analytical calculation continues until the probability that a combination occurs is smaller than a
code-entered value of 0.001. At this point the calculation switches over to the so-called brute-force
method.
The brute-force method is only used for calculating the remaining combinations of valves (fail and
function). The brute-force method involves the use of a random generator for each valve to determine
whether the valve fails. The remaining sections and valves are calculated a number of times to come to a
reliable result. The number of times is established in the code and is equal to 0.001 times the maximum
number of iterations.
Example
In the example of Figure II.1, a pipe break is assumed to occur in section ‘a’, which is therefore directly
affected first. Valves 1 and 8 are then tested. If valve 8 fails, section ‘i’ is then also directly affected by the
incident, and valves 7 and 9 are tested. In the event that valve 7 also fails, section ‘b’ is also directly
affected and valve 3 is tested. If valve 3 functions, and therefore all of the periphery valves function, then
the calculation is finished.
Indirectly affected sections
The isolation of the directly affected sections can mean that other sections are cut off from the water
supply, and are therefore indirectly affected. For this reason, for each directly affected section,
‘CAVLAR’ also checks whether other sections are indirectly affected. These sections are determined by,
starting from the feed sections – which can involve several sections – running through all connected
sections (Figure II.3).
User manual 'CAVLAR'
© KWR
- 51 -
BTO 2009.003 EN
December 2012
Feeding
d
h
j
e
c
c
f
g
i
a
b
a
b
Figure II.3: Schematic representation of the distribution network in a tree diagram with the feed section at the top.
Indirectly affected sections: example 1
Section ‘d’ is a feed section. Sections ‘a’ and ‘i’ are directly affected sections, and valves 1, 7 and 9 are
closed (Figure II.4). The tree diagram shows that only section ‘b’ will possibly no longer be fed. Then, a
check is made to see whether section ‘b’ appears in another branch. This turns out to be the case (via
branch ‘d’, ‘h’, ‘e’, ‘g’), which means that section ‘b’ is not indirectly affected.
d
h
e
j
c
c
f
g
a
i
b
a
b
Figure II.4: Tree diagram of the isolation of sections ‘a’ and ‘i’ (both of
which are directly affected sections).
User manual 'CAVLAR'
© KWR
- 52 -
BTO 2009.003 EN
December 2012
Indirectly affected sections: example 2
If sections ‘h’, ‘c’ and ‘j’ are affected, then the whole left-hand side of the network is indirectly affected
(Figure II.5). In the tree diagram this is represented as follows:
d
h
e
j
c
c
f
g
a
i
b
a
b
Figure II.5: Tree diagram for the isolation of sections ‘h’, ‘j’ and ‘c’.
The tree diagram shows that sections ‘a’, ‘b’, ‘e’, ‘f’, ‘g’ and ‘i ‘ are possibly indirectly affected. This is
indeed the case, since none of these sections is supplied through another branch.
Calculation of performance indicators
Now that it is known which sections are directly and indirectly affected, a determination can be made of
the number of affected connections (= Impact) and of how many minutes on average the customers in
these sections will have no water supply (= ‘CML’).
The ‘CML’ per section is equal to:
CMLi = I i ⋅Ti ⋅ Li ⋅ SFi
[min/section.year]
whereby:
i = section index
j = iteration index
Ii = number of connections affected
Ti = duration of supply interruption
Li = length of pipes in section ‘i’
SFi = interruption frequency in section ‘i ‘
i =n
The average ‘CML’ for the whole distribution network is
whereby:
A = total number of connections in the distribution network
User manual 'CAVLAR'
© KWR
- 53 -
CML =
∑I
i =1
i, j
⋅Ti ⋅ Li ⋅ SFi
A
[min/conn.year]
BTO 2009.003 EN
December 2012
III Example of an Excel file, Aleid model and
‘CAVLAR’ file
The following test models can be downloaded on the ‘CAVLAR’ software site:
testmodelCAVLAR.xls: ·
testmodelCAVLAR.pro:
testmodelCAVLAR.adf:
an Excel file (formatI) of a distribution network model
an Aleid model of a distribution network
a ‘CAVLAR’ file of a distribution network
The ‘CAVLAR’ software tool, and accompanying test models and manual, are available on
http://www.kwrwater.nl/waterware/.
User manual 'CAVLAR'
© KWR
- 54 -
BTO 2009.003 EN
December 2012
The Watershare® Concept
122012
KWR has launched the Watershare® concept,
which is dedicated to the sharing of expert
water-related tools with selected partner
knowledge institutes. Watershare®
encompasses a wide range of benchmarked
practical tools designed for areas like water
quality and health, sustainability, water
technology, asset design and management,
and water systems.
Partnering in Watershare® offers the
knowledge institute substantial benefits,
and contributes significantly to improving
the institute’s and its end-users’ performance and effectiveness. The Watershare®
partners become members of a family of
trusted and highly reputable institutes, and
have the opportunity to build an attractive
business model.
Contact
KWR Watercycle Research Institute
P.O. Box 1072, 3430 BB Nieuwegein
The Netherlands
T +31 30 606 9582
F +31 30 606 1165
www.kwrwater.nl


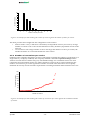
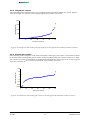
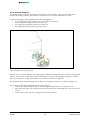
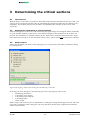
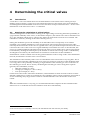
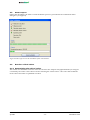
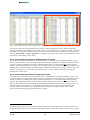

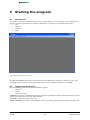

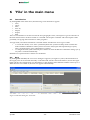
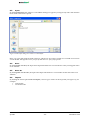
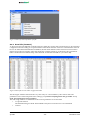

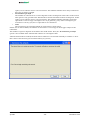
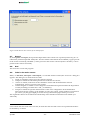
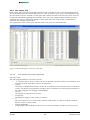
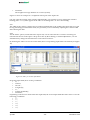

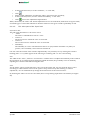
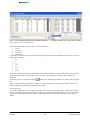
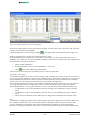
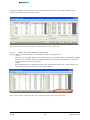
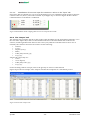
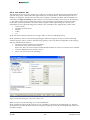
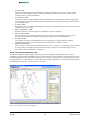
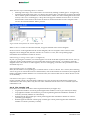
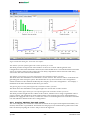


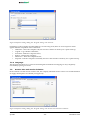


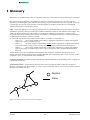

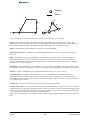
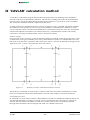
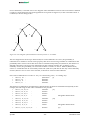
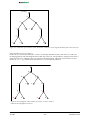
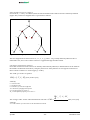


![LS5105 Document No 2 [PDF 1MB] - Australian Electoral Commission](http://vs1.manualzilla.com/store/data/005655823_1-2458abda02bbd8390d0ac9ba8bd86ac6-150x150.png)