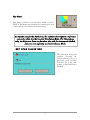
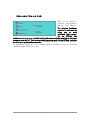
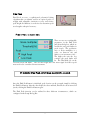
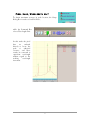
1
ILT900 Wideband Rapid Portable Spectroradiometer SpectrILight Software Manual Release 1.3 27 April 2007 10 Technology Drive Peabody, MA 01960 978-818-6181 www.intl-lighttech.com Warranty and Liability This IL product is warranted against defects in material and workmanship for a period of one year from the date of shipment. During the warranty period, International Light will, without charge, repair or replace, at its discretion, the defective product or component parts. For warranty service or repair, this product must be returned to a service facility designated by International Light (IL). For products returned under warranty, the Buyer shall prepay shipping charges (including shipping charges, duties, and taxes for products returned to IL from another country), and IL will pay for shipping charges to return the product to the Buyer. This warranty does not apply in the event of misuse or abuse of the product or as a result of unauthorized alterations, modifications or repairs, if the serial number is altered, defaced or removed, the improper or inadequate maintenance by the Buyer, Buyer-supplied software or interfacing, or improper site preparation or maintenance. No other warranty is expressed or implied. IL shall not be liable for any consequential damages, including without limitation, damages resulting from loss of use, as permitted by law. 1 Quick Start Installation Guide This quick start guide will walk through the installation of the SpectrILight software package. Please follow the instructions closely to complete the installation. Before beginning, read through this entire guide. Insert the IL installation CD into the appropriate CD-Rom drive. (The installation should begin automatically. If not, open the CD through the Explore command [right-click the CD icon and choose Explore] and click on the “setup.exe” file to begin the installation manually.) To avoid contentions with the operating system during driver install, do not plug in the USB cable prior to software installation. The first screen displayed requires you to input the user name, organization name and permissions. Respond according to your requirements. The rest proceeds under control of the Install Shield Wizard. You will have the option to designate the install location of the application. The unique calibration file for your instrument is on the CD, and is installed on your PC during this process. At the end of the procedure, the InstallShield Wizard will request a restart. Leave the Install CD in place and click yes. After the computer has restarted, plug in the USB cable to the computer and the ILT900. The first time this is done, the system will report Found New Hardware, and proceed to install the drivers for the ILT 900. This proceeds differently under different systems : ⇒ Windows 98 proceeds unattended. ⇒ Windows 2000 installs the drivers, but asks if you want to install an Unsigned Driver. Click yes. ⇒ Windows XP will launch the Found New Hardware Wizard. Click yes whenever asked, including permission to install an Unsigned Driver. Software installation is now complete. A Launch SpectrILight shortcut is on the desktop, and a launch line has been placed in the Start Programs menu. 2 System Requirements Check that your computer meets the minimum requirements for the SpectrILight system. Requirements for the Hardware ⇒ One full-power USB port from a computer or a powered hub. The ILT900can require 300mA, so that an unpowered hub will not support the device. The device operates at USB 2.0 specifications, but will function with USB 1.1 ports. Requirements for the Software ⇒ Any IBM compatible computer with a 486 processor or higher (Pentium 100 or higher is strongly recommended). And a hard drive with at least 50 MB free space. ⇒ CD-ROM ⇒ A VGA or compatible display, minimum resolution 1024 x 768. ⇒ 16 MB RAM (32 MB recommended) ⇒ A mouse or other pointing device ⇒ Microsoft Windows® 98SE, ME, 2000, or XP Check System Package Contents Check that your ILT900 system package contains all of the required components. Common system packages contain the following: Spectroradiometer USB 2.0 cable Fiber-optic cable and Cosine Diffuser BNC cable for trigger *Note: Package contents may vary from unit to unit and order to order. If you have any questions about the contents of your package, please contact the support team referred to in the back of this manual. 3 Introduction SpectrILight is a Windows based operating software adapted for use with ILT900 series spectroradiometers. SpectrILight is a true 32-bit application and optimized for IL spectroradiometer operation control, data acquisition, data manipulation, graphic display, and other features. This user manual will cover the software installation and the various function buttons and features. Please refer to any additional ILT spectroradiometer hardware documentation and application notes for more information on specific configurations. The SM32PRO.INI file, which is provided together with the SpectrILight, contains instrument specific model information as well as wavelength calibration information. Similarly, the ILIrrad.cal file contains information for the spectroradiometric correction of the instrument. Substitution of these files by others having inappropriate format may result in a failure in operation. The ILIrrad.txt file contains a text version of the calibration data, and is provided as a reference if desired by the user. Please contact the factory if such a file is in question. 4 Getting to Know the ILT900 Main Screen The main screen consists of a menu bar, command buttons bar, cursor value and timeline recording display area, graph control buttons bar, project and sample information area, status display area, quick access controls, and a graphic display area. The graphic display chart consists of two Y scales as well as an X-axis. The Y-axis on the left displays a relative intensity scale in A/D counts in Scope mode [see Modes discussion below] while the right Y-axis is defaulted to percentage. The maximum counts shown on the left Y-axis for a 16-bit spectroradiometer is 65,536. When in Scope mode, the X-axis display is in pixel number or in wavelength number. The maximum pixel number is 0 to 2048 for the ILT900, or it will display the desired wavelength range. 5 BASIC SPECTRAL MODES Scope Mode The ILT900 normally comes up in Scope mode, with its basic operating parameters returning to the settings in place when the program was last quit. The output of the sensor digitizer is displayed with no compensation for the relative spectral sensitivity of the CCD array. It is, therefore, not an accurate measure of the relative strengths of different spectral components, although it does provide accurate wavelength information. More importantly, it is the prime way to adjust the sensor parameters to maximize the performance of the instrument. In particular, the Integration time [ see Set-up mode] should be adjusted for a signal which does not exceed the maximum, or sensor saturation occurs. Typically a peak signal of about ⅔ maximum is a good target. Transmission/ Reflection Mode After initialization of the system (see Dark Scan and Ref Scan), the T/R mode displays the percent transmission /reflection of a material as a function of wavelength. The illuminant is taken from the Reference scan, which can be either the source illuminator or a white reflectance sample. 6 Absorbance Mode Selection of Absorbance mode displays a calculation of the same data as in T/R mode in the logarithmic Absorbance Units (Au), which are equivalent to Optical Density. Irradiance Mode This is the primary display for spectroradiometry. The Absolute power density vs. wavelength in 2 µW/cm /nm is displayed. The accuracy of this measurement is dependent upon the use of the as-delivered configuration in its nominal configuration (e.g., if the system was calibrated with a fiber and cosine diffuser, meaningful results cannot be obtained if the cosine diffuser is removed.) 7 OPERATING THE ILT900 Information Display Area The display area is located on top of the graphic display and is used for display of mouse pointer positions on X and Y axes in the current spectrum (top left), cursor bar values (middle), timeline recording progress, and memory usage (top right). Please also see Peak Finder , Timeline recording and Irradiance, for more information. Command Button Bar Most of the system operating functions can be realized by use of the command buttons. The command buttons are arranged as general control buttons with embedded pull down dialog boxes, which are opened by clicking on the little arrow on the right side of the button. If a dialog box is not available, clicking the button anywhere on its surface activates the corresponding function. NOTE: After working with any dialog boxes described in this or later sections, simply click outside of the dialog box for changes to be effective and to exit. 8 Setup The Setup function allows you to change operating parameters for the ILT900. Clicking the top right arrow can activate the pull down dialog boxes. Setup dialog box: SCOPE MODE is the default-operating mode, which enables the live updating of the measurements. The real-time aspect of this display is reminiscent of an oscilloscope. The primary data collection parameters are controlled through this mode, including: Integration Time – The exposure time in mS during which light falls on the CCD array between readout cycles. Adjusting this parameter changes the overall sensitivity of the instrument, as changing the exposure does for a camera. The minimum effective integration time is typically about 1 mS, with a practical maximum of around 10,000 mS, or 10 S per scan. Beyond this point CCD dark current variations dominate the noise. Time Average – This is the number of scans that are averaged within ILT900 hardware before being sent to the computer via the USB interface. Other things being equal, the Signal-to-Noise Ratio (SNR) of the collected spectra improves by the square root of the number N of scans averaged. For example, if 16 spectral scans are averaged, the SNR is improved by a factor of 4 over that of a single scan. Very large scan numbers can be averaged, 9 but this can easily cause total data collection times to approach 5 – 10 minutes and longer. Binning Average (Pixel) – Another parameter available for noise management is the binning control. This allows the charge from two or more pixels to be summed electronically before digitizing, and provides a way for trading reduced wavelength resolution for improved SNR in very low level signals. FFT Smoothing – Another way to improve SNR is by smoothing of the spectral data after it has been transmitted to the computer. This smoother uses an FFT algorithm to again trade wavelength resolution for SNR. The maximum parameter value is 100%. External Trigger – When this box is checked, the spectroradiometer is triggered from an external source. The lowest integration time to use during external triggering is 10ms, but the acquiring and calculation time will be more than 200ms, so the duty cycle for the external signal should be more than the integration time plus 200ms. The trigger signal should be a 5-volt TTL-compatible pulse, introduced through the TRIGGER port on the ILT900 body, normally with a standard BNC cable. The trigger occurs on the rising edge of the pulse. *Note that the trigger signal must occur more frequently than 1 Hz. The hardware does not currently respond to trigger signals less frequent, but assumes that the trigger signal has failed, times out, delivers an error message, and terminates the SpectrILight program. The issue here concerns the buildup of charge due to dark current in the CCD. MEMORY MODE will be entered automatically when a play back operation is performed. The play back of recorded spectra can be achieved by using the Import command button. To exit the repeating play back of recorded spectra, the user needs to use this dialog box to change from MEMORY MODE back to SCOPE MODE, by clicking the SCOPE MODE button which will turn red, turning the MEMORY MODE button gray. 10 PIXEL BASE display mode presents data using constant CCD pixel spacing, rather than constant wavelength spacing. For example, if Pixel base is selected and, in the Graph Control Bar (later in this manual), Wavelength Units are selected, the X-Axis will show wavelength units, but the wavelength increment is the actual wavelength difference between two adjacent sensing pixels. Since the grating dispersion of the instrument will not be linear, the result will also not be linear in wavelength. This scale is seldom important in spectroradiometric use, but Pixel base is required for maximum accuracy in Peak Finding (see subsequent topic). WAVELENGTH BASE converts the intensity-per-pixel data to a scale linear in wavelength. The display parameters for this base are the wavelength start, end, and interval. These parameters are accessed by clicking the Show Wavelength(nm) button. The values can then be changed either by using the up-down arrows or by typing into the parameter value box. GRID and COLOR of BACKGROUND allows user customization of various aspects of the spectral graphic display. 11 Dark Scan The Dark Scan function stores a background scan which will be subtracted from subsequent data scans for computing irradiance. The CCD sensor array is an integrating sensor; that is, charge is accumulated continuously in each of the CCD pixels until removed during a readout cycle. The charge desired is that due to the optical signal under observation. However, other sources also cause charge to accumulate between readout cycles, acting as a background or pedestal signal which varies slightly from pixel to pixel. There are three primary sources for dark signal: detector dark current, light scattered within the instrument, and ambient light in the test area. Usually the most important of these is detector dark current, which can be very significant for integration times of 300 mSec and longer. Every time the integration period is changed, a new Dark Scan MUST be taken. In fact, the software does not permit selection of Irradiance mode unless a Dark Scan has been taken. To conduct a dark scan, first block all light from entering the spectroradiometer, and click the Dark Scan icon (not the arrow). An hourglass icon will appear until the scan cycle is complete. Dark scan dialog box: Current Scan: The current scan option is provided to take a dark scan from the current data that is being collected. This would be the normal setting for ILT900 Irradiance operation. File: The file option allows you to save the current scan for future reference or use previously saved dark data. If File is clicked, the option to name and save a file appears. A default name is available, or a user supplied name can be typed. The file can then be stored in a selected folder using standard Windows folder selection. Alternatively, a file can be retrieved and used as the Dark Scan by clicking Load File. 12 Ref Scan This allows a reference scan to be taken, which is used in T/R% or absorbance measurement for normalization, and as the reference for colorimetric measurements. As was the case for the Dark Scan, the software also requires a reference scan to be taken in order to enter Irradiance Mode. For this purpose only, the Reference Scan can be taken also with the instrument blocked, since it is not explicitly used in Irradiance Mode. REF SCAN DIALOG BOX The pull down dialog box supports choosing the current reference scan, or a previously saved reference scan data file, in the same manner as the Dark Scan is handled. 13 Scope The Scope dialog box allows selection between any of the four spectra display modes: Scope – Shows raw input intensity in relative units. T/R % - Displays the current scan divided by the stored reference scan, typically used to show optical transmission or reflectance measurements. Absorbance – Displays the current scan divided by the reference scan in the logarithmic units of absorbance or density. Irradiance – The main display for spectroradiometry, the Irradiance mode displays the current scan as absolute power density per unit wavelength. The Scope mode select button is enabled only after the dark and reference scans are taken. Click on the button when it is enabled to change between regular scope mode, T/R%, absorbance and irradiance modes. Display dialog box: The T/R% and Absorbance modes have been previously discussed. If irradiance mode is chosen, the irradiance options for absolute or relative measurements will appear to the right of the selections. 14 Irradiance Dialog Box: There are two kinds of irradiance measurements, Absolute and Relative. The Absolute Irradiance needs to be calibrated by using one or more calibrated light sources. For the ILT900, this calibration has been done at the IL facility and is automatically installed on the target computer from the CD. This is the standard operating mode for the ILT900, and must be selected to yield calibrated results. The Relative Irradiance option is used only when an appropriate calibration is not available. Relative Irradiance levels are displayed assuming a 3000° K reference source. 15 Timeline This allows for automatic sequential spectrum recording at specified time intervals and to specified data files. The pull down dialog box allows for the entry of starting time, ending time, and recording time interval in milliseconds (ms) or seconds (s). Absolute calendar date and time are obtained from the host computer. You can choose the duration you want to collect the data by using the time duration function, or by choosing the number of scans you wish to acquire. Timeline dialog box: The Timeline button will become Ready after all timeline recording parameters are set. Click on the Set Ready button to initialize the timed recording process to record spectra within the set duration as shown in the timeline dialog box. Each successive spectrum will be stored under the name and location specified in the File Name box. When Timeline has been initialized, the button caption will read Record. Clicking the button now will start collecting scans according to the schedule defined in the Timeline Dialog Box. While recording, the button caption is changed to Pause. If the button is clicked now, the recording process will be suspended, and the recorded data will be accessible for playback. The button caption now reads Play, which initiates playback of the data. Successive clicking of the button will toggle operation back and forth between Pause and Play. To terminate Timeline recording click the dropdown arrow again. Click on the Cancel Record Process button, and recording will be discontinued. *NOTE: The progress of the recording is updated in the data display area just above the graph display area. 16 Find Peak Find Peak accesses a sophisticated polynomial fitting algorithm that can identify and locate spectral peaks or troughs with adjustable sensitivity to noise and relative peak height. In addition, it can be used to determine peak wavelength to sub-pixel accuracy. Find peak dialog box: There are two user configurable parameters in the Find Peak pull down dialog box, which are used by the auto peak finder for peak search. The peak/noise ratio or Noise multiplier is a value set between 0.0 and 100.0 at an increment of 0.1 . The higher the ratio the less sensitive the peak finder will be. The Threshold (%) can be set between 0.0 and 100.0 . This sets the height above the mean signal level that a peak must reach to be considered for measurement. To initialize Find Peak a Dark Scan must first be executed. Once the Find Peak button is initialized, peak location can be executed simply by clicking the Find Peak button. After the data display has been utilized, Find Peak can be turned off just by clicking the Find Peak button again. The Find Peak function can be utilized in three different circumstances, which are configured in the Setup Dialog Box. 17 Wavelength Base, Wavelength Unit This is the most common mode, and would be used while the instrument is set to Irradiance. In the Setup Dialog Box, the Wavelength Base button is selected, and on the Command Bar, the Wavelength Unit selection is made. When Find Peak is activated, the peak locations will be tabulated by wavelength and the peak height will be given. The accuracy of the wavelength will be that selected by the wavelength Interval chosen in the Setup Dialog Box. For example, if the Interval is taken to be 0.5 nm (the smallest available), the wavelength in the peak table will be given to the nearest 0.5 nm. 18 Pixel Base, Wavelength Unit To obtain maximum accuracy in peak location, the Setup Dialog Box is used to select Pixel Base, while the Command Bar selects Wavelength Unit. In this mode the pixel data are analyzed directly to locate the peak to sub-pixel accuracy, and these results are converted to equivalent wavelength without regard to the working wavelength increment. 19 Pixel Base, Pixel Unit If both the Pixel Base and Pixel Units are selected, Find Peak returns results in terms of pixel location. The peak is given to the nearest pixel. This mode is valuable in calibrating the instrument for wavelength, using discharge lamps or absorption standards. Tracking Cursor Bar In addition to the peak find, a tracking cursor bar tool is provided. Right click anywhere in the graphics display area and a circle with crosshair will appear with the cross hair intercepted by the spectral curve. The crosshair will stay locked to the spectral value at the selected wavelength, and the result will be displayed in the output box at the top left of the screen as Bar: data. The wavelength can be changed by single wavelength increments by using the left-right arrow keys on the keyboard. Meanwhile, the standard cross cursor remains available, and its position is shown as XY: data as usual. To disengage the Tracking Cursor Bar, Right Click the screen again. 20 Import This allows for import of previously saved data to be displayed or processed in the current application. This uses a simple dialog box comprised of 2 sections, the file box, and the load button. Import Dialog Box: The internal storage mode for SpectrILight is called Scan Data File , or .SDF . To retrieve a previously stored file, the folder browse function can be used to locate it and double-click its filename, which is then displayed in the filename box. Clicking the Load SDF File button displays this file on the screen. Export This allows export of spectral data to another program via OLE, to an Excel® file, binary data file, or to a text data file in an ASCII format. The pull down dialog box allows different file formats to be selected. Export dialog box: Text Data: When this option is chosen, the scan will be saved as a TabDelimited ASCII text file, under a filename and location chosen by the user. This is a fast and allpurpose way to save data, as it can be opened and edited in such applications as Notepad, or pasted into Excel. 21 Graph Data: The user selects the filename and location, and the current spectrum is saved as a Bitmap image in .BMP format. This is useful for creating illustrations for papers or project reports. To Excel: When this option is selected the spectral data from the current scan will be exported into a Microsoft Excel spreadsheet. Each time a scan is saved to Excel, a new Workbook is created, so it is important when saving multiple scans to name and close each new Workbook as it is completed. For Irradiance data, two columns are created containing the Wavelength and Irradiance results, respectively. The wavelength increment and the wavelength range are that set for the current display. To SpectrILight Tools: By selecting this option spectral data can be exported directly into the auxiliary Excel application SpectrILight Tools. For this to function correctly, the appropriate SpectrILight Tools app must be present in the SpectrILight application folder so that SpectrILight will find it when invoked. Once the presence of SpectrILight Tools is ensured, the To SpectrILight Tools option can be executed. The current spectral data will be exported and pasted into the 1 nm resolution input sheet of the SpectrILight Tools app. The start and finish wavelengths of the current scan will be observed and the data pasted into the correct wavelength location automatically. The Output sheet of the SpectrILight Tools app will then be displayed, showing the auxiliary analysis results. Note that the first time this is done, SpectrILight Tools will appear as the top window. Once it is opened, however, subsequent exports will overwrite the previous data in the Input sheet, and the SpectrILight Tools window will remain in the background. It must be selected as top window to be observed. Save Memory: This mode saves the spectra that have been recorded using the Timeline or Record functions, and is useful for saving and retrieving large batches of data. Grams/32 SPC: This mode saves the data in the .SPC format used by programs like Thermogalactic Grams/32. 22 Print This buttons prints a consolidated record of the current data set, including available data on the instrument itself, peak data if available, a graph of the spectrum, and so forth, depending on the type of data collected. The header information can be modified to identify each printed output using the Setup → Customize . . . menu option and the Title / Sample display input. Setup → Customize . . . Desired header entries are typed into the appropriate box. The title of the Print page can be changed by Right Clicking the Title above the graph display and typing in the desired new title. Similarly, the subtitle can be modified by Right Clicking the subtitle above the graph and entering the new subtitle. A typical print-out is shown on the next page. 23 24 Home Page If the computer has current Internet access, clicking the Home Page button will connect the user to the International Light home page using the computer’s default browser. Other Menu Functions File The File menu function accesses program exit. Calibration The Calibration menu function accesses the Wavelength and Irradiance calibration modes, but these are normally reserved for use by International Light for creating the instrument calibration files. 25 Setup The Setup menu function allows customizing the printed output as discussed above. Help The Help menu selection accesses data on the current software revision and IL e-mail. Technical information is currently available in the PDF documents included on the CD-ROM with the SpecrILight software. 26 Graph Control Buttons The Graph Control Bar is a convenient utility that puts all of your necessary graph controls at your fingertips. Zooming controls: The Zoom control buttons provide zoom Reset (R), stepped Zoom In (+), and stepped Zoom Out (-) controls. Flexible Zoom In can also be achieved by left clicking and holding the mouse button and dragging to draw a Zoom In view window inside the graphic display area around the desired area. This is a very quick and effective way to examine portions of the dataset in detail. 27 After a graph is zoomed in, two sliding bars will appear for vertical and horizontal scroll control use. Move the mouse pointer to any of the sliding bars until the pointer changes to a double arrow. Click and hold down the left mouse button and slide to view desired spectral display area in the graph. Clicking the R button does a Complete Zoom Out. X axis unit controls The display control buttons allow for the selection of spectra to be displayed in pixel (P), wavelength in nm (W) or inverse centimeters (I). The W and I display modes apply in T/R% and absorbance measurement modes only if the Wavelength Base is selected in IL Setup Dialog Box. When Pixel Base is chosen in the IL Setup Dialog Box, the W, wavelength display mode will also be available in Scope measurement mode. 28 Play back controls The play back control buttons provide control over the display of current and previously recorded spectra. This allows for continuous frame-to-frame play back of imported (recorded) spectra in a reverse sequence. This allows for play back of imported (recorded) spectra in a reverse sequence one frame at a time. This allows for the termination of continuous play back operation. This allows for play back of imported (recorded) spectra in a sequence as recorded one frame at a time. In non-recording mode, this button allows a snap spectral shot to be taken each time it is clicked. This allows for continuous play back of imported (recorded) spectra in a sequence as recorded. In non-recording mode (Scope Mode) this button serves as a resume button for continuous acquisition operation. 29 Recording Control Buttons The R control will save the current spectrum to memory. The maximum allowable number of spectra to be saved is dependent on the available memory size. After the desired spectra are recorded, the Export dialog box may be used to assign a file name for the recorded memory files for current storage and subsequent retrieval. The D control allows the current displayed spectrum to be deleted from memory manually. 30 Status Display Bar The status bar provides information regarding the performed and ongoing operations. These include dark scan status, reference scan status, color measurement status, etc. Quick Access Controls The quick access controls are located on the bottom right of the status display and provide easy adjustments to (from left to right) integration time, time average, binning, and FFT filtering settings. Move the mouse pointer to the desired controls and right click to reduce the values or left click to increase the values. Graph Sliding Bar Controls There will be two sliding bar controls for vertical and horizontal scroll use when a zoom in tool is applied to the spectral display. Click on the sliding bar with the mouse pointer and hold down while sliding to view different parts of the spectrum. 31 Colorimetry Color Tab After the dark and reference scans are performed, the Color Tab will be enabled. Clicking on the Color tab will enter the color measurement mode. However, the color measurement mode will only be meaningful for spectroradiometers configured for visible wavelength coverage. Furthermore, these measurements apply to reflected or transmitted color only, not analysis of emitted light. To exit the Color mode click on the Spectra tab. Color Analysis Mode The Color Analysis Mode, as a default, will measure and display color results in the main color screen. The Stop button may be used for obtaining a snap shot and the view of the color values. 32 Color Button Bar The color button bar actuates the tool set relevant to colorimetric analysis. The Dark Scan and Ref Scan buttons perform the same functions as on the Main Screen. The others are specific to Color Mode. Setup Setup chooses the reference conventions employed in the color calculations. Setup Dialog Box: The Setup dialog box allows choices among standard illuminant definitions (e.g., D65), CIE observer definitions for color space calculations (2° and 10 °) and the % reflectance of the white reference, for reflectance calculations. Stop The Stop-Start button freezes the data capture process and provides a datalist of color and reflectance parameters for that scan. 33 Dark Scan The Dark Scan button functions here in the same way as it does in other modes. Ref Scan In Colorimetry mode, the reference scan button is used to define the meaning of white to the color calculation algorithms. Typically a reference white card is placed in front of the spectroradiometer receptor in the location of the object whose color is to be measured. The source lighting for the color measurement is switched on, and a Ref Scan is obtained. This will now be used as the white reference definition for subsequent reflectance color measurements. 34 Export The export button will store a table of color data identical to that displayed above after a Stop action. Export Dialog Box The Export Dialog box provides a way to establish a filename and location for a table of color values derived from the current scan. The file is in simple ASCII .txt. An example is shown below. Illuminant = D65 Observer = CIE 1931 (2 degree) 10nm interval from 400nm to 700nm X= 89.03 Y= 94.30 Z= 94.74 x=0.3202 y=0.3391 z=0.3407 L*= 97.75 a*= -1.09 b*= 5.19 L*= 97.75 u*= 1.74 v*= 8.13 L*= 97.75 C*= 5.30 h*= 1.78 HL*= 97.11 Ha*= -1.11 Hb*= 8.67 Wavelength(nm) 400.00 410.00 420.00 430.00 440.00 450.00 460.00 470.00 480.00 490.00 500.00 510.00 520.00 530.00 540.00 550.00 560.00 570.00 580.00 590.00 600.00 610.00 620.00 630.00 640 00 Reflectance(%) 77.25 79.83 81.05 82.94 86.15 87.16 88.08 89.44 89.75 90.09 90.93 92.12 93.28 94.18 94.52 94.86 94.88 95.06 95.27 95.67 95.74 95.76 95.89 96.10 96 07 35 Color The Color button allows specific reference values to be used for the L* a* b*output. Color Dialog Box: a fairly faithful dupli The pull down dialog box on the top right of the Color command button provides options for the delta E data source. When the Select Data option is checked reference L*a*b* values can be entered into the dialog box. The delta E values in the color value display window will now be the color difference between the current measurement results and the entered values. Otherwise, the delta E values displayed will represent the color difference between the current and the previous measurements. Print In Color mode the Print command prints a report on the colorimetric values associated with the current scan, analogous to the report produced by this command in Spectra mode. A typical report is reproduced on the following page. Color Rendition The color rendition box displays an attempt by the software to render the color calculated by the analysis tools. If the measured spectrum is bright enough, this box shows a fairly faithful re-creation of the incident color. 36 37 Appendix I. Changing the Maximum Irradiance The default maximum irradiance on the graph display is pre-set at the factory according to the data given to IL on the intended application of the particular ILT900 configuration delivered. Occasionally a user may wish to measure higher maximum irradiances than originally envisioned, so that the default setting must be changed. This can be done by the user using the following procedure: There are three files in the software package which are unique to each instrument: ILIrrad.cal, ILIrrad.txt and SM32pro.ini The SM32pro.ini file is text and contains the setup parameters that define the default behavior of the instrument. To access this file, the user must navigate down to the file folder in the Windows Programs folder containing it. A typical path would be (assuming the main hard drive is C: ) C:\Program Files\International Light, Inc\SpectrILight\SM32pro.ini The contents of a typical SM32pro.ini file looks like: [Options] Ver=2.828 Mode3=Irradiance SpectrILight Tools=SpectrILight Irradiance Tools v 1-2.xls AlwaysCreateExcel=no [Extend Options] Board=USB TimeAV=10 BinningAV=0 FFT=0 IntTime=100 IntervalWL=1.00 StartWL=220.00 EndWL=1050.00 Device=1 Channel=0 Gain=2 ADRange=1 ColorTemp=3000.00 Title=ILT900-R 1 cm2 Aperture SubTitle=SM240IM0P1974-EU BadPixels=39 166 NoiseRatio=4.00 NoiseLine=0.50 InitSet=537505925 38 NoiseCutoff=2 CalNo=1 Base=768 InitColor=2 RefWhite=100.00 InitPane=12 Priority=1 IrradDist=100 PixelFlip=0 InitOption=3 PixelColor=255 TransColor=9109504 AbsorbColor=37632 IrradColor=8519755 BackColor=14745599 NoiseHighLow=0 MaxA=5.0 MaxI=100.0 [Hg-Ar Line] LineCount=38 Line 1=1849.5 Line 2=2536.5 Line 3=2967.3 Line 4=3021.5 Line 5=3131.6 Line 6=3341.5 Line 7=3650.1 Line 8=4046.6 Line 9=4077.8 Line 10=4358.4 Line 11=5460.8 Line 12=5769.6 Line 13=5780.2 Line 14=5790.7 Line 15=6965.4 Line 16=7067.2 Line 17=7147.0 Line 18=7272.9 Line 19=7384.0 Line 20=7503.9 Line 21=7514.7 Line 22=7635.1 Line 23=7724.0 Line 24=7948.2 Line 25=8006.2 Line 26=8014.8 Line 27=8103.7 Line 28=8115.3 Line 29=8264.5 Line 30=8406.2 Line 31=8424.6 Line 32=8521.4 Line 33=8667.9 Line 34=9123.0 Line 35=9224.5 39 Line 36=9354.2 Line 37=9657.8 Line 38=9764.5 [SM240] NI=6023 Pixel=2080 Timer=252 BulkOrIso=0 MinIntTime=1 [SM250] Interface=PPI Base=0x378 Reg_Offset=0x00 PP_Repeat=1 Cable=SHORT Data_Bits=16 Sensor=CCD Mode=0x8 Test=0x6 Shutter_Speed=dual Shutter_Bits=0x08 MaxBinX=8 MaxBinY=63 Guider_Relays=True Columns=688 Rows=513 Imgcols=659 Imgrows=494 BIC=16 BIR=16 HFlush=8 VFlush=50 SkipC=4 SkipR=2 hbin=1 vbin=63 Control=True Target=-10.00 Cal=165 Scale=2.1 sensor = ICX084AL Color=False Noise = 10 Gain = 2 PixelXSize = 7.4 PixelYSize = 7.4 [SM260] ComPort=0 Speed=2400 Parity=2 DataBit=8 StopBit=0 FlowControl=0 40 [SM301] TempCal=200 TempCal0=-3.811798337914 TempCal1=3462.920020089 TempCal2=-20698.96463541 TempCal3=-8267379.296770 OffVolt=0.7 Gain=2 Pixel=256 TEC=1 CAP=2 [Factory Default] Date=04/08/2005 08:07:51 Name=240-IMOP1974-EU PointCount=9 Data 1=2537;242 Data 2=3132;359 Data 3=3650;461 Data 4=4047;538 Data 5=4358;597 Data 6=5461;805 Data 7=6965;1082 Data 8=7635;1203 Data 9=8115;1289 BaseAddress=768 IntegrationTime=35 [Cal 1] Date=04/08/2005 08:07:51 Name=240-IMOP1974-EU PointCount=9 Data 1=2537;242 Data 2=3132;359 Data 3=3650;461 Data 4=4047;538 Data 5=4358;597 Data 6=5461;805 Data 7=6965;1082 Data 8=7635;1203 Data 9=8115;1289 BaseAddress=768 IntegrationTime=35 -------------------------------------------------------------- At the bottom of the first batch of parameters in this list is the line: MaxI=100.0 This sets the Maximum Irradiance to 100.0 microWatts/cm2 nm . 41 To increase the full scale default, change this to the desired maximum, as: MaxI=500.0 and save the file. Now, when Irradiance mode is accessed, the window will open up to 500 microWatts/cm2 nm full scale, instead of the prior 100 microWatts/cm2. Note that, even if data in the graph display exceeds the screen default maximum, use of the Export button to send the data to a text or Excel file will result in an accurate data record and will not be truncated or otherwise adversely affected by the display parameters. (It will, however, export only the wavelength region set by the software). 42 Appendix II. Systems with Multiple Calibration Files. Some ILT900 systems are delivered with multiple receptors designed for different types of measurements (e.g., a Cosine Receptor for irradiance measurements and an integrating sphere for total power measurements). In order to ensure that the calibrations for each configuration are associated with the proper set-up, IL provides a complete software install disk for each calibration type. To switch from one receptor to another, the install CD for the desired receptor is used to re-install the software using the correct calibration. The advanced user may avoid this effort by the following means: Navigate to the folder : C:\Program Files\International Light, Inc\SpectrILight To get there using the standard Windows folder system, do the following: From the Desktop, double-click My Computer Double-click Local Disk (C:) (or whatever the main disk is) Double-click Program Files Click Show Files Double-click International Light, Inc Double-click SpectrILight Visible are a dozen or so files, including ILIrrad.cal . The goal is to move the current copy of this file to a folder unseen by SpectrILight and replace it with the desired calibration file. One way to do this is to create a New Folder called, say, COSINE (if the current file is for the Cosine Receptor), and put the file ILIrrad.cal into this folder. At this time it would be appropriate to create other New Folders, with appropriate names such as SPHERE to accommodate any other cal files received with the instrument. Now the desired .cal file must be accessed. Insert the CD with the Sphere version of the software into the drive, and when InstallShield tries to start, click Cancel. Again, from the Desktop, double-click My Computer This time, locate the Compact Disc image (it will have a name like 050620_1743 (E:)), and right-click the icon. An option box drops down; select Explore. 43 The disk opens. Double-click program files Double click International Light Double click SpectrILIght Among the files seen is the pertinent copy of ILIrrad.cal . Copy this file to the folder SPHERE previously created on the hard drive. Now in order to switch from one optic to the other, move the unneeded ILIrrad.cal to its new home, and move the correct ILIrrad.cal into its place in the SpectrILight folder. As a final convenience, create a shortcut to the SpectrILight folder and place it on the Desktop. Thereafter, double-click Shortcut to SpectrILight and jump directly to the folder needed for swapping calibrations. If the two ILIrrad.cal files ever become irretrievable confused, the user can always recover by re-copying from the original CD's. 44 Technical Support Tel: Fax: Website: Email: (978) 818-6180 (978) 818-6181 www.intl-lighttech.com [email protected] To help us serve you most efficiently, please collect some information for us before you call: 1. A detailed description of your problem 2. The specific error or error message you received 3. Your system information; a. Software version b. Version of Windows (98, ME, 2000, XP, etc.) c. Unit Serial Number Our technical staff can be most effective if you are sitting at the computer while consulting technical support. 10 Technology Drive Peabody, MA 01960 978-818-6181 www.intl-lighttech.com 45