1
F i s h e r
Pulp&Paper Worldwide
TM
USER’S
MANUAL
Version 4.1
© 1986-1999 by Fisher International, Inc. All rights reserved.
Fisher Pulp&Paper Worldwide, Account Viewer, and Analyzer are trademarks of
Fisher International, Inc.
Corel Paradox is a trademark of Corel Corporation.
Microsoft, Microsoft Access, Microsoft Office, and Microsoft Excel are registered
trademarks of Microsoft Corporation. Windows is a trademark of Microsoft
Corporation.
Novell Netware is a trademark of Novell, Inc.
All other trademarks are the properties of their respective owners.
Table of Contents
Introduction
About Fisher International
About Fisher Pulp&Paper Worldwide
The Program at a Glance
About This User’s Manual
Chapter 1 — Installation
Overview
Standalone Installation
Network Installation
Chapter 2 — The Basics
Opening the Program
An Overview of ACCOUNT VIEWER
ACCOUNT VIEWER: The Basic Moves
Printing Reports
Chapter 3 — ACCOUNT VIEWER
ACCOUNT VIEWER: an Overview
Getting General Information
Getting Production Information
Getting Equipment Information
Chapter 4 – ANALYZER
ANALYZER: an Overview
Basic Options
Putting ANALYZER to Use
Creating a List
Graph Options
Creating Tables and Graphs
Creating a Mailing
Chapter 5 — Exporting and Linking
Exporting from ANALYZER
Linking FPWW Tables with Microsoft Access
Appendix
Links between Tables
Table Descriptions
Cost Component Definitions
Index
1
3
4
5
6
7
9
10
12
15
17
18
19
22
25
27
28
35
42
51
53
54
55
57
60
62
64
77
79
80
83
85
86
87
88
1
INTRODUCTION
About Fisher International, Inc.
About Fisher Pulp&Paper WorldwideTM
About This User’s Manual
FISHER PULP&PAPER W ORLDWIDE USER’S MANUAL
2
FISHER PULP&PAPER W ORLDWIDE USER’S MANUAL
3
About Fisher International, Inc.
Fisher International, Inc. is a marketing services and support company whose
mission is to help decision makers in the pulp & paper industry access, manage,
and put to strategic and tactical use high quality, in-depth marketplace
intelligence.
Founded in 1985 and based in South Norwalk, CT, Fisher International directs its
products and services toward pulp and paper mill suppliers who are seeking to
market their products and services with greater precision and greater efficiency.
Fisher International’s consistent ability over the past 15 years to anticipate and
meet the needs of its clients is built around four key factors: (1) its deeply-rooted
experience in the pulp and paper industry; (2) the overall marketing expertise of
its principals; (3) its company-wide commitment to customer service; and (4) a
proprietary research and software engineering process that transcends the
limitations of conventional databases and other information sources.
FISHER PULP&PAPER W ORLDWIDE USER’S MANUAL
4
About Fisher Pulp&Paper Worldwide™
Fisher Pulp&Paper Worldwide (FPWW) is the pulp and paper industry’s most
powerful and authoritative information resource. It provides instant access to indepth, highly accurate information about every pulp and paper mill in North
America and virtually every mill elsewhere in the world that is producing at least
50 tons of paper per day.
But more from being simply a storehouse of critical market intelligence, FPWW is
a strategic business tool that can be used to perform a multitude of strategic and
tactical functions, including the following:
•
Track market share data (past and present) in virtually every purchasing
segment of the paper and pulp and industry
•
Create highly targeted, highly accurate mailing lists
•
Define sales territories
•
Gather complete data on all mills in which company products are installed
•
Identify after-market potential in mills throughout the world
•
Identify those mills whose equipment history and status make them likely
prospects for upgrades
•
Gather targeted data for sales presentations and proposals
(Note: This manual focuses exclusively on the technical aspects of FPWW—how
you actually run the program. Information about the strategic and tactical uses of
the program is available through other sources. To find out more, call 1-203-8545390.)
FISHER PULP&PAPER W ORLDWIDE USER’S MANUAL
5
The Program at a Glance
FPWW has been expressly designed to help you access the information you
need quickly and easily, regardless of how familiar you are with either computers
or databases. The more you know about the pulp and paper industry, of course,
the more you will able to do with the program and its many features. But FPWW
users with even minimal knowledge of the paper and pulp industry can still run
key functions. Some features of the program you should know about:
•
Menu-Driven. FPWW is a menu-driven program. The navigation choices
are clearly identified on each screen, and each option you click on
produces a new screen or drop-down menu that lets you choose what
you want with a simple click of the mouse.
•
Pulp and paper industry specific. FPWW was created by specialists in
the pulp and paper industry. The program uses standard industry
terminology to describe all aspects of mill activity, including paper grades
and paper machine components.
•
Flexible. FPWW allows you to add your own information (e-mail
addresses, personal data about individual clients, etc). in designated
fields, as a supplement to the information that is already there. This
information is not affected by our periodic updates.
FISHER PULP&PAPER W ORLDWIDE USER’S MANUAL
6
About This User’s Manual
We’ve worked very hard to make Fisher Pulp&Paper Worldwide so user-friendly
that you don’t really need a detailed manual to take advantage of most of its
many features. We hope that the instructions we’ve supplied in this user’s
manual will answer any remaining questions you may have.
But in the event you run into a problem or have any question about the program
don’t hesitate to call Fisher International, Inc. Customer Support, at 1-203-8545390. Remember, your license agreement includes unlimited customer phone
support.
FISHER PULP&PAPER W ORLDWIDE USER’S MANUAL
7
1
INSTALLATION
Overview
Standalone Installation
Network Installation
FISHER PULP&PAPER W ORLDWIDE USER’S MANUAL
8
FISHER PULP&PAPER W ORLDWIDE USER’S MANUAL
9
Overview
The Fisher Pulp&Paper Worldwide (FPWW) program can be installed on either a
standalone machine or a network. A standalone installation sets the program up
on the hard drive of an individual machine. A network installation allows users to
access the program via a local area network and makes it possible for queries
and your data entries (additional contact names, sales territories, etc.) to be
shared.
FISHER PULP&PAPER W ORLDWIDE USER’S MANUAL
10
Standalone Installation
Before installing the program from the CD-ROM, you should check to see
whether your computer meets the minimum requirements. If you have any
questions about a standalone installation, feel free to call Fisher International,
Inc. Technical Support at 1-203-854-5390.
SYSTEM REQUIREMENTS
•
Operating System: Microsoft Windows 95, 98 or NT
•
RAM: 16Mb of memory
•
Hard Disk space: Requires between 30 and 130 megabytes of free
space, depending on the number of information modules you have
purchased.
INSTALLATION INSTRUCTIONS
Here are the steps:
1. Insert CD-ROM into the proper drive.
2. Select “Start” on your Windows desktop and scroll to “Run.”
3. Type in the letter of the CD-ROM drive, followed by a colon,
backslash, and “Setup.exe” (Example: D:\setup.exe).
Note: The default installation drive is C:\fp, but you can place the
program wherever you want by assigning a different drive letter and
folder.
4. Follow the installation instructions on the screen.
5. When prompted, select “Standalone Installation.”
FISHER PULP&PAPER W ORLDWIDE USER’S MANUAL
11
INITIALIZING THE SYSTEM
The first time you open FPWW, the program will need to go through an
initialization process. This process should take only a few minutes.
SELECTING MEASUREMENT PREFERENCES
You will have the option to choose how you want to view all measurements in the
database. Your choices are: American units or Metric units.
Note: You can switch between measurement systems at anytime. Simply go to
the OPENING MENU and click on the American/Metric Conversion button.
FISHER PULP&PAPER W ORLDWIDE USER’S MANUAL
12
Network Installation
FPWW is compatible with all standard LAN software, including Novell Netware,
Windows NT, IBM LAN server, MS Lan Manager, and Peer-to-Peer Networks. If
you or your network administrator has any question about network installation,
feel free to call Fisher International, Inc. Technical Support at 1-203-854-5390.
SYSTEM REQUIREMENTS
•
Operating System: Microsoft Windows 95, 98 or NT
•
RAM: 16Mb of memory
•
Hard Disk space: Requires between 30 and 130 megabytes of free
space, depending on the number of information modules you have
purchased.
•
User’s rights: All users must have “read/write/create” rights to the
directory in which you install FPWW.
INSTALLATION INSTRUCTIONS
Network installation procedures are similar to a standalone installation, the main
difference involve configuration procedures and setting up individual
workstations. Here are the steps:
1. Run “set up” program.
You access the “set up” program by doing the following:
•
Insert CD-ROM into the proper drive.
•
Select “Start” on your Windows desktop and scroll to “Run.”
•
Type in the drive letter, followed by a colon, backslash, and
“setup.exe” (Example: D:\setup.exe).
•
Follow installation instructions on the screen.
•
When prompted, select “Network Installation” and indicate the
directory location.
FISHER PULP&PAPER W ORLDWIDE USER’S MANUAL
13
Installation Instructions, cont.
2. Configure BDE
When you’re given the screen instruction, “Configure BDE” you need
to map the network drive.
Here are the steps:
•
When asked to configure BDE, click on “Drivers,” and then on
“Native.”
•
Select Paradox.
•
In the field labeled “Net Dir,” type in the name of the drive and
directory where you have installed the program, followed by
“\net.” Example: P:\FP\net
3. Set up individual workstations.
The final step in the network installation is setting up individual
workstations. Here are the steps:
•
Run “setup.exe” from the network location where FPWW is
installed.
•
Follow the steps outlined on the screen.
•
When the system asks for a directory for storing temporary
faults, choose between default (c:\fp) or type in your own
location
FISHER PULP&PAPER W ORLDWIDE USER’S MANUAL
14
FISHER PULP&PAPER W ORLDWIDE USER’S MANUAL
15
2
THE BASICS
Opening the Program
An Overview of ACCOUNT VIEWERTM
ACCOUNT VIEWER: The Basic Moves
Printing Reports
FISHER PULP&PAPER W ORLDWIDE USER’S MANUAL
16
FISHER PULP&PAPER W ORLDWIDE USER’S MANUAL
17
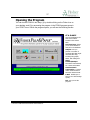
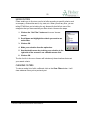
Opening the Program
You can launch FPWW in two ways (1) by double-clicking on the Fisher Icon on
your desktop; and (2) by accessing the program in the FPWW program group in
your START menu. When the program opens, you will see the following screen:
AT A GLANCE
Here are explanations for
each of the buttons
located on the OPENING
MENU:
Account Viewer. Allows
you to access details on
each mill in the database.
Analyzer. Lets you
perform in a matter of
moments tasks that might
otherwise take days,
including lists, graphs,
tables, and mailing lists.
About
FisherPulp&Paper.
Gives Fisher International,
Inc. contact information.
American Metric
Conversation. Converts
metric measurements to
American measurements.
E-Mail. Enables you to
send us an e-mail message
quickly.
Exit. Lets you exit the
program.
FISHER PULP&PAPER W ORLDWIDE USER’S MANUAL
18
An Overview of ACCOUNT VIEWERTM
ACCOUNT VIEWER is the “gateway” to the database. It gives you instant access to
in-depth information about all the mills that are profiled in the database.
ACCESSING ACCOUNT VIEWER
You access ACCOUNT VIEWER by pressing the Account Viewer button on the
OPENING MENU. Doing so will produce the following screen:
AT A GLANCE
Here is an explanation of the
three sections of the
ACCOUNT VIEWER main screen:
Navigation Section (top)
Enables you to move
efficiently throughout the
listing of mills.
Mill Listing (center) Lists
all mills in FPWW. This is
where you select a mill that
you want to find additional
information about. It lists:
§
Site Code. The
number we assign to
each mill.
§
Company. Mill owner.
§
Site Name. Mill name.
§
City, State, Country.
Location.
Information Groups
(bottom) Brings you
detailed information on a
mill.
FISHER PULP&PAPER W ORLDWIDE USER’S MANUAL
19
ACCOUNT VIEWER: The Basic Moves
As long as you are in ACCOUNT VIEWER, you can access every mill in the
database. Once you’ve selected an individual mill (you click on the line to
highlight it), you’re able to look within that listing to get the information you’re
seeking.
ACCESSING MILLS
You can access mills with ACCOUNT VIEWER in two ways: with your mouse or with
the cursor keys on your keyboard. You can use the keyboard cursor keys to
move up and down and side to side in the mill listings (much as you would with
any spreadsheet). But to call up information and move from menu to menu, you
will need to use the mouse.
Using the arrow buttons
The Arrow Keys (in the upper left-hand corner of the ACCOUNT VIEWER screen)
operate much like the cursor keys on your keyboard. You can use them to move
quickly or deliberately up and down the list. Here’s what the keys do:
<
<<
<
>
>>
>
Move to the top of the list
Move quickly to the top of the list
Move slowly to the top of the list
Move slowly to the bottom of the list
Move quickly to the bottom of the list
Move to the bottom of list
Using scroll bars
The Scroll Bar at the far right of the screen allows you to move up and down the
list of mills quickly by using your mouse.
Field headers and alphabetizing
The Field Headers are located in the green bar running horizontally across the
middle top of your screen. To alphabetize the contents of any of the columns,
simply click on any of the green column headers. The square you click on will
turn yellow, and the contents of that column will be sorted.
FISHER PULP&PAPER W ORLDWIDE USER’S MANUAL
20
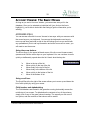
USING LOCATE
LOCATE is the most efficient way to access an individual mill. Here are the steps:
1. Click on the “Locate” button in the top row of ACCOUNT VIEWER.
2. Choose the search category (city, state, etc.)
Use the downward arrow located in the field box to select from the list of
choices.
3. Type in the name or number you are searching
for (i.e. name of city, state, mill).
You can use a partial word in your search as well.
To do this, type the first few letters of the word
followed by two periods. (Atla.. for Atlanta)
4. Click on OK.
The first mill in the listing that meets your search value will be highlighted
in gray.
If more than one mill in the database meets your specs, you locate the next mill
by clicking on Locate Next.
FISHER PULP&PAPER W ORLDWIDE USER’S MANUAL
21
USING FILTERS
Filters enable you to fine-tune your list of mills according to specific criteria, such
as company, division/site name, city, state, etc. When you set any filter, you are
telling FPWW that you’re looking for only those mills that fall into one of the
categories that you have used as your filter criteria. Here are the steps:
1. Click on the “Set Filter” button on ACCOUNT VIEWER
screen.
2. Scroll down and highlight the criteria you want to use
as the filter.
3. Click on OK.
4. Make your selection from the option box.
5. Use the double arrow key to bring your selection to the
right side of the screen or use a double mouse click.
6. Click on OK.
The list of mills in ACCOUNT VIEWER will include only those locations that meet
your search criteria.
CLEARING FILTERS
To view an entire list of mills, unfiltered, click on the Clear Filters button. It will
clear whatever filters you’ve previously set.
FISHER PULP&PAPER W ORLDWIDE USER’S MANUAL
22
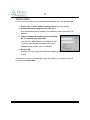
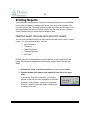
Printing Reports
The information that appears on screen can be printed anytime you see a Print
button, and will appear in a report-style format. You have several options. The
two main options are (1) printing from any screen that offers you the option or (2)
selecting reports from a list of choices directly from the main ACCOUNT VIEWER
screen without having to select the mills ahead of time.
PRINTING SELECT PROFILES FROM ACCOUNT VIEWER
You can print information profiles of mills directly from the main ACCOUNT VIEWER
screen. You have several options, such as:
•
Mill information
•
Personnel
•
Paper Production
•
Pulping Equipment
•
Mill Costs
FPWW gives you a choice between printing profiles on the current mill in the
listing (the mill that is highlighted) or selecting a group of mills. Here are the
steps:
1. Click on the “Print” icon from the main ACCOUNT VIEWER screen.
2. Choose whether you want to print reports for one mill or for many
mills.
If you select “Only the Current Mill,” you will print
reports for the mill you have highlighted on the main
ACCOUNT VIEWER screen. If you select more than
one mill, a special screen will appear enabling you
to make your choice.
FISHER PULP&PAPER W ORLDWIDE USER’S MANUAL
23
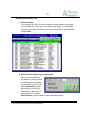
Printing Select Profiles, cont.
3. Select the mills.
You can select the mills, for which you want to print reports, in two ways:
(1) by clicking the “YorN” (yes or no) field on any listing; or (2) by double
clicking on any field in the listing. You can also find mills on this screen by
using Locate.
4. Select the kind of report you want to print.
Once you have made your
mill selection, you’ll be asked
to select the kinds of reports
you would like to print. If you
select All Reports, you will
get a print out of all of the
information on that mill in a
report format. If you select
Select Reports, you’ll be able to choose individual reports.
FISHER PULP&PAPER W ORLDWIDE USER’S MANUAL
24
FISHER PULP&PAPER W ORLDWIDE USER’S MANUAL
25
3
ACCOUNT VIEWER
ACCOUNT VIEWER: an Overview
Getting General Information
Getting Production Information
Getting Equipment Information
FISHER PULP&PAPER W ORLDWIDE USER’S MANUAL
26
FISHER PULP&PAPER W ORLDWIDE USER’S MANUAL
27
ACCOUNT VIEWER™: an Overview
Once you’ve located a particular mill, you’re now in a position to look at detailed
information on that mill. As you can see from the menu below (the lower portion
of ACCOUNT VIEWER), the information has been organized into a series of
individual modules. By clicking on any of the buttons below, you will call up
screens with more detailed information.
The pages that follow will give you a glimpse of the screens that come into view
and what information you will find—when you click on any of the above buttons.
FISHER PULP&PAPER W ORLDWIDE USER’S MANUAL
28
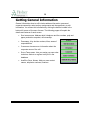
Getting General Information
General information about a mill includes address information, personnel,
corporate ownership, sales territory assignments and the opportunity to edit
information. You access this information by clicking the buttons located in the
bottom left corner of ACCOUNT VIEWER. The following pages will explain the
details and features of each screen.
•
SITE INFORMATION. Address detail, telephone and fax numbers, pulp and
paper production snapshot, mill ownership.
•
PERSONNEL. Key decision makers, titles, areas of
responsibilities.
•
CORPORATE INFORMATION. Information about the
corporate owner of the mill.
•
SALES TERRITORIES. Lets you assign your own sales
territories, districts or regions to any mill in the
database.
•
ADD/EDIT SITES, NAMES. Add your own contact
names, telephone numbers, locations.
FISHER PULP&PAPER W ORLDWIDE USER’S MANUAL
29
Site Information
The SITE INFORMATION screen provides a general snapshot of the mill—the
“who,” “what,” and “where.” Clicking on the Site Information button, located at
the bottom left of the main ACCOUNT VIEWER screen, after you have highlighted a
mill will produce a screen that looks as follows.
AT A GLANCE
SITE INFORMATION provides you
with the following information:
FISHER PULP&PAPER W ORLDWIDE USER’S MANUAL
§
Mailing and shipping
address
§
Site number (A number
we assign each mill)
§
Ownership
§
Phone numbers
§
Mailing address
§
Shipping address
§
Type of mill
§
Year built
§
Estimated sales
§
Pulp grades produced
§
Paper grades produced
30
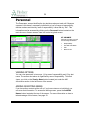
Personnel
The PERSONNEL screen identifies the key decision-makers at each mill. Because
a person’s title doesn’t necessarily indicate his or her full range of responsibility,
decision makers are listed by “area of responsibility” rather than by “title”. This
information can be accessed by clicking on the Personnel button located on the
main ACCOUNT VIEWER screen. Here is a look at a typical screen:
AT A GLANCE
PERSONNEL provides you with
the following information:
§
Responsibility
§
First and Last Names
§
Title
§
Name of Line
VIEWING OPTIONS
You can view personnel in two ways: (1) by area of responsibility and (2) by last
name. The screen shot above is organized by area of responsibilty. To switch
views, you click on the View by Name button located just under the Mill
Information section in the left-corner of the screen.
ADDING OR EDITING NAMES
If you have other contacts at the mill or if you have notes on an individual, you
can enter that information. To access the editing screen, press the Add/Edit
Names button located at the top of the screen. For more information on how to
take advantage of this feature, see page 33.
FISHER PULP&PAPER W ORLDWIDE USER’S MANUAL
31
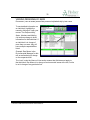
VIEWING PERSONNEL BY NAME
PERSONNEL (VIEW BY NAME) screen lists personnel alphabetically by last name.
To see detailed information on
an individual, highlight the
name by clicking on it with your
mouse. The Responsibility,
Notes, Numbers and Mailing
List sections change to show
information for that individual. If
an individual is in charge of
more than one area, they will
have multiple responsibilities
listed.
Example: Dan Moore is the
Environmental Manager for this
mill as well as being in charge
on the corporate level.
The “xxxx” under the Name of Line section means that field does not apply to
that individual. Dan Moore is in charge of environmental issues at the mill, but he
is not in charge of any particular line.
FISHER PULP&PAPER W ORLDWIDE USER’S MANUAL
32
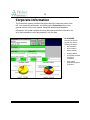
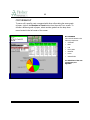
Corporate Information
The CORPORATE screen provides information about the corporate owner of the
mill. You access this information, by clicking on the Corporate button in the
general column of ACCOUNT VIEWER. Along with address and telephone
information, this screen compiles the pulp and paper production information for
all of that corporation’s mills and presents it in a pie chart.
AT A GLANCE
CORPORATE INFORMATION
provides you with the
following information:
§
Mill information
§
Phone numbers
§
Mailing address
§
Shipping address
§
Pulp grades produced
throughout
corporation
§
Paper grades
produced throughout
corporation
FISHER PULP&PAPER W ORLDWIDE USER’S MANUAL
33
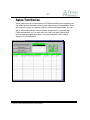
Sales Territories
SALES TERRITORIES is a unique feature of FPWW that allows you to integrate your
own sales territory information with the information stored in the database. Once
you have set up your own regions, districts, territories and distributors, you can
call up information specific to each of these designations. If you need help,
Fisher International, Inc. can work with you to set up a highly efficient and
focused sales management system. For more information, call Customer
Support, at 1-203-854-5390.
FISHER PULP&PAPER W ORLDWIDE USER’S MANUAL
34
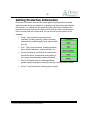
Adding or Editing Sites and Names
One of the most power features of FPWW is the opportunity it gives you to
integrate your own information into the database. This information will not be
affected when you install our semi-annual updates.
The steps below explain how to edit personnel and site information. If you have
selected Add/Edit from either the MILL INFORMATION or PERSONNEL screen, start
with step number 3.
1. Working from ACCOUNT VIEWER, highlight the mill whose information
you want to edit or add to.
2. Click on “Add/Edit Sites, Names” button.
This button is located in the bottom left of the
screen.
3. Make “edit” selection from top menu
buttons.
You have three choices:
•
•
•
Address Detail. Change address
information, add a new site.
Edit Name. Add direct
telephone numbers, mailing lists
or areas of responsibility.
Insert Name. Add a new name
to the database.
4. Make selection from top menu
buttons on the next screen.
Example: insert name
5. Input information in the
appropriate categories.
If you want to add a telephone
number, mailing list or area of responsibility, click on the add button
beneath the section.
6. Select “Leave Edit.”
FISHER PULP&PAPER W ORLDWIDE USER’S MANUAL
35
Getting Production Information
Production information about a mill includes paper and pulp production details,
water and waste usage and treatment, comparison cost information and historical
price figures. You access this information by clicking the buttons located in the
second column form the left at the bottom of the main ACCOUNT VIEWER screen.
Here’s a closer look at the information you can access from this section of the
database.
•
PAPER. Type of paper being produced on
machines, including capacity, grade information,
bleach status, original supplier, year, speed, width,
trim, etc.
•
PULP. Type of pulp produced, including bleached
status, bleach sequence, yearly production, etc.
•
W ATER AND W ASTE. Information on both influent
and effluent water, process and cooling water in
mill, primary and secondary treatment methods.
•
COSTS. Estimated costs of producing different
grades of paper, and relative ranking in industry, including cost breakouts.
•
PRICES. Trend analysis for various grades of paper.
FISHER PULP&PAPER W ORLDWIDE USER’S MANUAL
36
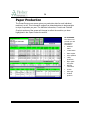
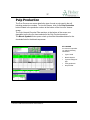
Paper Production
The PAPER PRODUCTION screen gives you production data for each individual
machine in a mill. This information ranges from bleached status to basis weights
to days of operation per year. The Machine Information, Furnish and Finished
Products sections of the screen will change to reflect the machine you have
highlighted in the Paper Production section.
AT A GLANCE
PAPER PRODUCTION
provides you with
the following
information:
§
Bleached
status
§
Coated status
§
Basis weights
§
Days operated
§
Yearly
production
§
Major grade
and grade
§
Machine
information
§
Furnish
§
Fiber type
§
Finished
products
FISHER PULP&PAPER W ORLDWIDE USER’S MANUAL
37
Pulp Production
The PULP PRODUCTION screen details the type of wood or pulp used in the mill,
including production numbers. To view this screen, click on the Pulp Production
button located in the production column at the bottom of the ACCOUNT VIEWER
screen.
The Pulp Line and Recycled Fiber sections, at the bottom of the screen, are
dependent on the line you have selected in the Pulp Production section.
The Bleach Symbols button opens a look up chart that lists abbreviations for the
chemicals listed in the bleach sequences.
AT A GLANCE
PULP PRODUCTION provides
you with the following
information:
FISHER PULP&PAPER W ORLDWIDE USER’S MANUAL
§
Type of wood
§
Bleach sequence
§
Type and subtype of
pulp
§
Yearly production
§
Recycled fiber
38
Water and Waste
The W ATER AND W ASTE screen tracks water usage and sludge production, and
also lists treatment methods. To access this screen, click on the Water and
Waste button located at the bottom of the ACCOUNT VIEWER screen.
AT A GLANCE
WATER AND WASTE provides you
with the following information:
§
Mill section
§
Source/destination
§
Volume
§
Treatment type and
description
FISHER PULP&PAPER W ORLDWIDE USER’S MANUAL
39
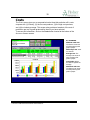
Costs
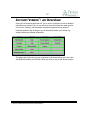
The COST screen gives you a comparative look at how this particular mill’s costs
compare with (1) industry; (2) the low cost producer; (3) the high cost producer;
and (4) the industry average. This screen also provides a breakout of the cost of
production per ton of grade produced for the mill you have selected.
To access this information, click on the Costs button located at the bottom of the
ACCOUNT VIEWER screen.
AT A GLANCE
Minimum cash cost.
The lowest cost across
all mills producing that
grade of paper.
Mill cost per ton. Costs
for that mill.
Average cost. The
average cost across all
mills producing that
grade of paper.
Over/under. Where
this mill lies against the
average.
Maximum cash cost.
The highest cost across
all mills producing that
grade of paper.
FISHER PULP&PAPER W ORLDWIDE USER’S MANUAL
40
COST BREAKOUT
To see a mill’s specific costs, compared with other mills making the same grade
of paper, click on the Breakout of Costs button from the main COST screen. To
choose a different grade of paper, select another grade from the drop down
menu located in the left center of the screen.
AT A GLANCE
COSTS includes details on the
following components.
§
Chemicals
§
Fiber
§
Fuel
§
Hourly labor
§
Materials
§
Power
§
Salaried labor
For definitions of the cost
components, see
Appendix.
FISHER PULP&PAPER W ORLDWIDE USER’S MANUAL
41
Prices
PRICES screen shows the transaction prices from 1970 to the present for various
grades of paper. To view this information, click on the Prices button located at
the bottom of the ACCOUNT VIEWER screen.
AT A GLANCE
PRICES provides you with the
following data:
§
Transaction price
§
Real price
§
Trend
§
Detailed list of the prices
that make up the graph
The List Prices button located at the top of the PRICES screen will give you data
behind the graph.
FISHER PULP&PAPER W ORLDWIDE USER’S MANUAL
42
Getting Equipment Information
The equipment section of the database provides you with highly detailed
information about process equipment and controls, as well as major capital and
maintenance projects at the mill. You access this information by clicking the
buttons located at the bottom of the main ACCOUNT VIEWER screen.
•
PROCESS EQUIPMENT. Describes every major piece of
equipment in a mill, including type, subtype, supplier,
year of installation and other relevant information.
•
PROCESS CONTROLS. Describes DCS and supervisory
systems throughout the mill, in addition to scanners,
sensors and actuators.
•
PROJECTS. Describes capital and maintenance
projects over $1 million US, including estimated
investment spending and investment and all relevant
dates and RFQ, developer’s name, description of
project scope.
FISHER PULP&PAPER W ORLDWIDE USER’S MANUAL
43
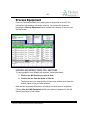
Process Equipment
PROCESS EQUIPMENT shows every major piece of equipment in the mill. The
information is grouped by mill section and line. You access this screen by
pressing the Process Equipment button located at the bottom of the ACCOUNT
VIEWER screen.
VIEWING EQUIPMENT FROM MILL SECTIONS
To view equipment from different mill sections, follow these steps:
1. Click on the Mill Section you want to view.
2. Click on the line from the Name of Line list.
The equipment in the lower portion of the screen reflects the mill section
and the name of line you have selected.
Note that the equipment dimensions will change for each piece of equipment.
Clicking View ALL Mill Equipment will list every piece of equipment in the mill,
without grouping it by mill section.
FISHER PULP&PAPER W ORLDWIDE USER’S MANUAL
44
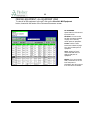
PROCESS EQUIPMENT: ALL EQUIPMENT VIEW
To view all of the equipment in the mill, click on the View ALL Mill Equipment
button, located in the center of the PROCESS EQUIPMENT screen.
AT A GLANCE
Special features of the PROCESS
EQUIPMENT screen:
Set Filter. You can use the
set filter instructions outlined
on page 23 to view only
certain pieces of equipment.
Locate. Use the Locate
instructions outlined on page
22 to find a certain piece of
equipment.
xxxx. Viewing an “xxxx”
means that field does not
apply to that piece of
equipment.
Blanks. If you see an empty
field, it is because we do not
know that piece of
information. We will not guess
if we don’t know the answer
FISHER PULP&PAPER W ORLDWIDE USER’S MANUAL
45
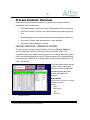
Process Controls: Overview
Within the PROCESS CONTROLS section, you can access several screens of
information. Those screens are:
•
PROCESS CONTROLS-VIEW BY CONTROL. What each control is measuring.
•
PROCESS CONTROLS-VIEW BY LINE. What controls are operating for each
line.
•
SCANNERS/SENSORS. Location of sensors and what they are measuring.
•
ACTUATORS. Shows what actuators are on each machine.
•
SOFTWARE. What software is running.
PROCESS CONTROLS: VIEWING BY CONTROL
To view process controls for any mill listing, click on the Process Controls
button located at the bottom of the main ACCOUNT VIEWER screen. The
information listed in the right section of the screen will change depending on the
control you have highlighted on the left. Process controls can be grouped either
by control or by machine line. To switch views, use the button located in the top
right of the screen.
The three lower buttons located
in the top right of the screen,
gives you access to additional
information about scanners,
sensors, actuators and
software.
AT A GLANCE
PROCESS CONTROLS provides you with the
following information:
Supplier
§
Supervisory status
FISHER PULP&PAPER W ORLDWIDE USER’S MANUAL
§
Model
§
Year supplied
§
Type
§
DCS Status
46
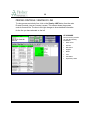
PROCESS CONTROLS: VIEWING BY LINE
To view process controls by line, click on the View by LINE button from the main
Process Controls (VIEW BY CONTROL) screen. This screen shows the process
controls for each line. The box to the right changes to show detailed information
for the line you have selected on the left.
AT A GLANCE
PROCESS CONTROLS provides
you with the following
information:
§
Name of line
§
Sub line
§
Mill section
§
Supplier
§
Model
§
Year
§
DCS status
§
Supervisory status
FISHER PULP&PAPER W ORLDWIDE USER’S MANUAL
47
PROCESS CONTROLS: SCANNERS/SENSORS
The SCANNERS/SENSORS screen is reached from the main PROCESS CONTROLS
screen, either the VIEW BY CONTROL or VIEW BY LINE screens, and shows where
the scanners are located and what the sensors are measuring. Unlike many of
the other screens in FPWW, the two sections of this screen (Scanner Location
and Sensors) are unrelated.
AT A GLANCE
SCANNERS/SENSORS
provides you with the
following information:
§
§
FISHER PULP&PAPER W ORLDWIDE USER’S MANUAL
Scanner Location
§
Name of Line
§
Sub Line
§
Location
Sensors
§
Unit
§
Measurement
§
Status
48
PROCESS CONTROLS: ACTUATORS
Similar to the SCANNERS/SENSORS screen, the ACUATORS screen is accessed
from the main PROCESS CONTROLS screen. Actuator information is grouped by
machine. The Actuator information that appears at the bottom of the screen will
depend on the Machine you select in the middle section.
AT A GLANCE
ACTUATORS provides you with
the following information:
§
Name of Line
§
Sub Line
§
Actuator
§
Type
§
Unit
§
Subtype
§
Application
§
Supplier
§
Year
§
Model
§
Operating
FISHER PULP&PAPER W ORLDWIDE USER’S MANUAL
49
PROCESS CONTROLS: SOFTWARE
The SOFTWARE screen lists all the software for each machine. You access the
screen through the PROCESS CONTROLS menu. The Software information at the
right of the screen is dependent on the Machine you have selected on the left.
AT A GLANCE
SOFTWARE provides you with
the following information:
FISHER PULP&PAPER W ORLDWIDE USER’S MANUAL
§
Name of line
§
Software
§
Type
§
Feature
§
Status
50
Projects
PROJECTS shows all capital and maintenance projects at the mill. You access this
information by clicking on the Projects button for any mill listing. The information
at the bottom of the screen details the project highlighted in the middle section.
Project information is updated continuously, with updates e-mailed bi-weekly to
clients who purchase this service.
AT A GLANCE
PROJECTS provides you with
the following information:
§
Project date
§
Projects name
§
Mill section
§
Contact names
§
Developer
§
Scope
FISHER PULP&PAPER W ORLDWIDE USER’S MANUAL
51
4
THE ANALYZER TM
The ANALYZER: An Overview
Basic Options
Putting ANALYZER to Use
Creating a List
Creating a Table or Graph
Creating a Mailing List
FISHER PULP&PAPER W ORLDWIDE USER’S MANUAL
52
FISHER PULP&PAPER W ORLDWIDE USER’S MANUAL
53
The ANALYZER : an Overview
The ANALYZER is a powerful and versatile tool that does much of the “brainwork”
and nearly all of the “legwork” that goes into finding answers to strategic and
tactical questions that relate to information in the database.
You use ANALYZER the way you would use the query tool in a typical database,
such as Microsoft Access. The difference, though, is that ANALYZER is not only
intuitive. It is also customized to the pulp and paper industry. In other words, you
don’t have to be a database expert to get answers to your questions. ANALYZER
gives you drop-down menus, enabling you to make selections by pointing and
clicking your mouse. In addition, ANALYZER gives you a variety of output options.
You can output information in a list, a pie chart, a stack bar graph, a table,
mailing labels or mail merge.
FISHER PULP&PAPER W ORLDWIDE USER’S MANUAL
54
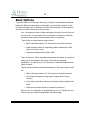
Basic Options
To get the most out of ANALYZER effectively, it helps to understand the rationale
behind the different output options. Essentially, you have three options: (1) list;
(2) table and graph and (3) mailing list. Here’s a brief summary of these options,
and why you would choose one over the other.
LIST. List presents a table of data containing one entry for every item you
choose to list. You can make a list, for example, of locations, machines,
process control systems and individual pieces of equipment.
Typical lists you might want to make include:
•
Mills in the Northwestern U.S. that produce recycled linerboard
•
Paper machines that use Jagenberg coaters operating at 1500
feet per minute or more
•
Digesters made by Kamyr before 1985
TABLE AND GRAPH. Table and graph summarizes information in a way that
allows you to see patterns and trends. There are two graphing
possibilities: (1) a pie-chart; or (2) a bar-chart. A table accompanies both
types of graphs.
Typical questions that would lend themselves to TABLE AND GRAPH would
be:
•
Mills in the Northwestern U.S. that produce recycled linerboard
•
How much printing and writing paper is being made in each
country?
•
How many on-machine coaters are there by machine supplier and
year?
•
What are the market shares of newsprint producers?
MAILING LIST. A mailing list is a specialized type of LIST. The MAILING LIST
feature helps you create mailing labels and mail merges.
FISHER PULP&PAPER W ORLDWIDE USER’S MANUAL
55
Putting ANALYZER to Use
The Main Screen
SELECTION OPTIONS
Selection options guide you through the query process. Here are the key
commands:
•
CREATE. Lets you select the way you want to display the answer to your
question. Your choices are: (1) list; (2) table and graph; or (3) mailing list.
•
OF. Lets you select what you want your graph to summarize—for
example, TPY of paper, number of paper machines or number of pieces
of equipment. A drop-down menu will give you your choices.
FISHER PULP&PAPER W ORLDWIDE USER’S MANUAL
56
•
BY. (For graphs and tables only) Lets you segment the information in your
graph. For a pie chart, you choose the first “By.” For a stacked bar chart,
you choose both “By’s.” Your selection for the first “By” will open as the Xaxis. The second will appear as the segments of each stacked bar.
•
SELECT VALUES. Lets you select the specific portions of the database that
are to be included and excluded in your list, graph or table. For example,
using Select Values to specify the major grade “Newsprint” will cause
ANALYZER to include only newsprint mills and machines.
You can use Select Values to specify your query in as many ways as you
want. For example, specifying the major grade “Newsprint” and the
original supplier “Valmet” will return only mills and machines that are (1)
made by Valment and (2) produce newsprint.
MANAGING QUERIES
The four “Query” buttons (Clear Query, Save Query, Load Query, and Delete
Query) help to simplify the querying process. Once you’ve created a query that
you intend to reuse, you can give it a name and store it (using Save Query) and
then retrieve that same query with Load Query. Delete Query lets you erase
any queries you’ve saved. Clear Query removes the current query from the
screen but has no impact on a saved query.
OTHER ANALYZER OPTIONS
Other options available to you in ANALYZER include the following:
•
Export. Lets you export the results of list, table and graph queries to a
spread sheet or other software applications.
•
Print. Prints a report of the results of your query.
FISHER PULP&PAPER W ORLDWIDE USER’S MANUAL
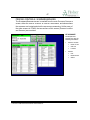
57
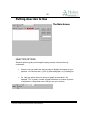
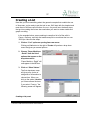
Creating a List
Now that you know something about the general concepts that underlie the use
of ANALYZER, you’re ready to put the tool to use. We’ll start with the simplest and
most direct of all ANALYZER functions: the LIST. As you will see, the basic steps
that go into creating the list are also used when you want to create a table and
graph or mailing.
In the example below, we are seeking to compile a list of all the mills in
France, Germany, and Italy that make newsprint on machines that run over
3000 fpm. Here are the steps:
1. Click on “List” option on opening ANALYZER menu.
Clicking on List button to the right of Create will produce a drop down
menu that gives you several options.
2. Choose “Paper Machines
- Detail” from the list of
options that appear on the
drop-down menu.
“Paper Machine - Detail” will
now appear in the OF box.
3. Click on “Select Values.”
The first drop-down menu
will give you a choice of
categories of information to
choose from. When you
click on the option Location,
you’ll have several choices.
If you select “Country,” the
following screen will appear:
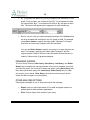
Creating a List, cont.
FISHER PULP&PAPER W ORLDWIDE USER’S MANUAL
58
4. Make your selections.
You select values one group at a time. In the example we are using, you
would scroll down the list of options in the left-hand column until you
come to “France.” After highlighting “France” and clicking on the double
arrow pointing to the right, repeat the process for “Germany” and “Italy.”
When you click on OK, you’ll be returned to the original screen, and the
limit you’ve set will be recorded in the white area of the screen, as in the
following illustration:
Creating a List, cont.
FISHER PULP&PAPER W ORLDWIDE USER’S MANUAL
59
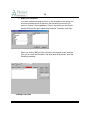
5. Select additional values.
To set additional limits on your query, follow the same procedures as
above for each new criteria you want to use.
•
Click on Select Values.
•
Make appropriate selections from drop-down menu.
•
Transfer selected values from the left-hand column to right-hand
column.
•
Click on OK.
Repeat these steps to specify
Major Grade as Newsprint and
Machine Speed as <=3000 fpm.
6. Click on the red “Re-Run
List” button to create your
list.
The list produced by the criteria set in
this example is shown to the right.
Note: By clicking on the Account
Viewer button, you can quickly go to
the ACCOUNT VIEWER. The mills listed
will only be those mills that meet the
criteria of your list.
FISHER PULP&PAPER W ORLDWIDE USER’S MANUAL
60
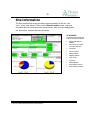
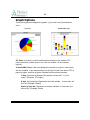
Graph Options
There are two general categories of graphs: (1) pie chart; and (2) stacked bar
chart.
Pie chart
Stacked Bar chart
Pie Chart. A pie chart, as the illustration above shows (in this instance TPY
paper production), breaks down a sum with one variable ( in this instance,
regions).
A Stacked Bar Chart. A bar chart displays the answer to queries in which there
are two variables. In the example above on the right, the bar chart shows TPY of
paper by region, and then by grade. Stacked bars have three elements:
Y-Axis: (Vertical line) Answers the question “How much?” or “How
many?” (Example: TPY Paper)
X-Axis: (Horizontal line) Represents the initial variable – in ANALYZER, the
first “By” (Example: Region)
Stacks of each bar. Represent yet another variable—in ANALYZER, the
second “By” (Example: Grade)
FISHER PULP&PAPER W ORLDWIDE USER’S MANUAL
61
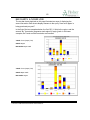
BAR CHARTS: A CLOSER LOOK
The two bar charts depicted on this page illustrate two ways of displaying the
same information. Both charts display answers to the query “How much paper is
being produced per year?”
In the first of the two examples below, the first “By” (Y-Axis) is the region, and the
second “By” (bar stacks) segments each region by major grade. In the lower
example, the X-axis and the bar stacks are reversed.
Y-Axis: Tons of paper (TPY)
X-Axis: Region
Bar Stacks: Major Grade
Y-Axis: Tons of paper (TPY)
X-Axis: Major Grade
Bar stacks: Region
FISHER PULP&PAPER W ORLDWIDE USER’S MANUAL
62
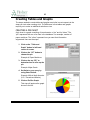
Creating Tables and Graphs
The steps needed to create tables and graphs are similar in most respects to the
steps you took when creating a list. The difference is that tables and graphs
require you to make an additional selection or two.
CREATING A PIE CHART
A pie chart is a graph consisting of two elements: a “pie” and its “slices.” The
“pie” represents the sum of an item in the database—for example, number of
paper machines. The “slices” represent how you want that information
segmented. Here are the steps:
1. Click on the “Table and
Graph” button in left-hand
corner of screen.
2. Click on the “OF” button to
choose the pie.
Example: # Paper Machines
3. Click on the top “BY” to
determine how to slice up the
pie.
Example: Major Grade
4. Set limits to your query by
using Select Values.
Example: Mills in North America
(U.S., Canada and Mexico)
5. Click on Re-Run Graph.
This step will produce the graph
shown to the left.
FISHER PULP&PAPER W ORLDWIDE USER’S MANUAL
63
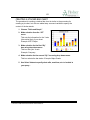
CREATING A STACKED BAR CHART
The procedure for creating a stacked bar chart is similar to the procedure for
creating a pie chart, but with one added step: a second variable to specify the
content of the bar stacks.
1. Choose “Table and Graph.”
2. Make selection from the “OF”
menu.
This sets the information for the Y-axis
(the vertical line) of your chart.
Example: MTPY Paper
3. Make selection for the first “By”
box using drop down menu.
This box sets your X-axis.
Example: Company
4. Make selection for the second “By” box using drop down menu.
This box selects the bar stacks. Example: Major Grade.
5. Use Select Values to specify what mills, machines, etc. to include in
your query .
FISHER PULP&PAPER W ORLDWIDE USER’S MANUAL
64
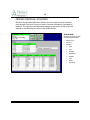
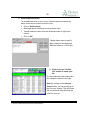
Creating a Mailing
You can use any of the lists you create in ANALYZER as the basis of a mailing list.
PREPARATORY STEPS
You begin the process of creating a mailing list by clicking on the Mailing button
on the opening ANALYZER menu.
In the example below, we are seeking to compile a list of the General Managers
and Maintenance Managers of mills in North America that produce a Major
Grade of Newsprint. Here are the steps:
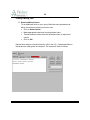
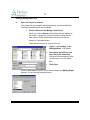
1. Click on “List” option on opening ANALYZER menu.
Clicking on List button to the right of Create will produce a drop down
menu that gives you several options.
2. Choose “People” from the list of options that appear on the dropdown menu.
“People” will now appear in the
OF box.
3. Click on “Select Values.”
The first drop-down menu will
give you a choice of categories of
information to choose from. When
you click on the option People,
you’ll have three choices.
By selecting “Job Function,” the
following screen will appear:
FISHER PULP&PAPER W ORLDWIDE USER’S MANUAL
65
Creating a Mailing, cont.
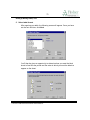
4. Make your selections.
You select values one group at a time. In the example we are using, you
would scroll down the list of options in the left-hand column until you
come to “General Manager.” After highlighting “General Manager” and
clicking on the double arrow pointing to the right. Repeat the process for
“Maintenance.”
When you click on OK, you’ll be returned to the original screen, and the
limit you’ve set will be recorded in the white area of the screen, as in the
following illustration:
FISHER PULP&PAPER W ORLDWIDE USER’S MANUAL
66
Creating a Mailing, cont.
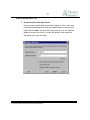
5. Select additional values.
To set additional limits on your query follow the same procedures as
above for each new criteria you want to use.
•
Click on Select Values.
•
Make appropriate selections from drop-down menu.
•
Transfer selected values from the left-hand column to right-hand
column.
•
Click on OK.
Repeat these steps to include criteria for mills in the U.S., Canada and Mexico
that produce a major grade of newsprint. The screen will look as follows:
FISHER PULP&PAPER W ORLDWIDE USER’S MANUAL
67
Creating a Mailing, cont.
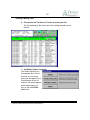
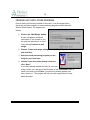
6. Click on the red “Re-Run List” button to create your list.
The list produced by the criteria set in this example would look as
follows:
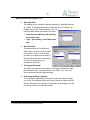
7. Use Delete Options (optional).
The “Delete Options” box
that appears when the list
turns up on your screen
gives you the opportunity to
customize the list you’ve
created. The option appears
automatically when you
click on the red Re-Run
List button.
FISHER PULP&PAPER W ORLDWIDE USER’S MANUAL
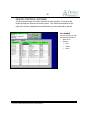
68
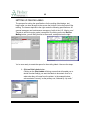
SETTING UP MAILING LABELS
The process for setting the specifications for the mailing (label design, etc.)
begins after you have brought to the screen the list that is to be the basis of the
mailing. The screen depicted to the right meets the following specifications: All
general managers and maintenance managers of mills in the U.S., Mexico, and
Canada in which the major grade is newsprint. By clicking on the red Re-Run
Mailing button, you will bring that list to the screen, as depicted on the right.
You’re now ready to create the specs for the mailing labels. Here are the steps:
1. Click on Print Labels button.
Clicking on the Print Labels will bring a menu that will enable you to
decide on what field(s) you want the labels to be sorted—that is, in
what order they will come from the printer. In the example below,
we’ve selected “country” as the primary sort, followed by “zip code.”
FISHER PULP&PAPER W ORLDWIDE USER’S MANUAL
69
Setting up Mailing Labels, cont.
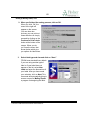
2. When you finished the sorting process, click on OK.
When you click, OK, the
menu to the right will
appear on the screen.
You now have two
choices: you can print out
these directions or simply
proceed by clicking on the
Continue to Print Labels
button at the bottom of the
screen. When you do,
you’ll see the menu that
shown below which give
you options for label sizes.
3.
Select label type and size and click on “Next.”
FPWW uses standard Avery labels.
If you are using another type of
label or if your label does not
appear on the list, select New
Label and enter the dimensions of
your label. After you have made
your selection, click on Next. This
command will automatically bring to
screen a menu for Mailing Expert,
a program for designing the label.
FISHER PULP&PAPER W ORLDWIDE USER’S MANUAL
70
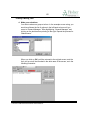
Setting up Mailing Labels, cont.
4.
Open the list you’ve created.
The mailing list you created is stored temporarily in a private directory.
The steps to locate that list are as follows:
•
Click on Browse in the Mailing Label Expert
When you click on Browse, the following box will appear on
the screen. You need to specify where the mailing list has
been saved. FPWW automatically saves the list you’ve
created in a private directory.
There are two ways you can open your list:
•
Type in “:priv:mailing” in the
highlighted box. (File Name)
•
Press down the Shift key and
Insert key at the same time.
(Doing so will automatically insert
“:priv:mailing” in the File name
box.)
•
Click Open.
Either of these steps will move you to the next step in the Mailing Expert
process. You will see the following screen:
FISHER PULP&PAPER W ORLDWIDE USER’S MANUAL
71
Setting up Mailing Labels, cont.
5. Select label format.
After opening your table, the following screen will appear. Once you have
set the font and size, click Next.
You’ll then be given an opportunity to determine how you want the label
sheet to feed into the printer and the order in which you want the labels to
appear on the sheet.
FISHER PULP&PAPER W ORLDWIDE USER’S MANUAL
72
Setting up Mailing Labels, Cont.
6. Choose label entries.
The next step in the process is to indicate how, exactly, you want the
the label to read. Here’s a summary of the commands:
•
Placing fields in the label.
You place fields in the label
by clicking once on the field
you want to place, and then
by clicking once on “Place
Field.”
•
Adding field names to the
same line in the label.
When you want to add more than one field to a line (Example:
First Name and Last Name), leave the cursor on the gray bar
and add the next field. You will need to enter any spaces or
punctuation between fields. (Example: {City}, (space) {State}).
•
Creating a new line in the label. When you want to create a
new line in the label, move the cursor below the gray bar and
click once. This will create a new gray bar and allow you to
insert whatever field you want to insert.
•
Editing. You can edit any line with keystrokes, and remove
fields using the delete key. Please do not type the fields onto
the gray bar. Rather use the highlight-place field sequence.
When you’ve completed laying out your labels, click on Next.
FISHER PULP&PAPER W ORLDWIDE USER’S MANUAL
73
Setting up Mailing Labels, Cont.
7. Create a name for the label report.
Once you have set the label up and have clicked on “Next,” you need
to name the label report you have just created. Enter a name for your
report and click Next. You then have three choices. You can view the
labels on screen, print them, or modify the design. Each instruction
will prompt you to the next step.
FISHER PULP&PAPER W ORLDWIDE USER’S MANUAL
74
MERGING LISTS INTO OTHER PROGRAMS
Once a mailing list has been created in ANALYZER, it can be merged with a
document you have created in a word processing program such as Microsoft
Word or Word Perfect. The steps are as
follows:
1. Click on the “Mail Merge” button.
A menu will appear containing
instructions. If you choose to, you
can print the instructions, or move
on by clicking Continue to mail
merge.
2. Choose “Create new merge setting” from the Merge Expert screen
and click Next.
3. Select the word processing program you are
using for your form letter.
4. Indicate if your form letter already exists and
click “Next.”
If your have already created the letter for your mail
merge, select “yes” and type in the file name or use the Browse button to
locate your letter and click Next. If you have not already created your
letter, select “no.” The program will link your mail merge fields to a new,
blank document.
FISHER PULP&PAPER W ORLDWIDE USER’S MANUAL
75
Merging lists into other programs, cont.
5. Select the table.
The mailing list you created is stored temporarily in a private directory
as a table. The location and name of that table is “:priv:mailing” You
change name in the Table name box. You can
insert the table name and location two ways:
•
Hold down the Shift key and Insert key
at the same time.
•
Type “:priv:mailing” in the Table name
box.
6. Sort the labels.
This step enables you to decide on
what field(s) you want your form letter
to be sorted —that is, in what order
you want your labels to be created. In
the example to the right, we selected
“Country” as the primary sort,
followed by “Zip Code.”
7. Changing field format.
The next screen gives you the option of changing the format of each
field (Example: “Mr.” can appear three ways: “MR.,” “Mr.” and “mr.”)
We recommend using the default setting.
8. Save merge settings (optional)
You’re given the opportunity at this point to save the merge settings
you’ve set. On the same menu you’ll also be asked to type a name for
the new document that is going to be the basis of the merge if you are
not using a letter you’ve already created.
FISHER PULP&PAPER W ORLDWIDE USER’S MANUAL
76
Merging lists into other programs, cont.
9. Click Finish.
Once you click on Finish, ANALYZER will assemble the list and
automatically open the word processing program you’ve selected. If
you have indicated an existing file, the program will open to that file.
Otherwise, a new document will be opened.
From this point on, you need to follow the mail merge procedures of
your word processing program.
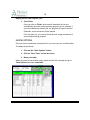
SAVING OPTIONS
Once you have created and customized a list, you can save your modified table.
The steps are as follows:
1. Click on the “Table Options” button.
2. Click on “Save Table” on the next menu.
3. Name your table.
When you want to load a table, simply create another list of people and go to
Table Options and select Load table.
FISHER PULP&PAPER W ORLDWIDE USER’S MANUAL
77
5
EXPORTING AND LINKING
Exporting from ANALYZER
Linking FPWW to Microsoft Access
FISHER PULP&PAPER W ORLDWIDE USER’S MANUAL
78
FISHER PULP&PAPER W ORLDWIDE USER’S MANUAL
79
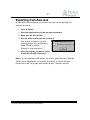
Exporting from ANALYZER
All lists, tables and mailing lists you create in ANALYZER can be exported. The
steps are as follows:
1. Click on Export.
2. Select the application or format you want to export to.
3. Name your file and click OK.
4. Note the exact location your file is saved in.
This location is usually in a private
directory located in the root directory
where FPWW is installed.
Example: c:\fp\private\ceo.xls
5. Open the program you want to import
to and use the import command.
Note: If you are exporting to MS Access, you need to export the file to a Paradox
Table or Excel Spreadsheet first and then ”Link/Attach” or “import” the table.
Please refer to the “Using ANALYZER with MS Access.” (See next section.)
FISHER PULP&PAPER W ORLDWIDE USER’S MANUAL
80
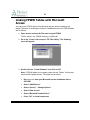
Linking FPWW Tables with Microsoft
Access
You can query FPWW directly from Microsoft Access without importing any
tables! The steps for creating an Access 2.0 database that links to FPWW tables
are as follows:
1. Open Access and use the File menu to open FPWW.
The file name in the FPWW directory is “fp95.mdb”
2. Go to the “Forms” tab and open “FP Table Utility.” The following
menu will appear:
3. Double click on “Create Database” and click on OK.
Note: If FPWW tables do not appear under the tab “Tables,” exit Access
and load the Paradox drivers. The steps are as follows:
•
Run setup.exe from your Microsoft Access installation disk or
CD-ROM
•
Select “Add/Remove”
•
Select “Access,” “Change Options”
•
Select “Data Access”
•
Select “Microsoft Paradox Driver”
•
Press “OK” to install component
FISHER PULP&PAPER W ORLDWIDE USER’S MANUAL
81
MICROSOFT ACCESS OFFICE 97 USERS:
If you are using MS Access 97, the Paradox drivers are located on the Microsoft
Office 97 CD-Rom as part of the Value Pack. To install the drivers, run
dataacc.exe from the CD-ROM. Follow the steps outlined on page 85, but use
the form “fp97.mdb.”
RUNNING ACCESS 7.0 WITH FPWW-NETWORK INSTALLATION
In order for multiple users to utilize FPWW tables in Access, you will need to do
the following “Registry” edits for Access:
1. Go to Start | Run.
2. Type “regedit” and click OK.
3. Navigate to \HKEY_LOCAL_MACHINE\SOFTWARE\Microsoft\Jet\3.0
4. Make changes in \Engines\Paradox
Important: “ParadoxNetPath =” must match the one you set in the BDE
Configuration. Enter the directory where the Ppdoxusrs.net file resides.
Example: p:\fp\net
Enter ParadoxNetStyle = “4.x”
FISHER PULP&PAPER W ORLDWIDE USER’S MANUAL
82
FISHER PULP&PAPER W ORLDWIDE USER’S MANUAL
83
APPENDIX
Links between Tables
Table Descriptions
Cost Component Definitions
FISHER PULP&PAPER W ORLDWIDE USER’S MANUAL
84
FISHER PULP&PAPER W ORLDWIDE USER’S MANUAL
85
l
l
l
l
l
l
l
l
l
l
Control
Name
Product
Description
l
Project ID
l
Person Code
l
Company
l
Grade Code
Sub Line
l
l
l
l
l
l
l
l
l
l
l
l
l
l
l
l
l
Site Code
Table
Actuator
Controls
Costavg
Costavgb
Costbkdn
Costcorp
Costmill
Ctrllocn
end_prod
Equip
Fuel
Furnish
Linedesc
Millinfo
Owner%
Paper
People
Peopmail
Peopnote
Peopresp
Peoptel
Price
Project2
Projects
Pulptype
Recycled
Salesman
Salesterr
Sensors
Water
Watertmt
Name of Line
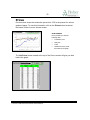
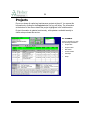
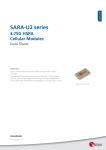
LINKS BETWEEN TABLES
l
l
l
l
l
l
l
l
l
l
l
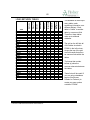
The grid on the left lists all
of the tables involved in
FPWW in the left column.
Across the top of the grid
are field names that serve
as common links within the
tables.
l
l
l
l
l
l
l
l
l
l
l
l
l
l
l
l
l
l
The database is made up of
many tables, each
containing information on a
different subject. Each
table is “linked” to another
table by a common field.
Therefore, these tables
make up a relational
database.
l
FISHER PULP&PAPER W ORLDWIDE USER’S MANUAL
The boxes that contain
bullets (l) show the
common elements between
the tables.
These links will be useful if
you are using a database
engine (like Access,
Paradox or Foxboro) to
create your own queries
outside of FPWW.
86
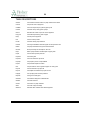
TABLE DESCRIPTIONS
Actuator
Lists actuators and their location on paper machines and coaters
Controls
Lists process control equipment
Costbkdn
Lists cost components per grade of paper by mill
Costmill
Lists total cost by mill by grade of paper
Ctrllocn
Identifies mill location of process control equipment
End_prod
Lists finished products by grade of paper
Equip
Lists all process equipment
Fuel
Lists fuel used by boilers
Furnish
Lists fiber used by paper machines
Linedesc
Lists original installation date and supplier of each production line
Millinfo
Lists paper mill address and general mill information
Owner%
Shows percentage of ownership for each mill
Paper
Name of paper machine and description of paper grade
People
Lists mill and corporate personnel
Peopmail
Lists mailing lists
Peopnote
Lists notes entered for personnel
Peopresp
Lists people by areas of responsibilities
Peoptel
Lists personal telephone numbers
Price
Lists price data for various grades of paper over many years
Project2
Lists mill sections for projects.db
Projects
Lists capital and maintenance projects for mill
Pulptype
List of pulping lines and their production
Recycled
Lists types of waste paper
Salesman
Lists salesmen assigned to individual mills
Salesterr
Lists sales territories
Sensors
Lists sensors on paper machines
Water
Lists water usage and sludge
Watertmt
Describes water treatment and related equipment
FISHER PULP&PAPER W ORLDWIDE USER’S MANUAL
87
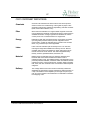
COST COMPONENT DEFINITIONS
Chemicals
Chemical cost estimates have been made for the various process
areas involved in the manufacturing of each grade of paper. These
generally include pulping, bleaching, papermaking and other mill areas
(water, waste water treatment, etc.).
Fiber
Wood costs are estimated on a regional basis. Regional wood costs
may be adjusted for particular circumstances within a region based on
available information. Average regional wood densities are used to
convert prices from a volumetric basis to a weight basis.
Energy
Estimates for both fuel and electrical power consumption are based
upon the grades produced and the process equipment used to
produce them. Credits are estimated for by-products such as waste
steam, hog, and black liquor where applicable.
Labor
Labor costs are estimated quite accurately for the U.S. mills with
manning and wage data available from industry sources. Data for
Canadian mills comes from statistics on safety performance which
include annual man-hours worked. This data is supplemented by
industry contracts, published articles, directories, etc.
Material
Material costs are estimated using an approach developed from
historical data which relates maintenance material costs to
maintenance labor costs, plus additional direct costs depending on the
products produced. Materials, sometimes called consumables, include
maintenance parts, contract maintenance, supplies, shipping supplies,
felts, wires, and other incidental costs not included in natural expense
categories.
Delivery
The average distance from each mill to its most likely market was
established by summarizing industry shipments by state and region on
a map. This distance was multiplied by an average cost per ton per
mile. This cost is based on actual data and our estimates of domestic
truck shipping costs.
FISHER PULP&PAPER W ORLDWIDE USER’S MANUAL
88
Index
Access, 80
ACCOUNT VIEWER, 19, 27
Adding a New Location, 34
Adding Names, 34
Address Detail, 34
ANALYZER, 53, 54
Area of Responsibility, 30
BDE, 13
Breakout of Costs, 40
Corporate Information, 32
Costs, 39, 40
Cost Component Definitions, 88
Edit Name, 34
Editing Locations, 34
Editing Names, 34
Equipment, 42, 43, 44
Export, 79
Field Headers, 19
Filters, 21
Graphs, 60
Initialization, 11
Insert Name, 34
Installation
network, 9, 12
standalone, 9, 10
Labels, 68
Links between Tables, 85
Loading a Saved Mailing List, 76
Locate, 20
Locate Next, 20
Mail Merge, 74
Mailing Lables, 68
Network Installation, 12
Operating System, 10, 12
Paper Production, 36
Personnel, 30, 31
Prices, 41
Process Controls, 45, 46
Process Equipment, 43, 44
Projects, 50
Pulp Production, 37
RAM Requirements, 10, 12
Sales Territories, 33
Saving Mailing Lists, 76
Site Information, 29
Table Descriptions, 86
Table Options, 76
Waste, 38
Water, 38
FISHER PULP&PAPER W ORLDWIDE USER’S MANUAL