1
Hochschule Bonn-Rhein-Sieg
University of Applied Sciences
Fachbereich Informatik
Department of Computer Science
Thesis in the course of studies
Bachelor of Science in Computer Science
Development of a PAPI Backend for
the Sun Niagara 2 Processor
Fabian Gorsler
September 9, 2009
First advisor:
Prof. Dr. Rudolf Berrendorf
Bonn-Rhein-Sieg University of Applied Sciences
Second advisor:
Dipl.-Inform. Christian Iwainsky
RWTH Aachen University
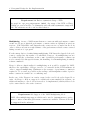
Abstract
Performance measurements are an important part in the design of applications for
High Performance Computing environments found in research or industry. For the optimization of applications in these environments in-depth performance measurements
are needed to achieve the optimum of optimization possible for a given computer
architecture.
PAPI is a framework for performance measurements based on performance counter
registers found in modern computer architectures. Using PAPI developers and researchers can get an insight of the processor internal execution of applications and
based on this feedback optimize applications. PAPI simplifies the task of performance
measurements at this layers as it adapts to different platforms through backends called
substrates.
The Sun UltraSPARC T2 processor, code named Niagara 2, is a computer architecture
built for modern computing demands based on a thread-level parallelism approach
using a direct mapping of software threads to up to 64 hardware threads executed on
eight independent cores. At RWTH Aachen University a cluster based on the Niagara
2 was installed, but PAPI did not support this new architecture therefore essential
optimization feedback for researchers at Aachen University was not available.
This thesis describes the work for the implementation of a PAPI substrate for the
Niagara 2 using libcpc 2. libcpc 2 is a library available in the Solaris operating system
for accessing the performance counter registers. Concluding to the implementation of
the substrate, the substrate will be used to analyze a parallel application for sparsematrix vector multiplication used as an integral component in a solver library used
at Aachen University.
The implementation of the PAPI substrate for the Niagara 2 has been merged to the
PAPI development branch on August 25, 2009 and is going be officially released with
the next PAPI release expected for September 2009.
III
Contents
Contents
1 Introduction and Motivation
2 Sun
2.1
2.2
2.3
2.4
2.5
1
Niagara 2 Processor Architecture
Introduction to the Sun Niagara 2 Processor
Chip-Multithreading and Scheduling . . . .
Memory Architecture and Organization . . .
Memory Model and Coherence . . . . . . . .
Availability of Performance Counters . . . .
.
.
.
.
.
4
4
5
8
15
18
3 Interfaces for Performance Instrumentation
3.1 Introduction of PAPI and libcpc 2 . . . . . . . . . . . . . . . . . . . .
3.2 Performance Instrumentation and Monitoring . . . . . . . . . . . . .
3.3 Tools related to PAPI and libcpc 2 . . . . . . . . . . . . . . . . . . .
21
21
23
25
4 Conceptual Design for the Implementation
4.1 Comparison of PAPI and libcpc 2 . . . . . . . . .
4.2 Counter Availability and Accuracy in libcpc 2 . .
4.3 Requirements for Performance Counter Events . .
4.4 Requirements for Counter Access and Operational
4.5 Support of Threads and Processes . . . . . . . . .
.
.
.
.
.
29
29
30
35
39
46
.
.
.
.
.
.
51
51
52
53
58
65
73
6 Analysis of a Parallel Benchmark
6.1 Short Introduction to SMXV . . . . . . . . . . . . . . . . . . . . . . .
6.2 Considerations and Analysis . . . . . . . . . . . . . . . . . . . . . . .
77
77
79
7 Conclusion
84
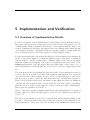
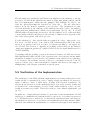
5 Implementation and Verification
5.1 Overview of Implementation Details . . .
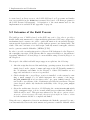
5.2 Extension of the Build Process . . . . . .
5.3 Implementation of Basic Operations . . .
5.4 Implementation of Advanced Operations
5.5 Verification of the Implementation . . . .
5.6 Problems during Implementation . . . .
.
.
.
.
.
.
.
.
.
.
.
.
.
.
.
.
.
.
.
.
.
.
.
.
.
.
.
.
.
.
.
.
.
.
.
.
.
.
.
.
.
.
.
.
.
.
.
.
.
.
.
.
.
.
.
.
.
.
.
.
.
.
.
.
.
. . . .
. . . .
. . . .
Modes
. . . .
.
.
.
.
.
.
.
.
.
.
.
.
.
.
.
.
.
.
.
.
.
.
.
.
.
.
.
.
.
.
.
.
.
.
.
.
.
.
.
.
.
.
.
.
.
.
.
.
.
.
.
.
.
.
.
.
.
.
.
.
.
.
.
.
.
.
.
.
.
.
.
.
.
.
.
.
.
.
.
.
.
.
.
.
.
.
.
.
.
.
.
.
.
.
.
.
.
.
.
.
.
.
.
.
.
.
.
.
.
.
.
.
.
.
.
.
.
.
.
.
V
Contents
A Eidesstattliche Erklärung
87
B Conventions in this Document
B.1 Typographic Conventions . . . . . . . . . . . . . . . . . . . . . . . .
B.2 Source Code References . . . . . . . . . . . . . . . . . . . . . . . . .
B.3 OpenSolaris Source Code References . . . . . . . . . . . . . . . . . .
88
88
88
89
C Used Environment in this Thesis
C.1 Description . . . . . . . . . . . . . . . . . . . . . . . . . . . . . . . .
C.2 Software Versions . . . . . . . . . . . . . . . . . . . . . . . . . . . . .
90
90
90
D Capabilities of collect
93
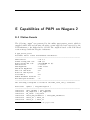
E Capabilities of PAPI on Niagara 2
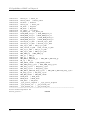
E.1 Native Events . . . . . . . . . . . . . . . . . . . . . . . . . . . . . . .
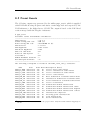
E.2 Preset Events . . . . . . . . . . . . . . . . . . . . . . . . . . . . . . .
97
97
99
F Output of a Verification Run
VI
101
List of Figures
List of Figures
2.1
2.2
2.3
2.4
2.5
2.6
”Differences Between TLP and ILP” from [Sun07c, p. 2] . . . . . . . .
The structural overview of a Niagara 2 core in reference of [Sun07c] .
”Three Overlapping Windows and Eight Global Registers”from [Sun08e,
p.51] . . . . . . . . . . . . . . . . . . . . . . . . . . . . . . . . . . . .
”PCX Slice and Dataflow” from [Sun07a, p. 6-2] . . . . . . . . . . . .
”UltraSPARC T2 Address Space” from [Sun07c, p. 70] . . . . . . . .
Coherence between L1 and L2 caches in reference of [Sun07c] . . . . .
10
13
15
17
3.1
PAPI architecture from [PUG, p. 7] . . . . . . . . . . . . . . . . . . .
22
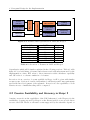
4.1
Features and Dependencies in PAPI and libcpc 2 . . . . . . . . . . .
30
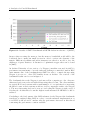
6.1
6.2
6.3
6.4
6.5
Results of SMXV Benchmark at RWTH Aachen in reference of
SMXV: MFLOPS by Test Case . . . . . . . . . . . . . . . . .
SMXV: L1 Data Cache Misses by Test Case . . . . . . . . . .
SMXV: L2 Cache Load Misses by Test Case . . . . . . . . . .
SMXV: Idle Strands by Test Case . . . . . . . . . . . . . . . .
78
81
81
81
82
[aMT07]
. . . .
. . . .
. . . .
. . . .
6
7
VII
List of Tables
List of Tables
2.1
2.2
2.3
Available Registers in a Niagara 2-window by reference of [Sun08e,
Sun07c] . . . . . . . . . . . . . . . . . . . . . . . . . . . . . . . . . .
Floating-point register configuration in reference of [Sun08e, Sun07c] .
L1 Caches in Niagara 2 in reference of [Sun07c] . . . . . . . . . . . .
9
11
12
4.1
4.2
4.3
4.4
Overview of Features in PAPI and libcpc 2 . . . . . . . . . . . . . .
libcpc 2 Native Events: Instructions, in reference of [Sun07c] . . . .
libcpc 2 Native Events: L1 cache and TLB, in reference of [Sun07c]
libcpc 2 Native Events: L2 cache, in reference of [Sun07c] . . . . . .
.
.
.
.
30
31
32
32
5.1
Preset and Derived Events for Niagara 2 . . . . . . . . . . . . . . . .
56
VIII
Glossary
Glossary
address space
A range of 264 locations that can be addressed by instruction fetches and load,
store, or load-store instructions. See also address space identifier (ASI). —
Definition from [Sun08e, p. 7]
address space identifier
An 8-bit value that identifies a particular address space. An ASI is (implicitly
or explicitly) associated with every instruction access or data access. [...] —
Definition from [Sun08e, p. 7]
Chip-level MultiThreading
Chip-level MultiThreading (or, as an adjective, Chip-level MultiThreaded).
Refers to a physical processor containing more than one virtual processor. —
Definition from [Sun08e, p. 8]
coherence
A set of protocols guaranteeing that all memory accesses are globally visible to
all caches on a shared-memory bus. — Definition from [Sun08e, p. 8]
core
In an UltraSPARC Architecture processor, may refer to either a virtual processor or a physical processor core. — Definition from [Sun08e, p. 8]
counting context
A context with all necessary information in order use performance counters.
exception
A condition that makes it impossible for the processor to continue executing the
current instruction stream. Some exceptions may be masked (that is, trap generation disabled — for example, floating-point exceptions masked by FSR.tem)
so that the decision on whether or not to apply special processing can be deferred and made by software at a later time. See also trap. — Definition from
[Sun08e, p. 10]
IX
Glossary
implementation
Hardware or software that conforms to all of the specifications of an instruction
set architecture (ISA). — Definition from [Sun08e, p. 11] — Only in terms of
the Niagara 2/UltraSPARC 2007-architecture.
integer unit
A processing unit that performs integer and control-flow operations and contains
general-purpose integer registers and virtual processor state registers, as defined
by this specification. — Definition from [Sun08e, p. 12]
issued
A memory transaction (load, store, or atomic load-store) is said to be “issued”
when a virtual processor has sent the transaction to the memory subsystem and
the completion of the request is out of the virtual processor’s control. Synonym
for initiated. issued — Definition from [Sun08e, p. 12]
native event
An event which is directly countable through the performance counter hardware
on a given CPU.
PAPI preset
A PAPI preset is a predifined event supported by a PAPI substrate built up on
native events.
PAPI substrate
A PAPI substrate is a platform-dependent adapter in PAPI with all necessary
functionality to support PAPI on a given platform.
physical address
An address that maps to actual physical memory or I/O device space. See also
real address and virtual address. — Definition from [Sun08e, p. 14]
physical core
The term physical processor core, or just physical core, is similar to the term
pipeline but represents a broader collection of hardware that are required for
performing the execution of instructions from one or more software threads.
For a detailed definition of this term, see page 595. See also pipeline, processor,
strand, thread, and virtual processor. — Definition from [Sun08e, p. 14]
physical processor
Synonym for processor; used when an explicit contrast needs to be drawn between processor and virtual processor. See also processor and virtual processor.
— Definition from [Sun08e, p. 14]
X
Glossary
pipeline
Refers to an execution pipeline, the basic collection of hardware needed to execute instructions. For a detailed definition of this term, see page 595. See also
physical core, processor, strand, thread, and virtual processor. — Definition
from [Sun08e, p. 14]
processor
The unit on which a shared interface is provided to control the configuration and
execution of a collection of strands; a physical module that plugs into a system.
Synonym for processor module. For a detailed definition of this term, see page
595. See also pipeline, physical core, strand, thread, and virtual processor. —
Definition from [Sun08e, p. 15]
processor core
Synonym for physical core. — Definition from [Sun08e, p. 15]
processor module
Synonym for processor. — Definition from [Sun08e, p. 15]
real address
An address produced by a virtual processor that refers to a particular softwarevisible memory location, as viewed from privileged mode. Virtual addresses are
usually translated by a combination of hardware and software to real addresses,
which can be used to access real memory. Real addresses, in turn, are usually
translated to physical addresses, which can be used to access physical memory.
See also physical address and virtual address. — Definition from [Sun08e, p.
15-16]
strand
The hardware state that must be maintained in order to execute a software
thread. For a detailed definition of this term, see page 594. See also pipeline,
physical core, processor, thread, and virtual processor. — Definition from
[Sun08e, p. 18]
system
A set of virtual processors that share a common physical address space. —
Definition from [Sun08e, p. 18]
thread
A software entity that can be executed on hardware. For a detailed definition
of this term, see page 594. See also pipeline, physical core, processor, strand,
and virtual processor. — Definition from [Sun08e, p. 18]
XI
Glossary
Translation Table Entry
Translation Table Entry. Describes the virtual-to-real, virtual-to-physical, or
real-to-physical translation and page attributes for a specific page in the page
table. In some cases, this term is explicitly used to refer to entries in the TSB.
— Definition from [Sun08e, p. 19]
trap
The action taken by a virtual processor when it changes the instruction flow in
response to the presence of an exception, reset, a Tcc instruction, or an interrupt. The action is a vectored transfer of control to more-privileged software
through a table, the address of which is specified by the privileged Trap Base
Address (TBA) register or the Hyperprivileged Trap Base Address (HTBA)
register. See also exception. — Definition from [Sun08e, p. 19]
virtual address
An address produced by a virtual processor that refers to a particular softwarevisible memory location. Virtual addresses usually are translated by a combination of hardware and software to physical addresses, which can be used to access
physical memory. See also physical address and real address. — Definition from
[Sun08e, p. 20]
virtual core, virtual processor core
Synonyms for virtual processor. — Definition from [Sun08e, p. 20]
virtual processor
The term virtual processor, or virtual processor core, is used to identify each
strand in a processor. At any given time, an operating system can have a
different thread scheduled on each virtual processor. For a detailed definition
of this term, see page 595. See also pipeline, physical core, processor, strand,
and thread. — Definition from [Sun08e, p. 20]
XII
Glossary
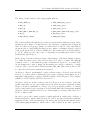
Acronyms
• API, Application Programming Interface
• L1$, Layer 1 Cache
• ASI, Address Space Identifier
• L2, Layer 2
• CCU, Clock Control Unit
• L2$, Layer 2 Cache
• CCX, Cache Crossbar
• L3, Layer 3
• CMT, Chip-MultiThreading
• LFSR, Linear Feedback Shift Registers
• CPU, Central Processing Unit
• CPX, Cache to Processor Lane
• L1, Layer 1
• CWP, Current Window Pointer
• LRU, Least-Recently used Algorithm
• D-Cache, L1 Data Cache
• LSU, Load and Store Unit
• DIMM, Dual in-line Memory Module
• LWP, Lightweight Process/Thread
• DTLB,
Buffer
• MFLOPS, Million Floating-Point
Operations per Second
Data
Table
Lookaside
• MCU, Memory Control Unit
• FBD, Fully-buffered DIMM
• MMU, Memory Management Unit
• FGU, Floating-Point and Graphics
Unit
• MPI, Message Passing Interface
• HPC, High Performance Computing
• MPO, Memory Placement Optimization
• HW, Hardware or Hardware-based
• NRU, Non-Recently used Algorithm
• HWTW, Hardware Tablewalk
• OTF, Open Trace Format
• I-Cache, L1 Instruction Cache
• PCX, Processor to Cache Lane
• IDE, Integrated Development Environment
• PSO, Partial Store Order
• ILP, Instruction-Level Parallelism
• PCR, Performance Control Register
• ITLB, Instruction Table Lookaside
Buffer
• PIC, Performance Instrumentation
Counter
XIII
Glossary
• PThreads, POSIX Threads
• RAM, Random Access Memory
• RMO, Relaxed Memory Order
• SW, Software or Software-based
XIV
• TLB, Translation Lookaside Buffer
• TLP, Thread-Level Parallelism
• TSO, Total Store Order
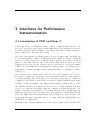
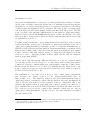
1 Introduction and Motivation
Analyzing performance data directly from CPU registers has become an important
part of developing new applications and optimizing existing applications for High
Performance Computing environments where efficiency is a key concern. The evolution of CPU architectures led to parallel CPU designs based on multiple cores and
complex memory hierarchies. For each of the cores independent instruction flows are
executed suitable for parallel applications designs. [HP06] [CSG99]
Problems which can arise from improper choices for algorithms in parallel systems are
for example an exhaustive memory access for many but small data sets being retrieved
which consume the whole memory bandwidth for a CPU, respectively a MMU. Other
in parallel executed tasks suffer from these problems because their memory accesses
are stalled until the previously executed load and store operations finish.
For analyzing and optimizing these parallel applications it is necessary to extract
information about each instruction flow. The extraction of this information is possible with the use of performance counters embedded in CPUs. Typical information
which can be extracted from these counters are for example total counts of executed
instructions, cache misses in different stages of the memory hierarchy or loading of
pipelines.
Using the feedback retrieved from the counters supported by APIs and all in one tools
like IDEs, it is possible to identify ”bad” code and to optimize parallel applications.
Without any feedback about the instruction flows optimizing and tuning a parallel
application would be a much more time consuming task. [NS07]
PAPI ([PUG], [PPR]) is a library for the extraction of performance counter data from
processors. Accessing these counters depends heavily on the underlying architectures
and operating systems, as there is no standardized interface which is adapted by hardware manufacturers. In order to solve this problem PAPI adapts the capabilities of
several different platforms and operating systems through platform-specific backends
— called substrates — and presents these capabilities to developers and engineers
through its own API.
Especially in an environment where systems based on different architectures and
1
1 Introduction and Motivation
possible even different operating systems exist, PAPI simplifies the performance measurement dramatically. Once a program has been developed to access performance
metrics using PAPI, a build of this program on a system where PAPI is available
is sufficient to access performance counters on a given platform. Access to PAPI is
available through a dynamic or static library object.
At RWTH Aachen University a cluster based on 20 nodes of Sun T5120 machines
was installed in 2008. These machines are intended for HPC applications needed
by researchers of different institutes and even other universities. In order to decide
whether a program needs to be optimized and to measure the benefits of different
optimization strategies, support by in-depth performance measurement tools is required. PAPI was already in use on other compute clusters and implementations
of programs with PAPI support already exist which makes PAPI the best way for
platform-independent performance measurement at Aachen University. [aMST+ 09]
This thesis describes the work done for porting PAPI to the Sun Niagara 2 processor
using the library libcpc 2 which is available on Sun Solaris, the desired operating
system at RWTH for SPARC-based systems. As of PAPI 3.6.2 a port to SPARCbased systems running on Solaris already exists, but the PAPI backend is based on
libcpc 1 which is incompatible to the new library interface available on Solaris 10.
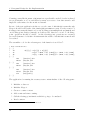
The main objectives of this thesis are:
• Exploring how to extract performance data from a Sun Niagara 2 system and
to analyze which data can be accessed
• Creating an analysis how libcpc 2 can be used in PAPI and how a mapping
between these two libraries can be established
• Implementing a PAPI backend based on PAPI 3.6.2 for accessing the performance counters on a Niagara 2 system using libcpc 2
• Verifying the extracted performance data from the new PAPI backend using the
analyzer features from Sun Studio 12 with support of hardware performance
counters
After all tasks are completed a patch will be sent to the PAPI developers in order
to integrate this patch with the mainline PAPI development and future releases of
PAPI. Access to a Niagara 2-based system and a Niagara 2-based cluster is given by
courtesy of RWTH Aachen University.
I would like to express my gratitude to my advisers Prof. Dr. Rudolf Berrendorf and
Dipl.-Inform. Christian Iwainsky who enabled me to write this thesis and supported
me during the creation. Furthermore I would like to thank the HPC team at RWTH
Aachen University, especially Dieter an Mey, Christian Terboven and Samuel Sarholz,
2
for granting me access to the Niagara 2 systems and further resources and the team of
PAPI at the Innovative Computing Laboratory at University of Tennessee, especially
Dan Terpstra.
The organization of this thesis is split into the chapters 2 and 3, which will give
a introduction to the Niagara 2 architecture and performance analysis. Chapter 4
will analyze the functionality of libcpc 2 and describe a possible mapping to PAPI,
concluded by chapter 5, which will describe the implementation of the PAPI substrate
for the Niagara 2. An analysis of a parallel application benchmark will follow in
chapter 6 using the PAPI substrate.
3
2 Sun Niagara 2 Processor Architecture
2 Sun Niagara 2 Processor
Architecture
2.1 Introduction to the Sun Niagara 2 Processor
The Niagara 2 chip is the second step in Sun’s throughput computing processor line
beginning with its ancestor the Niagara 1. The Niagara line of processors is meant to
be built for data-intensive workloads and parallel execution of tasks. Niagara 2 is the
code name for the UltraSPARC T2, which is the successor of the UltraSPARC T1.
The Niagara 2 yields more cores, strands, execution units and cache compared to its
predecessor. [Sun07c, p. 5 ff., p. 923 ff.]
The design strategy of the Niagara 2 is based on thread-level parallelism (TLP )
instead of instruction-level parallelism (ILP ) used on many other processor implementations. TLP has the main focus on many active threads instead of complex optimization strategies during run time for parallelization which helps to reduce memory
latency. In case of the Niagara 2 the processor offers 64 virtual processors. A typical
ILP-based processor offers usually just as many active threads as cores exist with the
possibility to further optimizations during run time. [HP06, p. 172 ff.]
Each core in the Niagara 2 handles up to 8 independent strands, which will be executed
in manner of time-slicing. In theory each strand gets up to 1/4th of the computing
power of one core for integer operations and 1/8th for floating-point and load/store
operations. More details on scheduling and the structure of cores is discussed in
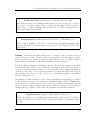
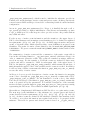
section 2.2. The structure of the execution units of the Niagara 2 can be seen in
figure 2.2.
The predecessor of the Niagara 2 was already built up on these principles but the
hardware configuration was quite different. The Niagara 2 has two integer pipelines
and one floating-point pipeline shared by the strands on one core whereas the Niagara
1 was only equipped with one integer pipeline per core and one floating-point pipeline
shared among all cores. The integer pipelines are shared between two groups of four
strands of a core. These enhancements made the Niagara 2 even more attractive for
4
2.2 Chip-Multithreading and Scheduling
use in High Performance Computing (HPC ) applications, especially the drastically
increased floating-point performance, which can be utilized by dispatching at least
eight threads distributed on all available cores. [Sun07c, p. 923 ff.]
All cores in the Niagara 2 are fully SPARCv9-compliant and therefore all applications
built against the target are eligible for execution on this new generation of machines
without any changes. As it is common today for enterprise-class processors the Niagara 2 architecture is a full 64-bit architecture. Each core has an own cache for
instructions and data which is shared by all strands on this core. The L2 cache is
connected to the cores using a cache crossbar (CCX) interconnection. The memory
controlling units (MCU) are directly connected to a specific L2 cache and each of the
four MCUs accesses its own branch of memory associated to the relevant L2 cache to
which it is connected, more details in section 2.3.
In summary the Niagara 2 processor is a processor designed for modern demands,
but as the organization of the Niagara 2 is quite different to more common processors
available on the market optimization and tuning of applications is needed. Tuning
an application for the Niagara 2 requires in addition other approaches than these
needed for tuning applications for an ILP-based processor. In [Gov07, p. 114] three
options for optimizations are outlined which consist of the use of more threads, a
reduced instruction count and a reduction of stall times. For the reduction of stall
times furthermore an exception is made in [Gov07, p. 114]:
”This might not directly improve performance because stall time on our
thread is an opportunity for another thread to do work. When the core is
issuing its peak instruction rate there are no possible performance gains
from reducing cycles spent on stall events.”
The following sections will describe more details on the Niagara 2 processor. Section
2.2 will show more details about Chip-MultiThreading (CMT ) and scheduling on the
Niagara 2 followed by sections 2.3 and 2.4 which will cover the memory architecture
and coherence mechanisms used in the Niagara 2. The chapter will be concluded by
in introduction to the performance counters available on the Niagara 2 in section 2.5.
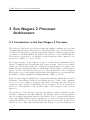
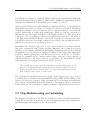
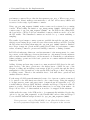
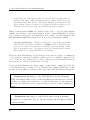
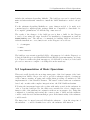
2.2 Chip-Multithreading and Scheduling
The Niagara 2 is built up on the TLP model which is clearly observable in hardware
design. TLP is another, from the viewpoint of the instruction flow more higher-level,
parallelism approach compared to the often used ILP.
5
2 Sun Niagara 2 Processor Architecture
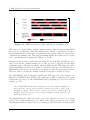
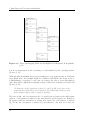
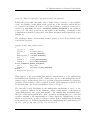
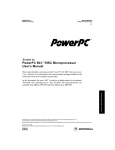
Figure 2.1: ”Differences Between TLP and ILP” from [Sun07c, p. 2]
TLP tries to avoid the highly complex compilers and specialized execution units which
are needed for techniques of ILP like instruction reordering or speculative execution
and branch prediction, which have no guaranteed success rate. Instead of speculative
optimization techniques, the TLP approach simply utilizes more threads for a better
level of parallelism in an application. [HP06, p. 172 ff.]
In figure 2.1 the execution of the same fictional workload on an TLP and ILP processor
can be seen in the optimal situation for a TLP processor. In this case the main
emphasis is put on the memory latency which is hidden by the TLP approach with a
special scheduling and can not be applied on the fictive ILP processor in this case as
hiding memory latency by reordering or speculative execution is not always possible.
Therefore this is a worst-case example from the viewpoint of an ILP processor.
The UltraSPARC 2007-architecture classifies the TLP approach of the Niagara 2 as
Chip-Level Multithreading (CMT ) and defines the possible configurations together
with technologies used on other UltraSPARC 2007-compliant processors as follows in
[Sun08e, p. 593]:
”An UltraSPARC Architecture 2007 processor may include multiple virtual processors on the same processor module to provide a dense, highthroughput system. This may be achieved by having a combination of
multiple physical processor cores and/or multiple strands (threads) per
physical processor core.”
The implementation of this idea in the case of the Niagara 2 is based on a design
with a total of eight independent cores. Each of the eight cores serves a total of eight
strands which share two integer (IU ), one floating-point (FGU ) and one memory unit
6
Strand #6 [2.2]
Strand #8 [2.4]
Core
L2$ #4
L1$
Integer Unit
L2$ #5
L2$ #6
L2$ #7
L2$ #8
FBD
L2$ #3
FBD
Core
MCU
L2$ #2
FBD
Strand #7 [2.3]
Core
FBD
Strand #5 [2.1]
Core
L2$ #1
MCU
Thread Group #2
ded. Int-Unit, shared FGU/LSU
Core
Core
MCU
ded. Int-Unit, shared FGU/LSU
Integer Unit
Core
CCX
Strand #2 [1.2] Strand #4 [1.4]
Thread Group #1
LSU
Strand #3 [1.3]
FGU
Strand #1 [1.1]
MCU
2.2 Chip-Multithreading and Scheduling
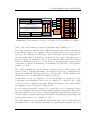
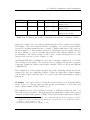
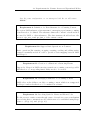
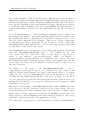
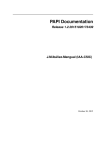
Figure 2.2: The structural overview of a Niagara 2 core in reference of [Sun07c]
(LSU ). All of these units are designed as pipelining units. [Sun07c, p. 3]
The eight strands are split up in two different thread groups and are scheduled in
a time-slicing manner. One strand is always scheduled just for one cycle and can
issue up to two instructions, which may consist of an integer operation dispatched to
the integer unit which is dedicated to the thread group or any of a floating-point or
memory (load/store) instruction. Due to the fact that the FGU and LSU are shared
between both thread groups of a core, the thread group which least-recently used one
of the units, is eligible for submitting a new instruction to the FGU or LSU pipeline.
[Sun07c, p. 895 ff.]
The context switching between the strands of a thread group is realized with no additional cost due to pipelined scheduling. An exception is a resource conflict when two
threads from different thread-groups try to access the LSU or FGU simultaneously,
which will lead to one stalled thread. [Sun07c, p. 895 ff.]
A structural overview of a Niagara 2 core is shown in figure 2.2. In figure 2.2 gray
components are independent, blue nodes are exclusive to a thread group, orange
colored nodes denote shared components. Further descriptions of the components in
the diagram are provided in the following sections.
For an operating system the Niagara 2 is recognized as a set of 64 virtual processors
(8 cores x 8 strands) which can be independently scheduled. Important in this case is,
that each virtual processor is able to dispatch interrupts and traps and is meant as a
execution unit for a single software thread with all necessary integer and floating-point
registers, state registers, etc.. [Sun08e, p. 596]
The CMT definition by the UltraSPARC 2007-architecture does not define additional
algorithms used for the in-depth scheduling and pipelining mechanisms used by a
7
2 Sun Niagara 2 Processor Architecture
CMT implementation. [Sun08e, p. 623]
In $OSSRC/mpo.c a comment indicates that for sun4v-based systems like the Niagara
2 a good approach for optimal performance is to change the thread binding when
the load of a core exceeds 50%. The source file belongs to the memory placement
optimization (MPO) subsystem of the dispatcher of the Solaris kernel and is an optimization approach specially for NUMA systems where the placement of running
processes and threads is very important for optimal run time results. [MM06, p. 795
ff.]
In addition to MPO Solaris has another mechanism which enhances the dispatcher
for CMT systems. CMT systems might implement an own policy for the optimization
of the thread and process placement, which is based on the used CPU architecture.
For the sun4v driver for CMT optimizations found in $OSSRC/cmp.c no special CMT
policy is implemented. In this case a default policy with emphasis on balancing is
used.
In order to provide better algorithm decisions for dispatching the floating-point, memory and instruction pipeline are marked as shared resources on a core and the caches
are marked as shared between the cores. The algorithms used for the special scheduling for CMT systems can be found in $OSSRC/cmt.c and in the core dispatcher in
the file $OSSRC/disp.c.
2.3 Memory Architecture and Organization
The memory hierarchy defined in the Niagara 2 architecture is split in a L1 cache, a
L2 cache and the physical memory shared by all cores. The architecture features a
shared memory model based on a uniform memory architecture (UMA), which means
that memory in the system has a continuous memory addressing scheme with a flat
structure and each core can address and access all physical memory available on the
whole system at the same latency.
This section will describe the memory hierarchy of the Niagara 2 architecture, starting
from strand-bound registers up to the physical memory based on a single processor
socket configuration.
Register sets are available on each core for each strand with support of register
windows based on the SPARC-architecture. For each strand a full register file exists,
which consists of eight register windows. [Sun07c, p. 5]
8
2.3 Memory Architecture and Organization
ASM Reg
%i0 . . . %i7
%l0 . . . %l7
%o0 . . . %o7
%g0 . . . %g7
Name Count
Address
Usage
in
8
R[24] . . . R[31] General-purpose, used for input
parameters from the caller
local
8
R[16] . . . R[23] General-purpose, used in the current routine
out
8
R[8] . . . R[15] General-purpose, used as output
parameters for a called routine
global
8
R[0] . . . R[7] General-purpose, shared between
all windows
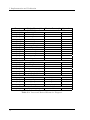
Table 2.1: Available Registers in a Niagara 2-window by reference of [Sun08e,
Sun07c]
The basic register set described by [Sun08e] comprises of a set of general-purpose
registers, called ”R-Registers”, a set of floating-point registers and floating-point state
registers. More registers in the Niagara 2 exist, but are related to special operational
modes and processor state management and therefore omitted. One special kind of
registers, the performance instrumentation counter registers (PIC ), will be outlined
in section 2.5.
All R-Registers are 64-bit wide and are partitioned into global, windowed and special
registers. In total 32 R-Registers are available to a strand which can be used for all
kinds of integer operations.
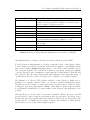
Table 2.1 gives an brief overview on the amount and naming of the R-Registers available as defined in [Sun08e, p. 49 ff]. More details about usage conventions of these
registers are available in [Gov08, p. 27, t. 2.1].
Register windows are a benefit of the UltraSPARC architecture defined in [Sun08e, p.
24] derived from the RISC I and II design specified at the University of California
in Berkeley. Utilizing register windows an application can easily provide a full and
clean register set to a called function. Switching between register windows instead
of storing register values to memory and cleaning registers can save processing cycles
for the execution of a program which does frequent function calls.
Once the amount of register windows is exhausted and another function call needs
a new register window, the oldest window will be saved to main memory in order
to provide the called function a clean register set and to be able to restore the old
window when all function calls end and come back to the oldest window. The store
operation to memory in order to provide a clean register windows is called spilling,
the restoration of an old windows is called filling. The management of spills and fills
9
2 Sun Niagara 2 Processor Architecture
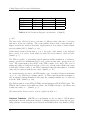
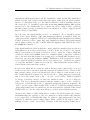
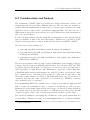
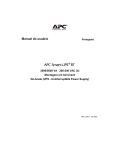
Figure 2.3: ”Three Overlapping Windows and Eight Global Registers” from [Sun08e,
p.51]
is done by traps issued by the executing core and handled by the operating system.
[Gov08, p. 28]
Although this mechanism has several advantages for program execution, disadvantages might arise. An example might be a function call which only needs access to
a small number of registers or even only one register. In order to serve this function
call a trap will be dispatched rendering a huge overhead for servicing as described in
[Gov08, p. 28]:
”A downside of this approach is that if a spill (or fill) trap does occur,
sixteen 64-bit registers have to be stored to (or loaded from) memory, even
if the routine requires only a couple of registers.”
The reason why only 16 registers need to be saved/restored and not the full register
window of 24 registers is caused by the fact that the global -registers are shared by
all register windows and therefore always stay active, the out-registers of window
W0 become the in-registers of window W1 and therefore only new local - and out-
10
2.3 Memory Architecture and Organization
ASM Reg
%q0 . . . %q60
Precision
quad
Count
16
%d0 . . . %d62
double
32
%f0 . . . %f31
single
32
Address
FQ [0] . . . FQ [60]
Usage
128-bit wide, address incremented by 4
FD [0] . . . FD [62] 64-bit wide, address incremented by 2
FS [0] . . . FS [31] 32-bit wide, only the lower
registers are usable
Table 2.2: Floating-point register configuration in reference of [Sun08e, Sun07c]
registers for window W1 are required which means in total 16 registers are required.
The sharing of the global -registers and the overlapping of in- and out-registers which
are used for passing parameters into a routine or push results back to the caller are
shown in figure 2.3. The instructions used for switching between register windows
are save [Sun08e, p. 319] for creating a new window and restore [Sun08e, p. 311]
for returning to the ancestor window. The cost for a save and restore are on the
Niagara 2 in each case 6 cycles. [Sun07c, p. 901]
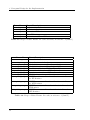
An UltraSPARC 2007-compliant processor has a dynamic configuration of 64 32-bit
wide floating-point registers. The registers can be configured in amount of registers
competing against the width of the register available. Table 2.2 shows the different
configurations.1
The configuration of the registers depends only on the addressing scheme used as the
registers are only once physically available. When accessing these registers further
care should be taken about the data to be loaded as the single values must be aligned
in memory.
L1 Caches are located on the cores directly and are shared across all strands which
reside on the core. The L1 caches are split up into an instruction, a data cache and
table-lookaside buffers (TLB ). [Sun07c, p. 8]
The instruction cache (I-Cache) has a total size of 16 Kbytes with a line size of 32
byte and is 8-way associative. The replacement algorithm used for this cache is based
on linear feedback shift registers (LFSR)2 with a random line replacement. [Sun07c,
1
As quad-words are listed here it should be noted, that although the data type is supported in the
configuration scheme of floating-point registers, the operations need to be emulated in software.
[Sun07c, p. 32 ff.], [Sun07c, p. 97]
2
No further details provided, see [Sun07c, p. 937]
11
2 Sun Niagara 2 Processor Architecture
Cache
L1 I-Cache
L1 D-Cache
ITLB
DTLB
Size
16 Kbytes
8 Kbytes
64 Entries
12 Entries
Associativity
8-way
4-way
full
full
Line Size
32 byte
16 byte
—
—
Table 2.3: L1 Caches in Niagara 2 in reference of [Sun07c]
p. 937]
The data cache (D-Cache) has a total size of 8 Kbytes with a line size of 16 bytes
and has a 4-way associativity. The cache handles writes with a write-through to
higher levels in the memory hierarchy. Replacement is done using a least-recentlyused algorithm (LRU ). [Sun07c, p. 938]
Cache misses in the I-Cache have a cost of 24 cycles, cache misses of the D-Cache
have a total of 26 cycles. Both values are unloaded access times to the L2 Cache.
[Sun07c, p. 5]
The TLB is capable of performing typical instructions like translation of addresses,
unmap operation for invalidating pages, read operations and write operations in one
cycle. The replacement policy used for the TLB consists of two flags: The used bit
marks and entry as being used and the valid bit records the state whether the entry
is still valid. When a write to the TLB is initiated either the first unused or invalid
entry will be replaced with the new entry. [Sun07c, p. 155]
As concurrent write accesses to the TLB might occur – it is shared between all strands
on a core – the TLB drops existing entries: ”A TLB replacement that attempts to
add an already existing translation will cause the existing translation to be removed
from the TLB.” [Sun07c, p. 148]
The TLB is split in a data TLB (DTLB ) and an instruction TLB (ITLB ) part. The
ITLB holds 64 entries and is fully-associative, the DTLB holds up to 128 entries and
is fully-associative, too. [Sun07c, p. 3]
All caches in the L1 area can be seen at a glance in table 2.3
Hardware Tablewalk (HWTW ) is a mechanism for the resolution of TLB misses
implemented directly in hardware instead of utilizing privileged software like an operating system for retrieving the needed data from Translation Storage Buffers (TSB ).
12
2.3 Memory Architecture and Organization
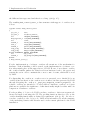
Figure 2.4: ”PCX Slice and Dataflow” from [Sun07a, p. 6-2]
The HWTW is implemented as a functionality of the MMU for a gain in performance
of TLB miss resolution. [Sun08e, p. 531 ff.] [Sun07c, p. 110 ff.]
The HWTW is used to fetch a missing Translation Table Entry (TTE ) from the
software translation table and inserts it into the serviced TLB in an atomic write
operation. [Sun07c, p. 110 ff.]
In case of the Niagara 2 the HWTW on the MMU is ”stranded and pipelined” and can
therefore handle multiple requests. Each strand might have four requests pipelined
which yields in total up to 32 outstanding requests in the HWTW pipeline. As the
option for disabling HWTWs does exist, software TLB reloads are supported on the
Niagara 2. The mechanism for the software translation operations is initiated by an
exception issued by the MMU and then serviced by an TLB miss handler. [Sun07c,
p. 110, p. 114 ff.]
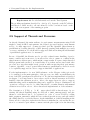
L2 Caches are connected to the cores using a cache crossbar (CCX ). The crossbar
access is unidirectional and divided into a processor to cache lane (PCX ) and a cache
to processor lane (CPX ). For both, PCX and CPX, the mechanisms are similar, but
with exchanged directions. In order to maximize the performance of the cores, the
L2 cache accesses are interleaved on a total of eight L2 cache banks. [Sun07a, p. 6-1],
[Sun07c, p. 3]
Requests to the L2 cache are sent out as single requests via the PCX and need
to process several multiplexer stages which handle the interleaving and redirect the
request to the right L2 bank. The decision which bank to be taken is made by the
bits of the physical destination address. Figure 2.4 shows the multiplexer structure
of the PCX crossbar.
13
2 Sun Niagara 2 Processor Architecture
Due to the fact that multiple cores may send requests in parallel the PCX needs
arbitration. The arbitration is based on the FIFO principle. Additionally the PCX
supports a queue depth of 2 requests, which means that atomic operations can be
realized using the PCX without any additional synchronization and no additional
load for the cores.
The total amount of L2 cache is 4 Mbytes and a combined instruction and data
cache. Each cache has 64 byte cache lines and is 16-way associative. The replacement
algorithm used for the cache is based on a pseudo-LRU algorithm. [Sun07c, p. 939]
The pseudo-LRU algorithm is based on a not-recently used (NRU ) replacement of
cache lines. For the NRU replacement a used bit exists which is marks a cache line
as being used and additionally a allocate bit which locks a cache line while it is used
in a multicycle operation. If the used bit is set at cache lines, all other lines which
previously had the used bit set, will loose their used bit.
For the replacement a replacement pointer is used. The pointer is incremented and
used when a cache miss and fill occurs and a line needs to be replaced. It then
replaces the first line which is not in used as indicated by the used bit and not
currently allocated. [Sun07c, p. 940]
The interleaving of the L2 cache is based on 64 byte ranges and the operation of the
banked L2 caches is completely independent. Each pair of L2 banks has access to a
memory control unit (MCU ) dedicated to the pair. Only MCUs can access the main
memory directly. [Sun08a, p. 2-1, p. 2-4 ff]
Main memory is split up in four independent branches which are connected to one
MCU each. The requests a memory branch must service are issued from two different
L2 cache banks. The Niagara 2 uses DDR2 fully buffered DIMMs (FBD), with a
width of two channels for each branch. [Sun07c, p. 355] [Sun08a, p. 1-6]
The L2 banks connected to an MCU can issue one read or write request to an MCU
at a time. After an transaction has been completed the next request has to wait for
three cycles. At most an L2 cache can queue eight read requests at any time, which
can be fulfilled by a MCU read transaction. For each request a L2 bank issues to its
MCU it needs to synchronize to the clock speed of the MCU which is at 800 MHz,
the L2 clock speed is bound to the core clock speed generated by the Clock Control
Unit (CCU ) at 1.4 GHz. Read requests might be reordered in order to reduce the
number of stalls due to limitations of the DIMMs. [Sun08a, p. 3-26 ff., p. 5-7]
Write transactions are placed into a write request queue of the MCU and acknowledged by a message. After one transaction has been queued and an acknowledgement
14
2.4 Memory Model and Coherence
Figure 2.5: ”UltraSPARC T2 Address Space” from [Sun07c, p. 70]
has been received, the L2 bank can start to send another write request. The transfer
of a 64 byte write request takes eight cycles to complete. [Sun08a, p. 3-28]
The total latency for all required steps in order for read and write requests based
on 4-4-4 800 MHz DDR SDRAMs is about 92.75 ns for a read request and 70.25 ns
for a write request. These latencies are based on an unloaded MCU and not are not
including L2 latencies or operations needed in L2 to fulfill a transaction. [Sun08a, p.
3-45]
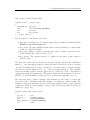
2.4 Memory Model and Coherence
The Niagara 2 supports two different kinds of memory operations and one coherence
domain. The memory operations are split into:
• cacheable accesses inside the coherence domain
• noncacheable accesses outside the coherence domain
Cacheable accesses are all accesses to data residing in the real memory of the system,
whereas noncacheable accesses point to memory which is outside of the real memory,
e.g. I/O buffers. Accesses to noncacheable data are handled by the Noncacheable
Unit (NCU ). A full list of address ranges on Niagara 2 specified by the address space
identifier (ASI ) is shown in figure 2.5. If bit 39 of the physical address is set, always
I/O spaces are used. [Sun07c, p. 70 ff., p. 229, p. 931] [Sun08e, p. 408]
Cacheable accesses inside the coherence domain need to be maintained between
the L1 caches of all cores and, depending on the physical position of the data, exactly
one L2 cache which is responsible for this particular branch as explained in section
15
2 Sun Niagara 2 Processor Architecture
2.3. As the L1 caches operate in write-through mode, all changes to a cache line will
be sent to the L2 cache immediately.
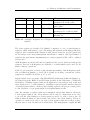
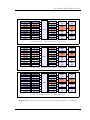
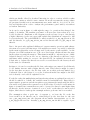
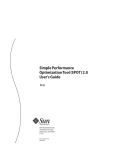
In order to guarantee coherence the L2 cache utilizes a directory-based mechanism.
This directory keeps track of which L1 cache holds which cache line. When a L1
cache wants to write a line to the L2 cache (figure 2.6(a)), it sends an update to
the L2 which yields an immediate invalidate to all other L1 caches and the L2 cache
stores the modified cache line (figure 2.6(b)). After the transaction has finished, all
L1 caches can refresh the cache line (figure 2.6(c)). Due to the limitations of the CPX
protocol a cache line in L1 cache may only be in the D-Cache or I-Cache, but not in
both. [Sun07c, p. 941]
Further coherence protocols do not need to be used as the FBDs are only accessed
by one L2 cache due to the interleaving scheme used with the CCX multiplexing as
explained in section 2.3.
Memory models used in the Niagara 2 is basically built up on the total store order
(TSO) model with certain exclusions based on a relaxed memory order (RMO) model.
The memory models are derived from the UltraSPARC 2007 architecture. [Sun07c,
p. 63]
The minimum requirement for an UltraSPARC 2007-compliant implementation is the
implementation of TSO, which is based on the requirement to guarantee backwards
compatibility to SPARC V8 applications. TSO is the strictest model, which is compatible to the lesser strict models partial store order (PSO 3 ) and RMO, which is the
weakest model. [Sun08e, p. 418]
The TSO model ensures that an application will receive the correct memory contents
in a read operation after a write operation has been issued, but the write operation
may not be completed in higher layers of the memory hierarchy. This method is used
to hide memory latency from the processor and yields a performance gain compared
to an totally serialized memory model. [GGKK03, p. 687]
From the viewpoint of an application the Niagara 2 and its implementation of TSO
cares for a side-effect free behavior when accessing any contents of the real memory
in the system. [Sun07c, p. 63 ff.].
One of the exceptions for the use of the TSO model are accesses to noncacheable
data, which require synchronisation using membar instructions in order to guarantee
consistency between read and write operations. Another exception is exposed by block
3
Not implemented on Niagara 2.
16
2.4 Memory Model and Coherence
Core #1
L1$ #1
L2$ #1
Core #2
L1$ #2
L2$ #2
Core #3
L1$ #3
L2$ #3
Core #4
L1$ #4
Core #5
L1$ #5
Core #6
L1$ #6
L2$ #6
Core #7
L1$ #7
L2$ #7
Core #8
L1$ #8
L2$ #8
CCX
L2$ #4
L2$ #5
MCU
#1
FBD
#1
MCU
#2
FBD
#2
MCU
#3
FBD
#3
MCU
#4
FBD
#4
(a) L1$ #3 wants to write, L1$s #1,5,6 share the line
Core #1
L1$ #1
L2$ #1
Core #2
L1$ #2
L2$ #2
Core #3
L1$ #3
L2$ #3
Core #4
L1$ #4
Core #5
L1$ #5
Core #6
L1$ #6
L2$ #6
Core #7
L1$ #7
L2$ #7
Core #8
L1$ #8
L2$ #8
CCX
L2$ #4
L2$ #5
MCU
#1
FBD
#1
MCU
#2
FBD
#2
MCU
#3
FBD
#3
MCU
#4
FBD
#4
(b) The changed L1$ line can be written back to L2$
Core #1
L1$ #1
L2$ #1
Core #2
L1$ #2
L2$ #2
Core #3
L1$ #3
L2$ #3
Core #4
L1$ #4
L2$ #4
Core #5
L1$ #5
Core #6
L1$ #6
L2$ #6
Core #7
L1$ #7
L2$ #7
Core #8
L1$ #8
L2$ #8
CCX
L2$ #5
MCU
#1
FBD
#1
MCU
#2
FBD
#2
MCU
#3
FBD
#3
MCU
#4
FBD
#4
(c) All other L1$s can retrieve the written line again
Figure 2.6: Coherence between L1 and L2 caches in reference of [Sun07c]
17
2 Sun Niagara 2 Processor Architecture
loads (ldblockf4 ) and stores (stblockf), which are used to load, respectively store,
a block of 64-byte of double-precision floating-point values with memory alignment.
These operations guarantee atomicity only for each value of the whole block. [Sun07c,
p. 33 ff., p. 65] [Sun08e, p. 249 ff., p. 277 ff., p. 338 ff.]
For both exceptions the RMO model is used which enables the system to reorder
read and write operations to reach an overall better throughput. This is desirable
especially for I/O accesses where a source or drain might be blocking. [GGKK03, p.
689]
2.5 Availability of Performance Counters
This section is split into the architectural requirements for performance instrumentation defined by the UltraSPARC 2007-architecture and the final implementation on
the Niagara 2.
Architectural requirements defined by the UltraSPARC 2007-architecture for performance counters are based on the definitions from previous revisions. The high-level
requirements for the counters are split into the following groups as defined on [Sun08e,
p. 457 ff.]:
1. System-wide performance monitoring
2. Self-monitoring of performance by the operating system
3. Performance analysis of an application by a developer
4. Monitoring of an application’s performance
As cited above the UltraSPARC-architecture 2007 provides a performance counter
mechanism as desired for the success of the development of a new backend for PAPI,
which is used for exactly this subject. The description of this requirement backs up
the assumption as defined in [Sun08e, p. 457]
”[...] In this scenario a developer is trying to optimize the performance of
a specific application, by altering the source code of the application or the
compilation options. The developer needs to know the performance characteristics of the components of the application at a coarse grain, and where
4
”The LDBLOCKF instructions are deprecated and should not be used in new software. A sequence
of LDX instructions should be used instead.” — [Sun08e, p. 249]
18
2.5 Availability of Performance Counters
these are problematic, to be able to determine fine-grained performance
information. Using this information, the developer will alter the source
or compilation parameters, re-run the application, and observe the new
performance characteristics. This process is repeated until performance is
acceptable, or no further improvements can be found.
An example might be that a loop nest is measured to be not performing
well. Upon closer inspection, the developer determines that the loop has
poor cache behavior, and upon more detailed inspection finds a specific
operation which repeatedly misses the cache. Reorganizing the code and/or
data may improve the cache behavior.”
The metrics defined by the UltraSPARC 2007-architecture are split in architectural
performance metrics and implementation performance metrics, where architectural
performance metrics describe events belonging to the description of the UltraSPARC
architecture and implementation performance metrics define events for the underlying
microprocessor. An example for an architectural performance metric might be the
number of executed instructions, whereas an example for an implementation performance metric might describe details from the coherence protocol, which might not
be adapted by another UltraSPARC implementation. The implementation performance metrics are in manner of the UltraSPARC 2007-architecture defined with the
background of ”[...] performance-critical cases”, whereas the architecture performance
metrics are relevant for the optimization of applications. [Sun08e, p. 459]
The accuracy defined for the counter interfaces is made up on an trade-off between
complexity for full accuracy and lesser complexity with error classes of 1 error in 1015
for critical performance measurements and 1 error in 103 events for implementation
event counts. The accuracy defines which events belong to which error class at last.
The cause for the misses in accuracy might be caused by the speculative behavior
which might apply to an UltraSPARC 2007-architecture conforming implementation.
[Sun08e, p. 459]
The way performance counters are made available to a developer is by providing performance instrumentation counters (PIC) and performance counter control registers
(PCR) which are associated to the PIC registers. The amount of registers available
is depending on the underlying UltraSPARC implementation, but each PCR has at
least one 32-bit wide counter associated.
For each of the counters only one event can be counted at a time. Events are as
described above implementation specific. If the counter is set up to count events,
each time an event occurs the counter is incremented. The scope of a counter is
dependent on the underlying implementation, as an event might counting with respect
of a processor socket, core, thread group or strand. Counters are usually available on
19
2 Sun Niagara 2 Processor Architecture
a per strand level. [Sun08e, p. 450]
Another important feature is the handling of counter overflows. Traps will be generated — if enabled on the PCR — and sent to the controlling application. The
intention of overflow handling allows counting larger numbers of events with the help
of software. [Sun08e, p. 459]
The implementation of performance counters on the Niagara 2 offers one PIC /
PCR pair for each strand on the processor. The implementation is able to count up
to two events on a counter pair with each counter (PIC.l, PIC.h) having a width of
32-bit in the PIC register. [Sun07c, p. 85, p. 90]
The counter setup is based on the register fields PCR.sl0, PCR.sl1, PCR.mask0 and
PCR.mask1. The sl0/sl1 fields group the available counters into event groups and the
fields mask0 and mask1 select the desired events which should be sampled into the
PIC register. The available bit masks for the PCR registers can be seen in [Sun07c, p.
87 ff, t. 10-2].
The registers PCR.ov0 and PCR.ov1 indicate whether an overflow has occurred during
counting and which counter has overflowed as ov1 is associated with PIC.h and ov0
with PIC.l. The overflow handling is enabled by setting the PCR.toe flag and can be
set independently for the two overflow state registers.
Furthermore the Niagara 2 allows counting in different operating modes, split into
the hyper-privileged, privileged and user mode and offers therefore the bits PCR.ht,
PCR.st and PCR.ut. These bits needs to be set in order to count any events, as events
are otherwise discarded. [Sun07c, p. 86, t. 10-1]
In addition to only processor-relevant events more units of the Niagara 2 support
performance counting. Performance counters are available for DRAM, PCI-Express
and Ethernet units on Niagara 2. For these counters specialized registers exist, which
are related to the implementation performance metrics described by the UltraSPARC
2007-architecture. [Sun07c, p. 91 ff, p. 526, p. 703, p. 725, p. 766]
The Niagara 2 provides a sufficient amount of performance registers for use in the
implementation for PAPI. Further sections will explain how these counters are available in libcpc 2, how they can be programmed and how this can be integrated into a
PAPI substrate.
20
3 Interfaces for Performance
Instrumentation
3.1 Introduction of PAPI and libcpc 2
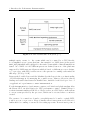
PAPI is an API for accessing performance counters on different platforms in a common way. As each processor vendor defines different processor interfaces to the performance counters, PAPI was built to solve this problem and to handle requests to
these counters in a comfortable way. [PUG]
As for the development of PAPI the main goal was a common and convenient way
to access performance counters on different platforms, PAPI is build up on different
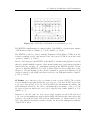
layers for a better abstraction of different tasks found in each layer as shown in
figure 3.1. The main layers are the Portable Layer which offers an API for tool and
application developers and the Machine Specific Layer used to access performance
counters on a given platform. A given platform consists possibly of a certain processor
architecture, a certain operating system, available libraries or a combination of these.
[PUG, p. 7]
The Portable Layer consists of the PAPI Low Level-API enabling a developer to
access all core functions of PAPI and a direct interaction with the counter interface
on a given platform. The PAPI High Level-API defines only a fraction of functions
compared to the PAPI Low Level-API to access the counters, but these functions are
enough to extract performance data using presets defined by PAPI. [PUG, p. 17 ff.]
The Machine Specific Layer handles all direct access to a given platform. The term
direct access is meant as accessing either the counters on a platform directly or by
using a operating system interface for accessing these processor specific functions,
briefly the best way to access counters on a given platform. The Machine Specific
Layer also limits PAPI in its functionality as PAPI supports a large amount of different platforms where some platforms do not support specific functionalities, e.g.
BlueGene/L vs. Linux i386.
Furthermore the Machine Specific Layer offers presets, which may be derived from
21
3 Interfaces for Performance Instrumentation
Figure 3.1: PAPI architecture from [PUG, p. 7]
multiple native events, i.e. the events which can be counted by a CPU directly,
for a simplified access on any platform. An example for a PAPI preset is the preset
PAPI_TOT_INS which will be mapped to the native events which counts all instructions
issued. As of PAPI 3.6.2 107 different presets are defined, but none of the platforms
supported by PAPI supports all presets which is based on different processor designs,
e.g. a processor without L3 caches can not offer presets for counting cache misses in
this stage. [PUG, p. 10 ff.]
Between the Portable Layer and the Machine Specific Layer is the core functionality
of PAPI with support for managing the counter access. Memory allocation, thread
binding and event related issues are handled here, invisible for the developer of a tool
or application for performance counter instrumentation.
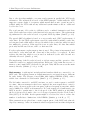
For the instrumentation of performance counters on Solaris-based platforms Sun offers
the library CPC, an abbreviation for CPU performance counter. [Sun08d] libcpc 2
works in a manner similar as PAPI does. libcpc 2 relies on a CPU driver on the system
to access events provided by the processor, which can be accessed after a context is
created.
The events to be counted are bound to sets which may be bound to a single LWP,
a whole process or a processor. libcpc 2 handles all necessary memory allocation for
buffers used for counting or sets needed for setting up events. From an user’s point of
22
3.2 Performance Instrumentation and Monitoring
view there are only pointers returned and all internal handling of memory or direct
processor access for setting up counters is hidden.
Both PAPI and libcpc 2 provide support for handling overflows which might occur to
a performance counter register as their width is limited. PAPI supports in addition
to overflow handling a method for multiplexing a number of counter sets. As the
amount of performance counters is limited to a few registers an instrumentation build
of a program might not be able to sample all the events needed, but with multiplexing
different event sets might be bound to be counting on a round-robin basis. [PUG, p.
50 ff., p. 58 ff.] cpc_set_add_request (3CPC)
For the current PAPI 3.6.2 release a port to Solaris already exists, but this port is
only capable of UltraSPARC II & III processors running with Solaris 8/9 and libcpc
1. The old library interface of libcpc 1 is not compatible to the current interface
of libcpc 2 and all old library function calls are only available as stubs for binary
compatibility like cpc_access (3CPC) .
This chapter will be concluded by an overview of performance instrumentation in
section 3.2 and a brief description of tools related to PAPI and libcpc 2 in section 3.3.
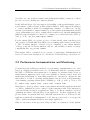
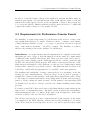
3.2 Performance Instrumentation and Monitoring
Conventional and well-known methods for performance instrumentation are often
based on a high-level analysis based on tools distributed with the operating system.
In UNIX or UNIX-like environment the tools vmstat for statistics with a focus on
virtual memory, mpstat focused on processor utilization, iostat focused on the I/O
subsystems and netstat for networking statistics are often used to analyze the run
time behavior of a whole operating system instance and are based on data structures
of the running operating system kernel. [MMG06, p. 13 ff., p. 22 ff., p. 73 ff, p. 178
ff.] vmstat (1M) mpstat (1M) iostat (1M) netstat (1M)
Using these tools it is possible to make rough estimations whether applications should
or could be optimized in order to achieve a better run time result or the hardware is
overloaded by the execution of applications. These tools offer no insight for low-level
optimizations which could take place in an application. As these applications only
provide details on a system-wide view, either the system needs to be dedicated to the
application which will be instrumented or all other processes need to be stopped in
order to gather meaningful details about a single application.
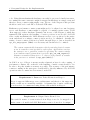
With a focus based on the processes being executed on a system tools like prstat
23
3 Interfaces for Performance Instrumentation
and top exist. These tools rely on information available in kernel data structures
which can be accessed in the procfs filesystem available under UNIX and UNIX-like
operating system. Using these tools it is at least possible to make assumptions on the
run time behavior and possible optimizations. prstat (1M) top (1) proc (4)
An indicator used for performance analysis might for example be the distribution of
used CPU time into the categories system CPU time and user CPU time. System
CPU time is used when an application uses system calls and uses the operating system
to perform tasks like I/O, memory allocation or locking/synchronisation. As synchronisation is an important and therefore often used mechanism for the parallelization
of applications, a high in system CPU time for such an application might indicate a
too strict or bad chosen synchronization algorithm as the parallelized application can
not perform the actually intended tasks.
Under Solaris procfs offers additional statistics for each LWP in addition to statistics
available to whole processes. In this case it is possible to generate more fine-grained
statistics about processes and the performance of sub-tasks handled in single threads
of the process. The analysis of threads is even possible with prstat and top.
The techniques described in this section up to now offer a way for a run time performance analysis, but they are in most cases too coarse-grained for optimizations
in case of highly-parallel applications. As a feedback for the development of highlyefficient algorithms the feedback commonly available at the operating system level is
only usable rarely for in-depth optimizations and might therefore only be usable as
an indicator.
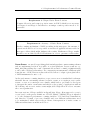
For Solaris in addition to the common performance instrumentation programs the
tools cputrack and cpustat for CPU instrumentation and busstat for instrumentation for buses available on the system (i.e. PCI-Express or FBD channels on Niagara
2) exist. These tools allow the instrumentation of PICs directly available in hardware utilizing libcpc 2 and libpctx without the need to modify an existing program.
libpctx allows access to the performance counters of an existing process and to manipulate and read them. [MMG06, p. 203 ff.]
cputrack (1) cpustat (1M)
busstat (1M) libcpc (3LIB) libpctx (3LIB)
The sampling of PICs by cputrack is realized in time intervals, which might be
sufficient to get at least an impression of the application behavior during runtime,
but might not be sufficient for fine-grained optimizations. cputrack supports the
multiplexing of events when the count of requested events is larger than the number
of PIC registers available, which is realized by activating certain events for one interval
and then switching over to the next set of events to be monitored.
At a glance the introduced applications in this section might be combined to the
24
3.3 Tools related to PAPI and libcpc 2
following three groups in a manner of application performance instrumentation from
an application developers point of view:
System performance monitoring by using tools like vmstat for an general overview
of the total system performance.
Application performance monitoring by using tools like prstat for the monitoring
of an application’s performance.
Application performance instrumentation with in-depth execution details using tools
like cputrack or extending programs by libraries for PIC access or developing
direct PIC access.
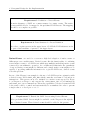
In [MMG06, p. 7] a similar approach is mentioned, but with a more operator-driven
point of view. The approach is built up on three layers with layers 1 and 2 being
similar to the mentioned groups ”System performance monitoring” and ”Application
performance monitoring”, but layer 3 ”Application performance instrumentation” being exchanged as a layer for debugging and tracing applications with tools like truss,
a system call tracing application, DTrace 1 , an extensible and flexible tracing application for Solaris or MDB, an extensible debugger for Solaris. truss (1) dtrace
(1M) mdb (1)
Section 3.3 will give more details on performance instrumentation located in the group
of application performance instrumentation and therefore introducing comparatively
fine-grained technologies and methods for the extraction of performance data used
for the development of highly-efficient and highly-parallel applications.
3.3 Tools related to PAPI and libcpc 2
This section will introduce several high-level approaches for performance instrumentation related to PAPI and/or libcpc 2. High-Level in this case means applications
which rely on PAPI or libcpc 2 for performance instrumentation and offer a wide
range of analysis solutions based on performance counter data retrieved from an application. This section is only an overview and does not introduce all of the available
applications for performance analysis.
Sun Studio is an IDE and compiler set built by Sun Microsystems. Sun Studio
has the ability to instrument the performance of an application and to visualize the
1
Can be used to instrument PICs using libcpc, more details available at http://wikis.sun.com/
display/DTrace/cpc+Provider (access on 2009-08-05).
25
3 Interfaces for Performance Instrumentation
collected data directly in the IDE. One special kind of the metrics available through
the Performance Analyzer of Sun Studio are hardware counter metrics. Additional
support for MPI, memory, synchronization and clock profiling metrics are provided.
The data is collected using a special Collector Tool available for C, C++, FORTRAN
and Java programs. Documentation for the Sun Studio Performance Analyzer can be
found in [Sun07b].
The Collector Tool uses libcpc 2 to gather performance counter metrics from the
underlying PICs. The tool used for collecting data is collect supplied with the
Sun Studio distribution. collect can be set up for creating an experiment using
performance counter data with the command line switch -h. An example output of
the collect command is available in the appendix on p. 93. The output lists all
available native events of collect.
The sampling of performance counter data is realized by using interrupts generated by
PIC overflows. The signal used for interrupts is SIGEMT. Using the Analyzer features
it is possible to correlate the overflows to code regions and functions. An automatic
translation of overflow positions to source code is made by Sun Studio in order to
support the optimization of applications. [Sun07b, p. 144 ff.]
The home page of Sun Studio can be found at: http://developers.sun.com/
sunstudio/
Vampir is a visualization solution for parallel software. The origins of Vampir are
at the TU Dresden University and Research Centre Jülich. Vampir consists of multiple components for trace collection, analysis and visualization. The component for
the analysis and visualization of performance data is called Vampir. For the analysis of parallel applications Vampir offers several specialized visualization methods.
[GWT07]
The data aggregation and processing is either done using VampirServer which is
designed to handle big and many trace files or directly on the client with a smaller data
set. VampirServer allows to handle the analysis of applications in large environments
as the analysis of data with VampirServer can run distributed and in parallel using
MPI. [GWT08]
Trace files, which hold performance data, are generated using VampirTrace. VampirTrace generates output in the Open Trace Format (OTF ), which is also developed
at TU Dresden. Using VampirTrace performance data can be collected with support
for MPI, OpenMP or PThreads-based applications. For the collection of performance
counter data VampirTrace relies on PAPI or libcpc 2. Additionally support for NEC
SX-based machines is directly available in VampirTrace. [TUD09]
26
3.3 Tools related to PAPI and libcpc 2
As explained in the manual, support for performance counter data needs to be enabled during build time and can then be enabled by using the environment variable
VT_METRICS. In case of a PAPI-based sampling of performance counter data PAPI
presets can be used to retrieve data. [TUD09, p. 21]
The homepage of Vampir can be found at http://www.vampir.eu/, VampirTrace is
available at http://www.tu-dresden.de/zih/vampirtrace.
Scalasca is another approach for the optimization of parallel applications originated
at the Research Centre Jülich. The aim of Scalasca is to provide performance analysis
capabilities especially for large-scale environments like the BlueGene or Cray XT
systems. Scalasca is the successor of KOJAK. [FZJ09]
Scalasca consists of several components used for different tasks found for the all-inone analysis of parallel applications. The instrumentation of hardware performance
counters in Scalasca is available through the EPIK library and is based on PAPI.
[FZJ09, p. 27 ff.]
Using Scalasca users can instrument parallel applications based on e.g. OpenMP or
MPI written in C, C++ or Fortran. The intention of Scalasca is to support users in
iterative optimization cycles leading to optimized applications. [FZJ09, p. 2]
The visualization component of Scalasca, CUBE, provides optimized representations
of information about the execution of parallel applications.
The home page of Scalasca can be found at http://www.fz-juelich.de/jsc/scalasca/,
KOJAK can be found at http://www.fz-juelich.de/jsc/kojak/.
As explained in this section PAPI and libcpc are used by tool developers to enrich
their tools with support of hardware performance counter interfaces. The feedback
of the performance counters is used as an additional source of information for optimization besides of special instrumentation techniques used for the tracing of parallel
applications.
27
3 Interfaces for Performance Instrumentation
28
4 Conceptual Design for the
Implementation
4.1 Comparison of PAPI and libcpc 2
PAPI and libcpc 2 are both used for access to performance counter data, but they
track different needs and are therefore different in the handling of performance counters, operational modes, data structures and programming aspects.
The intention of PAPI is to provide a platform-independent performance instrumentation solution with support for advanced features on different processor architectures
and different operating systems unified in one common API. libcpc 2 is more platformdependent as it is only available on Solaris-based platforms and offers just support for
the capabilities of the underlying processor architecture. Functionality which might
be available on another processor architecture is not emulated on other platforms in
software in order to provide the same interface. [PUG, p. 6] libcpc (3CPC) cpc
(3CPC)
For the adaption of different underlying processor architectures and operating systems
the design of PAPI consists of several layers for accessing the underlying platform
whereas libcpc 2 has a rather flat structure. Both libraries define an own API exposed
to developers and have an internal layer. In case of libcpc 2 the internal layer is used
to adapt the capabilities of the underlying processor and ensuring the conformance
of requests sent to the API. Further tasks are not provided through the internal
API, whereas PAPI offers advanced features like e.g. multiplexing, derived events and
profiling.
As the advanced features of PAPI depend on underlying hardware capabilities, PAPI
offers a software emulation of certain counting modes in order to ensure a true common
interface for developers. As each abstraction layer needs to be served, PAPI yields
compared to libcpc 2 a slightly higher overhead which might influence the results of
the performance counters.
Figure 4.1 gives an overview of the features available in PAPI and libcpc 2 and the
29
Derived Events
(PAPI-only)
CPU-Driver
Basic Operations
Presets
(PAPI-only)
Native Events
4 Conceptual Design for the Implementation
(CPC-only)
HW Overflows
Profiling
(PAPI-only)
SW Overflows
(PAPI-only)
OS-Adaption
Multiplexing
(PAPI-only)
(PAPI-only)
Figure 4.1: Features and Dependencies in PAPI and libcpc 2
Capability
Native Events
Preset Events
Derived Events
Basic Operations
Multiplexing
Overflow Handling
Profiling
PAPI
libcpc 2
Yes
Yes
Yes
No
Yes
No
Yes
Yes
Yes
No
Yes, in SW & HW Yes, HW
Yes, in SW & HW
No
Table 4.1: Overview of Features in PAPI and libcpc 2
dependencies which will be further explained in the following sections. Table 4.1 adds
figure 4.1 by a brief listing of features and references and adds subsystems used by the
implementation, where HW refers to direct interaction with a hardware capability
and SW refers to a software emulation of a feature.
In section 4.2 an overview of events available in libcpc 2 will be given with further
accuracy tests. Sections 4.3 and 4.4 will analyze both libraries and form requirements
used in the later development of the substrate. In section 4.5 the capabilities of both
libraries in case of multi-threading will be compared.
4.2 Counter Availability and Accuracy in libcpc 2
A main concern about the capabilities of the PAPI substrate for the Niagara 2 is the
availability of events exported by libcpc 2 as the library itself does not provide direct
access to the PCR. Therefore all native events supported by the substrate depend on
30
4.2 Counter Availability and Accuracy in libcpc 2
Event Name Event Description
Idle_strands Number of times no strand on the monitored core was
eligible for being dispatched. Might be blocked by privileged software for privacy reasons.
Br_completed Completed branches during execution.
Br_taken Mispredicted branches.
Instr_FGU_arithmetic Instructions executed on the FGU.
Instr_ld Load instructions executed.
Instr_st Store instructions executed.
Instr_sw Software-triggered counter, activated by sethi instruction with special parameters. [Sun08e, p. 310]
Instr_other Other instructions executed, which are not in the previous groups.
Atomics Atomic instructions executed.
Instr_cnt Total count of executed instructions.
Table 4.2: libcpc 2 Native Events: Instructions, in reference of [Sun07c]
the implementation of libcpc 2 and its lower layers, which access the PCR.
For the Niagara 2 implementation of native events the source of the libcpc 2 driver
for the Niagara 2 holds the bit masks, which will be applied to the PCR.sl register
and can be found in $OSSRC/niagara2_pcbe.c. All of the events available can be
discovered through the call of the libcpc 2 function cpc_walk_events_all (3CPC)
. As the Niagara 2 has a symmetric counter interface which means both PCR and
PIC registers offer the same functionality with limitations like the same setup of
operational modes, the events on Niagara 2 are countable on both PIC registers.
The limitation of only two PIC registers available on the Niagara 2 limits the capabilities for counting complex events or to monitor complex circumstances where
information about a bunch of events is necessary. As the setup of events for libcpc
2 using the cpc_set_add_request (3CPC) call is limited on the symbolic names,
no self-defined combinations of counter setups on the Niagara 2 through libcpc 2 are
possible.
Through libcpc 2 a total count of 39 events is available. With a prospect of PAPI
presets several of these events are irrelevant as they are relevant to special processor
features like the cryptographic unit of the Niagara 2. Tables 4.2, 4.3 and 4.4 show the
events related to be further used as native events for the definition of PAPI presets.
In total there are 27 events, which might be usable.
31
4 Conceptual Design for the Implementation
Event Name
IC_miss
DC_miss
ITLB_miss
DTLB_miss
TLB_miss
Event Description
L1 Instruction cache miss
L1 Data cache miss
Instruction TLB miss
Data TLB miss
Instruction and Data TLB miss
Table 4.3: libcpc 2 Native Events: L1 cache and TLB, in reference of [Sun07c]
Event Name
L2_imiss
L2_dmiss_ld
Stream_ld_to_PCX
Stream_st_to_PCX
CPU_ld_to_PCX
CPU_ifetch_to_PCX
CPU_st_to_PCX
MMU_ld_to_PCX
ITLB_HWTW_ref_L2
Event Description
L2 cache misses for instructions
L2 cache misses for loads
No definition given in [Sun07c, p. 87 ff.]
No definition given in [Sun07c, p. 87 ff.]
Load instruction from CPU to L2 cache
Instruction fetches from CPU to L2 cache
Store instructions from CPU to L2 cache
MMU load operations to L2 cache
HWTWs accesses to L2 cache with reference in L2 cache
for ITLB misses
DTLB_HWTW_ref_L2 HWTWs accesses to L2 cache with reference in L2 cache
for DTLB misses
ITLB_HWTW_miss_L2 HWTWs accesses to L2 cache with miss in L2 cache for
ITLB misses
DTLB_HWTW_miss_L2 HWTWs accesses to L2 cache with miss in L2 cache for
DTLB misses
Table 4.4: libcpc 2 Native Events: L2 cache, in reference of [Sun07c]
32
4.2 Counter Availability and Accuracy in libcpc 2
The native events related to the cryptographic unit are:
• DES_3DES_op
• DES_3DES_busy_cycle
• AES_op
• AES_busy_cycle
• RC4_op
• RC4_busy_cycle
• MD5_SHA-1_SHA-256_op
• MD5_SHA-1_SHA-256_busy_cycle
• MA_op
• MA_busy_cycle
• CRC_TCPIP_cksum
• CRC_MPA_cksum
The events available through libcpc 2 can be grouped in three different groups, where
the first group consists of events related to the execution of instructions as shown in
table 4.2, the second group consists of events related to the L1 cache and TLB as
shown in table 4.3 and finally the third group consists of examples related to the L2
cache as shown in table 4.4. Short definitions of the events can be found in [Sun07c,
p. 87 ff.], which are the only source of information regarding these native events
available through libcpc 2.
In the group of execution related events a disadvantage of the strict binding of libcpc
2 to symbolic names can be discovered as there is no way to combine the different
events in order to count different groups of instructions by choice on a single PIC.
As an example the count of Instr_ld and Instr_st could be combined to a single
event in order to provide the PAPI preset PAPI_LST_INS. This event would be able
to count all load and store instructions executed.
As libcpc 2 offers no mechanism to easily combine events, a derived event in PAPI
needs to be created which combines the total count of Instr_ld and Instr_st as a
sum with a disadvantage of using both PICs available on the Niagara 2. The complete
definition of PAPI presets will follow in section 5.3.
Another concern about the events provided by libcpc 2 is the accuracy of the PIC
results, when they are processed and retrieved from an user space application using
libcpc 2. In the documentation of libcpc 2 no notes about the accuracy of counters
can be found, therefore the description of the UltraSPARC 2007-architecture manual
should be valid as explained in section 2.5, which implies a accuracy with only 1 error
in 1015 counter events.
In order to prove the counter accuracy a small application, which relies on libcpc 2
with a predictable counter result was used. In order to produce predictable results the
application relies on the measurement of floating-point operations through the native
event Instr_FGU_arithmetic, which can be easily isolated from other operations.
33
4 Conceptual Design for the Implementation
Counting events like IC_miss or DC_miss is not predictable as the L1 cache is shared
across all strands on a core and therefore memory accesses of another strand could
imply L1 cache misses for the monitored strand.
In case of the test application in theory a total count of 300.000.000 events through
libcpc 2 should be the result of the Instr_FGU_arithmetic event. For the creation of
floating-point events the function does two floating-point multiplications (fmuld) and
one floating-point division (fdivd) on double-words, therefore a total of 3 floatingpoint operations should be visible. As the floating-point operations are executed
across all elements of a 10.000 × 10.000 matrix the result of 300.000.000 events should
be reached.
The assembler code for the relevant part of the function is as follows1 :
! File calculation.c:
[...]
!
34
m[i][j] = m[i][j] * m[j][i]
!
35
* m[(i + (DIM / 2)) % DIM][(j + (DIM / 2)) % DIM]
!
36
/ m[(j + (DIM / 2)) % DIM][(i + (DIM / 2)) % DIM];
[...]
ldd
[%l2+%l1],%f4
fmuld
%f6,%f4,%f6
[...]
ldd
[%l3+%l1],%f4
fmuld
%f6,%f4,%f6
[...]
ldd
[%l0+%l1],%f4
fdivd
%f6,%f4,%f4
std
%f4,[%l4+0]
[...]
The application for running the accuracy tests consists further of the following parts:
1. Initialize a data set
2. Initialize libcpc 2
3. Create a counter context
4. Add events and start counting
5. Call the floating-point function which is going to be analyzed
6. Read counters
1
All irrelevant instructions have been removed.
34
4.3 Requirements for Performance Counter Events
In order to verify the results of libcpc 2 the application was run 100 times under an
identical environment. As each run had the same result and the result of each run
matched the result expected by theory, the mechanism of libcpc 2 has been proven
to be exact and reliable. Further verifications will be made in section 5.5, which will
compare the results of libcpc 2 to the results of PAPI.
4.3 Requirements for Performance Counter Events
The handling of events is important for both libraries as the access to events of any
type qualifies the library to be usable. Events are used to configure a performance
counter which special kind of event — e.g. a type of operations, accesses at a special
stage of the memory hierarchy — should be counted. The handling of events is
therefore the starting point for the analysis of both libraries.
Native Events are events which are directly implemented as countable events by the
underlying processor. libcpc 2 offers information about the symbolic counter names
of different events available through its API. These reported events can be used to
setup a new event counting context. PAPI supports the use of native events through
its API, but only in the PAPI Low-Level API. Native events depend directly on the
platform used and might be called different on other processor architectures, which
renders native events as not portable events to other platforms and are therefore in
both libcpc 2 and PAPI only guaranteed to be available on the same platform.
The handling and availability of native events in libcpc 2 is depending on the underlying processor implementation. Therefore libcpc 2 can be used to generate a
dynamic list of native events available on the platform by using library calls to libcpc
2. All events are returned with their corresponding symbolic name and can later be
passed to libcpc 2 using the symbolic name. All bit masks for the underlying PCR
are handled in lower layers of libcpc 2 and need no further handling in the calling
program.
For native events PAPI offers an allocation algorithm which prevents setting up the
same event to be instrumented twice. The native events are passed into an EventSet,
which maintains the state of counters. If the same event is setup twice on the same
event set, it will be only once allocated on hardware.
The selection and detection of twice requested native events depends on the native
code supplied by the PAPI substrate, which is used as the identification of a native
event. If an event has been setup twice an error code will be passed back as return
35
4 Conceptual Design for the Implementation
code. Using this mechanism the hardware can easily be protected of malicious states,
as counting the same event twice might be mapped in hardware as a single event and
therefore wrong counter results might occur. In case of the Niagara 2 this problem
should not arise as for each PIC a dedicated PCR exists.
Furthermore performance counter events might need to be aligned on control registers
as not each hardware counter might be capable of counting certain events. PAPI
offers support for these hardware demands, but in case of the Niagara 2, which has
symmetric PCR registers, the handling of counter positions is not needed. As PAPI
relies on this mechanism, the PAPI substrate needs to set a position for the native
event and therefore a unique counter position needs to be emulated. Actually the
setting of exact counter positions is possible through libcpc 2, but as described in
cpc_set_add_request (3CPC) not necessary and can therefore be omitted:
”The system automatically determines which particular physical counter
to use to count the events specified by each request. Applications can force
the system to use a particular counter by specifying the counter number
in an attribute named picnum that is passed to cpc_set_add_request().
Counters are numbered from 0 to n - 1, where n is the number of counters
in the processor as returned by cpc_npic(3CPC)().”
As PAPI on top of libcpc 2 means another abstraction layer for the counting of
performance counters, the overhead for the handling of native events should be low
in order to keep the results as accurate as possible. The accuracy of the performance
counters counting in the user-space domain will be directly influenced by all PAPI
operations after a counter has been started on the PIC.
Requirement 1: Enumerate Native Events from libcpc 2
libcpc 2 supports different processor architectures and therefore the supported
native events are not statically available. A dynamic list of native events supported needs to be enumerated using library calls available in libcpc 2.
Requirement 2: Unique Native Event Codes
The symbolic names of events retrieved from libcpc 2 need to be mapped to a
native event code usable in PAPI. Each native event code needs to be unique.
36
4.3 Requirements for Performance Counter Events
Requirement 3: Unique Native Event Positions
Counter allocation and setup is position aware in PAPI, which is not necessary
on Niagara 2 and libcpc 2 and therefore an unique counter position needs to be
generated.
Requirement 4: Accuracy of Native Event Counters
As the counting mechanism of PAPI is residing in the user-space, the amount of
operations should be as low as possible as monitored applications may reside in
user-space either which might influence the results. Furthermore libcpc results
should be not modified by the PAPI substrate in order to guarantee valid results.
Preset Events are used for specifying platform-independent counter naming schemes
and are implemented as far it is possible on a given platform. Preset events are e.g.
PAPI_TOT_INS yielding the count of instructions executed or PAPI_L1_DCM referring
to the count of L1 data cache misses. For comparative measurements on different platforms the use of PAPI Presets reduces the needed effort to adapt a given platform to
a PAPI-instrumented source code.
As the performance counting interfaces on processors are not standardized each manufacturer has an own naming scheme for native events on a certain processor architecture or even on a certain processor family, which leads to problems for developers
to interpret the native event names and therefore the porting of applications with an
API offering only access to native events might yield a high effort in order to measure
the correct parameters.
In recent versions of libcpc available in OpenSolaris, libcpc offers support for generic
events based on the preset definitions of PAPI. [Has09], [OSM09] libcpc is intended
to be the designated performance counting interface on Solaris-based installations
and therefore a bunch of processor families and even different architectures need
to be maintained, which exposes the problems of interpretation of native events on
different architectures as mentioned before.
37
4 Conceptual Design for the Implementation
Requirement 5: Definition of Preset Events
A main advantage of PAPI are common names for counter events. The native
events available need to be mapped to the predefined PAPI Presets. The mapping
should be as complete as possible.
Requirement 6: Data Structure for Preset Definition
In order to register presets in the upper layers of PAPI the PAPI substrate needs
to pass a data structure of presets to the upper layers.
Derived Events are used for a even more high-level adaption of native events on
different processor architectures. Derived events offer the functionality of combining
several native events to a PAPI Preset which uses multiple underlying native events
connected by an arithmetic operation. As on different architectures the granularity
of exposed native events might be different and a single native event might not be
capable of providing sufficient information for a given PAPI Preset, derived events
solve this problem.
In case of the Niagara 2 an example for the use of a PAPI Preset in conjunction with
a derived event could be PAPI_LST_INS, which counts the total sum of load and store
instructions. This preset can not be satisfied by a native event exposed by libcpc
2 on Niagara 2 as libcpc 2 only exports the events Instr_ld for load instructions
and Instr_st for store instructions. Given the capabilities of derived events in PAPI
both events could be counted and automatically be accumulated in order to present
a single value to a developer or a tool.
Requirement 7: Extend the PAPI Presets using Derived Events
More predefined PAPI Presets might be available on the Niagara 2 through the
use of derived events. These derived events should be added to the presets.
38
4.4 Requirements for Counter Access and Operational Modes
Requirement 8: Extend the Data Structure for Presets
Derived events consisting of multiple counters combined with an arithmetic operation need to be represented by data structure for PAPI Presets as both are
passed to the upper layers in the same way.
Given PAPI Presets and the related enhancement of derived events, PAPI offers a
convenient interface to performance counters on different platforms, but with the
downside that although the presets are named in a similar way, the results need
interpretation as each platform might define the semantics of counters in a different
way.
Several presets might not be available because of the architectural absence like L3
cache related performance counters on the Niagara 2 or the semantics of executed load
and store instructions where a platform might only count executed, whereas another
platform could define executed and additional implicit issued instructions as the count
of load and store instructions. Given the differences of TLP vs. ILP as explained
in section 2.1 in conjunction with additional prefetch optimizations implemented in
hardware and different semantics on the count of load and store instructions, the
results of a certain preset on two different platforms can be considerably different.
4.4 Requirements for Counter Access and Operational
Modes
As shown in table 4.1 both libraries have certain differences in the operating modes
available through their API. The coverage of API functions is in this case defining the
convenience for the development of a performance instrumentation in an application.
Basic Operations on performance counters are related to creating and deleting a
performance counting context, starting and stopping the counting of the context and
reading all counted events. Both PAPI and libcpc 2 support these basic operations
on their specific implementation of a context.
The implementation of a counting context in libcpc 2 is built up on three different data
structures. cpc_t is used for the library instance currently managed and therefore
the operations cpc_open (3CPC) and cpc_close (3CPC) denote the life cycle
of a libcpc 2 instance. For controlling the counting state and setting up events on
39
4 Conceptual Design for the Implementation
performance counters, libcpc 2 has the data structure cpc_set_t. When a cpc_set_t
is created the library manages automatically to allocate all necessary buffers and
resources for the setup of performance counters.
Using cpc_set_add_request (3CPC) native events can be activated on a counting
context. When calling the function cpc_bind_curlwp (3CPC) which places the
counter setup of cpc_set_add_request (3CPC) onto the PCR for the calling LWP,
the lower-layers of libcpc 2 allocate virtualized counters, which are used to store the
the PIC results. The virtualized counters are needed for e.g. context switching or
sampling.
The results of performance counter events are available through the cpc_buf_t type,
which is created using libcpc 2 and allocates all necessary memory needed for storing
the PIC values and reading them using the cpc_buf_get (3CPC) function. Furthermore libcpc 2 supports operations like setting preset values for performance counter
values, resetting counters to presets and binding counters to counting domains.
In PAPI each substrate defines an own data structure for the management of a counting context, as the differences between platforms are only managed in the substrate
and not inside internal PAPI layers or from external code. Furthermore each substrate
defines exclusive operations for the basic operations on counters within the interfaces
defined by PAPI.
Adding, deleting and removing events is a common task in PAPI, therefore the substrate needs to offer these operations to the higher layers of PAPI. In case of the
Niagara 2 adding and modifying event setups would be possible through the direct
manipulation of the bit mask set on the specific PCR, but libcpc 2 offers only support
for adding events. Therefore the substrate has to deal with these operations and
emulate them in software.
For the setup of PAPI events the numerical event codes of presets or native events need
to be passed to the API functions related to the counter setup. Using the supplied
tools papi_native_avail and papi_avail (output shown in Appendix on p. 97)
a transformation between PAPI internal constants and libcpc 2 exported symbolic
names is possible, but PAPI offers further functions for resolving event names. As
libcpc 2 is not able to do this translation, it needs to be mapped in the substrate.
Additionally the setup of the PCR needs to be symmetrically initialized by the flag
option for cpc_set_add_request() as the UltraSPARC enforces this and libcpc 2
does not handle different setups as stated by cpc_set_add_request (3CPC) :
”Some processors, such as UltraSPARC, do not allow the hardware counters to be programmed differently. In this case, all requests in the set must
40
4.4 Requirements for Counter Access and Operational Modes
have the same configuration, or an attempt to bind the set will return
EINVAL.”
Requirement 9: Definition of a Data Structure for a Counting Context
For a given PAPI substrate a data structure for managing a performance counting
context needs to be defined. The substrate defines the context for itself and it is
not used by PAPI or other substrates. The data structure should at least offer
access to cpc_set_t and cpc_buf_t of the current context.
Requirement 10: Support Basic Operations on Counters
Basic operations like starting, stopping, resetting, reading and adding native
events is essentially needed in order to provide a basic mapping between PAPI
and libcpc 2.
Requirement 11: Creation of a Function for Removing Events
Opposed to libcpc 2 in PAPI removing events from a counting context is possible
and therefore a corresponding functionality needs to be created.
Requirement 12: Changing Parameters of a Counting Context
PAPI relies on the ability to modify a counting context, which is not supported
by libcpc 2 and needs therefore to be emulated in software.
Requirement 13: Resolving Symbolic Names and Event Codes
For the access to native events through event codes and vice versa a mechanism
for resolving these constants is needed, which can not be established using libcpc
2 due to #1 (p. 36) and #2 (p. 36)
41
4 Conceptual Design for the Implementation
Requirement 14: Enforce symmetric Setup of PCR
As stated in cpc_set_add_request (3CPC) the setup of the PCR on UltraSPARC processors needs to be symmetric and calls with asymmetric setups will
fail. The substrate needs to enforce this behavior.
Multiplexing in case of PAPI means that more event sets with performance counter
events are set up as physical performance counters exists as explained in previous
sections. PAPI schedules and dispatches the event sets in a round-robin mode in
order to deliver at least an rough estimate of the performance-related events occurred
during execution of a program.
For the extrapolation of results during multiplexing, PAPI uses the elapsed clock cycle
count to extrapolate the results of a scheduled event set. As multiplexing can not
be realized directly on hardware as the count of available performance counters can
not be extended for this special feature, the handling of event multiplexing is entirely
software emulated.
libcpc 2 offers no functionality for multiplexing as it would be required by PAPI,
therefore the capabilities of libcpc 2 need to be extended in the PAPI substrate in
order to support multiplexing. Furthermore the accuracy of performance counters is
required to be as exact as possible as the scaling could manipulate results of performance counters in a malicious or conflicting way.
In the case of the Niagara 2 no native event for the total clock cycles elapsed does
exist. As libcpc 2 offers no support for additional events emulated in software, an
additional interface to the clock cycles needs to be implemented, which yields a clock
cycle count related to the active event set.
Requirement 15: Support of the PAPI Multiplexing Mode
PAPI offers multiplexing support which can be used to instrument more performance counter events than performance counters are available. This mode should
be supported in the substrate.
42
4.4 Requirements for Counter Access and Operational Modes
Requirement 16: Additional Native Event Clock Cycle Count
For the multiplexing support of PAPI and several regression tests of PAPI the
count of clock cycles is used as an native event, therefore the substrate should
support it.
Requirement 17: Extend the List of Native Events by Synthetic Events
As requirement #16 (p. 43) introduces a new counter, which is not available
through the dynamic native event list defined by requirement #1 (p. 36) , the
substrate needs support for an additional synthetic event source.
Due to the fact that the multiplexing mechanism relies on switching between events,
counting events in multiplexing mode might be not as accurate enough as needed
for the in-depth analysis of performance critical code regions. Possible causes for
inaccuracy might be lost events due to the time-slicing or errors while extrapolating
results. [PUG, p. 52 ff.]
Overflows during counting can be handled using PAPI and libcpc 2. libcpc 2 relies
on the mechanism implemented on the Niagara 2 for the overflow handling and it
can be activated using only a flag in the call of cpc_set_add_request (3CPC) . If
an overflow in the PIC occurs, the Niagara 2 sends a trap as explained in section 2.5
which is translated into a SIGEMT signal by the operating system. The SIGEMT can
be received in a common signal handler and needs to restart the current context.
PAPI offers support for either overflow handling in hardware related to register overflows or it can emulate software overflows by using periodic timer interrupts through
the mechanisms of SIGALRM, SIGPROF or SIGVTALRM on POSIX-compliant operating
systems. The concept of periodic timer signals is to detect if a counter has reached a
given threshold. If the threshold has been reached or exceeded, an emulated software
overflow is dispatched.
By design libcpc 2 supports up to 64-bit wide integer counts for performance counter
results as the data type used by the kernel, which cares for counter maintenance,
is defined as being a 64-bit virtualized counter. In cpc_buf_create (3CPC) the
counter maintenance done by the kernel is explained:
”The kernel maintains 64-bit virtual software counters to hold the counts
43
4 Conceptual Design for the Implementation
accumulated for each request in the set, thereby allowing applications to
count past the limits of the underlying physical counter, which can be significantly smaller than 64 bits. The kernel attempts to maintain the full
64-bit counter values even in the face of physical counter overflow on architectures and processors that can automatically detect overflow.”
When overflows using SIGEMT are enabled in the call of cpc_set_add_request
(3CPC) the behavior of the kernel changes as the counter maintenance for hardware overflows is delegated to the application. The behavior is enabled using the flag
CPC_OVF_NOTIFY_EMT in the function all off cpc_set_add_request (3CPC) :
”CPC_OVF_NOTIFY_EMT — Request a signal to be sent to the application
when the physical counter overflows. A SIGEMT signal is delivered if the
processor is capable of delivering an interrupt when the counter counts
past its maximum value. All requests in the set containing the counter
that overflowed are stopped until the set is rebound.”
Therefore the PAPI substrate for the Niagara 2 can only be capable of counting up
to 232 events in overflow mode until an overflow needs to be handled compared to up
to 264 events in ”non-overflow mode”, where overflows are automatically treated by
the lower-layers of libcpc 2 in the kernel of Solaris.
A protection mechanism is needed to ensure overflow based counting in PAPI only
to use thresholds up to a limit of 232 as otherwise the counting with libcpc 2 would
produce wrong results as overflows would occur earlier than the expected threshold.
Requirement 18: Support of the PAPI Hardware Overflow Handling
PAPI offers functionality for the overflow handling in its internal layers, but the
overflow accounting and notification of overflows takes place in the substrate,
therefore the substrate needs to map the libcpc 2-based overflow handling to
PAPI
Requirement 19: Support of the PAPI Software Overflow Handling
In addition to requirement #18 (p. 44) the substrate should support software
overflow handling
44
4.4 Requirements for Counter Access and Operational Modes
Requirement 20: Transformation of Overflow Event Counts
As PAPI and libcpc 2 use different value ranges (signed long long vs. unsigned
long long) for storing counter values, operating at the upper bound of libcpc 2
values due to overflow handling imposes the need of a value transformation to
the bounds supported by PAPI.
Requirement 21: Limit Overflow Thresholds to a Maximum of 232
If the overflow handling of libcpc 2 is enabled using the CPC_OVF_NOTIFY_EMT
flag, the threshold of overflows must not exceed 232 as the Niagara 2 PIC is only
32-bit wide.
Profiling is available through PAPI in order to correlate overflow events to the program code being executed. libcpc 2 offers no mechanism to directly support correlation of overflows to program code, therefore this feature needs to be entirely emulated
in the substrate using the overflow mechanism previously explained.
For the profiling mechanism of PAPI the contents of the program counter register (PC)
are used when an overflow occurs. Using the information of the PC it is possible to
create a correlation between a region of code and specific events. Further translations
of the PC to the source code of a given program are not made through PAPI, therefore
the profiling does only rely on the object code. A translation might be established
through additional tools.
As profiling in PAPI is built up on the overflow handling the dispatching of overflows
to the upper layers needs to be extended to submit the value of the PC. Furthermore
as the profiling of PAPI is based on the object code, PAPI needs information about
the text regions of the program being executed. These information can be gathered
during start up of PAPI together with other substrate dependent information.
Requirement 22: Support of the PAPI Profiling Mode
PAPI offers support for a profiling mechanism which correlates the PC content to
overflows and is therefore based on the overflow mechanism of requirement #18
(p. 44) .
45
4 Conceptual Design for the Implementation
Requirement 23: Provide Information about the Text Segment
The profiling mechanism described by #22 (p. 45) depends on the PC address
and therefore PAPI needs to allocate memory for the correlation based on the
size of the text segment of the running program
4.5 Support of Threads and Processes
As already discussed the main audience for performance measurements using PAPI
might be found in HPC environments, the technologies used in these environments
need to be fully supported. Common technologies like OpenMP (shared-memory
parallelization by using threads) or MPI (message passing with multiple processes)
or even a combination of both should be supported without breaking the mechanisms
of parallelized applications to be measured.
In case of OpenMP the libraries need to provide a thread-aware handling of performance counters and event sets to be monitored in order to ensure no conflicts in the
shared memory address space, which might corrupt results. For pure, single-threaded
MPI programs such caveats do not exist as they do not share any resources with other
processes in a way that might break operation while monitoring their performance
counters. OpenMP, or more general shared-memory parallelization, therefore needs
to be explicitly supported in order to support this kind of applications.
For the implementation of a new PAPI substrate on the Niagara 2 this topic needs
to be analyzed, as the main principles of the processor are built on parallelization in
front of the TLP paradigm as described in 2.1. For the later implementation described
in chapter 5 it is important to know where and how thread-awareness in PAPI is
handled, what the substrate needs to offer to the upper layers in order to support
multi-threading and how multi-threading can be applied to libcpc 2. Furthermore all
operations on libcpc 2 need to be either thread-safe or synchronization with mutual
exclusion is needed in order to offer a thread-safe implementation of the substrate.
The description of [PUG, p. 53 ff.] states that PAPI is thread-aware, by activating the thread handling using an API call to PAPI_thread_init() and furthermore each thread has to be registered in order to access PAPI by calling
PAPI_register_thread(), which allocates a thread-specific storage and and enables
the calling thread to access the library. As the initialization of thread handling in the
library needs to take place right after the library is initialized no actions like the creation of a context for performance counters can take place right before the threading
46
4.5 Support of Threads and Processes
mechanism are active.
An operation which might be considered to be run in parallel is the reading of counters.
At the point of reading counters the library has to be initialized, thread-aware mechanisms need to be activated and threads have to be registered and therefore the full set
of thread-aware mechanisms should be activated. The entry point for a calling application should be the API function PAPI_read() as defined in [PPR, p. 149]. The endpoint on behalf of the substrate implementation is the function _papi_hwd_read(),
which is described in the file $PSRC/src/any-null.c where the interface for a substrate is defined. Between these function calls the platform-independent layers exist
as explained in section 3.1.
For PAPI_read() at first the corresponding internal data structures of the event set
requested with the operation are looked up in a common data structure at the call of
_papi_hwi_lookup_EventSet() returning a pointer to a structure EventSetInfo_t,
which stores all event set related information. In the EventSetInfo_t structure a field
master exists, which points to thread-relevant information including the performance
counter context of type hwd_control_state_t2 . Using these information about the
event set a call to _papi_hwi_read() is made which directly calls the substrate
method _papi_hwd_read().
For the whole calls through the different API layers no locks are acquired, which
at least imposes the need for libcpc 2 to be thread-safe while reading performance
counters as otherwise conflicts might arise, which might corrupt the counter values.
Event sets should therefore not be shared by multiple threads, which leads to the
point of event set creation as each event set is referred by an id, which is created by
PAPI as described in [PPR, p. 40].
The initialization of an event set is done by a call to PAPI_create_eventset()
and delegates the actual creation to the platform-independent layer as
PAPI_read() does. The functions called in the platform-independent layer is
_papi_hwi_create_eventset(), which calls the function allocate_EventSet() in
order to allocate new memory for the requested event set. Afterwards calls to the
substrate through the function _papi_hwd_init_control_state()3 are made in order to initialize the new event set with all substrate-dependent information needed.
The event set is stored in the common data structure, which was also used in
_papi_hwi_lookup_EventSet(), but the access to the data structure is serialized
through explicit locks.
2
This data structure will be discussed in chapter 5 as in this data structure all relevant information
for performance counter access of the substrate will be included.
3
This function is discussed in section 5.3.
47
4 Conceptual Design for the Implementation
In this second case PAPI no locks or other serialization mechanisms are used while
accessing the substrate. Although the substrate can access the newly created event
set without any concurrency as the event set is in a memory range which is allocated
exclusively for the call to PAPI_create_set() and is therefore opaque to any other
thread. In each case PAPI does not ensure sequential access to the underlying substrate and therefore it must be ensured the behavior of libcpc 2 is thread-safe enough
to support these operations without breaking any functionality requested by PAPI.
According to the documentation in libcpc (3LIB) libcpc 2 has a multi-threadinglevel which is declared to be safe, which is further defined by attributes (5) in
Solaris:
”Safe is an attribute of code that can be called from a multithreaded application. The effect of calling into a Safe interface or a safe code segment
is that the results are valid even when called by multiple threads. Often
overlooked is the fact that the result of this Safe interface or safe code
segment can have global consequences that affect all threads. For example, the action of opening or closing a file from one thread is visible by
all the threads within a process. A multithreaded application has the responsibility for using these interfaces in a safe manner, which is different
from whether or not the interface is Safe. For example, a multithreaded
application that closes a file that is still in use by other threads within the
application is not using the close(2) interface safely.”
This definition makes clear, that the library is designed to allow access from multiple
threads, but resource allocation and deallocation needs to be ensured to be handled
in a way that does not conflict with another thread. As already explained in section
4.4 a complete context of libcpc 2 is built on top of different data structures where
the pointer cpc_t is used for accessing the core features of libcpc 2 and cpc_set_t
and cpc_buf_t are used to interact with the corresponding PIC.
For a mapping to PAPI this would mean to ensure the library is initialized through
a call of cpc_open and cpc_close exactly conforming to the life cycle of the PAPI
library, as the cpc_t pointer returned is used in libcpc 2 functions to create the
common context for function accesses. The calls to cpc_open and cpc_close should
be issued by the first thread, respectively the last thread existing. A context which
is used by a thread should in addition consist of an unique instance of cpc_set_t
and cpc_buf_t as these data structures are essential for a context and are linked to
the underlying PIC of the current strand by binding it. This minimum requirement
is described by #9 (p. 41) .
Given the uniqueness of cpc_set_t and cpc_buf_t and the declaration of libcpc 2 as
48
4.5 Support of Threads and Processes
being safe for multi-threading, concurrent calls of library functions of libcpc 2 should
not break regular operations as explained before. As cpc_set_t and cpc_buf_t would
be allocated by each thread on itself, cpc_t is the only shared resource by the threads
and as the cpc_t will not be directly used to setup native events or manipulated in
another way, the threads should not be in conflict with each other.
For the allocation and access to an event set no additional steps should therefore
be required. A critical point when accessing the PAPI library with multiple threads
could be binding one event set to the PICs of the strands by multiple threads. In the
API function PAPI_start(), which is used to start counting behalf of an event set,
the event set referred to is examined, whether it is currently in use or not. Therefore
an event set can only be started once which enforces threads to allocate an own event
set. The event sets consist of an unique context of cpc_set_t and cpc_buf_t and
are therefore conform to the use of multi-threading and the libcpc 2 implementation.
Given these facts the multi-threading mechanism of both libraries seem to fit requirements of each other. The PAPI implementation of event sets and their further
handling ensures that no sharing of event sets occurs and therefore the substrate needs
no further locking mechanisms to enforce serial access to libcpc 2. As no modifiable
shared resources exist which could lead to a conflict while accessing libcpc 2 even in
parallel applications no race conditions should occur.
49
4 Conceptual Design for the Implementation
50
5 Implementation and Verification
5.1 Overview of Implementation Details
For the development of the PAPI substrate for the Niagara 2 an incremental development approach was chosen, as this approach is focused on the development of a core
of functionality which is expanded in each step of development until the final goal is
reached. Furthermore this approach supports the development with a small amount
of information available of in-depth details in each step, which is an important fact
as no documented way for the development of a PAPI substrate exists.
For the incremental approach at first the build process was enhanced as explained in
section 5.2 in order to support a completely stubbed version of the API for a substrate
and the ability to use the common way of building PAPI for the later development
tasks like testing and debugging. The source for a stubbed version was based on the
$PSRC/src/any-null.c file and related files and additionally on the source code of
the PAPI substrate for UltraSPARC processors based on libcpc 1 supporting Solaris
8/9.
The next steps in the development involved the design of data structures needed for
access to libcpc 2 from PAPI on behalf of the substrate implementation as operations
on event sets and counters require access to their corresponding cpc_t, cpc_set_t
and cpc_buf_t pointers. After the data structures were available first accesses to
libcpc 2 were possible and access to the native events which was based on definitions
of additional data structures and conversions needed by PAPI could be established.
With the access to native events, support for basic operations could be implemented.
These steps are explained in section 5.3.
On top of the basic operations further tasks involved the implementation of advanced
features offered by PAPI and full support of the API for substrates described by
section 5.4.
The whole development process based on incremental enhancements starting at the
core up to advanced features was tested against the regression tests supplied by the
PAPI distribution. These test cases are available in the $PSRC/src/ctests folder
51
5 Implementation and Verification
for tests based on direct access to the PAPI API based on C programs and further
test cases available in the $PSRC/src/ctests folder based on Fortran programs for
the PAPI Fortran API mapping. A description of the environment used for the
implementation is available in the appendix on page 90.
5.2 Extension of the Build Process
The build process of PAPI is based on the GNU autoconf tool in order to provide a
flexible build environment and to adapt underlying platforms. GNU autoconf provides
mechanisms based on macros in order to gather information about available libraries,
system specific dependencies and chooses the right programs to use during build. The
result of the autoconf macros is a shell script commonly named configure, which is
used to generate suitable Makefiles. [MED09] [PUG]
In order to provide a seamless integration of the new PAPI substrate for the Niagara 2,
the configure.in script of PAPI was modified to support in addition to the substratedepending Makefiles for Solaris/libcpc 1 a new substrate using Solaris 10/libcpc 2 on
the Niagara 2.
The steps for the additional build target support are split into the following:
1. After the script has detected the underlying operating system, detect the CPUfamily based on the output of uname and support the CPU-families sun4u for
the old substrate and sun4v for the Niagara 2. Other CPU-families are not
supported and therefore an error is generated.
2. Check whether the correct libcpc version is installed on the system by running a small example C code which interprets the contents of the macro
CPC_VER_CURRENT like it is done when a call to cpc_open (3CPC) is made. The
test for the correct library of the old substrate was reused in case that no Niagara
2 was detected, which only checks the availability of the old cpc_take_sample
library call.
3. Given the architecture detection of PAPI using the -with-bitmode=NN switch
of the configure script, a choice is made which target architecture Makefile of
PAPI should be used. This part was enhanced by the choice options solarisniagara2, solaris-niagara2-32bit and solaris-niagara2-64bit in order to select
how the substrate should be compiled and linked.
Using the new configuration detection mechanism the Makefile generated by autoconf automatically detects the environment and generates a suitable Makefile which
52
5.3 Implementation of Basic Operations
includes the substrate-depending Makefile. The build process can be started using
make and afterwards make install to install the PAPI distribution on the local system.
For the substrate-depending Makefiles no grave changes needed to be made as it
contains largely compiler-specific settings which are compatible to Sun Studio 12.
For compiler optimizations of PAPI the flag -fast was set.
The result of the changes of the build process is that a build for the Niagara
2 can be done using the steps described by installation documentation found in
$PSRC/INSTALL.txt. The full set of commands for building PAPI in 32-bit mode
with the installation root at /usr/local on the Niagara 2 is as follows:
1. ./configure
2. make
3. make install
The build process extension enables PAPI to offer support for both the Niagara 2 on
Solaris 10 with libcpc 2 and UltraSPARC II and III-based systems running on Solaris
8/9. Therefore neither the platform-support of PAPI will be reduced, nor the build
process becomes more complex or is changed from the usual way.
5.3 Implementation of Basic Operations
This section will describe the most important parts of the development of the basic
mapping from PAPI to libcpc 2 in order to provide a substrate capable of setting up
event counters, starting, stopping and reading them providing a foundation for the
implementation of the advanced features. The start for these tasks was a substrate
based only on stubs with complete integration into the PAPI build mechanism.
Following the incremental approach together with stubs created in the substrate in
order to test the build process, the stubs were extended in order to simply trace
function calls of the substrate in conjunction with erroneous return codes. Using this
combination of stubbing and tracing the contact points of PAPI and the substrate
could be easily detected and incremental progress on the functionality of the substrate
could be made.
The first point of contact between PAPI and the substrate — from the viewpoint of
the substrate — could be identified as a call to the substrate API function
53
5 Implementation and Verification
_papi_hwd_init_substrate(), which is used to initialize the substrate, provide information about the hardware, native events and preset events. At this point already
contact between PAPI and libcpc 2 is needed for extracting details about the hardware
configuration.
Access in _papi_hwd_init_substrate() to libcpc 2 is handled through a call to
cpc_open() providing a complete initialization of the library and returning a pointer
to cpc_t, which is stored on the heap in order to provide access to the pointer without
any additional effort.
For the storage of native event information and the transfer to the upper layers of
PAPI, a data structure and an unique event identifier need to be defined as explained
in requirements #1 (p. 36) and #2 (p. 36) . As PAPI supports native and preset
events, a bit mask exists, which separates native event identifiers from preset event
identifiers. The prefix for native events defined by the bit mask PAPI_NATIVE_MASK
is 4000000016 . For preset events the mask PAPI_PRESET_MASK is defined with a value
of 8000000016 .
The enumeration of native events and the construction of the native event table is
done in the self-defined function __cpc_build_ntv_table() which uses libcpc 2 in
order to enumerate all native events. The events are returned as strings, which are
stored in an array. For the transfer to PAPI the events are indexed by their array
position and will be returned to PAPI by subsequent calls of the upper layers of
PAPI to the function _papi_hwd_ntv_enum_events(), which returns an exit state of
PAPI_OK until the upper bound of the available native events is reached. In addition
for the resolving of native event names the function _papi_hwd_ntv_code_to_name()
accesses the array of native events.
As libcpc 2 does not provide descriptions of native events, the function for mapping
event codes to descriptions, _papi_hwd_ntv_code_to_descr(), returns with a call to
_papi_hwd_ntv_code_to_name(). For the translation of event codes to bits, which
is not needed by libcpc 2, the function _papi_hwd_ntv_code_to_bits() returns the
event code passed in by the parameters. For suitable descriptions of the currently
monitored native event the function _papi_hwd_ntv_bits_to_info generates a string
representing the PIC in use. These functions fulfill requirement #13 (p. 41) .
Given this set of implemented API functions PAPI is able to recognize native events.
The next step for the initialization of the substrate is to prepare preset and derived
events described by the requirements #5 (p. 38) , #6 (p. 38) , #7 (p. 38) and #8
(p. 39) . As these events are defined by the substrate a suitable data structure based
on a table to store these information was required and needs to be prepared in the
substrate. The table for presets and derived events is based on __t2_pst_table_t
54
5.3 Implementation of Basic Operations
and consists of the following fields:
typedef struct __t2_pst_table
{
unsigned int papi_pst;
char
*ntv_event[MAX_COUNTERS];
int
ntv_ctrs;
int
ntv_opcode;
} __t2_pst_table_t;
The description of the fields is as follows:
• papi_pst: PAPI preset to be defined, all presets are defined by PAPI in the file
$PSRC/src/papiStdEventDefs.h
• ntv_event: An array which holds the native events as strings to be used in this
preset for each PIC available
• ntv_ctrs: Number of native events used in order to ensure correctness and to
decide whether the event is derived or not
• ntv_opcode: The operation used to be applied to the native event counts for
derived events
The data sets of the table are declared in an array and processed by the self-defined
function __cpc_build_pst_table(), which allocates all needed resources, iterates
over all rows in the table in order to check it for correctness and to generate suitable
data sets for PAPI, which need to be of the type hwi_search_t. The available
presets are finally registered in the upper layers of PAPI by a call of the function
_papi_hwi_setup_all_presets(). The presets defined in the substrate can be seen
in table 5.1, the descriptions for presets can be found in the appendix on p. 99.
The next step was to define a suitable data structure for the setup of event counters and access to all further tasks like starting or reading the counter results. The
definition of the data structure is based on the hwd_control_state_t type, which is
required by PAPI. For the mapping to libcpc 2 the following data type is needed as
defined by #9 (p. 41) :
typedef struct hwd_control_state
{
cpc_set_t
*set;
cpc_buf_t
*counter_buffer;
int
idx[MAX_COUNTERS];
hwd_register_t code[MAX_COUNTERS];
int
count;
55
5 Implementation and Verification
Preset
Native Event #1
Native Event #2 Operation
Presets based on [OSM09]
PAPI_L1_DCM
DC_miss
—
—
PAPI_L1_ICM
IC_miss
—
—
PAPI_L2_ICM
L2_imiss
—
—
PAPI_TLB_DM
DTLB_miss
—
—
PAPI_TLB_IM
ITLB_miss
—
—
PAPI_TLB_TL
TLB_miss
—
—
PAPI_L2_LDM
L2_dmiss_ld
—
—
PAPI_BR_TKN
Br_taken
—
—
PAPI_TOT_INS
Instr_cnt
—
—
PAPI_LD_INS
Instr_ld
—
—
PAPI_SR_INS
Instr_st
—
—
PAPI_BR_INS
Br_completed
—
—
PAPI_BR_MSP
Br_taken
—
—
Additional Presets
PAPI_FP_INS Instr_FGU_arithmetic
—
—
PAPI_RES_STL
Idle_strands
—
—
PAPI_SYC_INS
Atomics
—
—
PAPI_L2_ICR
CPU_ifetch_to_PCX
—
—
PAPI_L1_TCR
CPU_ld_to_PCX
—
—
PAPI_L2_TCW
CPU_st_to_PCX
—
—
Presets based on derived events
PAPI_L1_TCM
IC_miss
DC_miss
+
PAPI_BR_CN
Br_completed
Br_taken
+
PAPI_BR_PRC
Br_completed
Br_taken
PAPI_LST_INS
Instr_st
Instr_ld
+
Presets based on synthetic events (section 5.4)
PAPI_TOT_CYC _syn_cycles_elapsed
—
—
Table 5.1: Preset and Derived Events for Niagara 2
56
5.3 Implementation of Basic Operations
uint64_t
result[MAX_COUNTERS];
uint64_t
preset[MAX_COUNTERS];
} hwd_control_state_t;
The meaning of the fields is as follows:
• set: The libcpc 2 counter setup and context
• counter_buffer: The buffer used by libcpc 2 to retrieve event counts
• idx: The indexes of events in the buffer
• code: The native event codes used in this context
• count: The number of native events in this context
• result: Temporary storage of the counter result
• preset: The value from which counting events begins
The data structure is initialized in the function _papi_hwd_init_control_state()
where all fields are ensured to be in a clean state. Further initialization is not
needed at this point, as the real setup of counters is handled in the function
_papi_hwd_update_control_state(), which is called by the upper layers of PAPI
with the requested event counters to be set in the context. Besides adding events to a
context this function is also responsible for removing events in a context and releasing
it.
Due to the different tasks which need to be handled by this functions defined in
requirement #12 (p. 41) and as removing events defined in requirement #11 (p.
41) from a cpc_set_t is not possible, the whole context is released on a call of
_papi_hwd_update_control_state() and a new context is being built using a loop
in order to support different numbers of events in a context with the assignment of
a counter position based on the currently processed event as requirement #3 (p.
37) defines. The call to cpc_set_add_request(), which is used to setup an event in
libcpc 2, is done in each iteration of the loop which provides a symmetric setup of the
event set requested by PAPI as requirement #14 (p. 42) defines and a corresponding
context is built internally in libcpc 2 as the loop operates in a pass-through manner.
At this point the substrate maintains all basic functionality for the setup of event sets
and the next steps involved the starting and stopping of events, reading and resetting
results and the shutdown of the library.
For starting and stopping the context in _papi_hwd_start() and _papi_hwd_stop()
only the corresponding functions of libcpc 2 need to be called as the setup in the
manner of libcpc 2 is finished and no further actions or allocations need to be
57
5 Implementation and Verification
done. The starting of a counter in this state of the substrate is only supported
using the cpc_bind_curlwp() call used for counting events in the currently executed LWP. In order to support the PAPI multi-threading operations, the flag
CPC_BIND_LWP_INHERIT is set, when the call is executed. Additionally it would
be possible to extend the substrate by adding support for the cpc_bind_pctx(),
for counting events in another process using libpctx (3LIB) , and for the
cpc_bind_cpu() calls, for counting events on a certain strand, which require higher
privileges.
The reading of counter values is done in the function _papi_hwd_read() which does
not touch the values retrieved by the call of cpc_set_sample() in order to guarantee
unchanged counter results, with the exception of a cast to signed long long. Internally
the virtualized counters of libcpc 2 operate with the data type uint64 t, which is an
unsinged long long value, but PAPI uses long long defined in $PSRC/src/papi.h,
which needs to be casted in order to suppress errors. Although the data type used
by libcpc 2 has a bigger value range than the data type of PAPI a conversion is not
needed as the types are compatible.
For the resetting of counters only a call to the function cpc_set_restart() is needed,
which sets the preset defined by the cpc_set_add_request() call and the context
remains active. The preset is initialized by _papi_hwd_init_control_state() to a
default value of 0, which is important for _papi_hwd_read() as no shifting of values
based on an offset is needed and the results can always be passed back to the upper
layers of PAPI without any modification.
The current state of the substrate enables PAPI to be used for basic operations as
described in section 4.4 and solves #10 (p. 41) . All steps could be backed up by the
regression tests supplied with PAPI, e.g. all_native_events and all_events for
the correctness of the implementation of native events and preset events or the test
case low-level for setting up counters and reading them in different ways in order
to check for the correctness of the context semantics. The test cases are available in
$PSRC/src/ctests.
5.4 Implementation of Advanced Operations
The implementation of advanced operations is split into the implementation of multiplexing and the implementation of overflow handling together with profiling support
as both feature blocks are completely independent. The foundations for the implementation of these advanced feature are explained in the previous section and require
therefore correctness of the implementation of basic events in order to work as ex-
58
5.4 Implementation of Advanced Operations
pected.
For the next steps in development at first the multiplexing was chosen to be implemented without any further reason. The multiplexing API of PAPI consists of
a subsystem in the source file $PSRC/src/multiplex.c which has special counter
allocation functions that exploit the features found in the base subsystem of PAPI.
The reason for a special allocation scheme is due to the fact that the multiplexing mechanism of PAPI uses the clock cycle count in order to extrapolate an event
count which could have been reached if the event was measured using the basic operations. Therefore the preset PAPI_TOT_CYC is added to each event set created in
multiplexing mode. The insertion of events to a multiplexing event set is handled in
mpx_insert_events() of $PSRC/src/multiplex.c.
The fact that PAPI_TOT_CYC is not available on the Niagara 2 as shown in section
4.2 therefore introduced requirement #16 (p. 43) and must be solved before any
work on the multiplexing support could be started. In order to extend the substrate
for support of a synthetic event like the clock cycles elapsed compared to real native
events exposed by libcpc 2, the list of native events needed to be extended. This
step was essentially as PAPI can only count events on behalf of native events. The
mechanism to extend the list of synthetic events is based on two data structures, one
in order to store native events for extending the native event table and another data
structure to enumerate the native events as shown below:
enum
{
SYNTHETIC_CYCLES_ELAPSED = 1,
SYNTHETIC_RETURN_ONE,
SYNTHETIC_RETURN_TWO,
} __int_synthetic_enum;
typedef struct __int_synthetic_table
{
int code;
char *name;
} __int_syn_table_t;
The meaning of the fields is as follows:
• code: Synthetic event code for this event
• name: Name of the synthetic event
The mechanism to extend the list of native events, which was already available for
59
5 Implementation and Verification
native events from libcpc 2, the function __cpc_build_ntv_table() was extended
to build a list of synthetic events after the events from libcpc 2 have been added to
the list of native events. In order to propagate the new events to the upper layers
of PAPI the functions for enumerating and converting native events as described in
section 5.3 were extended to handle requests to synthetic events.
As synthetic events are not known to libcpc 2 it was needed to ensure these events are
never going to be requested by the function _papi_hwd_update_control_state() as
this would cause an error condition, which would break the allocation of native events.
Therefore the function was extended to recognize synthetic events and to skip the call
to cpc_set_add_request(), while other events in the same event set, which are real
native events, are still passed to libcpc 2 and allocated on hardware. In order to
detect synthetic events in an event set without much effort a count for synthetic
events was added to to the hwd_control_state_t data structure mentioned in the
previous section.
In addition to the case when native events share an event set with synthetic events, the
case that no native event is selected for the event set is possible. As the relationship
between synthetic events and native events used with libcpc 2 should be remained, the
function _papi_hwd_start() was extended to add a real native event to a cpc_set_t
in case of an event set consisting only of synthetic events, as otherwise the effort to
provide a seamless integration of native and synthetic events would have further
increased. For operations like stopping, setting various options and allocation it
would be necessary to change the handling. Without adding the native event to the
cpc_set_t the whole context would not have been able to be started.
In order to read the values and to reset the counters of synthetic events the functions _papi_hwd_read() and _papi_hwd_reset() needed to be extended to support
synthetic events. For _papi_hwd_read() it was needed to ensure to access another
function to get the results of synthetic events and furthermore to skip the native
event found on a cpc_set_t in case of a context which is only based on synthetic
events. As _papi_hwd_reset() for the default implementation only relies on the
cpc_set_restart() call, a detection of synthetic events was needed. In addition a a
hangover counter is necessary to keep track of resets and to normalize the further results retrieved. For hwd_control_state_t this meant another modification in order
to support the reset mechanism.
To provide a relatively accurate data source for the count of synthetic events, the
cpc_buf_tick (3CPC) function is used, which provides the count of cycles the current set has been bound to hardware. Another approach could have been using
the utility function _papi_hwd_get_virt_cycles(), which was already implemented,
but additional calculations would have been needed and further accuracy would have
60
5.4 Implementation of Advanced Operations
been lost. Therefore the call to cpc_buf_tick() was preferred.
Finally the preset PAPI_TOT_CYC could be defined with a reference to the synthetic
event. As synthetic events might break operations on the substrate and should not
be considered as reliable, all source code blocks referring to synthetic events can be
disabled by undefining the macro SYNTHETIC_EVENTS_SUPPORTED in the substrate
source code. All other operations are untouched as the handling of synthetic events
is implemented with the background of an additional functionality and therefore not
mandatory.
The resulting counter context in hwd_control_state_t is as follows with the additional fields described:
typedef struct hwd_control_state
{
cpc_set_t
*set;
cpc_buf_t
*counter_buffer;
int
idx[MAX_COUNTERS];
hwd_register_t code[MAX_COUNTERS];
int
count;
uint64_t
result[MAX_COUNTERS];
uint64_t
preset[MAX_COUNTERS];
#ifdef SYNTHETIC_EVENTS_SUPPORTED
int
syn_count;
uint64_t
syn_hangover[MAX_COUNTERS];
#endif
} hwd_control_state_t;
With support of the preset PAPI_TOT_CYC the implementation of the multiplexing
mechanism in the substrate needed to define timer options, as the multiplexing mechanism is based on time-slicing based on operating system mechanisms for signal dispatching. These settings could be adapted from the PAPI substrate for libcpc 1 and
be integrated into the new PAPI substrate based on libcpc 2.
The time-slice based scheduling in the multiplexing mechanism is based on the
basic operations available in the substrate, which consist mainly of the functions
_papi_hwd_start() and _papi_hwd_stop(). The multiplexing mechanism introduced no additional requirements to these operations and might therefore considered
as fully compliant to the implementation of these functions. Multiplexing does furthermore not break the operations of libcpc 2, which offers no multiplexing mechanism
as shown in table 4.1. With the implementation of multiplexing the requirements #15
(p. 42) , #16 (p. 43) and #17 (p. 43) are resolved.
61
5 Implementation and Verification
The overflow handling of PAPI is available in two different ways, as it can either be
emulated by software mechanisms using periodic signal interrupts or using feedback of
the underlying hardware counters. As already explained in 4.4 the PICs of the Niagara
2 are capable of handling overflows and furthermore libcpc 2 offers the needed options
to enable the overflow handling based on the signal SIGEMT. The implementation of
software and hardware overflows solves the requirements #18 (p. 44) and #19 (p.
44) .
For both implementations of overflow handling the substrate needs to define a signal handler in the function _papi_hwd_dispatch_timer() and for hardware overflow handling the function _papi_hwd_set_overflow() is needed in order to activate the overflow functions in the substrate. This is case of libcpc 2 important,
as this function is used to manipulate the set in order to set the overflow flag
CPC_ENABLE_NOTIFY_EMT, which needs to be set on each counter request, respectively
for each native event bound to this context.
The manipulation of the set is split in two steps, where _papi_hwd_set_overflow()
adds the CPC_ENABLE_NOTIFY_EMT flags to the counters in the current context and the actual new setup for the libcpc 2 cpc_set_t is
passed to the function __cpc_recreate_set(), which does instead of
_papi_hwd_update_control_state() not manipulate the context, but uses
the information available in the hwd_control_state_t data structure and performs
a new setup. The setup routine for hardware overflows is therefore built on top of
the basic operations.
In addition to the setup of the CPC_ENABLE_NOTIFY_EMT a call to
_papi_hwd_set_overflow() is used to set a threshold for the counted events
until an overflow should happen. For libcpc 2 this threshold has to be defined
during the call of cpc_set_add_request() as the preset parameter or it can be
set using the cpc_request_preset() and a reset has to be issued. For the whole
cpc_set_t the preset is passed into the request when the new context is created. As
the threshold is defined as signed integer no additional steps are required to fulfill
requirement #21 (p. 45) .
Important for the handling of CPC_ENABLE_NOTIFY_EMT is that a SIGEMT blocks the
whole cpc_set_t and the only way to unlock is a reset of the context. The reset
operation sets the preset value as starting value for the next turn of counting. Asymmetric resets of certain counters are not available and a SIGEMT is raised if any of the
PICs overflowed, a special handling in the signal handler is required to pass correct
values and overflow events back to the upper layers of PAPI.
The actual value of the preset for a given threshold is calculated as UINT64_MAX -
62
5.4 Implementation of Advanced Operations
threshold, which ensures that both, the virtualized counter and the PIC, which has a
width of 32 bits, will overflow at the same time and no faulty state should be reached.
In case of a threshold value of 0, the function disables overflow handling, therefore
the set needs to be assembled again without the CPC_ENABLE_NOTIFY_EMT and the
preset is set to the default value for a context. In order to support these operations
the hwd_control_state_t structure has been enhanced in order to support special
flags for libcpc 2 capabilities.
In both cases the signal handler needs to be managed. For a threshold greater
than 0 the signal handler _papi_hwd_dispatch_timer() is installed using the
_papi_hwi_start_signal() call, in case of disabling the signal handler and resuming
normal operations a call to _papi_hwi_stop_signal() is issued. The signal starting
and stopping routines are part of utility functions supplied with PAPI in the source
file $PSRC/src/extras.c.
If the signal handler is called at first the context, which is currently active is retrieved
using functions from the portable-layer of PAPI. If the set belongs to the current
thread, it is at first read, which is needed in order to detect the counter, which has
overflowed, as the raised SIGEMT can not be examined which counter has overflowed
due to the fact that this feature is not supported on UltraSPARC hardware as described in cpc_set_add_request (3CPC) . Furthermore PAPI requires an overflow
vector, which is an integer variable, whose bit positions set to 1 indicate an overflow
on a specific hardware counter in an event set. This mechanism enables PAPI to
detect which event caused the overflow.
For an event, which did not cause an overflow the last event count needs to be stored
as the set can only be activated again after an reset as explained before. Therefore the
hwd_control_state_t has been extended in order to support overflows and to store
the original threshold requested by the PAPI call to _papi_hwd_set_overflow()
and to store the actual event count — in case of an overflow, which is handled
by libcpc 2 precisely exactly one time the threshold value — in as a hangover
value. The set is afterwards restarted and the further control of the overflow is
delegated to PAPI through a call of _papi_hwi_dispatch_overflow_signal(). In
order to provide event counter results of the overflow to PAPI, the substrate function
_papi_hwd_read() has been extended to use the new variables, which hold the actual
results and not to use the values from libcpc 2, as these start with their presets.
As the event counter of a PIC, which did not overflow, is carried forward, the overflow
mechanism supports overflows of only one counter in a context, which would otherwise
not be supported on UltraSPARC chips. In addition _papi_hwd_read() has been
extended to shift the actual counter values, which operate at the upper bound of
UINT64_T back to a base of 0 as PAPI otherwise would read negative results due to
63
5 Implementation and Verification
the different data types used and therefore solving #20 (p. 45) .
The resulting hwd_control_state_t data structure with support of overflows is as
follows:
typedef struct hwd_control_state
{
cpc_set_t
*set;
cpc_buf_t
*counter_buffer;
int
idx[MAX_COUNTERS];
hwd_register_t code[MAX_COUNTERS];
int
count;
uint64_t
result[MAX_COUNTERS];
uint_t
flags[MAX_COUNTERS];
uint64_t
preset[MAX_COUNTERS];
long_long
threshold[MAX_COUNTERS];
long_long
hangover[MAX_COUNTERS];
#ifdef SYNTHETIC_EVENTS_SUPPORTED
int
syn_count;
uint64_t
syn_hangover[MAX_COUNTERS];
#endif
} hwd_control_state_t;
For the implementation of software overflows all extensions of the mechanism for
hardware overflow handling could be reused, as the implementation of software overflow takes mainly place in the upper layers of PAPI. In case of an software overflow
the overflow handler pushes the values read from hardware back to the preset and
restarts the set in order to maintain the correct count of events, which will be read
by PAPI.
For dispatching the overflow no overflow vector is generated, as no threshold for an
overflow is known, therefore the overflow vector is unset, but later generated by PAPI
through delegating the overflow to _papi_hwi_dispatch_overflow_signal(). As
software overflows are intended to be used when no hardware overflows on a given
platform are available the significance of this functionality might be rather minor in
comparison of hardware overflows.
For the profiling of object code PAPI correlates overflows to their text segment addresses in binary form using the PC. The profiling functions therefore rely on the
overflow handling functionality as defined by requirement #22 (p. 45) . In order to
correlate overflows to the object code, PAPI needs information about the structure
of the underlying binaries and libraries used on the current platform for the PAPI
installation.
64
5.5 Verification of the Implementation
The information about binaries and libraries are supplied by the substrate to the upper layers of PAPI. In the substrate the function _papi_hwd_update_shlib_info()
has been implemented, which uses the prmap_t data structure in order to analyze the /proc/self/map file described in proc (4) . The file offers information about the memory segments a process uses. The information is gathered automatically at the start-up of the substrate through a call to the function
_papi_hwd_init_substrate(), which solves requirement #23 (p. 46) . For PAPI
this information is important, as it needs to allocate buffers to store overflows at their
corresponding addresses and therefore the amount of buffers needed, depends on the
size of the text segment of the whole process.
For the substrate no other special tasks are required in order to support the overflow mode of PAPI. In case of an overflow PAPI automatically tests if the profiling mode is activated and if it is active, it delegated profiling to the upper layers of PAPI. The decision to dispatch an profiling event is made in the function
_papi_hwi_dispatch_profile(), which is called by the the signal handler used for
overflow handling.
Concluding with the profiling operation all advanced features of PAPI were successfully implemented with feedback of the regression tests. As a critical point the multiplexing mode might be seen as it relies on a synthetic event, which does not guarantee
to be accurate, but in future versions of libcpc 2 or in further revisions of the Niagara 2 a native cycle count event might be available and therefore the support of
multiplexing for the Niagara 2 substrate is already given.
5.5 Verification of the Implementation
The verification of the PAPI substrate implementation is an important part as exact
results should be guaranteed in order to supply reliable information about performance counters to users of PAPI and tools using PAPI as their foundation. As
already shown in section 4.2 the underlying libcpc 2 provides accurate results and
as described in 5.3 the substrate does not touch counter results in order to provide
results as accurate as possible. This section will proof the defined requirement #4
(p. 37) .
In addition to a single-threaded variant of a test suite for the measurement of PAPI
and libcpc 2, a multi-threaded variant should be expected to be accurate as in section
4.5 both libraries were considered to be thread-safe and thread-aware and therefore
the substrate is expected to be accurate even in multi-threaded environments. Multithreaded environments should furthermore considered as the typical environment for
65
5 Implementation and Verification
the Niagara 2 substrate. The support of multi-threaded environments is therefore
essential for the substrate implementation.
The test plan for the verification is defined as following:
1. Measure the accuracy of a calculation in libcpc 2 and PAPI with a singlethreaded program, compare both results as libcpc 2 is expected to be exact
2. If the results match the expected values, perform another measurement using a
multi-threaded variant and different amounts of threads
3. If both measurements reveal the same results, perform a reference measurement
with Sun Studio as described by chapter 1 for multi-threaded variant
The test cases consist of the following ideas and principles:
1. Single-threaded calculation of double-words in an external function, variant
single-threaded — This variant matches the behavior of programs parallelized
using pure MPI and not parallelized applications
2. Multi-threaded calculation of double-words using OpenMP and synchronization to ensure only one thread is actually performing floating-point operations,
variant serialized
3. Multi-threaded calculation of double-words using OpenMP without synchronization resulting in a data race of different threads trying to perform operations
in parallel on the same data set, variant data race
4. Multi-threaded calculation of double-words using OpenMP without synchronization, but with a correct multi-threading behavior, variant multi-threading
— This variant matches also the behavior of hybrid application designs using
OpenMP and MPI
For all variants, except the variant multi-threading, the program used for measuring
the accuracy of libcpc 2 is reused with minor modifications in order to simulate the
special behavior of the test case. For the test cases the total amount of floating-point
operations has been reduced as it has already been proven in section 4.2 that even a
higher count of events does return accurate results. The expected result for all test
cases is at 30.000 floating-point operations performed in the calculation.
In order to ensure a reliable result for OpenMP based calculations the compiler flag
-xopenmp=noopt has been set, which prevents any optimizations in the resulting
assembler code done by the compiler. Furthermore the multi-threaded variants are
measured in three different ways:
66
5.5 Verification of the Implementation
1. OMP_NUM_THREADS set to 4, SUNW_MP_PROCBIND set to 0 8 16 24, resulting
in four threads scheduled on different FGUs
2. OMP_NUM_THREADS set to 8, SUNW_MP_PROCBIND set to 0 8 16 24 32 40
48 56, resulting in eight threads scheduled on different FGUs
3. OMP_NUM_THREADS set to 16, SUNW_MP_PROCBIND set to 0 1 8 9 16 17 24
25 32 33 40 41 48 49 56 57, resulting in sixteen threads with two
threads for each FGU
4. OMP_NUM_THREADS set to 16, SUNW_MP_PROCBIND set to false, resulting in sixteen threads without binding threads to FGUs and therefore a non-deterministic
scheduling
Using these different setups it should be ensured that the results of the test cases are
not manipulated by context switching or concurrent access to the FGU pipeline of
each core.
In order to verify the results the test suite was run in 100 iterations with all explained
configurations. A full output of one complete test iteration consisting of all specified
configurations can be found in the appendix on p. 101 ff.
Test Case single-threaded showed no difference between the PAPI substrate and
libcpc 2 in case of Instr_FGU_arithmetic as expected. In both test cases a total of
30.000 floating-point operations was executed, which matches the expected behavior.
The second PIC available was used to measure the total count of operations using
the Instr_cnt event, which was constant for each execution of the test cases, but a
difference between libcpc 2 and PAPI is visible as expected due to the overhead of
the PAPI API, the portable-layer and the substrate itself.
Comparing the values of Instr_cnt the total count for libcpc 2 is 621.823 instructions
and for PAPI a total count of 623.154 instructions could be observed resulting in a
total overhead of 1.331 instructions added by PAPI.
At a glance this test case has been fulfilled as the result expected by theory could
be achieved. The single-threaded usage of the substrate should therefore proven to
result in valid counter results.
Example output of the test case:
verify-papi;0;Instr_FGU_arithmetic;30000;Instr_cnt;623154
verify-cpc;0;Instr_FGU_arithmetic;30000;Instr_cnt;621823
67
5 Implementation and Verification
Test Case serialized utilizes the libraries with multi-threaded accesses to API functions, but the calculation yielding floating-point operations is done with the enforcement of explicit access of the master thread in the OpenMP team, as the calculation
is not thread-safe. Therefore only the master thread is expected to show a result
of 30.000 floating-point operations and a total instruction count of higher than the
single-threaded variant as OpenMP adds further implicit overhead for the creation of
threads and its own API initialization.
As this thread case will be run with different parameters, which influence the multithreading behavior, it should be observable that the Instr_FGU_arithmetic count
matches the expected value and for each thread a certain amount of Instr_cnt
events should be observable. These events might be different across the threads due
to internal synchronisation and setup operations of OpenMP. The serialization of the
calculation is realized with OpenMP pragmas inside a parallel region as follows:
#pragma omp master
{
calculation ();
}
Furthermore the test case should show that in cases of loosely bound threads the
result is still exactly the same.
Example output of the test case for eight threads with processor binding:
verify-papi-omp;10932/0;Instr_FGU_arithmetic;30000;Instr_cnt;637377
verify-papi-omp;10932/3;Instr_FGU_arithmetic;0;Instr_cnt;9748
verify-papi-omp;10932/1;Instr_FGU_arithmetic;0;Instr_cnt;3188
verify-papi-omp;10932/7;Instr_FGU_arithmetic;0;Instr_cnt;4499
verify-papi-omp;10932/4;Instr_FGU_arithmetic;0;Instr_cnt;2451
verify-papi-omp;10932/5;Instr_FGU_arithmetic;0;Instr_cnt;3778
verify-papi-omp;10932/6;Instr_FGU_arithmetic;0;Instr_cnt;3879
verify-papi-omp;10932/2;Instr_FGU_arithmetic;0;Instr_cnt;2833
verify-cpc-omp;10933/4;Instr_FGU_arithmetic;0;Instr_cnt;1860
verify-cpc-omp;10933/0;Instr_FGU_arithmetic;30000;Instr_cnt;634249
verify-cpc-omp;10933/3;Instr_FGU_arithmetic;0;Instr_cnt;4178
verify-cpc-omp;10933/5;Instr_FGU_arithmetic;0;Instr_cnt;2748
verify-cpc-omp;10933/7;Instr_FGU_arithmetic;0;Instr_cnt;2532
verify-cpc-omp;10933/2;Instr_FGU_arithmetic;0;Instr_cnt;4336
verify-cpc-omp;10933/1;Instr_FGU_arithmetic;0;Instr_cnt;1380
verify-cpc-omp;10933/6;Instr_FGU_arithmetic;0;Instr_cnt;1229
Given the example output it can be seen that the results of this test case are as
expected by theory with a variable amount of instructions related to internal op-
68
5.5 Verification of the Implementation
erations of OpenMP. All threads except the master thread show a total count of
Instr_FGU_arithmetic of 0 as expected. This test case verifies the usability of the
substrate in multi-threaded environments and ensures a valid mapping of event sets
to their corresponding threads.
The results of loosely bound threads and explicitly overcommited FGUs with two
threads showed valid results either. Therefore this test case is proven to be fulfilled
as the results match the values expected by theory with a variable amount of total
instructions executed as expected by OpenMP internal routines for synchronization
and setup.
Test Case data race is intended to show how the event Instr_FGU_arithmetic
is implemented in hardware.
As the function intended for generating Instr_FGU_arithmetic events is not protected by a synchronization method and as
this function is not implemented in a thread-safe way a data race between all threads
should occur with the result of instructions with the same data address and the same
operations with the same result executed for each thread.
As the function calculation() is not thread-safe and no synchronization for mutual
exclusion is realized, this test case represents a programming error with unpredictable
results.
Example output of the test case for eight threads with processor binding:
verify-papi-omp-datarace;10936/0;Instr_FGU_arithmetic;30000;Instr_cnt;626422
verify-papi-omp-datarace;10936/2;Instr_FGU_arithmetic;29901;Instr_cnt;621908
verify-papi-omp-datarace;10936/1;Instr_FGU_arithmetic;29935;Instr_cnt;621147
verify-papi-omp-datarace;10936/3;Instr_FGU_arithmetic;29950;Instr_cnt;621094
verify-papi-omp-datarace;10936/7;Instr_FGU_arithmetic;29907;Instr_cnt;621035
verify-papi-omp-datarace;10936/4;Instr_FGU_arithmetic;29909;Instr_cnt;621251
verify-papi-omp-datarace;10936/6;Instr_FGU_arithmetic;29911;Instr_cnt;621023
verify-papi-omp-datarace;10936/5;Instr_FGU_arithmetic;29882;Instr_cnt;621046
verify-cpc-omp-datarace;10937/0;Instr_FGU_arithmetic;30000;Instr_cnt;623924
verify-cpc-omp-datarace;10937/2;Instr_FGU_arithmetic;29888;Instr_cnt;620974
verify-cpc-omp-datarace;10937/4;Instr_FGU_arithmetic;29883;Instr_cnt;620977
verify-cpc-omp-datarace;10937/7;Instr_FGU_arithmetic;29884;Instr_cnt;621230
verify-cpc-omp-datarace;10937/1;Instr_FGU_arithmetic;29852;Instr_cnt;620978
verify-cpc-omp-datarace;10937/6;Instr_FGU_arithmetic;29833;Instr_cnt;620943
verify-cpc-omp-datarace;10937/3;Instr_FGU_arithmetic;29834;Instr_cnt;620968
verify-cpc-omp-datarace;10937/5;Instr_FGU_arithmetic;29828;Instr_cnt;621245
The results of this test case are not as expected 30.000 floating-point operations for
69
5 Implementation and Verification
each thread. Although a data race occurs, the count of floating-point operations
should not change as the threads process the instructions independently. As the
threads were bound to different FGUs, optimization seemed not to take place at the
FGU level, but perhaps at a stage of the memory hierarchy, which has shared units
across all cores as described in section 2.3.
For the native event Instr_FGU_arithmetic no special remarks exist, which point
out the exact issue encountered in this test case. The counter description in [Sun07c,
p. 87] only lists the counted instructions. In [Sun08e, p. 391 ff.] it is indicated that
traps might prevent operations to finish, but a relation to the PIC is not given. In
order to verify the behavior of a parallelized application therefore another example
was chosen.
Test Case multi-threading uses an inline calculation on a one dimensional array
allocated on the stack of the current thread. Although the access pattern is different
compared to the other test cases, the result should be the same as the test case was
designed to yield a total count of 30.000 floating-point operations for each thread.
As the array for calculation floating-point operations was allocated directly on the
stack of each thread, no synchronization was needed. The calculation measured consists of the following loop, which iterates over the complete array with a total size of
5.000 elements:
for (i = 0; i < X; i++)
{
values[i] =
(((values[i] + (1 * 3.14) * values[(i + 100) % X]) / 5.678) +
6.789) * values[(i + 1000) % X];
}
The resulting assembler code yields a total of six floating-point operations as shown
below:
! File verify-plain-omp-correct.c:
[...]
!
21
values[i] =
!
22
(((values[i] + (1 * 3.14) * values[(i + 100) % X]) / 5.678) +
!
23
6.789) * values[(i + 1000) % X];
[...]
ldd
[%o2+0],%f8
ldd
[%l0+0],%f6
ldd
[%l3+0],%f4
70
5.5 Verification of the Implementation
fmuld
%f6,%f4,%f6
ldd
fmuld
faddd
ldd
fdivd
ldd
faddd
[%o1+%o0],%f4
%f6,%f4,%f4
%f8,%f4,%f6
[%o5+0],%f4
%f6,%f4,%f6
[%o4+0],%f4
%f6,%f4,%f6
ldd
fmuld
std
[%o1+%o0],%f4
%f6,%f4,%f4
%f4,[%o2+0]
[...]
[...]
[...]
The assembler code shows that in total three multiplications, one division and two
additions on double-words are executed. Therefore the assembler code ensures the
test case should yield a result of 30.000 floating-point operations for each thread. The
code was parallelized using a parallel region.
Example output of the test case for eight thread with processor binding:
verify-papi-omp-correct;10961/0;Instr_FGU_arithmetic;30000;Instr_cnt;480722
verify-papi-omp-correct;10961/1;Instr_FGU_arithmetic;30000;Instr_cnt;475364
verify-papi-omp-correct;10961/2;Instr_FGU_arithmetic;30000;Instr_cnt;475364
verify-papi-omp-correct;10961/6;Instr_FGU_arithmetic;30000;Instr_cnt;475364
verify-papi-omp-correct;10961/7;Instr_FGU_arithmetic;30000;Instr_cnt;475607
verify-papi-omp-correct;10961/5;Instr_FGU_arithmetic;30000;Instr_cnt;475535
verify-papi-omp-correct;10961/4;Instr_FGU_arithmetic;30000;Instr_cnt;475619
verify-papi-omp-correct;10961/3;Instr_FGU_arithmetic;30000;Instr_cnt;475581
verify-cpc-omp-correct;10962/0;Instr_FGU_arithmetic;30000;Instr_cnt;478176
verify-cpc-omp-correct;10962/1;Instr_FGU_arithmetic;30000;Instr_cnt;475283
verify-cpc-omp-correct;10962/4;Instr_FGU_arithmetic;30000;Instr_cnt;478508
verify-cpc-omp-correct;10962/2;Instr_FGU_arithmetic;30000;Instr_cnt;493033
verify-cpc-omp-correct;10962/7;Instr_FGU_arithmetic;30000;Instr_cnt;476345
verify-cpc-omp-correct;10962/6;Instr_FGU_arithmetic;30000;Instr_cnt;493064
verify-cpc-omp-correct;10962/5;Instr_FGU_arithmetic;30000;Instr_cnt;475258
verify-cpc-omp-correct;10962/3;Instr_FGU_arithmetic;30000;Instr_cnt;475475
The output shows a valid result for the correctly parallelized calculations made in
each thread. As in each parallelized test case the access to the underlying libcpc 2
instance or PAPI instance was done by each member in the team, the libraries seem
to operate correctly in an multi-threaded environment as expected by section 4.5.
71
5 Implementation and Verification
As for all valid parallelized test cases the results matched exactly the values expected
in theory, the PAPI substrate and libcpc 2 can be considered to operate accurate
and furthermore to operate thread-safe. Further measurements using Sun Studio are
therefore not necessary, but they should backup the result received from both libraries
for the multi-threaded test case.
In section 3.3 a short overview about Sun Studio and the methods for collecting
performance counter data was given. The sampling method of collect is based on
PIC overflows. Using this technique, the collect application can instrument a library
without code modifications as required by using basic operations of PAPI or libcpc 2
as explained in the previous chapters.
In total three experiments were created using collect and analyzed using the
er_print utility. The experiments were taken using eight threads without explicit
processor binding. The summary output for the total count of events of the first
experiment can be seen below:
<Total>
Exclusive Instr_FGU_arithmetic Events:
Inclusive Instr_FGU_arithmetic Events:
Exclusive Instr_cnt Events:
Inclusive Instr_cnt Events:
Size:
PC Address:
Source File:
Object File:
Load Object:
Mangled Name:
Aliases:
328000 (100.0%)
328000 (100.0%)
12177000 (100.0%)
12177000 (100.0%)
0
1:0x00000000
(unknown)
(unknown)
<Total>
The following experiments showed for the Instr_FGU_arithmetic event counts
of 328.000 events and 325.000 events.
The event count is summarized
for all threads therefore a distinct count of 41.000 events, respectively
40.625 events was captured.
For collecting events the parameter -h Instr_FGU_arithmetic,1000,Instr_cnt,1000 was set, which counts overflows with
an offset of 1.000 events until an overflow is encountered. Furthermore the initialization sequence of the array for performing calculations is captured and executed by
each thread. This routine consists of a total of 10.000 floating-point operations in
theory. By theory the sampling of collect should have resulted in a total of 320.000
events.
As explained in [Sun07b, p. 144 ff.] the hardware overflow method for counting
events might yield a higher result as expected due to other operations performed
72
5.6 Problems during Implementation
in the background to handle the overflow. As no internal details about the actual
behavior of the Analyzer are available, but the results expected by theory could be
achieved using PAPI and libcpc 2, the higher event count encountered using Sun
Studio is arguable and a further investigation of the behavior was omitted.
At a glance the implementation of the PAPI substrate for the Niagara 2 has been
verified successfully to provide accurate results based on the results libcpc 2 provides.
In addition the reliability for the use of the substrate in multi-threaded environments
can be considered as accurate, as the test cases have shown. For the special case of
a data race in an parallelized application the counter values behave different from
correctly implemented applications, which might be caused by the exact implementation of the Instr_FGU_arithmetic event on hardware and further optimizations
implemented in hardware.
5.6 Problems during Implementation
During the implementation of the new PAPI substrate for the Niagara 2 several
problems were encountered.
Missing PAPI Documentation on the implementation of a new substrate was a
main concern during the implementation phase. As neither [PUG] nor [PPR] provide
a description of the underlying architecture in detail. Although the file $PSRC/anynull.c provides a definition of the main part of a substrate’s interface, in depth
details were missing.
Examples of problems encountered are:
• Disambiguity of the meaning of several API functions like
– _papi_hwd_init_control_state(),
– _papi_hwd_update_control_state() and
– _papi_hwd_dispatch_timer()
• Start of the native events table at index PAPI_NATIVE_MASK + 1 instead of a
index of PAPI_NATIVE_MASK
• Missing comments in the source code at important code sections
In order to solve the problems of the missing documentation many time consuming
debugging sessions, studying code from other substrates and studying code from the
upper layers of PAPI were common tasks during the development of the new substrate.
73
5 Implementation and Verification
Regression Tests of PAPI were the only available indicator for progress on the
development of the substrate and to discover the semantics of operations provided by
the substrate.
As the regression tests were under development for the next release of PAPI changes of
the test cases needed to be tracked. An example might be the multiplex3_pthreads
test case in $PSRC/src/ctests which is used to determine the functionality of the
multiplexing implementation in conjunction of multiple parallel threads by using
PThreads. As of PAPI 3.6.2 the test case expects all counted events to be nonzero, but event counters might be zero during multiplexing as they might oversee
certain events (for the discussion of multiplexing in PAPI see section 4.4).
For the Niagara 2 substrate sometimes events were lost during the execution of multiplex3_pthreads. In this case the whole regression test failed, but after starting
another run, the requirements were fulfilled.
In the head branch of PAPI the behavior of multiplex3_pthreads1 has been modified
in order to be more tolerant due to the nature of the multiplexing implementation,
which allows now to successfully run the test case if just one counter provides a
non-zero result.
Leaked memory in libcpc 2 was discovered during the development of a small test
case with libcpc 2. During the call of cpc_open() memory is allocated for storing the
capabilities of the underlying processor, but a corresponding free() is only called in
case of an error and not in a corresponding function like cpc_close(). The following
example will consume infinite memory resources, although the library is properly
initialized and closed:
#include <libcpc.h>
int main()
{
cpc_t *cpc;
while(1)
{
cpc = cpc_open(CPC_VER_CURRENT);
cpc_close(cpc);
}
1
Version 1.41 of multiplex3_pthreads committed on August 3, 2009, see http:
//icl.cs.utk.edu/viewcvs/viewcvs.cgi/PAPI/papi/src/ctests/multiplex3_pthreads.
c?annotate=1.41.
74
5.6 Problems during Implementation
return 0;
}
The leak report of bcheck for 100.000 iterations of the example shows an amount of
about 100 Mbytes of memory lost in the internal function cpc_get_list() of libcpc
2:
<rtc> Memory Leak (mel):
Found 199944 leaked blocks with total size 103770936 bytes
At time of each allocation, the call stack was:
[1] cpc_get_list() at 0xebd04ef0
[2] cpc_open() at 0xebd03e84
<rtc> Memory Leak (mel):
Found 100000 leaked blocks with total size 2100000 bytes
At time of each allocation, the call stack was:
[1] cpc_get_list() at 0xebd04ef0
[2] cpc_open() at 0xebd03e10
<rtc> Memory Leak (mel):
Found 99999 leaked blocks with total size 799992 bytes
At time of each allocation, the call stack was:
[1] cpc_open() at 0xebd03e3c
[2] main() at line 10 in "leak.c"
75
5 Implementation and Verification
76
6 Analysis of a Parallel Benchmark
6.1 Short Introduction to SMXV
SMXV is part of a solver library used at RWTH Aachen University for partial differential equations. In the solver library SMXV is used for sparse matrix vector
multiplications and consuming most of the time spent in the solver. [aMT07]
A sparse matrix can be represented in a specialized data structure in order to reduce
the amount of memory needed compared to storing the full matrix. The reduction of
a sparse matrix is done by omitting the zero values of the matrix in memory, therefore
the degree of sparsity for a given matrix determines the amount of memory actually
needed with a small overhead to store the positions of the elements. Data structures
for a sparse matrix might consist of a flat array for storing the non-zero elements and
additional indexes in order to access the elements and to hold the information about
the originating position of the element.
The access pattern found when using sparse matrices is therefore different from the
access pattern for dense n × m matrices. As the accesses to the elements of a sparse
matrix are controlled by their index structures and the actual element positions in
the originating matrix, the access pattern found in sparse matrices can be considered
as a irregular access pattern. Due to this access pattern optimization techniques like
prefetching of memory from higher to lower layers in the memory hierarchy does not
offer a gain in performance. All in all an exhaustive memory access can be expected
making the memory bandwidth a crucial point for operations with sparse matrices.
[Im00]
With an outlook to the memory hierarchy and parallel processing of sparse matrix
operations, systems with an UMA structure should tend to perform better compared
to systems with an NUMA structure as the memory accesses might take place only
on one local memory. Other cores or processors might suffer from this fact by a
significant higher latency for accessing the memory. Furthermore the interconnection
of the memories needs to handle all requests from remote cores and might therefore
be the bottleneck. On UMA machines all cores or processor would have the same
77
6 Analysis of a Parallel Benchmark
Figure 6.1: Results of SMXV Benchmark at RWTH Aachen in reference of [aMT07]
latency when accessing the memory, but the memory bandwidth would still be the
bottleneck due to many but small accesses in order to retrieve the elements of the
matrix. Efficient algorithms and index structures are therefore needed to face the
challenges of sparse matrices. A discussion of optimization approaches can be found
in [Im00].
At Aachen University a beta version of a Niagara 2 machine was used in 2007 for
performance measurements of several tasks and challenges commonly found in HPC
environments. One of the benchmarks was SMXV in order to compare the upcoming
Niagara 2 processor to other CPU families in use at Aachen. An overview of the
benchmark results can be seen in figure 6.1.
The benchmark shows the Niagara 2 performs well in comparison to the other machines used and even scales well with an increasing thread count. The other machines
are typical ILP based systems with a small number of cores and therefore increasing
the thread count on these systems would not yield a comparable result to the Niagara
2. The more interesting fact can be seen at overloading the Niagara 2 with a total of
112 threads. At this thread count the highest result measured in MFLOPS could be
archived.
Concluding to the development of the PAPI substrate for the Niagara 2 the benchmark
was therefore analyzed using PAPI in order to test the substrate implementation on
a real HPC workload and to analyze why the performance increases at this thread
count using the performance counters available.
78
6.2 Considerations and Analysis
6.2 Considerations and Analysis
The benchmark of SMXV built by researchers at Aachen University consists of six
independent test cases and three different data sets. The test cases are designed to
analyze different implementation approaches for solving sparse matrix vector multiplication and are either serial or parallelized using OpenMP. The data sets are of
different sizes, where the largest data set is about 76 Mbytes large with an in-memory
size of about 320 Mbytes.
For the following analysis only the parallelized benchmarks are used and the largest
data set available as this is the most interesting combination for execution on the
Niagara 2 and represents a common workload in production at RWTH. [aMT07]
The test cases for this analysis are:
• y_Ax_omp, OpenMP parallelization using floating-point arithmetic
• y_Ax_omp_block, OpenMP parallelization with explicit data distribution using
floating-point arithmetic
• y_Ax_omp_block_int, OpenMP parallelization with explicit data distribution
using integer arithmetic1
The most performance-critical points for the benchmarks are the floating-point performance and the memory bandwidth and hierarchy. As both units, FGU and LSU,
are shared between all strands of a Niagara 2 core these resources are suspected to
stall, especially for a high thread count. Furthermore operations on these units have
a significant higher latency than instructions on the IU as these operations are either
more complex in case of floating-points operations or they take a longer time to finish as they require memory access up to the main memory in case of load and store
operations and can cause other operations to be executed (e.g. HWTWs, coherency
and consistency protocol activity).
For benchmarking SMXV the original source code has been modified to support PAPI
and to return an accumulated count of events for all threads for each test case.
Furthermore it was ensured that all test cases iterate over the whole sparse matrix as
the original version stopped the execution of a SMXV test case after a fixed amount
of time was spent or the count of iterations performed reached a specific value.
The actual algorithms for performing the calculations on the sparse matrix have not
been modified. The test cases have been run multiple times on a dedicated machine
1
Although actually no floating-point operations are performed in this test case, the instruction rate
is given as MFLOPS.
79
6 Analysis of a Parallel Benchmark
which was kindly offered by Aachen University in order to retrieve reliable results
especially for memory related event counters. From all test runs the average values
are presented in this section, measurements were made with 16, 32, 64, 80, 96, 112,
128 and 144 threads in order to analyze the performance gain found by researchers
at Aachen University.
As it can be seen in figure 6.2 although the range for operations has changed, the
results look similar: The machine performs for all test cases better when it is overloaded by threads. Furthermore the diagram reveals at least for up to 144 threads
a higher efficiency for the test cases with explicit data distribution compared to full
load at 64 threads. The peak MFLOPS count is reached for y_Ax_omp_block at 112
and 128 threads, for y_Ax_omp_block_int at 128 threads and for y_Ax_omp at 144
threads.
Due to the previously explained challenges for sparse matrix operations with exhaustive memory accesses, the first steps of an analysis were made on possible bottlenecks
in the memory hierarchy as far as supported by the native events available. As the
Niagara 2 is a UMA system in case of an one-socket design, all threads have the same
latency when accessing the memory. This situation might be only true in case of fully
balanced thread load across all cores as otherwise some threads would have longer
stall times while waiting for access to the shared LSU. As explained in section 2.2
Solaris tries to balance the threads across all cores and therefore the latency should
be the same for all strands.
In figure 6.3 it can be seen that the L1 data cache misses encountered by all threads
do not further increase with a higher thread count. This behavior might be caused
by the fact that accesses to the L1 data cache are at their peak rate limited by a
bottleneck. Due to the design of a core the bottleneck in this case might be the LSU
as it is heavily overloaded as explained before.
For the L2 caches the multiplexing and interleaving scheme as explained in section 2.3
should be suitable to balance the available memory bandwidth well. Especially for
sparse matrix operations and the irregular access patterns the interleaving should be
reasonable as it balances the requests across all L2 caches. For the L2 cache misses in
figure 6.4 a small but constant increase can be observed for thread counts higher than
64 threads. As the increase of misses does not ”scale” as the thread count is scaled
higher, this behavior backs up the assumption that a peak rate has been reached.
The assumption that a peak rate of requests to at least the L1 cache has
been reached at 64 threads can be acknowledged by the fact that for the test
case y_Ax_omp_block_int the diagram shows similar characteristics as for the
y_Ax_omp_block test case. Actually y_Ax_omp_block_int should be capable of per-
80
6.2 Considerations and Analysis
4096
MFLOPS
2048
1024
512
y_Ax_omp
y_Ax_omp_block
y_Ax_omp_block_int
256
16
32
48
64
80
96
112
128
144
Threads
Figure 6.2: SMXV: MFLOPS by Test Case
DC_miss
3.43597e+10
y_Ax_omp
y_Ax_omp_block
y_Ax_omp_block_int
1.71799e+10
16
32
48
64
80
96
112
128
144
Threads
Figure 6.3: SMXV: L1 Data Cache Misses by Test Case
L2_miss_ld
5.36871e+08
y_Ax_omp
y_Ax_omp_block
y_Ax_omp_block_int
2.68435e+08
16
32
48
64
80
96
112
128
144
Threads
Figure 6.4: SMXV: L2 Cache Load Misses by Test Case
81
6 Analysis of a Parallel Benchmark
5.49756e+11
Idle_strands
y_Ax_omp
y_Ax_omp_block
y_Ax_omp_block_int
2.74878e+11
1.37439e+11
6.87195e+10
16
32
48
64
80
96
112
128
144
Threads
Figure 6.5: SMXV: Idle Strands by Test Case
forming about twice the amount of operations as two IUs per core are available.
Furthermore the smul (integer multiplication) instruction has a latency of 5 cycles
whereas the fmuld (floating-point multiplication on double-words) instruction has a
fixed latency of 6 cycles. [Sun07c, p. 898, p. 901]
Using the facts explained below the following scenario might explain the behavior:
• The LSU seems to be overloaded and can not issue a higher rate of requests to
the L1 cache in order to serve all threads fast enough, which is true for all test
cases
• As the IUs should be capable of about twice the amount of computations in
combination with a lower latency for the execution, the threads are not able to
perform their operations leading to IU pipeline stalls
• The FGU and LSU pipelines seem to perform well when they are used together
and the pipelines seem no to be in stalling states waiting for requests
Given these points at least the overload state can be explained, but the positive
effect while overloading the system resulting in a peak MFLOPS rate can not be
explained. As the LSU should be considered as being overloaded the positive effect
tends to result from another effect. For the overload scenario the operating system is
moreover interesting as it has to serve all threads with a reasonable amount of CPU
time. From this point the native event Idle_strands was used to determine how the
scheduling and dispatching routines perform with the overload situation. Although
this event is designed to count the idle times of a whole core and not a single strand
and the measurements were made using the PICs of all thread, a tendency should be
observable.
82
6.2 Considerations and Analysis
As it can be seen in figure 6.5 the event showed a corresponding tendency as the
MFLOPS rate shown in figure 6.2. For the test case y_Ax_omp_block two interesting
results can be seen at 64 threads and at 112 and 128 threads. At 64 threads all
available strands on the system can be used to perform the sparse vector multiplication
and the operating system does not need to preempt strands for other threads, but
the actual MFLOPS rate is not as good as for 112 and 128 threads in total. This
effect might be caused by fact that for operations in the memory hierarchy pipelines
are used at several stages and these pipelines can be filled with several requests (e.g.
LSU, MCU, HWTW). As these operations have a different latency, the time to fulfill
the request might be used to already issue further requests to the pipelines in order
to fill the available slots, but this can only be realized by having more threads issuing
requests as the threads currently being served by the pipeline stall. While the threads
are stalling the operating system can dispatch other threads to the strands with stalled
threads and keep the stalled threads in a waiting state until the memory request are
fulfilled and meanwhile the dispatched threads can issue their requests until they stall
again.
This situation might be the ideal situation for an TLP-based processor and seems to
be reached for y_Ax_omp_block at 112 and 128 threads where the actual idle time is
not much higher as compared to a situation under full load at 64 threads, but with
a positive effect for the overall throughput of the system yielding the peak MFLOPS
rates. The assumption can be furthermore explained with the drastic decrease of the
idle times when scaling the threads from 16 to 64 although the LSU might be overloaded already at this point, but other pipelines available might not be fully loaded.
The increase of idle times at 80 threads might be explained by the scheduling routines
of the operating system where not enough threads in a ready state are available to
replace stalling threads.
In section 2.1 optimization approaches for CMT systems were given and in this case
the approach to simply increase the count of threads could be successfully used to
reach a higher throughput result. Furthermore the LSU has been identified as a
bottleneck for SMXV as it is a shared resource between all threads. The effect of the
bottleneck can be hidden by using more threads in order to keep all pipelines at a
peak load yielding the best results. Using the feedback of the performance counters
these effects could be successfully analyzed.
83
7 Conclusion
7 Conclusion
The main objective of this thesis was the development of a new PAPI substrate for the
Niagara 2 and therefore extending the functionality of PAPI by support of another
platform. The development was intended to be based on the libcpc 2 library which
is part of the Solaris operating system. A first version of the implementation of
the substrate was sent to the PAPI development team and merged with the PAPI
development branch1 on August 25, 2009 with the aim to be part of the upcoming
PAPI 3.7.0 release. The new release is expected to be available in September 2009.
The implementation was based on an in-depth analysis of PAPI and libcpc 2 as the
documentation available was limited presented in chapter 4. The analysis showed
that both libraries have certain similarities, but as described in chapter 5 the actual
implementation needed a huge effort to develop a mapping between both libraries
and to offer the full functionality of PAPI to future users of the substrate. At this
point the implementation will need further testing as it has up to now only be tested
running on machines at the RWTH Aachen University.
As the substrate is based on libcpc 2, which is available for several underlying CPU
architectures supported by Solaris, it could be used as a foundation for future extensions to other CPU architectures than the Niagara 2. Furthermore the substrate
might be optimized in order to improve the run time behavior and to reduce overhead
encountered by the use of PAPI which was showed in section 5.5 compared to a measurement taken by a program only using libcpc 2. Besides section 5.5 showed that
the performance counter results of the substrate implementation can be considered
as being very accurate.
In many cases during the creation of this work the available documentation was limited and a huge amount of effort needed to be spent on investigation using debugging
and code reviews. In addition an interesting side-effect was discovered in section
5.5 showing different performance counter results in case of a data race of multiple
threads. This side-effect needs further investigation in order to isolate this behavior
1
The main part of the substrate in the source file solaris-niagara2.c can be
seen at http://icl.cs.utk.edu/viewcvs/viewcvs.cgi/PAPI/papi/src/solaris-niagara2.
c?revision=1.1&view=markup
84
and to ensure other side-effects might not appear under other circumstances.
Finally chapter 6 showed an example of a deployment of the new PAPI substrate. Using PAPI the results of a previous benchmark made by researchers at RWTH Aachen
University could be investigated and an interesting fact of the TLP-design of the Niagara 2 could be unveiled for this scenario. In contrast commonly known architecture
with ILP-based design principles, the Niagara 2 showed the best results while heavily overloaded. Based on these results future research on run time optimization on
Niagara 2 to find an optimal count of threads for a given application might be made.
At a glance all requirements of this thesis could be achieved with the result of a first
approach of Niagara 2 support for PAPI ready to be released with the next release of
PAPI.
85
7 Conclusion
86
A Eidesstattliche Erklärung
Bergisch Gladbach, 2009-09-09
Hiermit erkläre ich an Eides Statt, dass ich die vorliegende Arbeit selbst angefertigt
habe; die aus fremden Quellen direkt oder indirekt übernommenen Gedanken sind als
solche kenntlich gemacht.
Die Arbeit wurde bisher keiner Prüfungsbehörde vorgelegt und auch noch nicht veröffentlicht.
Fabian Gorsler
87
B Conventions in this Document
B Conventions in this Document
B.1 Typographic Conventions
• Technical Terms: SIGEMT
Technical terms are always printed using a monospace font.
• Source Code Functions: hello_world()
Function names are printed using a monospace font with braces as suffix. For
better readability the parameters of the function are omitted.
• Manual Page References: ls (1)
Manual page names are printed using a monospace font with the manual section
in braces. All manual references are related to Solaris 10 and can be looked up
in [Sun08b]. Libraries supplied with Solaris 10 can be found in [Sun08c] and
[Sun08d].
• Source Code References: $XYSRC/hello_world.c are printed using a
monospace font with the prefix $XYSRC, where XY represents the name of the
source code referenced (see below).
• Processor Registers: PIC
Processor registers a printed in sans-serif font as defined in [Sun07c].
B.2 Source Code References
• $PSRC: PAPI 3.6.2 source distribution, available at http://icl.cs.utk.edu/
projects/papi/downloads/papi-3.6.2.tar.gz or using the CVS viewer at
http://icl.cs.utk.edu/viewcvs/viewcvs.cgi/PAPI/papi/.
• $OSSRC: OpenSolaris source code, available using the source code browser at
http://src.opensolaris.org/source/xref/onnv/. The files used with their
exact access dates can be seen below. Due to the path depth of the OpenSolaris
source code the files were not qualified by their full source paths for better
readability.
88
B.3 OpenSolaris Source Code References
B.3 OpenSolaris Source Code References
• $OSSRC/cmt_policy.c
Full Path: /usr/src/uts/common/disp/cmt_policy.c
Access Date: 2009-07-28
Link to the source code of $OSSRC/cmt_policy.c
• $OSSRC/disp.c
Full Path: /usr/src/uts/common/disp/disp.c
Access Date: 2009-07-28
Link to the source code of $OSSRC/disp.c
• $OSSRC/cmt.c
Full Path: /usr/src/uts/common/disp/cmt.c
Access Date: 2009-07-28
Link to the source code of $OSSRC/cmt.c
• $OSSRC/pghw.h
Full Path: /usr/src/uts/common/sys/pghw.h
Access Date: 2009-07-28
Link to the source code of $OSSRC/pghw.h
• $OSSRC/cmp.c
Full Path: /usr/src/uts/sun4v/os/cmp.c
Access Date: 2009-07-28
Link to the source code of $OSSRC/cmp.c
• $OSSRC/mpo.c
Full Path: /usr/src/uts/sun4v/os/mpo.c
Access Date: 2009-07-28
Link to the source code of $OSSRC/mpo.c
• $OSSRC/niagara2_pcbe.c
Full Path: /usr/src/uts/sun4v/pcbe/niagara2_pcbe.c
Access Date: 2009-08-13
Link to the source code of $OSSRC/niagara2_pcbe.c
89
C Used Environment in this Thesis
C Used Environment in this Thesis
C.1 Description
The analysis, implementation and design of the PAPI substrate based on libcpc 2 was
realized on a Sun T5120 machine. Access to the system was granted in courtesy of
the Center for Computing and Communication at RWTH Aachen University.
The configuration of the system consisted of a setup with one UltraSPARC T2 processor and 32 GB RAM. The system offered 64 strands distributed on eight cores,
each with two integer units, a floating-point unit and a load and store unit. Further
details on the hardware configuration and the operating environment can be found in
[aMST+ 09].
The system was equipped with Solaris 10 and libcpc 2 and a tool chain consisting of
a compiler, IDE and the performance analyzing suite used for the verification based
on Sun Studio 12.
C.2 Software Versions
Operating System: Solaris 10
$ cat /etc/release
Solaris 10 10/08 s10s_u6wos_07b SPARC
Copyright 2008 Sun Microsystems, Inc. All Rights Reserved.
Use is subject to license terms.
Assembled 27 October 2008
Operating System Library: libcpc 2
$ pkginfo -l SUNWcpc SUNWcpcu
PKGINST: SUNWcpc
90
C.2 Software Versions
NAME:
CATEGORY:
ARCH:
VERSION:
BASEDIR:
VENDOR:
DESC:
PSTAMP:
INSTDATE:
HOTLINE:
STATUS:
FILES:
CPU Performance Counter driver
system
sparc.sun4v
11.10.0,REV=2005.07.25.02.27
/
Sun Microsystems, Inc.
Kernel support for CPU Performance Counters
on10ptchfeat20080814064053
Jan 05 2009 13:57
Please contact your local service provider
completely installed
10 installed pathnames
7 shared pathnames
1 linked files
7 directories
1 executables
79 blocks used (approx)
PKGINST:
NAME:
CATEGORY:
ARCH:
VERSION:
BASEDIR:
VENDOR:
DESC:
PSTAMP:
INSTDATE:
HOTLINE:
STATUS:
FILES:
SUNWcpcu
CPU Performance Counter libraries and utilities
system
sparc
11.10.0,REV=2005.01.21.15.53
/
Sun Microsystems, Inc.
CPU Performance Counter libraries and utilities
on10ptchfeat20081209170332
Jun 16 2009 13:32
Please contact your local service provider
completely installed
34 installed pathnames
11 shared pathnames
3 linked files
11 directories
8 executables
1109 blocks used (approx)
Development Tools: Sun Studio 12
$ $ pkginfo -l SPROcc.2
PKGINST: SPROcc.2
NAME: Sun Studio 12 C Compiler
CATEGORY: application
91
C Used Environment in this Thesis
ARCH:
VERSION:
BASEDIR:
VENDOR:
DESC:
PSTAMP:
INSTDATE:
HOTLINE:
STATUS:
FILES:
sparc
12.0,REV=2007.05.03
/opt/Studio12
Sun Microsystems, Inc.
C Compiler C
070503124838-24634-8378329d
Jun 16 2009 14:34
Please contact your local service provider
completely installed
101 installed pathnames
33 shared pathnames
39 directories
23 executables
11550 blocks used (approx)
$ pkginfo -l SPROprfan.2
PKGINST: SPROprfan.2
NAME: Sun Studio 12 Performance Analyzer Tools
CATEGORY: application
ARCH: sparc
VERSION: 12.0,REV=2007.05.03
BASEDIR: /opt/Studio12
VENDOR: Sun Microsystems, Inc.
DESC: Performance Analyzer Tools
PSTAMP: 070503141233-22962-8378329d
INSTDATE: Jan 05 2009 16:45
HOTLINE: Please contact your local service provider
STATUS: completely installed
FILES:
85 installed pathnames
37 shared pathnames
39 directories
28 executables
12371 blocks used (approx)
92
D Capabilities of collect
The following output1 was generated by the command collect, which is used to
collect performance counter data for verification. The command was run on the
host suntc02, which is the frontend node of the Niagara 2 cluster at RWTH Aachen
University. This system has been used for the development of the PAPI substrate
and all verification tasks.
$ collect
NOTE: SunOS-64-bit, 64 CPUs, sparc 5.10 system suntc02.rz.RWTH-Aachen.DE is
correctly patched and set up for use with the Performance tools.
NOTE: The J2SE[tm] version 1.5.0_20 found at java (picked by PATH) is
supported by the Performance tools.
usage: collect <args> target <target-args>
Sun Analyzer 7.6 SunOS_sparc Patch 126995-04 2008/08/27
-p <interval> specify clock-profiling
clock profiling interval range on this system is from
0.500 to 1000.000 millisec.; resolution is 0.001 millisec.
-h <ctr_def>...[,<ctr_n_def>]
specify HW counter profiling for up to 2 HW counters
see below for more details
-s <threshold>
specify synchronization wait tracing
-r <option>
specify thread analyzer experiment; see man page
-H {on|off}
specify heap tracing
-m {on|off}
specify MPI tracing
-c {on|static|off}
specify count data, using bit(1)
-j {on|off|path}
specify Java profiling
-J <java-args>
specify arguments to Java for Java profiling
-P <pid>
use dbx to attach and collect data from running process
-t <duration> specify time over which to record data
-x
specify leaving the target waiting for a debugger attach
-n
dry run -- don’t run target or collect performance data
-y <signal>[,r]
specify delayed initialization and pause/resume
signal
When set, the target starts in paused mode;
1
Some lines have been truncated due to the paper format.
93
D Capabilities of collect
-F
-A
-S
-L
-l
-o
-d
-g
-O
-v
-C
-R
-V
if the optional r is provided, it starts in resumed mode
{on|off|all|=<regex>}
specify following descendant processes
{on|off|copy}
specify archiving of load-objects; default is on
<interval> specify periodic sampling interval (secs.)
<size>
specify experiment size limit (MB.)
<signal>
specify signal for samples
<expt>
specify experiment name
<directory>
specify experiment directory
<groupname>
specify experiment group
<file>
redirect all of collect’s output to file
print expanded log of processing
<label>
specify comment label (up to 10 may appear)
show the README file and exit
print version number and exit
Default experiment:
expt_name = test.1.er
clock profiling enabled, 10.007 millisec.
descendant processes will not be followed
periodic sampling, 1 secs.
experiment size limit 2000 MB.
experiment archiving: on
data descriptor: "p:10007;S:1;L:2000;A:1;"
host: ‘suntc02’, cpuver = 1101, ncpus = 64, clock frequency
1415 MHz.
memory: 4177920 pages @ 8192 bytes = 32640 MB.
Specifying HW counters on ‘UltraSPARC T2’:
<ctr_def> ==
[+]<ctr>[~<attr>=<val>]...[~<attrN>=<valN>][/<reg#>][,<interval>]
<+>
for memory-related counters, attempt to backtrack to find
the triggering instruction and the virtual and physical
addresses of the memory reference
<ctr>
counter name, must be selected from the available counters
listed below
<attr>=<val>
optional attribute where <val> can be in decimal or hex
format, and <attr> can be one of:
’hpriv’
’emask’
<reg#>
forces use of a specific hardware register. If not specified,
94
collect will attempt to place the counter into the first
available register and as a result, may be unable to place
subsequent counters due to register conflicts.
<interval> == {on|hi|lo|<value>}
‘on’ selects the default rate, listed below
‘hi’ specifies an interval ~10 times shorter than ‘on’
‘lo’ specifies an interval ~10 times longer than ‘on’
Well-known HW counters available for profiling:
insts[/{0|1}],9999991 (‘Instructions Executed’, alias for Instr_cnt;
load-store events)
icm[/{0|1}],100003 (‘I$ Misses’, alias for IC_miss; load-store events)
itlbm[/{0|1}],100003 (‘ITLB Misses’, alias for ITLB_miss; load-store
events)
ecim[/{0|1}],10007 (‘E$ Instr. Misses’, alias for L2_imiss; load-store
events)
dcm[/{0|1}],100003 (‘D$ Misses’, alias for DC_miss; load-store events)
dtlbm[/{0|1}],100003 (‘DTLB Misses’, alias for DTLB_miss; load-store
events)
ecdm[/{0|1}],10007 (‘E$ Data Misses’, alias for L2_dmiss_ld; load-store
events)
Raw HW counters available for profiling:
Idle_strands[/{0|1}],1000003 (events)
Br_completed[/{0|1}],1000003 (load-store events)
Br_taken[/{0|1}],1000003 (load-store events)
Instr_FGU_arithmetic[/{0|1}],1000003 (load-store events)
Instr_ld[/{0|1}],1000003 (load-store events)
Instr_st[/{0|1}],1000003 (load-store events)
Instr_sw[/{0|1}],1000003 (load-store events)
Instr_other[/{0|1}],1000003 (load-store events)
Atomics[/{0|1}],1000003 (events)
Instr_cnt[/{0|1}],1000003 (load-store events)
IC_miss[/{0|1}],1000003 (load-store events)
DC_miss[/{0|1}],1000003 (load-store events)
L2_imiss[/{0|1}],1000003 (load-store events)
L2_dmiss_ld[/{0|1}],1000003 (load-store events)
ITLB_HWTW_ref_L2[/{0|1}],1000003 (events)
DTLB_HWTW_ref_L2[/{0|1}],1000003 (events)
ITLB_HWTW_miss_L2[/{0|1}],1000003 (events)
DTLB_HWTW_miss_L2[/{0|1}],1000003 (events)
Stream_ld_to_PCX[/{0|1}],1000003 (events)
Stream_st_to_PCX[/{0|1}],1000003 (events)
CPU_ld_to_PCX[/{0|1}],1000003 (events)
95
D Capabilities of collect
CPU_ifetch_to_PCX[/{0|1}],1000003 (events)
CPU_st_to_PCX[/{0|1}],1000003 (events)
MMU_ld_to_PCX[/{0|1}],1000003 (events)
DES_3DES_op[/{0|1}],1000003 (events)
AES_op[/{0|1}],1000003 (events)
RC4_op[/{0|1}],1000003 (events)
MD5_SHA-1_SHA-256_op[/{0|1}],1000003 (events)
MA_op[/{0|1}],1000003 (events)
CRC_TCPIP_cksum[/{0|1}],1000003 (events)
DES_3DES_busy_cycle[/{0|1}],1000003 (events)
AES_busy_cycle[/{0|1}],1000003 (events)
RC4_busy_cycle[/{0|1}],1000003 (events)
MD5_SHA-1_SHA-256_busy_cycle[/{0|1}],1000003 (events)
MA_busy_cycle[/{0|1}],1000003 (events)
CRC_MPA_cksum[/{0|1}],1000003 (events)
ITLB_miss[/{0|1}],1000003 (load-store events)
DTLB_miss[/{0|1}],1000003 (load-store events)
TLB_miss[/{0|1}],1000003 (events)
See the "UltraSPARC T2 User’s Manual" for descriptions of these events.
Documentation for Sun processors can be found at:
http://www.sun.com/processors/manuals
See the collect.1 man page for more information
96
E Capabilities of PAPI on Niagara 2
E.1 Native Events
The following output1 was generated by the utility papi_native_avail, which is
supplied with PAPI and showing all native events supported and exported by the
PAPI substrate to the higher layers of PAPI. The output is based on the PAPI head
revision merged with the Niagara 2 substrate.
$ papi_native_avail
Available native events and hardware information.
--------------------------------------------------------------------------PAPI Version
: 3.6.2.3
Vendor string and code
: SUN (7)
Model string and code
: UltraSPARC T2 (1)
CPU Revision
: 1.000000
CPU Megahertz
: 1415.000000
CPU Clock Megahertz
: 1415
CPU’s in this Node
: 64
Nodes in this System
: 1
Total CPU’s
: 64
Number Hardware Counters : 2
Max Multiplex Counters
: 32
--------------------------------------------------------------------------The following correspond to fields in the PAPI_event_info_t structure.
Event Code
Symbol | Long Description |
--------------------------------------------------------------------------0x40000001
Idle_strands | Idle_strands
0x40000002
Br_completed | Br_completed
0x40000003
Br_taken | Br_taken
0x40000004
Instr_FGU_arithmetic | Instr_FGU_arithmetic
0x40000005
Instr_ld | Instr_ld
0x40000006
Instr_st | Instr_st
1
Some lines have been truncated due to the paper format.
97
E Capabilities of PAPI on Niagara 2
0x40000007
Instr_sw | Instr_sw
0x40000008
Instr_other | Instr_other
0x40000009
Atomics | Atomics
0x4000000a
Instr_cnt | Instr_cnt
0x4000000b
IC_miss | IC_miss
0x4000000c
DC_miss | DC_miss
0x4000000d
L2_imiss | L2_imiss
0x4000000e
L2_dmiss_ld | L2_dmiss_ld
0x4000000f
ITLB_HWTW_ref_L2 | ITLB_HWTW_ref_L2
0x40000010
DTLB_HWTW_ref_L2 | DTLB_HWTW_ref_L2
0x40000011
ITLB_HWTW_miss_L2 | ITLB_HWTW_miss_L2
0x40000012
DTLB_HWTW_miss_L2 | DTLB_HWTW_miss_L2
0x40000013
Stream_ld_to_PCX | Stream_ld_to_PCX
0x40000014
Stream_st_to_PCX | Stream_st_to_PCX
0x40000015
CPU_ld_to_PCX | CPU_ld_to_PCX
0x40000016
CPU_ifetch_to_PCX | CPU_ifetch_to_PCX
0x40000017
CPU_st_to_PCX | CPU_st_to_PCX
0x40000018
MMU_ld_to_PCX | MMU_ld_to_PCX
0x40000019
DES_3DES_op | DES_3DES_op
0x4000001a
AES_op | AES_op
0x4000001b
RC4_op | RC4_op
0x4000001c
MD5_SHA-1_SHA-256_op | MD5_SHA-1_SHA-256_op
0x4000001d
MA_op | MA_op
0x4000001e
CRC_TCPIP_cksum | CRC_TCPIP_cksum
0x4000001f
DES_3DES_busy_cycle | DES_3DES_busy_cycle
0x40000020
AES_busy_cycle | AES_busy_cycle
0x40000021
RC4_busy_cycle | RC4_busy_cycle
0x40000022
MD5_SHA-1_SHA-256_busy_cycle | MD5_SHA-1_SHA-256_busy_cycle
0x40000023
MA_busy_cycle | MA_busy_cycle
0x40000024
CRC_MPA_cksum | CRC_MPA_cksum
0x40000025
ITLB_miss | ITLB_miss
0x40000026
DTLB_miss | DTLB_miss
0x40000027
TLB_miss | TLB_miss
0x40000028
_syn_cycles_elapsed | _syn_cycles_elapsed
0x40000029
_syn_return_one | _syn_return_one
0x4000002a
_syn_return_two | _syn_return_two
--------------------------------------------------------------------------Total events reported: 42
native_avail.c
PASSED
98
E.2 Preset Events
E.2 Preset Events
The following output2 was generated by the utility papi_avail, which is supplied
with PAPI and showing all preset and native events supported and exported by the
PAPI substrate to the higher layers of PAPI. The output is based on the PAPI head
revision merged with the Niagara 2 substrate.
$ papi_avail
Available events and hardware information.
--------------------------------------------------------------------------PAPI Version
: 3.6.2.3
Vendor string and code
: SUN (7)
Model string and code
: UltraSPARC T2 (1)
CPU Revision
: 1.000000
CPU Megahertz
: 1415.000000
CPU Clock Megahertz
: 1415
CPU’s in this Node
: 64
Nodes in this System
: 1
Total CPU’s
: 64
Number Hardware Counters : 2
Max Multiplex Counters
: 32
--------------------------------------------------------------------------The following correspond to fields in the PAPI_event_info_t structure.
Name
PAPI_L1_DCM
PAPI_L1_ICM
PAPI_L2_ICM
PAPI_L1_TCM
PAPI_TLB_DM
PAPI_TLB_IM
PAPI_TLB_TL
PAPI_L2_LDM
PAPI_BR_CN
PAPI_BR_TKN
PAPI_BR_MSP
PAPI_BR_PRC
PAPI_TOT_INS
PAPI_FP_INS
PAPI_LD_INS
PAPI_SR_INS
2
Code
Avail Deriv Description (Note)
0x80000000 Yes
No
Level 1 data cache misses
0x80000001 Yes
No
Level 1 instruction cache misses
0x80000003 Yes
No
Level 2 instruction cache misses
0x80000006 Yes
Yes Level 1 cache misses
0x80000014 Yes
No
Data translation lookaside buffer misse
0x80000015 Yes
No
Instruction translation lookaside buffe
0x80000016 Yes
No
Total translation lookaside buffer miss
0x80000019 Yes
No
Level 2 load misses
0x8000002b Yes
Yes Conditional branch instructions
0x8000002c Yes
No
Conditional branch instructions taken
0x8000002e Yes
No
Conditional branch instructions mispred
0x8000002f Yes
Yes Conditional branch instructions correct
0x80000032 Yes
No
Instructions completed
0x80000034 Yes
No
Floating point instructions
0x80000035 Yes
No
Load instructions
0x80000036 Yes
No
Store instructions
Some lines have been truncated due to the paper format. Only lines with available mappings are
shown.
99
E Capabilities of PAPI on Niagara 2
PAPI_BR_INS 0x80000037 Yes
No
Branch instructions
PAPI_RES_STL 0x80000039 Yes
No
Cycles stalled on any resource
PAPI_TOT_CYC 0x8000003b Yes
No
Total cycles
PAPI_LST_INS 0x8000003c Yes
Yes Load/store instructions completed
PAPI_SYC_INS 0x8000003d Yes
No
Synchronization instructions completed
PAPI_L2_ICR 0x80000050 Yes
No
Level 2 instruction cache reads
PAPI_L1_TCR 0x8000005b Yes
No
Level 1 total cache reads
PAPI_L2_TCW 0x8000005f Yes
No
Level 2 total cache writes
------------------------------------------------------------------------Of 103 possible events, 24 are available, of which 4 are derived.
avail.c
100
PASSED
F Output of a Verification Run
The following output shows on iteration of the test suite used for the verification of
the substrate implementation as explained in 5.5.
####################################
# Iteration 1 - Wed Aug 26 17:24:03 MEST 2009
####################################
# Single-threaded
verify-papi;0;Instr_FGU_arithmetic;30000;Instr_cnt;623154
verify-cpc;0;Instr_FGU_arithmetic;30000;Instr_cnt;621823
# Multi-threaded with 4 threads, 1 thread/FGU using SUNW_MP_PROCBIND
verify-papi-omp;10926/3;Instr_FGU_arithmetic;0;Instr_cnt;5405
verify-papi-omp;10926/1;Instr_FGU_arithmetic;0;Instr_cnt;1562
verify-papi-omp;10926/2;Instr_FGU_arithmetic;0;Instr_cnt;2748
verify-papi-omp;10926/0;Instr_FGU_arithmetic;30000;Instr_cnt;636275
./verify-papi-omp 0.01s user 0.07s system 62% cpu 0.128 total
verify-cpc-omp;10927/2;Instr_FGU_arithmetic;0;Instr_cnt;1446
verify-cpc-omp;10927/3;Instr_FGU_arithmetic;0;Instr_cnt;4009
verify-cpc-omp;10927/1;Instr_FGU_arithmetic;0;Instr_cnt;1454
verify-cpc-omp;10927/0;Instr_FGU_arithmetic;30000;Instr_cnt;634249
./verify-cpc-omp 0.01s user 0.01s system 37% cpu 0.053 total
verify-papi-omp-correct;10928/0;Instr_FGU_arithmetic;30000;Instr_cnt;480722
verify-papi-omp-correct;10928/1;Instr_FGU_arithmetic;30000;Instr_cnt;476549
verify-papi-omp-correct;10928/2;Instr_FGU_arithmetic;30000;Instr_cnt;475364
verify-papi-omp-correct;10928/3;Instr_FGU_arithmetic;30000;Instr_cnt;475581
./verify-papi-omp-correct 0.01s user 0.07s system 67% cpu 0.118 total
verify-cpc-omp-correct;10929/0;Instr_FGU_arithmetic;30000;Instr_cnt;478176
verify-cpc-omp-correct;10929/1;Instr_FGU_arithmetic;30000;Instr_cnt;475623
verify-cpc-omp-correct;10929/2;Instr_FGU_arithmetic;30000;Instr_cnt;475475
verify-cpc-omp-correct;10929/3;Instr_FGU_arithmetic;30000;Instr_cnt;475483
./verify-cpc-omp-correct 0.01s user 0.01s system 42% cpu 0.047 total
verify-papi-omp-datarace;10930/0;Instr_FGU_arithmetic;30000;Instr_cnt;626422
verify-papi-omp-datarace;10930/1;Instr_FGU_arithmetic;30000;Instr_cnt;621200
verify-papi-omp-datarace;10930/2;Instr_FGU_arithmetic;30000;Instr_cnt;621208
verify-papi-omp-datarace;10930/3;Instr_FGU_arithmetic;30000;Instr_cnt;621334
101
F Output of a Verification Run
./verify-papi-omp-datarace 0.01s user 0.07s system 70% cpu 0.113 total
verify-cpc-omp-datarace;10931/0;Instr_FGU_arithmetic;30000;Instr_cnt;623924
verify-cpc-omp-datarace;10931/1;Instr_FGU_arithmetic;30000;Instr_cnt;621532
verify-cpc-omp-datarace;10931/2;Instr_FGU_arithmetic;30000;Instr_cnt;621137
verify-cpc-omp-datarace;10931/3;Instr_FGU_arithmetic;30000;Instr_cnt;621180
./verify-cpc-omp-datarace 0.01s user 0.01s system 41% cpu 0.048 total
# Multi-threaded with 8 threads, 1 thread/FGU using SUNW_MP_PROCBIND
verify-papi-omp;10932/0;Instr_FGU_arithmetic;30000;Instr_cnt;637377
verify-papi-omp;10932/3;Instr_FGU_arithmetic;0;Instr_cnt;9748
verify-papi-omp;10932/1;Instr_FGU_arithmetic;0;Instr_cnt;3188
verify-papi-omp;10932/7;Instr_FGU_arithmetic;0;Instr_cnt;4499
verify-papi-omp;10932/4;Instr_FGU_arithmetic;0;Instr_cnt;2451
verify-papi-omp;10932/5;Instr_FGU_arithmetic;0;Instr_cnt;3778
verify-papi-omp;10932/6;Instr_FGU_arithmetic;0;Instr_cnt;3879
verify-papi-omp;10932/2;Instr_FGU_arithmetic;0;Instr_cnt;2833
./verify-papi-omp 0.01s user 0.07s system 73% cpu 0.109 total
verify-cpc-omp;10933/4;Instr_FGU_arithmetic;0;Instr_cnt;1860
verify-cpc-omp;10933/0;Instr_FGU_arithmetic;30000;Instr_cnt;634249
verify-cpc-omp;10933/3;Instr_FGU_arithmetic;0;Instr_cnt;4178
verify-cpc-omp;10933/5;Instr_FGU_arithmetic;0;Instr_cnt;2748
verify-cpc-omp;10933/7;Instr_FGU_arithmetic;0;Instr_cnt;2532
verify-cpc-omp;10933/2;Instr_FGU_arithmetic;0;Instr_cnt;4336
verify-cpc-omp;10933/1;Instr_FGU_arithmetic;0;Instr_cnt;1380
verify-cpc-omp;10933/6;Instr_FGU_arithmetic;0;Instr_cnt;1229
./verify-cpc-omp 0.01s user 0.02s system 62% cpu 0.048 total
verify-papi-omp-correct;10934/0;Instr_FGU_arithmetic;30000;Instr_cnt;480722
verify-papi-omp-correct;10934/1;Instr_FGU_arithmetic;30000;Instr_cnt;475364
verify-papi-omp-correct;10934/2;Instr_FGU_arithmetic;30000;Instr_cnt;475373
verify-papi-omp-correct;10934/5;Instr_FGU_arithmetic;30000;Instr_cnt;475543
verify-papi-omp-correct;10934/7;Instr_FGU_arithmetic;30000;Instr_cnt;475930
verify-papi-omp-correct;10934/6;Instr_FGU_arithmetic;30000;Instr_cnt;475597
verify-papi-omp-correct;10934/4;Instr_FGU_arithmetic;30000;Instr_cnt;475589
verify-papi-omp-correct;10934/3;Instr_FGU_arithmetic;30000;Instr_cnt;475581
./verify-papi-omp-correct 0.02s user 0.07s system 83% cpu 0.108 total
verify-cpc-omp-correct;10935/0;Instr_FGU_arithmetic;30000;Instr_cnt;478176
verify-cpc-omp-correct;10935/5;Instr_FGU_arithmetic;30000;Instr_cnt;475258
verify-cpc-omp-correct;10935/6;Instr_FGU_arithmetic;30000;Instr_cnt;475623
verify-cpc-omp-correct;10935/2;Instr_FGU_arithmetic;30000;Instr_cnt;475258
verify-cpc-omp-correct;10935/4;Instr_FGU_arithmetic;30000;Instr_cnt;475579
verify-cpc-omp-correct;10935/3;Instr_FGU_arithmetic;30000;Instr_cnt;475308
verify-cpc-omp-correct;10935/7;Instr_FGU_arithmetic;30000;Instr_cnt;475515
verify-cpc-omp-correct;10935/1;Instr_FGU_arithmetic;30000;Instr_cnt;475477
./verify-cpc-omp-correct 0.01s user 0.02s system 62% cpu 0.048 total
verify-papi-omp-datarace;10936/0;Instr_FGU_arithmetic;30000;Instr_cnt;626422
102
verify-papi-omp-datarace;10936/2;Instr_FGU_arithmetic;29901;Instr_cnt;621908
verify-papi-omp-datarace;10936/1;Instr_FGU_arithmetic;29935;Instr_cnt;621147
verify-papi-omp-datarace;10936/3;Instr_FGU_arithmetic;29950;Instr_cnt;621094
verify-papi-omp-datarace;10936/7;Instr_FGU_arithmetic;29907;Instr_cnt;621035
verify-papi-omp-datarace;10936/4;Instr_FGU_arithmetic;29909;Instr_cnt;621251
verify-papi-omp-datarace;10936/6;Instr_FGU_arithmetic;29911;Instr_cnt;621023
verify-papi-omp-datarace;10936/5;Instr_FGU_arithmetic;29882;Instr_cnt;621046
./verify-papi-omp-datarace 0.03s user 0.08s system 98% cpu 0.111 total
verify-cpc-omp-datarace;10937/0;Instr_FGU_arithmetic;30000;Instr_cnt;623924
verify-cpc-omp-datarace;10937/2;Instr_FGU_arithmetic;29888;Instr_cnt;620974
verify-cpc-omp-datarace;10937/4;Instr_FGU_arithmetic;29883;Instr_cnt;620977
verify-cpc-omp-datarace;10937/7;Instr_FGU_arithmetic;29884;Instr_cnt;621230
verify-cpc-omp-datarace;10937/1;Instr_FGU_arithmetic;29852;Instr_cnt;620978
verify-cpc-omp-datarace;10937/6;Instr_FGU_arithmetic;29833;Instr_cnt;620943
verify-cpc-omp-datarace;10937/3;Instr_FGU_arithmetic;29834;Instr_cnt;620968
verify-cpc-omp-datarace;10937/5;Instr_FGU_arithmetic;29828;Instr_cnt;621245
./verify-cpc-omp-datarace 0.02s user 0.02s system 80% cpu 0.049 total
# Multi-threaded with 16 threads, 2 threads/FGU using SUNW_MP_PROCBIND
verify-papi-omp;10938/4;Instr_FGU_arithmetic;0;Instr_cnt;6093
verify-papi-omp;10938/0;Instr_FGU_arithmetic;30000;Instr_cnt;636558
verify-papi-omp;10938/5;Instr_FGU_arithmetic;0;Instr_cnt;3088
verify-papi-omp;10938/9;Instr_FGU_arithmetic;0;Instr_cnt;1741
verify-papi-omp;10938/8;Instr_FGU_arithmetic;0;Instr_cnt;2647
verify-papi-omp;10938/1;Instr_FGU_arithmetic;0;Instr_cnt;1696
verify-papi-omp;10938/2;Instr_FGU_arithmetic;0;Instr_cnt;1905
verify-papi-omp;10938/10;Instr_FGU_arithmetic;0;Instr_cnt;1410
verify-papi-omp;10938/13;Instr_FGU_arithmetic;0;Instr_cnt;2875
verify-papi-omp;10938/7;Instr_FGU_arithmetic;0;Instr_cnt;2578
verify-papi-omp;10938/15;Instr_FGU_arithmetic;0;Instr_cnt;4314
verify-papi-omp;10938/6;Instr_FGU_arithmetic;0;Instr_cnt;2177
verify-papi-omp;10938/14;Instr_FGU_arithmetic;0;Instr_cnt;1392
verify-papi-omp;10938/12;Instr_FGU_arithmetic;0;Instr_cnt;1393
verify-papi-omp;10938/3;Instr_FGU_arithmetic;0;Instr_cnt;2040
verify-papi-omp;10938/11;Instr_FGU_arithmetic;0;Instr_cnt;3973
./verify-papi-omp 0.02s user 0.08s system 89% cpu 0.111 total
verify-cpc-omp;10939/2;Instr_FGU_arithmetic;0;Instr_cnt;2491
verify-cpc-omp;10939/8;Instr_FGU_arithmetic;0;Instr_cnt;2748
verify-cpc-omp;10939/12;Instr_FGU_arithmetic;0;Instr_cnt;3632
verify-cpc-omp;10939/10;Instr_FGU_arithmetic;0;Instr_cnt;1496
verify-cpc-omp;10939/3;Instr_FGU_arithmetic;0;Instr_cnt;2735
verify-cpc-omp;10939/7;Instr_FGU_arithmetic;0;Instr_cnt;2330
verify-cpc-omp;10939/9;Instr_FGU_arithmetic;0;Instr_cnt;2591
verify-cpc-omp;10939/15;Instr_FGU_arithmetic;0;Instr_cnt;2890
verify-cpc-omp;10939/6;Instr_FGU_arithmetic;0;Instr_cnt;4333
103
F Output of a Verification Run
verify-cpc-omp;10939/1;Instr_FGU_arithmetic;0;Instr_cnt;2543
verify-cpc-omp;10939/4;Instr_FGU_arithmetic;0;Instr_cnt;2333
verify-cpc-omp;10939/0;Instr_FGU_arithmetic;30000;Instr_cnt;634549
verify-cpc-omp;10939/14;Instr_FGU_arithmetic;0;Instr_cnt;3353
verify-cpc-omp;10939/5;Instr_FGU_arithmetic;0;Instr_cnt;6412
verify-cpc-omp;10939/11;Instr_FGU_arithmetic;0;Instr_cnt;1797
verify-cpc-omp;10939/13;Instr_FGU_arithmetic;0;Instr_cnt;7468
./verify-cpc-omp 0.02s user 0.02s system 80% cpu 0.050 total
verify-papi-omp-correct;10940/0;Instr_FGU_arithmetic;30000;Instr_cnt;480722
verify-papi-omp-correct;10940/1;Instr_FGU_arithmetic;30000;Instr_cnt;475414
verify-papi-omp-correct;10940/2;Instr_FGU_arithmetic;30000;Instr_cnt;475657
verify-papi-omp-correct;10940/12;Instr_FGU_arithmetic;30000;Instr_cnt;475414
verify-papi-omp-correct;10940/8;Instr_FGU_arithmetic;30000;Instr_cnt;475431
verify-papi-omp-correct;10940/10;Instr_FGU_arithmetic;30000;Instr_cnt;475364
verify-papi-omp-correct;10940/11;Instr_FGU_arithmetic;30000;Instr_cnt;475381
verify-papi-omp-correct;10940/4;Instr_FGU_arithmetic;30000;Instr_cnt;475381
verify-papi-omp-correct;10940/14;Instr_FGU_arithmetic;30000;Instr_cnt;475364
verify-papi-omp-correct;10940/15;Instr_FGU_arithmetic;30000;Instr_cnt;475414
verify-papi-omp-correct;10940/7;Instr_FGU_arithmetic;30000;Instr_cnt;485188
verify-papi-omp-correct;10940/9;Instr_FGU_arithmetic;30000;Instr_cnt;475649
verify-papi-omp-correct;10940/13;Instr_FGU_arithmetic;30000;Instr_cnt;475813
verify-papi-omp-correct;10940/3;Instr_FGU_arithmetic;30000;Instr_cnt;475776
verify-papi-omp-correct;10940/5;Instr_FGU_arithmetic;30000;Instr_cnt;475739
verify-papi-omp-correct;10940/6;Instr_FGU_arithmetic;30000;Instr_cnt;475885
./verify-papi-omp-correct 0.03s user 0.08s system 100% cpu 0.109 total
verify-cpc-omp-correct;10941/0;Instr_FGU_arithmetic;30000;Instr_cnt;478176
verify-cpc-omp-correct;10941/1;Instr_FGU_arithmetic;30000;Instr_cnt;475258
verify-cpc-omp-correct;10941/5;Instr_FGU_arithmetic;30000;Instr_cnt;477513
verify-cpc-omp-correct;10941/8;Instr_FGU_arithmetic;30000;Instr_cnt;475317
verify-cpc-omp-correct;10941/11;Instr_FGU_arithmetic;30000;Instr_cnt;480548
verify-cpc-omp-correct;10941/10;Instr_FGU_arithmetic;30000;Instr_cnt;475512
verify-cpc-omp-correct;10941/7;Instr_FGU_arithmetic;30000;Instr_cnt;477565
verify-cpc-omp-correct;10941/12;Instr_FGU_arithmetic;30000;Instr_cnt;475543
verify-cpc-omp-correct;10941/15;Instr_FGU_arithmetic;30000;Instr_cnt;475493
verify-cpc-omp-correct;10941/2;Instr_FGU_arithmetic;30000;Instr_cnt;479592
verify-cpc-omp-correct;10941/4;Instr_FGU_arithmetic;30000;Instr_cnt;477142
verify-cpc-omp-correct;10941/3;Instr_FGU_arithmetic;30000;Instr_cnt;480957
verify-cpc-omp-correct;10941/9;Instr_FGU_arithmetic;30000;Instr_cnt;475453
verify-cpc-omp-correct;10941/14;Instr_FGU_arithmetic;30000;Instr_cnt;475630
verify-cpc-omp-correct;10941/13;Instr_FGU_arithmetic;30000;Instr_cnt;475675
verify-cpc-omp-correct;10941/6;Instr_FGU_arithmetic;30000;Instr_cnt;475769
./verify-cpc-omp-correct 0.03s user 0.02s system 93% cpu 0.054 total
verify-papi-omp-datarace;10942/0;Instr_FGU_arithmetic;30000;Instr_cnt;626422
verify-papi-omp-datarace;10942/1;Instr_FGU_arithmetic;29973;Instr_cnt;621657
104
verify-papi-omp-datarace;10942/5;Instr_FGU_arithmetic;29987;Instr_cnt;621048
verify-papi-omp-datarace;10942/10;Instr_FGU_arithmetic;30000;Instr_cnt;621120
verify-papi-omp-datarace;10942/2;Instr_FGU_arithmetic;29976;Instr_cnt;621037
verify-papi-omp-datarace;10942/3;Instr_FGU_arithmetic;29981;Instr_cnt;621042
verify-papi-omp-datarace;10942/6;Instr_FGU_arithmetic;29994;Instr_cnt;621152
verify-papi-omp-datarace;10942/4;Instr_FGU_arithmetic;29999;Instr_cnt;621571
verify-papi-omp-datarace;10942/11;Instr_FGU_arithmetic;29975;Instr_cnt;621257
verify-papi-omp-datarace;10942/15;Instr_FGU_arithmetic;30000;Instr_cnt;621649
verify-papi-omp-datarace;10942/8;Instr_FGU_arithmetic;29998;Instr_cnt;621310
verify-papi-omp-datarace;10942/9;Instr_FGU_arithmetic;29998;Instr_cnt;621600
verify-papi-omp-datarace;10942/13;Instr_FGU_arithmetic;29979;Instr_cnt;621040
verify-papi-omp-datarace;10942/12;Instr_FGU_arithmetic;30000;Instr_cnt;621383
verify-papi-omp-datarace;10942/14;Instr_FGU_arithmetic;30000;Instr_cnt;621278
verify-papi-omp-datarace;10942/7;Instr_FGU_arithmetic;30000;Instr_cnt;621431
./verify-papi-omp-datarace 0.05s user 0.08s system 114% cpu 0.113 total
verify-cpc-omp-datarace;10943/0;Instr_FGU_arithmetic;30000;Instr_cnt;623924
verify-cpc-omp-datarace;10943/1;Instr_FGU_arithmetic;29998;Instr_cnt;620945
verify-cpc-omp-datarace;10943/5;Instr_FGU_arithmetic;30000;Instr_cnt;622802
verify-cpc-omp-datarace;10943/4;Instr_FGU_arithmetic;29995;Instr_cnt;624968
verify-cpc-omp-datarace;10943/2;Instr_FGU_arithmetic;29995;Instr_cnt;620996
verify-cpc-omp-datarace;10943/10;Instr_FGU_arithmetic;29998;Instr_cnt;626406
verify-cpc-omp-datarace;10943/6;Instr_FGU_arithmetic;29998;Instr_cnt;621208
verify-cpc-omp-datarace;10943/14;Instr_FGU_arithmetic;30000;Instr_cnt;621154
verify-cpc-omp-datarace;10943/8;Instr_FGU_arithmetic;29998;Instr_cnt;622118
verify-cpc-omp-datarace;10943/3;Instr_FGU_arithmetic;30000;Instr_cnt;621203
verify-cpc-omp-datarace;10943/11;Instr_FGU_arithmetic;29998;Instr_cnt;621850
verify-cpc-omp-datarace;10943/9;Instr_FGU_arithmetic;29998;Instr_cnt;621543
verify-cpc-omp-datarace;10943/13;Instr_FGU_arithmetic;30000;Instr_cnt;621324
verify-cpc-omp-datarace;10943/15;Instr_FGU_arithmetic;30000;Instr_cnt;621260
verify-cpc-omp-datarace;10943/12;Instr_FGU_arithmetic;29998;Instr_cnt;621523
verify-cpc-omp-datarace;10943/7;Instr_FGU_arithmetic;30000;Instr_cnt;621294
./verify-cpc-omp-datarace 0.04s user 0.02s system 115% cpu 0.052 total
# Multi-threaded with 16 threads, unbound/non-deterministic
verify-papi-omp;10944/11;Instr_FGU_arithmetic;0;Instr_cnt;1972
verify-papi-omp;10944/6;Instr_FGU_arithmetic;0;Instr_cnt;1494
verify-papi-omp;10944/7;Instr_FGU_arithmetic;0;Instr_cnt;2971
verify-papi-omp;10944/15;Instr_FGU_arithmetic;0;Instr_cnt;1352
verify-papi-omp;10944/8;Instr_FGU_arithmetic;0;Instr_cnt;2732
verify-papi-omp;10944/10;Instr_FGU_arithmetic;0;Instr_cnt;7038
verify-papi-omp;10944/14;Instr_FGU_arithmetic;0;Instr_cnt;1518
verify-papi-omp;10944/13;Instr_FGU_arithmetic;0;Instr_cnt;1557
verify-papi-omp;10944/9;Instr_FGU_arithmetic;0;Instr_cnt;2616
verify-papi-omp;10944/4;Instr_FGU_arithmetic;0;Instr_cnt;2648
verify-papi-omp;10944/2;Instr_FGU_arithmetic;0;Instr_cnt;10253
105
F Output of a Verification Run
verify-papi-omp;10944/0;Instr_FGU_arithmetic;30000;Instr_cnt;624943
verify-papi-omp;10944/3;Instr_FGU_arithmetic;0;Instr_cnt;1776
verify-papi-omp;10944/1;Instr_FGU_arithmetic;0;Instr_cnt;3401
verify-papi-omp;10944/12;Instr_FGU_arithmetic;0;Instr_cnt;2918
verify-papi-omp;10944/5;Instr_FGU_arithmetic;0;Instr_cnt;1558
./verify-papi-omp 0.02s user 0.08s system 90% cpu 0.111 total
verify-cpc-omp;10945/1;Instr_FGU_arithmetic;0;Instr_cnt;2506
verify-cpc-omp;10945/12;Instr_FGU_arithmetic;0;Instr_cnt;1530
verify-cpc-omp;10945/3;Instr_FGU_arithmetic;0;Instr_cnt;8729
verify-cpc-omp;10945/13;Instr_FGU_arithmetic;0;Instr_cnt;1447
verify-cpc-omp;10945/9;Instr_FGU_arithmetic;0;Instr_cnt;1648
verify-cpc-omp;10945/10;Instr_FGU_arithmetic;0;Instr_cnt;2955
verify-cpc-omp;10945/5;Instr_FGU_arithmetic;0;Instr_cnt;8147
verify-cpc-omp;10945/11;Instr_FGU_arithmetic;0;Instr_cnt;4633
verify-cpc-omp;10945/4;Instr_FGU_arithmetic;0;Instr_cnt;1690
verify-cpc-omp;10945/7;Instr_FGU_arithmetic;0;Instr_cnt;1229
verify-cpc-omp;10945/0;Instr_FGU_arithmetic;30000;Instr_cnt;623964
verify-cpc-omp;10945/2;Instr_FGU_arithmetic;0;Instr_cnt;2148
verify-cpc-omp;10945/15;Instr_FGU_arithmetic;0;Instr_cnt;2115
verify-cpc-omp;10945/14;Instr_FGU_arithmetic;0;Instr_cnt;1658
verify-cpc-omp;10945/6;Instr_FGU_arithmetic;0;Instr_cnt;2489
verify-cpc-omp;10945/8;Instr_FGU_arithmetic;0;Instr_cnt;18792
./verify-cpc-omp 0.02s user 0.02s system 82% cpu 0.048 total
verify-papi-omp-correct;10946/13;Instr_FGU_arithmetic;30000;Instr_cnt;475506
verify-papi-omp-correct;10946/4;Instr_FGU_arithmetic;30000;Instr_cnt;475613
verify-papi-omp-correct;10946/1;Instr_FGU_arithmetic;30000;Instr_cnt;475605
verify-papi-omp-correct;10946/11;Instr_FGU_arithmetic;30000;Instr_cnt;475615
verify-papi-omp-correct;10946/12;Instr_FGU_arithmetic;30000;Instr_cnt;475597
verify-papi-omp-correct;10946/9;Instr_FGU_arithmetic;30000;Instr_cnt;476989
verify-papi-omp-correct;10946/10;Instr_FGU_arithmetic;30000;Instr_cnt;475364
verify-papi-omp-correct;10946/15;Instr_FGU_arithmetic;30000;Instr_cnt;481704
verify-papi-omp-correct;10946/6;Instr_FGU_arithmetic;30000;Instr_cnt;475364
verify-papi-omp-correct;10946/14;Instr_FGU_arithmetic;30000;Instr_cnt;475851
verify-papi-omp-correct;10946/3;Instr_FGU_arithmetic;30000;Instr_cnt;475364
verify-papi-omp-correct;10946/7;Instr_FGU_arithmetic;30000;Instr_cnt;476125
verify-papi-omp-correct;10946/2;Instr_FGU_arithmetic;30000;Instr_cnt;475431
verify-papi-omp-correct;10946/8;Instr_FGU_arithmetic;30000;Instr_cnt;475589
verify-papi-omp-correct;10946/5;Instr_FGU_arithmetic;30000;Instr_cnt;475572
verify-papi-omp-correct;10946/0;Instr_FGU_arithmetic;30000;Instr_cnt;480658
./verify-papi-omp-correct 0.03s user 0.08s system 103% cpu 0.106 total
verify-cpc-omp-correct;10947/6;Instr_FGU_arithmetic;30000;Instr_cnt;482387
verify-cpc-omp-correct;10947/9;Instr_FGU_arithmetic;30000;Instr_cnt;475696
verify-cpc-omp-correct;10947/3;Instr_FGU_arithmetic;30000;Instr_cnt;476374
verify-cpc-omp-correct;10947/11;Instr_FGU_arithmetic;30000;Instr_cnt;475673
106
verify-cpc-omp-correct;10947/8;Instr_FGU_arithmetic;30000;Instr_cnt;475633
verify-cpc-omp-correct;10947/4;Instr_FGU_arithmetic;30000;Instr_cnt;477608
verify-cpc-omp-correct;10947/0;Instr_FGU_arithmetic;30000;Instr_cnt;475647
verify-cpc-omp-correct;10947/14;Instr_FGU_arithmetic;30000;Instr_cnt;476391
verify-cpc-omp-correct;10947/1;Instr_FGU_arithmetic;30000;Instr_cnt;475485
verify-cpc-omp-correct;10947/12;Instr_FGU_arithmetic;30000;Instr_cnt;479806
verify-cpc-omp-correct;10947/7;Instr_FGU_arithmetic;30000;Instr_cnt;476735
verify-cpc-omp-correct;10947/5;Instr_FGU_arithmetic;30000;Instr_cnt;479757
verify-cpc-omp-correct;10947/13;Instr_FGU_arithmetic;30000;Instr_cnt;475299
verify-cpc-omp-correct;10947/10;Instr_FGU_arithmetic;30000;Instr_cnt;476072
verify-cpc-omp-correct;10947/15;Instr_FGU_arithmetic;30000;Instr_cnt;483048
verify-cpc-omp-correct;10947/2;Instr_FGU_arithmetic;30000;Instr_cnt;478800
./verify-cpc-omp-correct 0.03s user 0.03s system 120% cpu 0.050 total
verify-papi-omp-datarace;10948/9;Instr_FGU_arithmetic;29997;Instr_cnt;623900
verify-papi-omp-datarace;10948/8;Instr_FGU_arithmetic;30000;Instr_cnt;621294
verify-papi-omp-datarace;10948/13;Instr_FGU_arithmetic;30000;Instr_cnt;621302
verify-papi-omp-datarace;10948/14;Instr_FGU_arithmetic;30000;Instr_cnt;621286
verify-papi-omp-datarace;10948/1;Instr_FGU_arithmetic;30000;Instr_cnt;621278
verify-papi-omp-datarace;10948/2;Instr_FGU_arithmetic;30000;Instr_cnt;621525
verify-papi-omp-datarace;10948/7;Instr_FGU_arithmetic;29999;Instr_cnt;621219
verify-papi-omp-datarace;10948/5;Instr_FGU_arithmetic;30000;Instr_cnt;623575
verify-papi-omp-datarace;10948/0;Instr_FGU_arithmetic;29999;Instr_cnt;623552
verify-papi-omp-datarace;10948/6;Instr_FGU_arithmetic;29995;Instr_cnt;622191
verify-papi-omp-datarace;10948/10;Instr_FGU_arithmetic;29995;Instr_cnt;621056
verify-papi-omp-datarace;10948/11;Instr_FGU_arithmetic;29994;Instr_cnt;621072
verify-papi-omp-datarace;10948/4;Instr_FGU_arithmetic;29997;Instr_cnt;621307
verify-papi-omp-datarace;10948/15;Instr_FGU_arithmetic;29996;Instr_cnt;625572
verify-papi-omp-datarace;10948/12;Instr_FGU_arithmetic;29995;Instr_cnt;623396
verify-papi-omp-datarace;10948/3;Instr_FGU_arithmetic;29995;Instr_cnt;624055
./verify-papi-omp-datarace 0.05s user 0.08s system 114% cpu 0.114 total
verify-cpc-omp-datarace;10949/3;Instr_FGU_arithmetic;29985;Instr_cnt;623696
verify-cpc-omp-datarace;10949/8;Instr_FGU_arithmetic;29970;Instr_cnt;621632
verify-cpc-omp-datarace;10949/13;Instr_FGU_arithmetic;29979;Instr_cnt;621187
verify-cpc-omp-datarace;10949/7;Instr_FGU_arithmetic;29976;Instr_cnt;620977
verify-cpc-omp-datarace;10949/0;Instr_FGU_arithmetic;29970;Instr_cnt;621401
verify-cpc-omp-datarace;10949/5;Instr_FGU_arithmetic;29967;Instr_cnt;621242
verify-cpc-omp-datarace;10949/11;Instr_FGU_arithmetic;29956;Instr_cnt;621152
verify-cpc-omp-datarace;10949/10;Instr_FGU_arithmetic;29963;Instr_cnt;621124
verify-cpc-omp-datarace;10949/1;Instr_FGU_arithmetic;29973;Instr_cnt;621192
verify-cpc-omp-datarace;10949/6;Instr_FGU_arithmetic;29958;Instr_cnt;621131
verify-cpc-omp-datarace;10949/15;Instr_FGU_arithmetic;29968;Instr_cnt;624453
verify-cpc-omp-datarace;10949/14;Instr_FGU_arithmetic;29958;Instr_cnt;623380
verify-cpc-omp-datarace;10949/4;Instr_FGU_arithmetic;29992;Instr_cnt;623533
verify-cpc-omp-datarace;10949/9;Instr_FGU_arithmetic;29953;Instr_cnt;620904
107
F Output of a Verification Run
verify-cpc-omp-datarace;10949/12;Instr_FGU_arithmetic;29997;Instr_cnt;621211
verify-cpc-omp-datarace;10949/2;Instr_FGU_arithmetic;29990;Instr_cnt;626320
./verify-cpc-omp-datarace 0.05s user 0.03s system 145% cpu 0.055 total
108
Bibliography
Bibliography
[aMST+ 09] Dieter an Mey, Smauel Sarholz, Christian Terboven, Ruud van der Pas,
and Eugene Loh. The RWTH Compute Cluster User’s Guide — Version 6.5.1. Center for Computing and Communication, RWTH Aachen
University, 2009. Online access at http://www.rz.rwth-aachen.de/
global/show_document.asp?id=aaaaaaaaaabsuhv on 2009-04-13.
[aMT07]
Dieter an Mey and Christian Terboven. The UltraSPARC T2 (Niagara
2) Processor, 2007. Online access at http://www.rz.rwth-aachen.de/
ca/k/raw/?lang=en on 2009-09-02.
[CSG99]
David E. Culler, Jaswinder Pal Singh, and Anoop Gupta. Parallel Computer Architecture — A Hardware/Software Approach. Morgan Kaufmann, San Francisco, United States of America, 1999.
[FZJ09]
Forschungszentrum Jülich. Scalasca 1.2 — User Guide, 2009. Online access at http://www.fz-juelich.de/jsc/datapool/scalasca/
scalasca-1.2.tar.gz on 2009-08-31.
[GGKK03] Ananth Grama, Anshul Gupta, George Karypis, and Vipin Kumar. Introduction to Parallel Computing. Addison-Wesley, Harlow, England,
second edition, 2003.
[Gov07]
Darryl Gove. Calculating Processor Utiliziation From the UltraSPARC
T1 and UltraSPARC T2 Performance Counters. In Darryl Gove, editor, The Developer’s Edge — Selected Blog Posts and Articles, pages
108 – 114. Sun Microsystems Inc., 2007. Online available at http://
developers.sun.com/solaris/articles/t1t2_perf_counter.html.
[Gov08]
Darryl Gove. Solaris Application Programming. Prentice Hall International, Upper Saddle River, United States of America, 2008.
[GWT07]
GWT-TUD GmbH. Vampir 5.2 User Manual, 2007. Online access at http://www.lrz-muenchen.de/services/software/parallel/
vampir_ng/Manual-GUI-5_2.pdf on 2009-08-30.
[GWT08]
GWT-TUD GmbH. VampirServer, 2008. Online access at http://www.
vampir.eu/flyer/vampirserver_SC2008.pdf on 2009-08-30.
109
Bibliography
[Has09]
Jon Haslam. Performance counter generic events. Blog Post, Februrary 2009. Online access at http://blogs.sun.com/jonh/entry/
performance_counter_generic_events on 2009-08-12.
[HP06]
John L. Hennessy and David A. Patterson. Computer Architecture — A
Quantitative Approach. Morgan Kaufmann, San Francisco, United States
of America, fourth edition, 2006.
[Im00]
Eun-Jin Im. Optimizing the Performance of Sparse Matrix-Vector Multiplication. PhD thesis, EECS Department, University of California, Berkeley, 2000. Online access at http://www.eecs.berkeley.edu/Pubs/
TechRpts/2000/5556.html on 2009-09-03.
[MED09]
David MacKenzie, Ben Elliston, and Akim Demaille. Autoconf — Creating Automatic Configuration Scripts, 2009. Online access at http://www.
gnu.org/software/autoconf/manual/autoconf.pdf on 2009-08-17.
[MM06]
Richard McDougall and Jim Mauro. Solaris Internals — Solaris 10 and
OpenSolaris Kernel Architecture. Prentice Hall International, Upper Saddle River, United States of America, second edition, 2006.
[MMG06]
Richard McDougall, Jim Mauro, and Brendan Gregg. Solaris Performance and Tools — DTrace and MDB Techniques for Solaris 10 and
OpenSolaris. Prentice Hall International, Upper Saddle River, United
States of America, 2006.
[NS07]
Nils Smeds. A PAPI Implementation for BlueGene. In Applied Parallel
Computing. State of the Art in Scientific Computing, volume 4699/2009,
pages 1036 – 1044. Springer-Verlag, Berlin, Germany, 2007.
[OSM09]
generic events/3cpc. In OpenSolaris Manual Pages, volume 2009-07-08.
Sun Microsystems Inc., 2009. Complete tar ball available at http://
dlc.sun.com/osol/man/downloads/current/, accessed on 2009-08-23.
[PPR]
PAPI Programmer’s Reference — Version 3.6.0. Online access at
http://icl.cs.utk.edu/projects/papi/files/documentation/
PAPI_Prog_Ref.pdf on 2009-04-13.
[PUG]
PAPI User’s Guide — Version 3.5.0.
Online access
http://icl.cs.utk.edu/projects/papi/files/documentation/
PAPI_USER_GUIDE.pdf on 2009-04-13.
[Sun07a]
Sun Microsystems Inc. OpenSPARC T2 Core Microarchitecture Specification, 2007. Online access at https://www.opensparc.net/pubs/
t2/docs/OpenSPARCT2_Core_Micro_Arch.pdf on 2009-04-13, Sun Part
Number: 820-2545-11.
[Sun07b]
Sun Microsystems Inc. Sun Studio 12: Performance Analyzer, 2007.
110
at
Bibliography
Online access at http://dlc.sun.com/pdf/819-5264/819-5264.pdf on
2009-04-13, Sun Part Number: 819-5264.
[Sun07c]
Sun Microsystems Inc.
UltraSPARC T2 Supplement to the UltraSPARC Architecture 2007 — Hyperprivileged Edition, 2007.
Online access at http://opensparc-t2.sunsource.net/specs/
UST2-UASuppl-current-draft-HP-EXT.pdf on 2009-04-13, Sun Part
Number: 950-5556-02.
[Sun08a]
Sun Microsystems Inc.
OpenSPARC T2 System-on-Chip Microarchitecture Specification Part 1 of 2, 2008. Online access at
https://www.opensparc.net/pubs/t2/docs/OpenSPARCT2_SoC_
Micro_Arch_Vol1.pdf on 2009-07-25, Sun Part Number: 820-2620-10.
[Sun08b]
Sun Microsystems Inc. Solaris 10 Reference Manual Collection, 2008.
Online access at http://docs.sun.com/app/docs/coll/40.10 on 200908-31.
[Sun08c]
Sun Microsystems Inc. Solaris 10 Reference Manual Collection —
man pages section 3: Extended Library Functions, 2008. Online access
at http://docs.sun.com/app/docs/doc/816-5172 on 2009-08-31, Sun
Part Number: 816-5172-13 — PDF file broken, therefore only online as
HTML accessible.
[Sun08d]
Sun Microsystems Inc. Solaris 10 Reference Manual Collection — man
pages section 3: Library Interfaces and Headers, 2008. Online access
at http://docs.sun.com/app/docs/doc/816-5173 on 2009-05-02, Sun
Part Number: 816-5173-13.
[Sun08e]
Sun Microsystems Inc. UltraSPARC Architecture 2007 — Hyperprivileged
Edition, 2008. Online access at http://opensparc-t2.sunsource.net/
specs/UA2007-current-draft-HP-EXT.pdf on 2009-04-13, Sun Part
Number: 950-5553-12.
[TUD09]
TU Dresden ZIH. VampirTrace 5.7 User Manual, 2009. Online access at
http://tu-dresden.de/die_tu_dresden/zentrale_einrichtungen/
zih/forschung/software_werkzeuge_zur_unterstuetzung_
von_programmierung_und_optimierung/vampirtrace/dateien/
VT-UserManual-5.7.pdf on 2009-08-31.
111