1
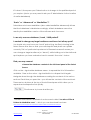
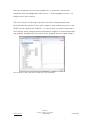
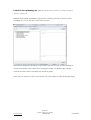
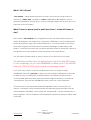
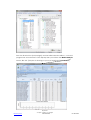
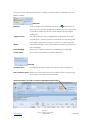
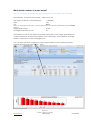
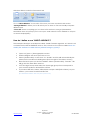
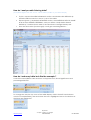
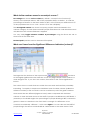
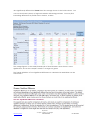
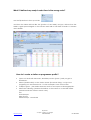
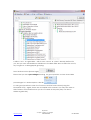
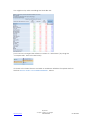
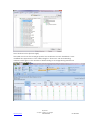
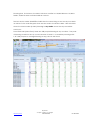
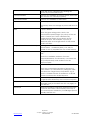
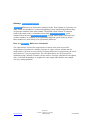
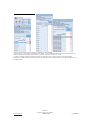
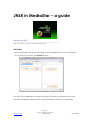
JNLR in MediaStar – a guide
Revised July 2015
---------------------------------------------------------------------------------There is a Glossary of Terms at the end of this document
Start here
Open the program by double-clicking on the MediaStar icon on your desktop
. This is what you will see. The Select Screen.
The title of the database you see in the Select Screen should reflect the most
recently available published data (April 2014-March 2015 in this example).
Espri DMC
analysis : insights : strategies
www.espri.ie
087 2256562
01 2841005
If it doesn’t, then press your Folders button to change to the published period
you require.1 (Note: you may need to ask your IT Administrator for the location
of earlier databases)
“Basic” or “Advanced” or “MediaStar+”?
Subscribers who have MediaStar+ (also called MediaStar Advanced) will see
that their database is labelled accordingly. A Basic database cannot be
read by the MediaStar+ version of the software and vice versa.
I can only see one database / book / JNLR period?
I wanted to change my target audience and have lost all my spots?
You should only ever have one “book” period (e.g Jan-Dec) showing in the
Select Screen at a time so that your saved reports and plans can update
correctly. This is of particular importance to Planners because it means you
can change a target audience (or “demo”) while holding on to the stations &
spot laydown you have worked so hard to create! See note 1. below
Find your way around
O Browse
the database contents in the left-hand panel of the Select
Screen
Click on the + sign beside database name to expand the list of information
available. Press on the minus – sign beside this to collapse the list again.
Navigate down through the database revealing the contents of the various
sections. Each time you press the + you will see the contents of the next level.
There are two buttons at the top of the left-hand pane which allow you to
expand and collapse the lists quickly.
Give these a try to see what they do
1
Detailed information is available in a document called “Location of Files &
Folders for MediaStar users” – which you can download from here
http://www.espri.ie/support-docs/location-of-files-folders-for-mediastar-users.pdf
Espri DMC
analysis : insights : strategies
www.espri.ie
087 2256562
01 2841005
The next screenshot shows what happens if you press the + beside the
database name (highlighted in blue), then + on Demographics, then + on
Region down the last level.
This shows what’s in the Region question, and how many people were
interviewed in this period in the various regions. Any number you see on the
SELECT screen reflects the SAMPLE - i.e. the number of people interviewed
who fall into each category before population weights or Universe Estimates
are applied. (Weighting is automatic and is applied at the run/plan stage.)
(No analysis or plan selections made yet in this example)
Espri DMC
analysis : insights : strategies
www.espri.ie
087 2256562
01 2841005
O
Double-click or drag and drop to build your analysis in the right-
hand panel
Double click on a question or variable denoted by the little folder symbol
or a
(in the station planning section) and that item will appear in
the middle pane on the right-hand side of your Select Screen and form part
of your run or analysis. You can also drag and drop.
DO: bring over the entire contents of the question you are interested in –
not just bits - or your percentages may not be correct. When you get onto
the planning/analysis screen you will find a variety of methods for hiding
the rows or columns that are surplus to requirements
DON’T: double-click on a section heading – if this happens use the Clear All
button and start again.
Press the + beside a question to get down to the lowest level and find the
item(s) that describe your chosen audience, like this (opened out Social
Groups – Household and double-clicked ABC1)
Press
Press Clear all
to create the media plan
at the top right of the Select Screen to get rid of
these selections
Espri DMC
analysis : insights : strategies
www.espri.ie
087 2256562
01 2841005
I want to do a planning run (a.k.a. media analysis, schedule, coverage & frequency
analysis, package run)
Expand the STATION PLANNING list (press the +) which is the last of the five main
headings you see on the left of the Select Screen
All National, Regional & Dublin & Cork stations are here as well as each individual
Home Local Station, plus sales house offerings from IRS, UTV Radio Sales, Media
Central and the station Communicorp 6 station group.
There are two versions of the “run of week” for each station or sales house grouping.
Espri DMC
analysis : insights : strategies
www.espri.ie
087 2256562
01 2841005
What’s TAP & Prime?
“TAP & Prime..” allows quick laydown of a week’s spots for the chosen station or
stations for a Prime Time package or a TAP Total Audience Package for each of
Weekday, Saturday & Sunday (e.g a 14-spot package would have 10 spots M-F, 2 on
Saturday and 2 on Sunday).
What if I want to place spots in particular shows / at specific times of
day?
Each station’s full schedule list of programmes/shows are shown further down the
Station Planning list. This means that, for instance, RTE Radio 1 can be evaluated for
Reach & Frequency using “TAP & Prime RTE Radio 1” or in more detail on a show by
show basis using the axis further down the Station Planning List called simply “RTE
Radio1”. Note that the shows are not shown with their names or presenters’ names as
not all shows run every weekday at the same time in the same format.
You can select (double-click) as many of these as you need to run your plan.
The planning module works by taking a set of inputs for the FIRST week
in your campaign, so you must REMEMBER to divide your TOTAL BUDGET
and your TOTAL SPOTS by the number of campaign weeks!
If you’re in a hurry and can find an Audience that suits your purpose in KEY
AUDIENCES, select this (only one) or add your own audience definition(s). These can
be built up from a combination of different items from different questions and is
covered a little later in this document (see Define Target Audience). I’ve selected
“Housekeeper” from the KEY AUDIENCES section at the top of the database.
Go back down to the expanded STATION PLANNING section and choose your
stations . Your Select screen should look like this reflecting a plan that will cover the
national stations RTE Radio 1, 2FM, Today FM and Newstalk – for the summary TAP or
Prime segments - with an audience of housekeepers (defined as shoppers either male
or female).
Espri DMC
analysis : insights : strategies
www.espri.ie
087 2256562
01 2841005
Press the Plan button (bottom right) and the initial selection will run – note red
progress bar at bottom left of the display then you will see the Media Analysis
screen, like this. (This plan is showing no spots yet and therefore no results)
Espri DMC
analysis : insights : strategies
www.espri.ie
087 2256562
01 2841005
You may see a lot more columns than are showing in this example. At the very least,
you must show Spots, Target Group Reach & Audience. From the wide selection
available, you can hide the ones you don’t want by highlighting a column and
pressing “Hide …” (item in the Hiding item on the Home ribbon)
Next you need to add spots – for week one.
Put in an optional total package cost (for one week) in the white cell under “€Total”.
(Remember divide total package value and the number of spots by number of
weeks). Alternately you may use spot rates and enter a value in the “€each” column
against each day part or programme slot you have selected.
Calculate the plan
To do this, press Net Reach
(top left of your screen – just under the “Home tab”). I have laid down a standard 14spot Prime Time package against each station and this what the screen looks like
after the Net Reach button has been pressed to calculate the plan
Espri DMC
analysis : insights : strategies
www.espri.ie
087 2256562
01 2841005
Once you have calculated the plan, a variety of other options is available from the
ribbon toolbar:
Table tab
Ranking
click on Target Group Reach and then the
Rank button to
show the most popular programmes/times of day in order; click
on Audience 000s and do the same thing to get the largest
audiences
Suppress Zeros
use this to hide the rows (programmes or dayparts) that don’t
contain spots – makes it easier to see what you are doing and
for a tidier page when you print or copy for a client proposal
Weeks
calculates the plan across the number of weeks you specify for
the campaign
Insert Heading
allows you to add to some text describing the Campaign
Freeze Panes
does what it says based on current selection
View tab
Summary View
contribution of each station in the plan to the overall result
plan summary report when you have more than one run done in the current session
and want to see which is most suitable
Increase number of weeks to reflect campaign duration here.
Espri DMC
analysis : insights : strategies
www.espri.ie
087 2256562
01 2841005
What do the numbers in a plan mean?
(Refer to the Glossary for more information and details on how the figures are calculated)
This example - shown for three weeks - tells us that the
Net target audience of Housekeepers
GRPs
CPT
1,736(000)
464
€6.30
based on an (imaginary) per-week cost of €25,000 added to the optional editable field under the € Total
heading.
target group reach
Average Frequency or OTH
67.6%
6.9
Translated into words, this means that more than 2/3rds of the target (Housekeeper)
audience will hear at least one instance of this campaign, and overall the average
will be 6.9 exposures to the campaign spots
You can also see what contribution each station makes to the overall pressing by
pressing the Summary View button - here
Espri DMC
analysis : insights : strategies
www.espri.ie
087 2256562
01 2841005
You can save this plan as an image using the Windows Snipping Tool or by using
generic copy & paste commands to copy into Word, Excel or a PowerPoint slide.
You can also save it as an interactive PLN file (see Location of Files & Folders for notes
and tips on saving re-usable plans & reports). This feature allows for the creation of
template plans that can be updated to reflect the updated figures from wave to
wave and also modified to reflect new audiences etc as required. (Contact us for
training on this feature.)
How do I modify the audience or add stations (without losing my
spots!)?
Still in the planning (Media Analysis) screen …go to the Select tab
Click on the
little down arrow to the sub-menu which offers you two options “Select” and “Show
Selections”.
Clicking on the “Show Selections” button allows you to change your audience
without losing your spot laydown.
This brings you back to the Select Screen and will display your original selections and
allows changes to the audience definition and inclusion of additional stations into an
existing plan if needed, without losing the spots that you have already entered. You
will have to put in a new campaign cost if you need one as the programme assumes
if you are changing spots and stations that the budget will probably change too.
How do I get back to the Select Screen to do something else?
Select File, Show Selections option – especially if you want to re-run your current
analysis with just a few things changed
button
Press the
Just don’t “x” it closed! You can return to the various analyses and pages you have
created for the duration of a session. See next topic.
How do I get back to a plan or table I ran earlier ?
Do not use the X at the top right of the screen to close what you are doing so you
can “get at” the next thing. All your runs in this session are accessible via the
Espri DMC
analysis : insights : strategies
www.espri.ie
087 2256562
01 2841005
Windows ribbon under the Document tab
Go to “Switch Window” to see a list of the runs you have created in this session
“Arrange Window” allows you to tile what you’ve done so far and visually compare
different runs
“Close All” closes everything you’ve done in this session in one go! (Remember,
MediaStar does not prompt you to save your work unless it’s been added to a report
or saved analysis/plan)
How do I define a new TARGET AUDIENCE ?
This example develops an audience called “Dublin Females aged 20- 44” which is not
contained in the KEY AUDIENCES section. First, check out the section called How do I
modify the audience or add stations (without losing my spots!)?
•
•
•
•
•
•
Open out (press +) Demographics section
Find the Region axis and open this out too
Select (double-click) on the item “Co. Dublin” and this will automatically be
placed in the Audience building area (bottom right of the Select screen)
Next find and open out the Sex variable. Select (double-click) “Female”. This
will go into the base filter area too.
Last, find Age Groups and select the three age groups that correspond to
your chosen audience 20-24,25-34 & 35-44.
If you select RTE 2fm, FM104, 98FM,Q102 and Spin 1038 (TAP & Prime) as your
stations, your screen should look like this:
(the individual station axes may be opened out)
Espri DMC
analysis : insights : strategies
www.espri.ie
087 2256562
01 2841005
Espri DMC
analysis : insights : strategies
www.espri.ie
087 2256562
01 2841005
How do I analyse radio listening data?
(to replicate figures from the “book”, create station profiles or just delve deeper)
•
•
•
Try this : expand the DEMOGRAPHICS section and double click REGION. By
default it will become the “across” part of the table
Expand (press +) the RADIO MEASURES section, then WEEKDAY REACH, SHARE
& Qr Hr then LISTENED YESTERDAY, and you will see “Daily Station Reach
Weekday”. Double click to add to the selections in the right-hand pane
Press the Run button (bottom right). You’ll get something like this…
How do I make my table look like the example ?
Look at the menu/ribbon tabs and turn on Suppress Zeros, Show Significance and
percentages like this
To change the way the top rows of the table display, click in the left hand column
onto the Total (Weekday) text and when the row is highlighted turn on the buttons in
the Show Me tab like this
Espri DMC
analysis : insights : strategies
www.espri.ie
087 2256562
01 2841005
What do the numbers mean in an analysis screen ?
Percentages are shown on the column by default – except for the Total row (if
shown). In the example above, 24% of the population listens to Radio 1, in Cork the
percentage of listeners to the same station is 23%. In the % Row you will find that 11%
of the population lives in Co. Cork – that is 11% of the 3,593(000).
The unweighted number row shows how many people were interviewed in the
column category. So here there were 987 people interviewed in Cork which becomes
413,000 when the Universe Estimate is applied.
You very easily toggle between numbers & percentages using the Show Me tab or
show both at the same time.
Decimal point precision can be increased if required.
What can I learn from the Significant Difference indicators (colours)?
The legend at the bottom of the screen reads
We have
set the highly significant level at 99% due to the very large sample, which makes it a
more stringent test. If you don’t see colours, then click on the “Show significance”
button.
The colours show us results that are outside the norm and are therefore potentially
interesting. To explain, in simple non-statistician terms: the blue column (called the
reference column) is the one that is used as a reference point. The green numbers
show results that are different (higher or lower) when compared with that blue
column. So here the table shows us that 24% of people overall listened to RTE Radio 1
yesterday. In the Dublin region the percentage of people listening is 28%, coloured in
green to draw our attention to the fact that it’s enough of a difference to be
counted as statistically “different” – in this case higher. You can also see that 22% of
people living in the areas outside Dublin & Cork listened to the same station. This is
Espri DMC
analysis : insights : strategies
www.espri.ie
087 2256562
01 2841005
also significantly different but lower than the average shown in the total column. You
can see that there is plenty of regional variation in listening patterns. You may find
interesting differences in profile across stations, as here:
The orange figures on the male/female split of RnaG listeners shows there is some
significance, but as the sample is small, it’s orange not green
The formal definition of how Significant Difference is calculated in MediaStar can be
found here. 2
2
Espri DMC
analysis : insights : strategies
www.espri.ie
087 2256562
01 2841005
What if I defined my analysis selections in the wrong order?
Use the Flip button in the Layout tab
and then the table will look like this (portion of the table) and you will see that the
table is again percentaged on the column and tells us that 34% of Radio 1’s listeners
are in Dublin
How do I create a station or programme profile?
•
•
•
•
Open out the Radio Measures, Weekday section (press +)until you get to
Timeblocks.
Select (double-click) on the station name (the whole thing – not just one
program) you are interested in. For this example I have chosen 2FM
Collapse (press -) the Radio Measures section and open out Demographics.
Select the following (double click either on the name or on the little folder
symbol beside the name in each case):
Sex
Housekeeper
Age Groups
Social Groups - Household
Espri DMC
analysis : insights : strategies
www.espri.ie
087 2256562
01 2841005
Your selections will look like this:
When you press Run, you will get something like this (portion)
Espri DMC
analysis : insights : strategies
www.espri.ie
087 2256562
01 2841005
Then if you click on the top of the Total column, press and hold the Ctrl key and click
on the top of the 0900-11.00 column, when those 2 columns are highlighted (dark
blue) press the “Bar” icon on the Graphs tab.
I know, that doesn’t look
button and press it (swapping the axes) you will
great, but if you find the Swap
see a chart profiling the Ryan Tubridy Show compared with All Adults listening to 2FM.
There are lots of ways to make this look prettier. You can change the text / labels, you
can show values on the bars and lots more, the most important thing is that you can
copy and paste directly to PowerPoint, Excel or Word.
Espri DMC
analysis : insights : strategies
www.espri.ie
087 2256562
01 2841005
How do I look at Share?
First, a few pointers:
•
Share tables are available for the sales houses and station
groupings
•
Local Market Share will need a Franchise area or Region
base/filter to make sense.
The top three rows of a Share Table can be hidden (they contain
the calculation “workings”). Same for the “Total” column.
Share tables are always shown in percentages
Share tables can only be run one at a time
It is inadvisable to run a share table with a cross-break until you
have had specific training in this area
•
•
•
•
For a Weekday Market Share table, expand the RADIO MEASURES section, then
WEEKDAY REACH SHARE Qr HOURS, then SHARE Weekday (press +). You will see
“Market Share JNLR Stations (M-F)”
Hover your mouse over this title and you will see the pop-up text “Market Share
among Irish Commercial Stations”.
Don’t expand this title – although you feel you should – just double click on the icon
beside it
to select. Like this…
It needs the extra “bits” that seem to have come in to the selections unasked, but
leave them there, they are essential to the calculation of the Share table
Espri DMC
analysis : insights : strategies
www.espri.ie
087 2256562
01 2841005
It will run “as is” in a grid table – with its own “across” & “down” already defined for
you, but you can add Audience definitions to the Base Filter Area to refine the run for,
say a region or a demographic grouping.
Press the Run button (bottom right)
Ensure that you have percentages showing It is good practice to show share table
percentages to 1 decimal place. Like this
It’s also good practice to hide the Total row and the Total column (using the
Show/Hide Tool) – again, these are not helpful in this context. You may also want to
hide columns of information that you do not need at this point (they can be unhidden again later)
Espri DMC
analysis : insights : strategies
www.espri.ie
087 2256562
01 2841005
You might end up with something that looks like this:
(You can see I changed the reference column to “24hr Share”) by using the
“Compare with” item in the data tab)
Go back to the Select Screen and add an audience definition if required. Refer to
the item How do I define a new TARGET AUDIENCE ?, above
Espri DMC
analysis : insights : strategies
www.espri.ie
087 2256562
01 2841005
Quarter Hour data
Listening data is collected for each person quarter hour by quarter hour. An
individual can only listen to one station in each quarter hour. Each occurrence of 1
quarter hour is multiplied by 15 to calculate share and minutes listened.
Reach
Here is where you will find the full list of axes relating to quarter hour reach – usually
displayed in 000s – on a station by station basis. If you want to track the number of
people tuning in throughout the day this is where you look
What is AQH and how do I look at Average Quarter Hour tables?
The next section Average ¼ Hr Audience per Timeblock looks at the average
audiences per programme timeblock and on an hour-by-hour basis plus the same
time segments that are shown in the Share tables including
0700-1900 (PT – Prime time) and 0700-2400 (TAP – Total Audience Package).
They can be run with a cross-break (an “across” question).
1. For a Weekday AQH table, first pick a cross-break, say Region from the
Demographics section.
2. Then expand the RADIO MEASURES section, then WEEKDAY REACH SHARE Qr
HOURS, then QUARTER HOURS Weekday, then AVERAGE ¼ Hour Audience per
Timeblock – see pop-up for a description of the contents
3. Click on Avg Timeblock RTE 2fm to highlight it
4. Don’t expand this title – although you feel you should – just double click on the
little 2-page icon beside it to select. Like this…
Espri DMC
analysis : insights : strategies
www.espri.ie
087 2256562
01 2841005
Press the Run button (bottom right)
This table now shows the average quarter hour audience in each timeblock. I have
modified the appearance of the table using the “Show Me” tab and selecting
numbers which gives us the number of 000s listening on average during each show
broken down by Region:
Espri DMC
analysis : insights : strategies
www.espri.ie
087 2256562
01 2841005
Showing that, for instance, the 0900-1100 show on 2FM ha 102,000 listeners. 10,000 in
Dublin, 43,000 in areas outside Dublin & Cork etc.
The last section under QUARTER HOURS does the same thing on an hour by hour basis
as well as for the main dayparts that are also used in the Share tables – like this which
shows the total number (in 000s) listening to Any Radio across the day and within
each hour.
From 0700-1900 (Prime Time) there are 958 people listening at any one time. The peak
of listening to radio in the ay occurs between 10 and 11 on weekday mornings with
1,317,000 people on average listening at any point in that hour!
Espri DMC
analysis : insights : strategies
www.espri.ie
087 2256562
01 2841005
Glossary
Context
sensitive
commands
Right mouse click will provide context sensitive actions and
commands – usually in the form of a pop-up menu or note
Reach
Also called “incidence”. Refers to the number and percentage of
people who said they listened on a given day or at a given time to
a station or show
AQH
“Average Quarter Hour” – how many people on average were
listening at any time during a programme, a show or other time
band. (Reach divided by number of quarter hours in show or
timeband/daypart)
See here for a description and examples of the difference
between reach and AQHi
Total
Usually refers to the Universe Estimate (see below).
Axis
the developers’ terminology for a question or variable
Unweighted
Numbers
The sample, the number of people interviewed. It is good practice
to show the “unweighted base” row in any Analysis Table – then
you will know whether your analysis meets the minimum 200
sample number requirement. If it’s not showing, click on the word
“Total“ at the top-left of the table over the side-headings, rightclick, select Show Me and click on
Number, Percents & Unweighted (or use the Show Me tab on the ribbon)
The unweighted number can be a good indicator of whether the
basis of your decision is sound. (see Low Base warning)
Base
The title of the Base or audience you selected
Any component(s) of any questions being used as a Base.
Can also called filter, “demo”, demographic or audience
Low Base
warning/Data
base limits
The program has automatic limits applied to ensure any table or
Plan is run on a “legal “base which is related to station franchise
area sample as laid out in the JNLR Methodology. You will see a
warning and will not be able to go any further with that audience
definition.
Weekly
Reach
Is the cumulative reach for a week’s listening (Yesterday & Past
Week)
Daily Station
Reach
Also called “Listened Yesterday” – incidence of listening yesterday.
Espri DMC
analysis : insights : strategies
www.espri.ie
087 2256562
01 2841005
What is a Spot
when inserted
in a Sales
House
“station”?
Ireland FM, UTV Radio, Media Central, Communicorp 6 for
example are set up to allow you to assess the impact of a spot in
each of your chosen. If you choose one (or more) of these
“stations”, then 1 spot placed in a timeblock equals one spot in
each of the stations included in that package at that time. Hover
over the name of the station on the Select Screen to see a little
pop-up with information on which stations are represented and
included.
Share
The pool of all minutes listened during a specific part of the day =
100%. An individual station’s “share” is the percentage of the
minutes listened accounted for by their listeners in that time band –
most often reported on 0700-1900 (Prime) or 0700-2400 (TAP or “run
of day”).
Media
Analysis
MediaStar-speak for reach & frequency, coverage & frequency, a
plan or a “run” – all the same thing.
How To Select
And DeSelect
There are three ways that items can be selected or de-selected for
analysis. You can drag and drop your selections, double-click on
the selections, or use the ENTER key.
Universe
Estimate
This is the result of applying a population weight to the sample,
representing all people aged 15 and over in the 26 counties of
Ireland. Shown in (000s) e.g 1,053 = 1,053,000. This is carried out
automatically by MediaStar.
Universe estimates are changed from time to time to reflect most
up-to-date CSO figures
Changes to audience 000s will be evident when the universe
estimate has changed, although the percentages (proportions)
may have only changed fractionally from book to book or year to
year.
Effect of
Universe
Estimate
changes
Station Planning Glossary
Reach
Expresses the estimated percentage of people
who will hear a spot placed in a particular station
timeblock.
Frequency
How often that plan will be heard on average by
a listener matching the audience criteria once
the spots have been defined. Also called OTH
(opportunities to hear). The graph produced
shows the percentage of people likely to hear
that plan at least once - 1+ , 2+, 3+ etc. and
shows an average frequency. This all helps to
assess the effectiveness of the plan.
There is no feature in MediaStar that allows you to
“reverse engineer” the model and ask for an
Average Frequency of 4.7 for selected audience
and stations
Optimisation
A powerful tool which currently is not used by
many MediaStar subscribers as it requires spot
costs for all stations/programme timeblock/spot
length combinations – preferably built-in. Spot
costs are not provided to us from the industry at
Espri DMC
analysis : insights : strategies
www.espri.ie
087 2256562
01 2841005
present, but should you wish to implement your
own rate-card, please get in touch and we can
show you how to get this working.
Summary Row
This row gives the summary of the calculated plan
for the columns you have chosen to display. If
figures are grey, please re-calculate (press Net
Reach button).
Spot (editable)
Place the number of spots you require against
each timeblock or daypart. The Summary row
shows the total number of Spots in the plan. Never
hide this column.
Total Population Reach
Reach provided by a single spot in that station
timeblock as a percentage of All Adults. Summary
row shows the net reach % of the media plan for
All Adults for the total number of spots.
Target Group Reach
Reach provided by a single spot in that station
timeblock as a percentage of the Target Group
(Audience selected e.g Housekeepers). Summary
row shows the net reach % of the media plan for
the Target Group for the total number of spots.
Target Group Factor
This is the extent to which the reach among the
Target Group is greater or lesser than the
Population as a whole. It is calculated by dividing
the Target Group Reach by the Total Population
Reach. The Summary at the top shows the
Average Target Group Factor and is based on the
number of spots for each station.
€/Each (editable)
(Optional field) Put spot rates in here. MediaStar
does not include rate cards for stations at present.
The Summary line value is non-editable and shows
the average cost of the spots - i.e. the €/Total
value divided by the total number of spots.
€ Total (editable)
This is the total budget spend for 1 week (i.e. the
sum of Spots multiplied by €/Each). You can put in
the “Package Cost” for one week (Hint: the total
agreed package cost divided by the number of
weeks) in this field. The system will recalculate and
update the cells in the summary row that contain
a cost component (eg €/Each, €/GRP, CPT).
Incremental Reach
This shows the extra reach in the existing media
plan that one extra spot of that program/daypart
would add.
€/GRP
= Spot rate divided by target reach.
This is the cost efficiency of each daypart in terms
of cost per rating point. And therefore needs spot
rates to work. It is calculated by dividing the
€/Each by Target Group Reach. The Summary at
the top shows the average cost efficiency
calculated by dividing the Total Budget Spend by
Total GRPs.
€/Incremental %
This is the incremental reach cost efficiency of
Espri DMC
analysis : insights : strategies
www.espri.ie
087 2256562
01 2841005
each title and is calculated by dividing the
€/Each by Incremental Reach.
Incremental ERPs
Feature not available at present (needs rate card
info which is not currently supplied)
€/Incremental ERP
Feature not available for JNLR data
AQH
=Gross impacts divided by Audience
How many times on average a person will hear an
ad
GRPs
= Spots * Reach
Show the gross rating points, that is, the
accumulated percentages (as points) of the net
reach of each spot. This is calculated by
multiplying the Target Group Reach by the
number of spots. For example, 3 spots in a
timeblock with an average reach of 15% would
result in 45 GRPs.
Weight (This column is editable)
Not in general use. Can be used to show declining
effectiveness - maximum (best) =1.0. Ask for
details of how to maximize the use of this feature.
Audience
=Target Group % of Total Population expressed in
000s
Shows the available audience for each
daypart/timeblock. The Summary row shows the
net (unduplicated) total audience for the
proposed plan.
Gross Impacts
=Audience * spots
This is the accumulated number of impacts of
each Station. It is calculated by taking the GRPs
/100 times the Target Group Population, e.g. 3
spots in a timeblock with an audience of 30,000
viewers would result in 90,000 impacts.
CPT/Impacts
The summary at the top of the column is the Total
Budget Spend divided by the total Gross Impacts.
CPT / Audience
This is the € Total divided by the Audience. Not
generally used (as it makes the CPT very high!) so
best hidden.
Impacts/€
Shows the number of impacts achieved for each
€ spent in the station. The summary at the top is
the Gross Impacts divided by Total Budget Spend.
I usually hide this too.
Espri DMC
analysis : insights : strategies
www.espri.ie
087 2256562
01 2841005
Glossary: Significant Difference Significant differences are by default, compared to the Total column as a reference. In
other words, the numbers are coloured depending on how significantly different they
are from the numbers in the total column. The default colour scheme is based on
traffic light colour codes: red numbers show little significant difference, green
numbers show the most significant difference. As with traffic lights, red means stop,
so these numbers are unlikely to be significantly different, green means go and so
these numbers are most likely to be significantly different.
How Are Significant Differences Calculated?
Chi-squared tests are used for comparisons of counts, and t-tests are used for
comparisons of continuous variables (averages or values such as volume data for
market share). All tests are two tailed. For testing differences in proportions, the test is
equivalent to a Z test on proportions. The Chi-squared tests are all corrected for
continuity using Cochran’s formula. All the tests are correctly calculated on weighted
data, even when the database is weighted to some target other than the true sample
size (say, total population).
Espri DMC
analysis : insights : strategies
www.espri.ie
087 2256562
01 2841005
i
1.Reach 000s & percentage of listeners to RTE Radio 1 849,000/24%
2. Reach of the various shows/programmes on Radio 1 e.g 0700-0900 Morning Ireland has 449,000 listeners
and the highest percentage of that station’s listeners tuning in to that show – 53%.
3. AQH or average number of listeners in each quarter hour for the various shows, which interestingly
enough shows that although Morning Ireland has a higher reach, the 0900-1000 has a a higher AQH of 282
(as against 256)
Espri DMC
analysis : insights : strategies
www.espri.ie
087 2256562
01 2841005