1
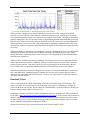
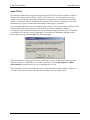
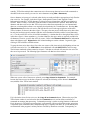
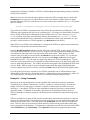
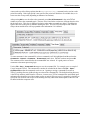
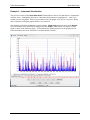
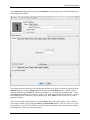
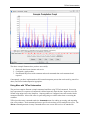
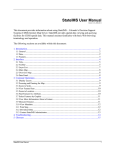
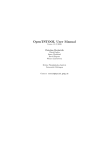
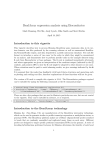
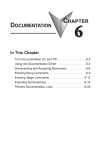
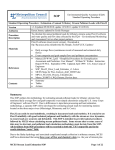
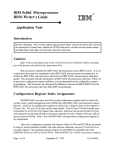
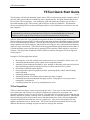
TSTool Documentation TSTool Quick Start Guide 2014-05-21 This document will help you download, install, and run TSTool software using simple examples, and will point out other resources that are available for more in-depth learning. This guide assumes that the user has very little TSTool experience. After reading the guide and running the examples, you will have a basic understanding of how TSTool works, and can begin to explore its capabilities. This document focuses on installing TSTool on Microsoft Windows; however, the information is relevant for Linux and Mac computers. Examples mentioned in this document are provided for convenience. The TSTool command files can be opened and run. However, to learn how to use TSTool it is recommended that you create the examples yourself using the TSTool software by following instructions in this document. TSTool (“time series tool”) was originally developed for the State of Colorado as part of Colorado’s Decision Support Systems (CDSS) in order to process data from the State’s HydroBase database into data files for river basin modeling software. Since the initial development, TSTool has been enhanced to have many capabilities and can be applied to many problems involving time series, tabular data from databases and Excel, maps, and websites. TSTool has been developed and enhanced with funding from the State of Colorado and others sources and the State is migrating TSTool and other CDSS software to open source licensing. The Open Water Foundation (OWF) continues to enhance and support TSTool in support of various projects. Examples of TSTool applications include: Browsing time series data available from internet web services (streamflow, climate, snow, etc.) Automating data downloads, quality control, and creating data products Analyzing current conditions (streamflow, snow, drought, or other data) with respect to historical data and producing graphs for multiple locations to monitor and model river systems Processing raw data into model data files Processing model output into graphical products, performing quality control, and facilitating model calibration Automating database loading Automating creation of Excel data sheets for data entry from a template Performing statewide water demand and supply analysis, with graphs at every step to ensure transparency in calculations Calculating natural flow in rivers by manipulating time series TSTool Capabilities TSTool, as the name implies, focuses on processing time series. Time series are data sets that include a series of date/time and value pairs, for example to indicate how temperature, precipitation, and streamflow change over time at a specific location. Each data value also may have an associated data flag that may indicate, for example, a missing value, an estimated value, or some other qualifier. Although the format of time series data varies between sources and data formats, they all have the same fundamental properties and TSTool deals with time series in a general way. Time series can be displayed in both graphical and tabular forms, as shown below. The TSTool visualization tools handle time series with different data intervals (including irregular time interval), missing data, and units. Quick Start - 1 TSTool Documentation TSTool provides a graphical user interface that allows users to seek, isolate, and interact with data. However, at its core, TSTool is intended to be a workflow automation tool, meaning that it encourages users to define repeatable sequences of commands to accomplish certain tasks. The focus on automation generally means that a user will spend more time up-front thinking through and defining data processing logic, but once defined, the process can be run repeatedly, scaled to process more data, and enhanced as refinements to the process are needed. TSTool implements a sequential command workflow that keeps data and logic separate, in contrast to spreadsheet tools like Microsoft Excel that tend to merge data and processing. TSTool commands are available to read, manipulate, visualize, and output time series in various formats. Manipulation includes basic actions such as adding, subtracting, and multiplying time series; filling missing data values; calculating statistics from time series; converting time series into different formats; and many other capabilities. TSTool is able to read data from common databases, file formats, and web services; additional formats will be supported as the software is enhanced. Web services allow software to access data in standard formats using the internet. Data from web services are used in examples in this document so that the basic software can be used without installing databases or other data files on one’s own computer. Basic data browsing and visualization using TSTool is simple. Creating command files for simple tasks also is straightforward. Building on simple command files to create more complex analyses requires more time to become adept with TSTool features. However, this initial effort can yield large efficiency gains for future data analysis. Download TSTool TSTool is available on the CDSS website (http://cdss.state.co.us/software/Pages/TSTool.aspx). This version is “frozen” at the version that is used by the State for its projects. HydroBase is available on DVD from the State of Colorado. Please contact the Colorado Water Conservation Board (CWCB) with regard to DVD purchases (http://cwcb.state.co.us). Additionally, an archive of TSTool versions including new releases is available on a website maintained by the OWF (https://sites.google.com/site/cdssstaging/tstool/download). Older versions may be needed to match an earlier analysis and newer versions provide access to new features that may not yet be needed for State CDSS projects. Newer TSTool versions generally are backward compatible with old versions and the command syntax facilitates adding new features. See the release notes for each version to determine which features might be useful. Quick Start - 2 TSTool Documentation Quick Start Guide Install TSTool The websites indicated in the previous section provide access to TSTool software installers, which for Windows have names similar to TSTool_CDSS_10.29.00_Setup.exe. Save the installer file on your computer (note that the file is quite large and may take several minutes to download) and then run the installer. You do not need to be an administrator to install TSTool; however, installing as a user with administrator privileges will ensure that the uninstaller works properly in Windows. It is recommended that you select all the defaults for the installer. The TSTool software installer has been created assuming that you may have access to the State of Colorado’s HydroBase database. Consequently, at the end of the install process you are asked to configure that connection. The defaults are generally OK if you have access to HydroBase. If you don’t have HydroBase installed (or don’t know), skip the step by answering No to the following prompt: TSTool will install to a version-specific folder and multiple versions can be installed at the same time. The files install to C:\CDSS\TSTool-Version and a start menu is created: All Programs… CDSS… TSTool-Version. In both cases the version is something like 10.29.00. TSTool installers for Linux are available for some versions and Linux and Mac installers will be more accessible in the future as resources are allocated to testing on these operating systems. Quick Start - 3 TSTool Documentation Start TSTool TSTool can be started using the Start… All Programs… CDSS… TSTool-Version menu. At startup TSTool attempts to make a number of connections to databases and web services and will display a message similar to the following figure (below left). Because TSTool is distributed for use with the State of Colorado’s HydroBase database, the following login window will be displayed (below right). The attempt to find HydroBase databases may result in a warning about the Windows firewall. If HydroBase is disabled, as described below, this warning should not display again. Unless you have been provided with a HydroBase DVD or have access to HydroBase on a server, you will not be able to select a HydroBase database. Consequently, press Cancel in the above-right dialog and HydroBase features will be disabled. To disable the HydroBase login from within TSTool, select the Tools…Options menu, select the Enabled Input Types tab and uncheck the HydroBaseEnabled checkbox. Restarting TSTool will then not display the Select HydoBase dialog and firewall warnings should also not be displayed. Example 1 – Data Browsing and Viewing After TSTool has finished initializing data connections, the upper part of the main window can be used to browse time series data from various sources. The following figure illustrates the top part of the TSTool main window after query options have been specified and Get Time Series List has been pressed to query time series. Specific user actions are explained below. To query time series, first select a Datastore or Input type. Datastores connect to databases and web services. Input types generally access files, such as simple time series data formats or model input and output files. The selection is used only for interactive browsing in the top of the main window. In Quick Start - 4 TSTool Documentation Quick Start Guide actuality, TSTool has multiple data connections active from start-up that can be used with commands as described in the next section (you can view active datastores using View…Datastores). Once a datastore or input type is selected, other choices are made available as appropriate to help filter the time series list. For example, in the above figure, the Regional Climate Center Applied Climate Information System (RCC ACIS) datastore is selected to access climate data, and daily precipitation is selected. Denver County is selected to limit the number of stations that are returned. Note that for this datastore and other web services that TSTool can retrieve data from nationwide (or even international) data sets, even though the software was originally developed only for Colorado data sets. Pressing Get Time Series List queries the web service and lists the time series in the upper right area of the main TSTool window, as shown in the above figure. The query does not process all the time series data values but only the location (typically stations) and time series metadata (available period of record, data units, etc.). Use the scroll bar to review all available metadata (i.e. columns that are to the right of those visible in the above figure). Some metadata (e.g., location identifier, data type, units) are typically available for all datastores; however, specific data varies by source. Refer to the Datastore Reference for information about each datastore type. Right-click on the column headings to sort the columns. In general, rightclicking in TSTool shows available actions. To query the time series data values, first select one or more of the time series by highlighting at least one cell in the time series list. Use CTRL-click to select additional cells and SHIFT-click to select a range. The left-most numbered column cannot be selected. Cells that are selected will cause the time series for the row to be processed. The following figure illustrates cells that have been selected. When one or more cells of interest are selected, press Copy Selected to Commands. For example, because the first two rows in the above figure are selected, the following will be shown in Commands area (middle) of the TSTool main window: If it is desired to select all time series, use the Copy All to Commands button. Whereas the top of the TSTool main window is used to browse data, the Commands area is used to define a workflow of commands to automate data processing. Command processing is similar to using functions in Microsoft Excel; however, in TSTool the processing logic is presented in visible text form like a script, processing is sequential (first command to last), and processing logic is separate from data. In TSTool data objects are maintained in the program’s memory and are accessed by identifiers as needed. Consequently, an Quick Start - 5 TSTool Documentation important part of defining a workflow in TSTool is understanding and implementing naming conventions for data object identifiers. When time series are selected in the upper-right area of the main TSTool window and are copied to the Commands area, the time series are represented as a time series identifier (TSID), which is a unique identifier that allows TSTool to read the time series from its data source (datastore, file, etc.). The general form of a TSID is: Location.DataSource.DataType.Interval~DataStoreOrInputType The periods in the TSID are important because they indicate the separation between TSID parts. The TSID part values depend on the specifics for each data source. For example, the United States Geological Survey (USGS) National Water Information System (NWIS) web service uses a data type of 0006000003 to indicate mean daily stream discharge whereas other datastores use Streamflow. TSTool users need to understand the source, characteristics, and limitations of data, using information on a data provider’s website and also see TSTool appendices (see Resources section below). When TSTool sees a TSID in the command area, it interprets the TSID as an implicit read command and will attempt to read the time series from the data source. Press the Run All Commands button to read the data for the indicated TSID. In this example, TSTool will request data from the RCC ACIS web service. Progress in processing commands and progress within each command is indicated in the lower right corner of the main window. When progress is 100% complete, time series that are read are listed in the Results area in the main window. To view the time series graphically, right-click on the time series list and select the Graph – Line menu item to graph highlighted time series. This will result in a graph being displayed in TSTool’s graphing tool. You can zoom into a period (horizontal axis) by using the left mouse button to draw a box on the main graph or the overview graph using the mouse. The visible period for the main graph will be highlighted in white in the overview graph. When zoomed in, use the navigation buttons under the graph to page through data. View the complete time series in a table by selecting the Table button at the bottom of the graph window. Up to this point you have been exposed to a few TSTool conventions such as TSIDs and have a basic understanding of the mechanics of using the interface. Although these simple commands may suffice for very simple purposes, the real power of TSTool is in its ability to automate data processing. Example 2 – Using Commands Interactively browsing through data is a useful capability and is often the way that one would start evaluating how to complete a data analysis. However, repetitively “clickity-clicking” on menus and buttons is not efficient, and trying to remember a sequence of manual steps can lead to errors and inefficiency. Consequently, TSTool provides commands to automate processing in a documentable, repeatable manner. Commands are somewhat equivalent to Excel spreadsheet formulas; however, TSTool commands are defined, sequenced, and displayed in the command area rather than being mixed with data. TSTool by default tries to query the full period of available data (unless datastores themselves constrain the query to a limited period). Once the amount of data is known, the user can evaluate data quality and refine the period to their needs. The TSID syntax in the Commands area tells TSTool to read the time series. However, there are no controls to indicate the time period to read or provide other options that may be appropritae for the datastore. To illustrate how commands are useful, first select one of the TSIDs in the Commands area (by left-clicking). Then right-click to display the popup menu and select the Quick Start - 6 TSTool Documentation Quick Start Guide Convert TSID command to general ReadTimeSeries() command menu. This will convert the TSID into ReadTimeSeriesCommand() as shown in the first command in the following figure: The syntax for commands is CommandName(ParameterName=ParameterValue,…). Uppercase/lowercase is generally ignored; TSTool uses mixed case to make commands and parameters more readable. Unlike Excel formulas, command parameters can be in any order because the parameter name is provided. To edit the first command, double-click on it or select the command and then right-click and select Edit from the pop-up menu. The command editor will be similar to that shown in the following figure. Command editors provide a brief explanation and edit fields for command parameters. The notes to the right of each entry field indicate whether a parameter is required or optional. As much as possible TSTool tries to provide choices. Consequently, TSTool partially runs commands during editing to determine information for choices, and this is why sometimes there is a delay after inserting TSIDs or commands in the Commands area. In complex command files, it may be difficult for TSTool to partially run a command and choices may not be available, in which case parameter values will need to be entered into entry fields. As command parameters are entered, the Command area at the bottom of the dialog displays the full command syntax. In the above example, the Alias parameter has been specified by the user to provide an alternative way to refer to the time series because TSIDs can be long. The format string %L will be converted to the location identifier and %T to the data type, based on data read for the time series. Part of defining a workflow is to evaluate whether aliases should be used for time series and if so, specifying the naming convention for aliases. Quick Start - 7 TSTool Documentation A note at the top of the dialog explains that the SetInputPeriod() command can be used to set the period for reading. If the input period is not specified, the period will default to all available data, or in some cases the recent period (depending on datastore conventions). After pressing OK to save the edits to the command, press Run All Commands in the main TSTool window to process the commands again. The time series listed in the results area will then show the alias for the time series. This alias is displayed in choices when other commands are edited. The following figures show the results prior to and after defining the alias. The time series description and TSID are always shown and the alias will be prepended to the information if it is defined. To enter comments in the command file, select a command (it will be highlighted) and then select the Commands… General – Comments… # comment(s) menu item. Edit the comment and press OK. The comment will be inserted before the command that was selected. It is good practice to insert comments to document processing logic. Use the File…Save… Commands As menu to save the command file. For example, save as example2UsingCommands.TSTool. The command file can then be reloaded in the future with File… Open… Command File so that the commands can be re-run. Opening or saving a command file results in TSTool’s working directory (folder) being set to that of the command file. The default working directory is the TSTool software install location. However, in most cases, TSTool command files and related input and output files should be saved where other project or analysis files are saved. It generally is desirable to specify the file locations with respect to the working directory rather than absolute paths so that files can be shared with other computer users. Quick Start - 8 TSTool Documentation Quick Start Guide Example 3 – Automated Visualization The previous sections of this Quick Start Guide illustrated how to browse for data and use a command to read time series. Although the data can be visualized with the interactive graphing tool… what if you needed to create 100 graphs? What if you needed to create 100 graphs every day, or every hour? Being able to automate creating the graphs could be very beneficial. Start with the results from running the previous example. Right-click on the time series in the Results area at the bottom of the main TSTool window and select Graph… Line, which will display a simple graph as shown in the following figure. TSTool determines default properties for the graph; however, some information such as an overall title is not determined by default. Quick Start - 9 TSTool Documentation Next, right-click on the graph itself and select Properties from the pop-up menu, which will display the following properties editor. The graph properties window provides configuration options for the graph, divided into properties for the Product (the page if printed), Graph (graph on the page), and Time Series (data in a graph). Select either the product or graph Titles tab and enter a main title (e.g., “Example Precipitation Graph”). Then press Apply at the bottom of the properties window. The graph should update to show the title. You may need to reposition the windows to see the updated graph. Press Close to close the time series product properties window. Next, save the graph configuration by pressing the Save button on the graph window. Enter a filename (for example example3-graph) and press Save in the Save Graph window. This file will save as a “time series product” (*.tsp) file. Be careful to save the file in the same folder as the command file to simplify file management. Then close the graph window. Quick Start - 10 TSTool Documentation Quick Start Guide In the main TSTool window, if any commands are selected, right-click on the commands and select Deselect All Commands. This ensures that new commands will be added at the end of the command list. Otherwise commands are inserted before the first selected command. The Commands menu in the TSTool main window provides access to many commands used to automate processing. Select the Commands… Visualization Processing… ProcessTSProduct() menu, which will display a command editor dialog as shown in the following figure. Enter the time series product file and output PNG image file as shown in the above figure. The time series product file name should match the name saved from the graph window. Use the Browse button to select the file and then use the Remove Working Directory from TSP button to convert to a relative path. Press OK to save the command. The commands will then be similar to the following: # TSTool Quick Start - Example 3 - Automated Visualization ReadTimeSeries(TSID="COOP:052211.ACIS.pcpn.Day~RCC-ACIS", Alias="%L-%T",IfNotFound=Warn) COOP:055402.ACIS.pcpn.Day~RCC-ACIS ProcessTSProduct(TSProductFile="example3-graph.tsp",OutputFile="example3-graph.png") Then, in the main TSTool window, press Run All Commands to run all the commands. This will read the time series from the RCC ACIS web services, display a graph similar to the following, and create an image file with a name specified in the ProcessTSProduct() command OutputFile parameter. The output file is also listed in the Output Files tab in the Results area of the TSTool window. Selecting the file should display the image if the “png” file extension is associated with a program on the computer. Quick Start - 11 TSTool Documentation The above example illustrates how you have successfully: 1. Retrieved data from an internet web service 2. Configured a graph product 3. Documented the process with comments and saved commands that can be automated and repeated Consequently, you have implemented an efficient and transparent process that can be used by yourself or others, and can be further adapted as appropriate. Doing More with TSTool Automation The previous examples illustrate a simple automated workflow using TSTool commands. Processing logic represented in a sequence of commands is defined separately from the data. Input time series are located using unique time series identifiers. Output products are configured once and created with the automated workflow. Most of the effort is spent configuring a workflow rather than re-executing the workflow. TSTool provides many commands under the Commands menu for reading, processing, and outputting time series products. Each command performs a specific task and may process multiple time series. The TSList command parameter in many commands allows one or more time series to be matched for Quick Start - 12 TSTool Documentation Quick Start Guide processing. For example, a single fill command may process all the time series that have been read. This allows a few TSTool commands to process a large amount of data. To explore additional functionality, try using various TSTool commands to accomplish a task. The Commands menu provides groups of commands to perform different functions, such as reading or filling data. Refer to the resources below to learn more about TSTool capabilities and how to apply TSTool to an analysis. Resources After installing TSTool, use the Help… View Documentation menu to view documentation as PDF files. o The User Manual provides information about using the software interface. o The Command Reference provides documentation for each command, in alphabetical order. o The Datastore Reference provides documentation for each datastore and input type, including limitations. Use the Help… View Training Materials to view self-paced training slideshows, with examples that can be run. New documentation is being prepared to help software users apply TSTool to different types of problems. See the OWF for Users… TSTool page at http://www.openwaterfoundation.org. Quick Start - 13 TSTool Documentation This page is intentionally blank. Quick Start - 14