1
VelocityMomo Indicator
User Manual
Software User Agreement & Product Disclaimer
IMPORTANT: PLEASE READ THIS AGREEMENT CAREFULLY BEFORE CONTINUING WITH THE
INSTALLATION PROCESS OF THE SOFTWARE ("THE SOFTWARE"). BY INSTALLING THE SOFTWARE,
YOU AGREE TO BE BOUND BY THE TERMS OF THIS AGREEMENT. IF YOU DO NOT AGREE TO THE
TERMS OF THIS AGREEMENT, DO NOT INSTALL THE SOFTWARE.
1. License. If you have purchased a license to the Software, Golden Zone Trading grants you a nonexclusive right and license to use the Software and the related documentation (the
"Documentation") as set forth in this Agreement. You may use the Software on a single
computer. You may also use the Software on a second (portable or home) computer so long as
only one copy is used at a time. You may make a single copy of the Software for backup and
archival purposes only provided that any copy must contain all proprietary notices included in
the original. You may use the Documentation to assist in your use of the Software. If you
download the Software without physical delivery of Documentation, you may review the
Documentation online, but you may not make further copies of the Documentation. You own the
media on which the Software is recorded, but not the Software itself or any copy of it. This
license is not a sale of the original or any copy of the Software.
2. Copying, Transferring or Modifying Software. The Software contains copyrighted material, trade
secrets and other proprietary intellectual property. You may not permit concurrent use of the
Software unless each user has an applicable license. You may not permit other individuals to use
the Software except under the terms listed above. For the purposes of protecting Golden Zone
Trading trade secrets, you may not decompile, disassemble, reverse-engineer or otherwise
display the Software in human-readable form. You may not modify, translate, rent, lease,
distribute or lend the Software, and you may not sell to others the right to use the Software on
your computer. You may not remove any proprietary notices or labels on the Software. You may
not copy, transfer, transmit, sublicense or assign this license or the Software except as expressly
permitted in this Agreement.
3. Term. If you have purchased a license to the Software, this Agreement and license are effective
from the time you accept the terms of this Agreement until this Agreement is terminated. You
may terminate this Agreement at any time by destroying all copies of the Software. This
Agreement will terminate immediately and without further notice if you fail to comply with any
provision of this Agreement. All obligations of confidentiality and restrictions on use, and all
other provisions that may reasonably be interpreted to survive termination of this Agreement,
will survive termination of this Agreement for any reason. Upon termination, you agree to
destroy all copies of the Software. If you have obtained an evaluation copy of the Software, and
have not purchased a license to the Software, this Agreement and license are effective for a
period of thirty (30) days from the date of installation of the Software.
4. Warranty Disclaimers. THE SOFTWARE AND THE DOCUMENTATION ARE PROVIDED "AS IS" AND
WITHOUT WARRANTIES OF ANY KIND, EXPRESS, STATUTORY OR IMPLIED, INCLUDING, BUT NOT
LIMITED TO, THE IMPLIED WARRANTIES OF MERCHANTABILITY, FITNESS FOR A PARTICULAR
PURPOSE AND NON-INFRINGEMENT. THE ENTIRE RISK AS TO THE QUALITY AND PERFORMANCE
OF THE SOFTWARE AND THE DOCUMENTATION IS WITH YOU. SHOULD THE SOFTWARE OR THE
DOCUMENTATION PROVE DEFECTIVE, YOU (AND NOT GOLDEN ZONE TRADING)
ASSUME THE ENTIRE COST OF ALL NECESSARY SERVICING OR REPAIR. GOLDEN ZONE TRADING
DOES NOT WARRANT THAT THE FUNCTIONS CONTAINED IN THE SOFTWARE WILL MEET YOUR
REQUIREMENTS OR OPERATE IN THE COMBINATION THAT YOU MAY SELECT FOR USE, THAT THE
OPERATION OF THE SOFTWARE WILL BE UNINTERRUPTED OR ERROR FREE, OR THAT DEFECTS IN
THE SOFTWARE WILL BE CORRECTED. NO ORAL OR WRITTEN STATEMENT BY GOLDEN ZONE
TRADING OR BY A REPRESENTATIVE OF GOLDEN ZONE TRADING SHALL CREATE A WARRANTY OR
INCREASE THE SCOPE OF THIS WARRANTY. Notwithstanding the above, you may have certain
warranty rights which vary from state to state and which cannot be disclaimed by contract. Any
warranties that by law survive the foregoing disclaimers shall terminate ninety (90) days from the
date you received the Software as shown by your receipt. Some states do not allow limitations
on how long an implied warranty lasts, so the foregoing limitation may not apply to you if
prohibited by law.
5. Limitation of Liability. YOUR SOLE REMEDIES AND GOLDEN ZONE TRADING’ ENTIRE LIABILITY ARE
SET FORTH ABOVE. IN NO EVENT WILL GOLDEN ZONE TRADING BE LIABLE FOR DIRECT, INDIRECT,
INCIDENTAL OR CONSEQUENTIAL DAMAGES RESULTING FROM THE USE OF THE SOFTWARE, THE
INABILITY TO USE THE SOFTWARE, OR ANY DEFECT IN THE SOFTWARE, INCLUDING ANY LOST
PROFITS, EVEN IF THEY HAVE BEEN ADVISED OF THE POSSIBILITY OF SUCH DAMAGE. IN NO
EVENT WILL GOLDEN ZONE TRADING’ TOTAL LIABILITY TO YOU FOR ALL DAMAGES, LOSSES, AND
CAUSES OF ACTION (WHETHER IN CONTRACT, TORT, INCLUDING NEGLIGENCE, OR OTHERWISE)
EXCEED THE AMOUNT YOU PAID FOR THIS PRODUCT. SOME JURISDICTIONS DO NOT ALLOW THE
EXCLUSION OR LIMITATION OF RELIEF, INCIDENTAL OR CONSEQUENTIAL DAMAGES, SO THE
ABOVE LIMITATION OR EXCLUSION MAY NOT APPLY TO YOU. You agree that Golden Zone
Trading will not be liable for defense or indemnity with respect to any claim against you by any
third party arising from your possession or use of the Software or the Documentation.
6. Export Control Laws. You agree to comply with all laws, rules and regulations applicable to the
export of the Software or the Documentation. Specifically, you shall not export, re-export or
transship the Software or the Documentation, or the direct product thereof, in violation of any
United States laws and regulations which may from time to time be applicable. None of the
Software or underlying information or technology may be downloaded or otherwise exported or
re-exported (i) into any country to which the U.S. has embargoed goods; or (ii) to anyone on the
U.S. Treasury Department's list of Specially Designated Nationals or the U.S. Commerce
Department's Table of Denial Order. By downloading or using the Software, you are agreeing to
the foregoing and you are representing and warranting that you are not located in, under the
control of, or a national or resident of any such country or on any such list.
7. Government Restricted Rights. The Software has been developed at private expense and is
"commercial computer software" or "restricted computer software" within the meaning of the
FARs, the DFARs, and any other similar regulations relating to government acquisition of
computer software. Nothing contained herein will be deemed to grant any government agency
any license or other rights greater than are mandated by statute or regulation for commercial
computer software developed entirely at private expense.
8. Entire Agreement. This Agreement is the complete agreement between Golden Zone Trading and
you and supersedes all prior agreements, oral or written, with respect to the subject matter hereof. If
you have any questions concerning this Agreement, you may write to Golden Zone Trading,
Customer Service, [email protected].
U.S. Government Required Disclaimer - Forex, futures, stock, and options trading is not appropriate for
everyone. There is a substantial risk of loss associated with trading these markets. Losses can and will occur. No
system or methodology has ever been developed that can guarantee profits or ensure freedom from losses. No
representation or implication is being made that using this methodology or system or the information in this
letter will generate profits or ensure freedom from losses.
CFTC RULE 4.41 - HYPOTHETICAL OR SIMULATED PERFORMANCE RESULTS HAVE CERTAIN LIMITATIONS. UNLIKE
AN ACTUAL PERFORMANCE RECORD, SIMULATED RESULTS DO NOT REPRESENT ACTUAL TRADING. ALSO, SINCE
THE TRADES HAVE NOT BEEN EXECUTED, THE RESULTS MAY HAVE UNDER-OR-OVER COMPENSATED FOR THE
IMPACT, IF ANY, OF CERTAIN MARKET FACTORS, SUCH AS LACK OF LIQUIDITY. SIMULATED TRADING
PROGRAMS IN GENERAL ARE ALSO SUBJECT TO THE FACT THAT THEY ARE DESIGNED WITH THE BENEFIT OF
HINDSIGHT. NO REPRESENTATION IS BEING MADE THAT ANY ACCOUNT WILL OR IS LIKELY TO ACHIEVE PROFIT
OR LOSSES SIMILAR TO THOSE SHOWN.
GOVERNMENT REGULATIONS REQUIRE DISCLOSURE OF THE FACT THAT WHILE THESE METHODS MAY HAVE
WORKED IN THE PAST, PAST RESULTS ARE NOT NECESSARILY INDICATIVE OF FUTURE RESULTS. WHILE THERE IS
A POTENTIAL FOR PROFITS THERE IS ALSO A RISK OF LOSS. A LOSS INCURRED IN CONNECTION WITH TRADING
FUTURES, STOCKS, FOREX, OPTIONS OR ANY KIND OF OTHER TRADING PRODUCTS CAN BE SIGNIFICANT. YOU
SHOULD THEREFORE CAREFULLY CONSIDER WHETHER SUCH TRADING IS SUITABLE FOR YOU IN LIGHT OF YOUR
FINANCIAL CONDITION SINCE ALL SPECULATIVE TRADING IS INHERENTLY RISKY AND SHOULD ONLY BE
UNDERTAKEN BY INDIVIDUALS WITH ADEQUATE RISK CAPITAL.
The GZT_VelocityMomo Concepts Explained:
The VelocityMomo indicator is a hybrid momentum indicator that combines 2 momentum indicators
into one. The tool consists of the following 2 components:
1. MTF (Multiple Timeframe) Velocity Histogram
2. MACD BB (Moving Average Convergence Divergence/Bollinger Bands)
The tool represents 2 functions of use for gauging directional price momentum. When used for
trading, market structure is a key component for understanding the current state of the market
trading environment. When analyzing the trading environment there are 3 primary states:
-
Trending markets
Oscillating markets
Rangebound/Choppy
In order to accurately read price direction traders often use tools to form directional bias towards
looking for long or short positions. The key factor to consider is that price momentum will always
shift and lead a change in market structure. Momentum will shift before a new trend can ever take
place. This presents immediate trading opportunities before engaging in a trend or oscillating
market trading environments.
Whether you implement trend trading principles or reversals, traders use momentum to formulate
rule-based structure around directional bias.
1. The Velocity Histogram measures multiple timeframe cycles using standard deviation of
price and the velocity (speed of price change) from both immediate and higher timeframes.
The histogram represent immediate directional price movement that leads trend formation.
2. The MACDBB’s are a secondary measure of long-term price momentum. The BB’s are made
up of 2 components (BB’s & Bollinger Bands).
a. The BB’s are the small dots that are each linked to the price bar above it. The BB’s
show us momentum represented by the price movement. The angle and distance
between the BB’s is another indication of strength or weakness in a trend. The BB’s
are connected with a line that helps identify the angel and spacing between the BB’s
b. The Bollinger Bands act as support and resistance. If the BB dots are above the
bollinger bands the BB’s use the bands as support. If the BB dots are below the
bollinger bands the BB’s use the bands as resistance. When the BB dots are between
the bands, the BB’s will often run towards the next level of support or resistance.
When the bands spread farther apart, this signals strength in momentum towards a
particular direction. When the bands contract and begin to squeeze together, this
identifies a strong move may be underway and we can see a shift in price direction.
3. Using the indicator with both components is where we look at several aspects of reading
momentum. The following components can aid in your analysis.
a. Fake-Outs (When the histogram shifts direction but the BB’s don’t follow)
b. Zeroline Rejects (When the zeroline acts as support and resistance)
c. Divergence (Relationship between price direction and momentum direction)
Using a combination of the above methods of analysis can help you get a deeper perspective
when looking at directional bias, entry patterns and leading analysis towards changes in price
direction. Being able to identify when momentum acts as directional information, when it
signals getting in and out of trades early or when it aids in seeing price and momentum
discrepancies can all be invaluable information towards your bottom line as a trader.
Please use the following 3 examples towards a better understanding of using the tool as
intended. If you have any questions please email [email protected]
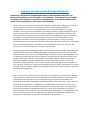
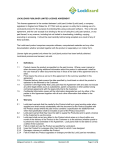
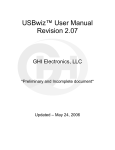
Fake-Outs:
-
Fake-Outs happen when price has a small shift in direction but can often fake traders out
because the move is insignificant and will not follow through often leaving traders trapped.
-
This is identified when the velocity histogram shifts direction but the MACD BB’s have a fair
distance from the zeroline and is not connected to the histogram.
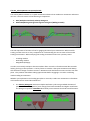
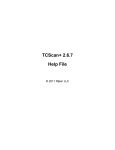
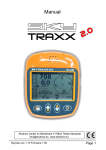
Zeroline Rejects:
-
A zeroline reject happens when the zeroline acts as major support or resistance.
The zeroline reject is represented by it rejecting the MACD BB’s
When the histogram shifts direction (+/-) and the MACD BB gets rejected and the move fails
to continue with strength.
The directional move in price is usually insignificant with just a shift in direction of the
histogram. Once a reject takes place a stronger move is usually represented with continued
strength in the direction of the momentum reject.
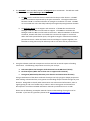
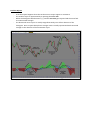
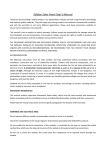
Divergence:
-
The VelocityMomo provides us with two ways to measure divergence. We can use the
velocity histogram as well as the MACD BB’s.
Divergence is measurable on any timeframe and any market as it is strictly the relationship
between the direction of price and the direction of momentum. When price moves in one
direction and momentum moves in the opposite direction this signals divergence.
Bearish Differential Divergence is when we have price making HH’s and either the velocity histogram
or the BB’s are making LH’s.
Bullish Differential Divergence is when we have price making LL’s and either the velocity histogram
or the BB’s are making HL’s.
VelocityMomo Base Concepts:
Concept
Velocity Histogram
MACD BB’s
Definition
- Measures immediate and MTF velocity cycle analysis
- Measures moving average convergence divergence represented by
BB dots and bollinger bands for support and resistance
VelocityMomo Parameters & Settings:
Group
Parameters
Data
Plots Colors
Parameters
Lookback Fast
EMA
Lookback Slow
EMA
Period
Bollinger Bans
Std. Deviation
Multiplier
Calculate on
bar close
Bollinger
Average
Allowable Values
Numerical Value > 0
Default = 12
Numerical Value > 0
Default = 26
Numerical Value > 0
Default = 10
Numerical Value > 0
Default = 1
True/False
Default = False
Custom/Web/System
Default = Transparent
Bollinger
Lower Band
Custom/Web/System
Default = Black
Bollinger
Upper Band
Custom/Web/System
Default = Black
Channel
Shading
Custom/Web/System
Default = Dodger Blue
Connector
Custom/Web/System
Default = White
Dots Down
Custom/Web/System
Default = Red
Custom/Web/System
Default = Black
Custom/Web/System
Default = Dark Green
Custom/Web/System
Default = Lime Green
Dots Rim
Dots Up
Momo
Histogram Hi
Color
Momo
Histogram Lo
Color
Zeroline
Plot Parameters
Dash Style
Average
Custom/Web/System
Default = Maroon
Custom/Web/System
Default = Black
Line Style
(solid/dash/dot/dashdot/dash-dotdot/custom)
Description
This is the fast EMA period used for the
MACD BB indicator.
This is the slow EMA period used for the
MACD BB indicator.
This is the bollinger band period used for
the MACD BB indicator.
This is the standard deviation period used
for the MACD BB indicator.
When set to false, indicator recalculates
with every incoming tick on real-time data
This allows the user to change the color of
the bollinger band average line for the
MACD BB.
This allows the user to change the color of
the bollinger band lower band for the
MACD BB.
This allows the user to change the color of
the bollinger band upper band for the
MACD BB.
This allows the user to change the color of
the bollinger band channel shading for the
MACD BB.
This allows the user to change the color of
the bollinger band BB connector line for
the MACD BB.
This allows the user to change the color of
the bollinger band MACD BB down dots
This allows the user to change the color of
the bollinger band MACD BB dots outline
This allows the user to change the color of
the bollinger band MACD BB up dots
This allows the user to change the color of
the Velocity Histogram positive
momentum
This allows the user to change the color of
the Velocity Histogram negative
momentum
This allows the user to change the color of
the Velocity Histogram and the MACD BB
zeroline
User can select the type of line style they
want to display for the bollinger band
average
Dash Style
Bollinger
Bands
Dash Style
Zeroline
Dot Size MACD
Opacity
Channel
Shading
Width Average
Width
Bollinger
Bands
Width
Connector
Colors
Width
Histogram
Momo
Width Zeroline
Line Style
(solid/dash/dot/dashdot/dash-dotdot/custom)
Line Style
(solid/dash/dot/dashdot/dash-dotdot/custom)
Numerical Value > 0
Default = 2
Numerical Value > 0
Default = 4
User can select the type of line style they
want to display for the bollinger bands
Numerical Value > 0
Default = 3
Numerical Value > 0
Default = 3
User can select the size for the MACD BB
average line
User can select the size for the MACD BB
bollinger bands
Numerical Value > 0
Default = 2
User can select the size for the MACD BB
connector line
Numerical Value > 0
Default = 6
User can select the size for the Velocity
Histogram
Numerical Value > 0
Default = 1
User can select the size for the zeroline
User can select the type of line style they
want to display for the zeroline
User can select the size for the MACD BB
dots.
User can select the opacity for the MACD
BB channel