1
llllllllllllllllllllllIllllllllllllllllllllllllllllllllllllllllllllllllllll
US005570106A
United States Patent [19]
[11]
Patent Number:
Viswanathan
[45]
Date of Patent:
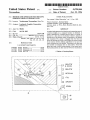
[54] METHOD AND APPARATUS FOR CREATING
HORIZONS FROM 3-D SEISMIC DATA
5,570,106
Oct. 29, 1996
OTHER PUBLICATIONS
User manual “Aldus Photostyler” ver 1.1, Jun. 1992.
[75] Inventor: Venkatraman Viswanathan, Katy, Tex.
Primary Examiner—Richard Hjerpe
[73] Assignee: Landmark Graphics Corporation,
Assistant Examiner—Kara Fernandez Stoll
Houston, Tex.
Attorney, Agent, or Firm-Bush, Moseley, Riddle & Jack
son, L.L.P_
[21] Appl. No.: 98,506
[57]
[22] Filed:
A method and apparatus for deleting and rescanning areas of
Jul. 28, 1993
ABSTRACT
........................ .. G01V 1/00
a horizon display on a computer monitor is disclosed. A
cursor, controlled by a pointing device such as a mouse, is
345/133; 367/72; 364/421
directed to a ?rst area on the monitor which is adjacent a
Field of Search ................................ .. 367/72, 73, 38;
second area of the horizon which is described to be deleted
and rescanned. The cursor is dragged from the ?rst area
[51]
Int. Cl.6
[52]
U.S. Cl. ............ ..
[58]
364/421, 420; 345/115, 118, 121, 162,
156, 157, 119, 145, 133
[56]
References Cited
U.S. PATENT DOCUMENTS
5,056,066
5,153,858
5,251,184
5,343,440
10/1991 Howard ................................... ..
10/1992 Hildebrand et a1. .... ..
10/1993 Hildebrand et a1. .... ..
8/1994 Kan et a1. ............................... ..
367/72
367/72
367/72
367/72
across the second area while a user pushes the control button
of the mouse thereby de?ning coordinates of an area for
which all points are to be deleted. The points in the ?rst area
are scanned to designate them as seed points. Such seed
points are used to pick horizon points in the second area.
Such picked points are then used to ?ll-in the second area.
5 Claims, 4 Drawing Sheets
—l
I
1
[3
DELETE
& SCAN
D
DELETE
U RESCAN
8
El
WRIT-“u
E1
SMOOTH
‘an I_._
l
l
l
l
l_#
US. Patent
Oct. 29, 1996
Sheet 1 of 4
5,570,106
Y
FIG. I
(PR/OR ART)
X .
Z
0R TIME
CROSSL/NE
LINE
F/G. 2
FIG. 3
(RR/0R ART)
(RR/0R ART)
TARGET
(XMZ)
(XXZ)
,./” ,, SEED
Rol/vT
FIG. 5
FIG. 4
(RR/0R ART)
SEED
TARGET
TRACE
TRACE
/
\
SEED
"
\ ;
/ (UP/CK
/ TRACE
’///_ \:<:;7<._.
-\
\\
PICK
F/ G. 6
2 0R T/ME
;
73 .
As
FIG. 7
Z 01? TIME
l
,.
‘TA’
:5’ 72
7
_
//
TARGE/
// \v4\
/ (2)VER/FY\
/
POINT
SEED
TARGET
TRACE
TRACE
it;
US. Patent
Oct. 29, 1996
Sheet 2 0f 4
5,570,106
F/G.8
FIG. 9
(BER INPUTS
18
PICK/N6 METHOD.
-
U E]
scORE, OT
1
.
Tum-“?u”
l _
HORIZON PICK/N6
|
|
OOMPuTER
PROGRAMISCANN/NG/
|
j
l
'00
_________________l______________
————————
'
HORIZON
{ l
MANIPULATE
COMPUTER
>
'
\
/50 E l
: I
PROGRAMS
1 \
_
l
\
DELETE AND SCAN
‘52 I‘ l
DELETE
"54 I5 l
I
l
'l 1
g‘fiv
\
‘l
3D sE/sM/c DATA
(
F
I
DISPLAY HOR/zO/v / 04
0N cm
~
7
I
1
I
L__________________ ________ _ _,J
TO MON/TOR
US. Patent
Oct. 29, 1996
Sheet 3 0f 4
5,570,106
I
I
DELETE
II
& SCAN
‘
DELETE
I
RESCAN
I
I
I
FILL
|
SMOOTH
ZOOM
__
Ew
24
0,
ck D2
@
A’
\
DELETE AND SCAN
A To B
I——————*—-———
_ _ __ _I
\l8
16"
\ ‘B2
\\
‘;>
/
/——
INPUT Al, 87, CI, D7, A2. 52, c2,
/
/ /1a
‘5D
FIG I]
—
E
I
#70
I
D2
I
I
I
DELETE ALL POINTS BETWEEN ~
72
- (~52
81,82, 0201
I
I
SCAN ALL POINTS IN AI, BI,CI.DI.74
DES/GNATE SUCH POINTS AS SEED POINTS V
USE SEED POINTS IN AI,BI,CI,DI AS
TO PICK POINTS IN AI,B2,C2.DI
I
WITH PICKED POINTS
I
I
I
FILL IN SPACE AI, B2,C2,DI
I
I
M78
/76
I
I
I
I
I
I
|
I
I
C2
C13
Bl A2
____
I
US. Patent
Oct. 29, 1996
Sheet 4 0f 4
5,570,106
E
c
01
c1
A
A7
FIG. 12
0
/
B
B7
MOUSE DIRECT/ON
\
DELETE AND SCAN
A TO E
[— —————— — — _'T__-_ _7
DELETE AND SCAN
~82
A TO B
‘
DELETE AND SCAN
5 T0 0
~84
DELETE AND SCAN
C TO D
H85
DELETE AND SCAN
D TO E
> FIG. 73
5,570,106
2
1
In less than ten years, computer aided exploration revo
METHOD AND APPARATUS FOR CREATING
HORIZONS FROM 3-D SEISMIC DATA
lutionized seismic exploration and ?eld development. Until
recently, however, one aspect of seismic interpretation—
picking subsurface horizons-or simply, “picking”,
remained essentially unchanged from paper and pencil
BACKGROUND OF THE INVENTION
1. Field of Invention
This invention relates generally to the ?eld of seismic data
interpretation. In particular the invention relates to a
machine process for selection of three-dimensional (3D)
seismic data or a “horizon” to provide petroleum exploration
professionals more detailed understanding of subsurface
geology and geometry. Still more particularly, this invention
relates to an interactive method and apparatus by which an
methods.
Traditionally, picking was done manually by drawing
with colored pencils on paper, one seismic section or line at
a time, an incredibly tedious process. In the early 1980’s
interactive CAEX (an acronym for Computer Aided Explo~
ration) workstations gave seismic explorationists the ability
to pick 3D data more quickly and effectively. While inter
preting seismic lines (that is, a two-dimensional vertical
slice or a “vertical seismic section”) was still accomplished
explorationist may change portions of a workstation monitor
displayed horizon which has been created from a 3-D 15 by viewing and picking one line at a time, it could then be
done by using'a computer pointing device, or mouse, in
seismic data base.
combination with a display screen or monitor and clicking
2. Description of the Prior Art
the cursor on a few selected points along a horizon and
FIGS. 1 through 7 of the drawings illustrate features and
letting the machine pick all the rest of the points on that line.
methods associated with the prior art picking methods and
This was the ?rst type of automated picking, and represented
are used herein to illustrate and de?ne a horizon which has
an incremental increase in both productivity and accuracy
been picked from 3D seismic data and displayed on a
over manual picking.
workstation screen. FIGS. 8 through 12 illustrate apparatus
A horizon is typically displayed on a CRT screen of a
and methods of the invention and are referenced in connec~
tion with the Description Of The Invention section of this
‘speci?cation below. Only ?gures associated with prior art
25
'methods are introduced here.
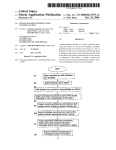
FIG. 1 illustrates a portion of a hypothetical 3D seismic
data volume in order to explain the three-dimensional rela:
workstation, that is, a computer. The display is usually an
x-y display including a seed point or points and the “picked”
points through the 3D seismic data. The difference in depth
or time of the target points from the seed point is indicated,
for example, by the color of the picked point.
In one prior art automatic system for tracking a bedding
plane or horizon in a generally horizontal zone of 3D data,
a user selected or “input" at least one “seed point”, which
tionships discussed in the text and accompanying drawings
in this speci?cation;
FIG. 2 is an isometric view of a portion of ?ve seismic
traces which illustrates the relationship between a “seed
then “expanded” in all four directions within the 3D data
volume as illustrated in FIG. 2 until it reached the bound
aries of a user speci?ed zone. Users had the option of
point” and its four adjacent “target” traces;
FIG. 3 illustrates a prior art “simple” or non-iterative 35 tracking seismic data in one of two modes: simple (non
iterative) or iterative.
automatic tracking method;
FIG. 4 illustrates an example of how a “simple” picking
A “seed point” is speci?ed by its x and y location and its
time or depth (i.e., the z-axis of FIG. 1). It is also speci?ed
by a characteristic of the re?ection wavelet at that point.
Such characteristic is usually the maximum amplitude of the
mode or method may fail to pick a target trace;
FIG. 5 illustrates a prior art “iterative” autotracleing
method.
FIG. 6 illustrates an example of how an “iterative”
picking mode or method may fail to pick a target trace.
FIG. 7 is a schematic illustration of a failure mode for
picking in either the iterative mode or simple non-iterative
mode where the target wavelet is more than a predetermined
difference in time for the seed wavelet.
re?ection wavelet at that location in the volume of the data.
Other characteristics or “attributes", such as minimum
amplitude, phase, frequency, etc., of the re?ection at the
x,y,z point may be used. As illustrated in FIG. 3 a ?rst mode
45
traces adjacent seed points for similar amplitude values,
picks the best one, and then proceeds to the next available
trace without double-checking the accuracy of the pick.
FIG. 1 is an isometric view of a portion of a hypothetical
three-dimensional (3D) seismic data volume. The small
circles at the top of the volume represent the surface location
of individual traces. The vertical lines represent seismic
is for non-iterative tracking which searches the seismic
50
FIG. 4 illustrates an example as to how an adjacent
wavelet may not be picked in the non-iterative mode. If a
negative amplitude is sensed on an adjacent trace at the same
time or depth, then such target trace is not selected, that is,
traces which are measured in time or distance along the
z-axis of the volume. Each individual trace is an amplitude
it is dead.
‘
versus time representation of an acoustic re?ection from
A second or an iterative picking mode veri?es an adjacent
strata in the earth. A sequence of x versus time traces is 55
called a “line” by seismic explorationists. A sequence of y
versus time traces is called a “cross-line“. Of course, the y
versus time traces may be designated a “line” and the x
versus time traces called a “cross-line”.
trace as a pick by cross-referencing the previous trace. Once
veri?ed, the adjacent trace is treated as a seed point and the
picking of adjacent traces from it proceeds. FIG. 5 illustrates
such prior art iterative picking. Veri?cation means that if the
In the seismic art vocabulary, a horizontal section or time 60 amplitude of the picked trace is within the limits of tolerance
set by the user, the pick is accepted. Users can specify (on
slice is a horizontal slice or plane through the 3D volume of
a scale of 1-10) the degree of amplitude similarity they are
data. A plot of common attributes such as amplitudes of
willing to allow. If a pick does not pass this acceptance test,
seismic re?ection wavelets on x-y axes as a function of their
depth (or time) is similar to a surface topographic map, but
it is designated “dead” until at least one directly adjacent
of course such a plot is of a subsurface strata. Such a plot is 65 trace matches su?iciently to accept it.
More speci?cally, once a seed point is selected on a trace,
called a horizon. In other words, a horizon is a surface along
the trace is scanned up and down the z or time axis to ?nd
a bedding plane of a subsurface formation.
5,570,106
3
4
the local extrema amplitude or simply “extrema”. A local
extremum of a variable x,- where i is a digitizing index, is
seed point of the 3D seismic data. The variation in depth
(that is, time) from the seed point is indicated, for example,
by the color of the picked point.
de?ned as
As discussed above, there are several ways that certain x,
y areas of the horizon may not yield picked data. In other
tude of the trace in the case of a peak or a trough. Such
words, there are areas of a typical horizon where blank or
black areas are presented on the monitor display because of
a picking failure. Such failure might be due to a method
failure (as illustrated in FIGS. 4 or 5, 6) a score failure (as
discussed above) or a AT failure as illustrated in FIG. 7. An
extrema will typically vary with time a small amount. For
explorationist, when confronted with a horizon presented on
example, if To represents the seed point, T1 would typically
a screen observes areas which represent unpicked data.
represent the time of the extrema. Next, the time To is
started on the target trace. On it, the time is varied up and
down between zero crossings of its trace amplitude until the
nearest extrema T2 is found. Finally, the time T2 is used on
provided no means by which a user of a computer, which
Such scanning is bounded by zero crossings of the ampli
The prior art of horizon picking apparatus and method has
includes automatic picking software and which displays a
picked horizon on a CRT of the computer, may interactively
manipulate the horizon displayed on the CRT screen, espe
the trace on which the seed point exists and on such “seed”
trace scanning up and down the “z” axis is again performed
for the nearest extrema T3. If T3 equals T1, then iterative
tracking has been achieved and tracking continues.
FIG. 6 illustrates an example as to how an adjacent
wavelet may not be picked in the iterative mode. Notice that
the time T3 is beyond the zero crossing window of the seed
point To. Thus, the target trace is not picked.
The amplitude acceptance test tolerance of the prior an
iterative tracking mode de?nes a function,
l A‘
l
S- W Wh€f6
A,=Amplitude of the target wavelet of the target trace at T2,
and A1=Amplitude of the seed wavelet from the seed trace
at T1.
The value of S is bounded by values of O and l. The more
similar the two amplitudes, the closer the S function is to
zero. The more dissimilar the two amplitudes, the closer the
S function is to 1. Next, a score function is evaluated:
SCORE=(SX9.0)+ l.
The score is compared with a control value from 1 to 10
selected by the interpreter or user of the data. Scores greater
than the control value prevent a target trace from being
cially at areas where no horizon picks were made by the
automatic picking program.
20
IDENTIFICATION OF OBJECTS OF
INVENTION
25
A primary object of the invention is to provide a method
and apparatus by which a user may interactively manipulate
a horizon display on a CRT screen.
Another object of the invention is to provide a method and
apparatus by which a CRT displayed horizon may be inter
actively manipulated with a pointing device, such as a
mouse, in order to delete areas of the displayed horizon
which were not originally picked, with the option of auto
matically rescanning the deleted areas, or ?lling in the
horizon with interpolated data and smoothing the display
across boundaries.
SUMMARY
The objects of the invention as identi?ed above, as well
as other advantages and features of the invention are realized
in an apparatus and method including a computer program
used in conjunction with a horizon picking computer appa
ratus. Such apparatus and method scan 3-D seismic data to
produce a horizon starting from one or more user input seed
points. The horizon is displayed on a CRT of the computer
FIG. 7 illustrates a further horizon picking failure mode in 45 workstation. The display may be accessed interactively by
the user by using a computer pointing device, commonly
addition to the method failure mode discussed above with
called a mouse. Such mouse, under user control, controls the
respect to FIGS. 4 and 6 and further in addition to the score
position of a cursor on the screen.
failure mode discussed above. The At failure mode speci?es
A computer program according to the invention is pro
that an attempted pick is a failure if the difference in time
from the time of the picked wavelet to the time of the seed 50 vided with computer apparatus which works in conjunction
with the Horizon Picking Computer Program which has
wavelet is greater than a predetermined input At. Times of
been employed to automatically “pic " or track 3D Seismic
wavelets are usually measured at their maximum amplitude.
Data so as to display the horizon on the CRT. Areas of
FIG. 7 illustrates that in the iterative mode, a target wavelet
“dead” or bad data appear on the horizon display where
may satisfy the method picking test (i.e., iterative tracking is
proper) and the score test (depending on the user’s input of 55 picking failed.
a reference score), but if the AT measured between the time
In a delete and scan mode between horizontally or verti
of the target wavelet and the seed wavelet is greater than an
cally adjacent areas, the mouse is ?rst “clicked” on a ?rst
picked.
input reference AT, the pick fails.
After the tracking proceeds with each selected target trace
becoming a seed trace for selecting more target traces, a
“horizon” has been picked. The x, y and t (or z) coordinates
of each selected wavelet are stored in the computer memory.
A horizon is typically displayed on a CRT screen of a work
area of “good” horizon points and then dragged (i.e. with the
mouse button on) to and across a second area which includes
“bad” or non-existent horizon data. The method of the
invention as incorporated in the delete and scan computer
program deletes all the data points in the second or
“dragged” area, rescans all the ?rst clicked area and desig
station (a powerful computer adapted for specialized uses
nates picked points of such area as seed points. Such seed
such as seismic data interpretation, CAD/CAM work etc.). 65 points are used to expand the scan into the dragged area. The
The display is usually an x-y display of the seed point (or
picked points of the second or dragged area are then used to
points) and all the picked points which correspond to the
?ll in that space on the CRT display.
5,570,106
5
6
For dragged areas that are neither horizontal nor vertically
disposed with respect to the ?rst clicked area on the CRT
U.S. application Ser. No. 08/046,026 ?led Apr. 12, 1993,
now U.S. Pat. No. 5,432,751. Such patents and application
are incorporated by reference herein for their disclosure as
to automatic scanning or “picking”.)
In order to manipulate the displayed horizon, this inven
tion provides a user, by manipulating the mouse 18 and
controlling the cursor 20 on the monitor, with the capability
display, a stair step application of the basic delete and scan
method is used.
The program may be instructed, by clicking the mouse on
screen command buttons, to delete the points of the dragged
area, to rescan the points of the dragged area, to ?ll in the
dragged area with picked points of a certain depth, or to
smooth the picked points across a horizon boundary.
to change the horizon display. If a user observes areas on the
displayed horizon which were not picked, he may want to
10
delete that portion of the displayed horizon and rescan that
BRIEF DESCRIPTION OF THE DRAWINGS
area, or he may simply want to delete a section of the
horizon and later rescan that portion, or he may want to ?ll
The objects, advantages and features of the invention will
become more apparent by reference to the drawings which
in an unpacked area with the data corresponding to a certain
are appended hereto and wherein like numerals indicate like
15
elements and wherein an illustrative embodiment of the
invention is shown, of which:
FIGS. 1-7 were described in the BACKGROUND section
above;
horizon depth or he may want to smooth the depth display
between depth boundaries on the display.
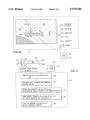
FIGS. 9, 10 and 11 illustrate the basic method of the
invention relating to the delete and scan procedure. FIG. 10
illustrates monitor 14 with function boxes 23 displayed on
the screen according to the manipulative function available
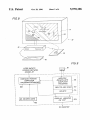
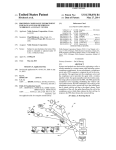
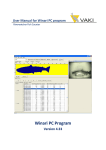
FIG. 8 is an illustration of a computer workstation with a 20 to a user. Each function is achieved by pointing the cursor
20 to one of the boxes 23 through manipulation of mouse 18.
horizon displayed on its monitor screen (CRT screen) and
With the cursor pointed to the delete and scan box of boxes
with a pointing device such as a mouse which controls a
23 and a “click” of button 18', a signal is sent to the Horizon
cursor superimposed on the screen;
Manipulate Computer program 50 of FIG. 9 that the delete
FIG. 9 is a schematic diagram illustrating the interaction
of a horizon manipulation computer program with other
programs for picking horizons from 3D Seismic Data and
and scan function, that is computer program 52 is to be
accessed upon the receipt of further data. The user may want
displaying such horizons on the CRT screen;
FIG. 10 is an illustration of a horizon displayed on a CRT
screen with a mouse-controlled cursor which is ?rst clicked 30
in an area of good picks and then dragged across an area
which includes bad horizon data;
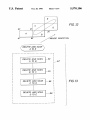
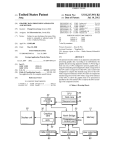
FIG. 11 is a flow diagram which illustrates how a delete
and scan function is performed by means of a computer
program; and
FIG. 12 is an illustration of a horizon having bad data
35
which is manipulated by a mouse controlled cursor in a
illustrating how the data is processed for diagonal manipu
button 18' to de?ne an “A” area as shown on FIGS. 10 and
11. Such click on the “A” area de?nes points A1, B1, C1 and
D1 of such area. Next, the user, while holding down button
DESCRIPTION OF THE INVENTION
18‘ of mouse 18, drags the cursor 20 to and across the area
FIG. 8 schematically illustrates a workstation 10 includ
24 of unpicked data. Such dragging of the cursor 20 speci?es
an area B de?ned by points A2, B2, C2 and D2. Points B1
and A2 and C1, D2 may be coexistent or they may be
distinct. That is, area A may be contiguous with area B, or
the two areas may be separated by a small distance between
such areas.
50
A hypothetical horizon 22 is shown presented on the
FIG. 11 illustrates a ?ow chart of the computer program
52 used to accomplish the delete and scan function from an
area A to an area B. Although area B is illustrated as being
horizontally to the right of area A, the method of the
screen of monitor 14. Such horizon is picked from a user
supplied seed point or points using a picking or scanning
computer program which manipulates 3D seismic data
size of the cursor to correspond to the approximate size of
the unpicked area. In other words, in the example illustrated
in FIG. 10, the vertical height of the cursor is made approxi
mately equal, through use of a zoom feature illustrated
schematically by Zoom box and arrows 25, to the vertical
height of the rectangular “box” of unpicked data immedi
ately to the right of the cursor. The user clicks amouse
40
ing a CPU 12, a CRT or monitor 14 and input devices
including a keyboard 16 and screen pointing device or
mouse 18. Mouse 18, through user interaction, moves a
cursor 20 to different positions on the screen of monitor 14.
Cursor 20 may be made larger and smaller on the screen by
means of computer program and user interface mechanisms
well known to computer programmers of ordinary skill in
the art of interactive computer controls.
Next, the user manipulates the cursor 20 to a position in
“picked” data (e.g., area 22") which is adjacent an area of
“non-picked” data, (e.g., area 24). The user manipulates the
diagonal direction, with a computer ?ow diagram of FIG. 13
lation.
to change the user inputs for picking relating to the method
picking, score, and AT. Relaxed values from those originally
used in picking the horizon may be desired.
55
invention is the same where area A is to the right of area B,
or area A is beneath area B or above area B. In each case,
areaA is in an area of picked data of a displayed horizon, and
area B is in an area of unpicked data.
stored in a data base of memory.
The two large cross hatched areas 22', 22" represent
FIG. 9 illustrates how the delete and scan program 52
picked points of a strata in the earth which have two different
interfaces
with the Horizon Picking Computer program of
60
depths. On an actual workstation monitor, such two different
U.S. Pat. No. 5,056,066 or U.S. Pat. No. 5,153,858. Such
areas would be presented in two different colors to represent
program 100 operates on 3D Seismic Data, using seed
such different depths. The areas of small cross hatching 24
points, to scan or pick the data of the 3D seismic data to
represent “holes” or areas on the horizon which were not
picked in the automatic picking method used to produce
such display. (The picking methods used to produce such a
produce the horizon display.
horizon are described in U.S. Pat. N 0. 5,056,066 issued Oct.
The scan and display program 52 of FIG. 11 receives its
input of points A1, B1, C1, D1 (that is area “A” as described
8, 1991, U.S. Pat. No. 5,153,858 issued Oct. 6, 1992 and
above) by the click action of button 18' of mouse 18.
65
5,570,106
7
8
Likewise the input of points A2, B2, C2, D2 is achieved by
picked points of a 3-D seismic data base, the method
dragging the cursor 20 across an area of unpicked points so
as to de?ne an area B. Such input is indicated by logic box
comprising the steps of:
directing a cursor of a pointing device to a ?rst area of said
70. Next, control in the program 52 is passed to logic box 72
horizon display adjacent a second area of said horizon
display, which is to be deleted, said ?rst area covering
at least a portion of an area of said horizon display with
where all points, picked points and unpicked points, within
the area de?ned by B1, B2, C2, C1 are deleted.
Control then passes to logic box 74. The points within
picked points;
de?ning a ?rst set of coordinates for said ?rst area by
area A are rescanned in the Horizon Picking program 100
and are designated as seed points. Such seed points are used,
under control of logic box 76, in picking program 100 to
pick points in the combined areas A and B. Next, such
picked points are used to ?ll in the space of A1, B2, C2, D1
(that is A and B and any space between A and B) with the
new picked data via display program 104, a program which
interfaces between the computer 12 and monitor 14.
FIG. 12 illustrates the delete and scan procedure accord
ing to the invention where a diagonal area of unpicked points
activating a control button on said pointing device;
10
de?ning a second set of coordinates for said second area
by dragging said cursor of said pointing device from
said ?rst area to and across said second area, said ?rst
area being contiguous with said second area to form a
combined area;
deleting all horizon points within said second area de?ned
by said second set of coordinates;
scanning all points in said ?rst area and designating all
points picked in said ?rst area as seed points;
24' is to be deleted and rescanned. In this case the cursor is
brought to area A in the picked data portion of the horizon
display. The cursor is then dragged, while continuing to hold 20
the button 18' down, so as to end, for example at area E of
using said seed points to pick horizon points in said
combined area; and
the graphical portion of FIG. 12. For such a diagonal case,
the stair step (horizontal, vertical) regions B, C and D are
automatically de?ned to correspond with the diagonal move
?lling in said combined area of said horizon display with
said picked horizon points from said combined area.
2. The method of claim 1 wherein
ment path of the cursor. The delete and scan program 52' 25
said ?rst area and said second area are horizontally
adjacent each other.
(labeled Delete and Sean A to E as shown in FIG. 13) then
performs the delete and scan function of program 52 under
control of logic box 82. In other words, the program iden
ti?ed by reference number 52 of FIG. 11 is performed from
the area A to area B. Next, the delete and scan function is 30
performed from area B to area C under control of logic box
84. Notice that such movement proceeds vertically from B
to C. Next the delete and scan function is performed from
area C to D control of logic box 86 and then from area D to
E under control of logic box 88.
3. The method of claim 1 wherein
said ?rst area and said second area are vertically adjacent
each other.
4. The method of claim 1 wherein
said ?rst area and said second area are diagonally adjacent
each other.
5. Apparatus for deleting and rescanning areas of a
horizon display on a computer monitor, where a horizon is
a topographic representation of a subterranean strata derived
The other functions identi?ed in FIG. 10 are related to the
from picked points of a 3-D seismic data base, comprising:
invention described. For example, the delete function is
achieved by clicking on the delete box of boxes 24 and
pointing device means for directing a cursor to a ?rst area
dragging the cursor 20 across an area to be deleted. The
program 72 simply deletes all picked points in such display.
40
Subsequently, the user may click on the box labeled rescan
of boxes 24, and after dragging the cursor across an area
which has been deleted, program 76 of ?ow chart 52 rescans
the deleted data. The ?ll function and smooth function of
boxes 24 respectively ?ll in a space of deleted data with the
same depth data as its surrounding area or interpolate depth
data, across a boundary of areas of two different depths.
Various modi?cations and alterations in the described
methods and apparatus will be apparent to those skilled in
the art of the foregoing description which does not depart
from the spirit of the invention. For this reason, these
changes are desired to be included in the appended claims.
The appended claims recite the only limitation to the present
invention. The descriptive manner which is employed for
setting forth the embodiments should be interpreted as
illustrative but not lirnitative.
What is claimed is:
1. A method of deleting and rescanning areas of a horizon
display on a computer monitor, where a horizon is a topo
graphic representation of a subterranean strata derived from
of said horizon display adjacent a second area of said
horizon display, which is to be deleted, said ?rst area
covering at least a portion of an area of said horizon
display with picked points;
control button means on said pointing device means for
de?ning a ?rst set of coordinates'for said ?rst area and
45
for de?ning a second set of coordinates for said second
area, said ?rst area being contiguous with said second
area to form a combined area;
computer program means for deleting all horizon points
within said second area de?ned by said second set of
50
coordinates;
computer program means for scanning all points in said
?rst area and designating all points picked in said ?rst
area as seed points;
55
computer program means for using said seed points to
pick horizon points in said combined area; and
computer program means for ?lling in said combined area
of said horizon display with said picked horizon points
from said combined area.
*
*
*
*
*