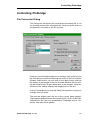
1
ARISTOMAT Serie
ARISTO Plotbridge
User Manual
Version 4.16
Copyright
ARISTO Graphic Systeme reserves the right to make any alterations or
improvements in the hardware, software and the manual at any time and
without any notice.
All rights reserved. This manual and no part of it may be reproduced or
stored in any form or by any means electronically, mechanically, by photocopying, recording, or otherwise (including private purposes), or stored
on any kind of data carrier, or translated without prior written permission
of ARISTO Graphic Systeme.
ARISTO Graphic Systeme reserves the right to claim recourse in cases
of violation.
ARISTO Graphic Systeme takes no manufacturer’s responsibility for improper
use of the hard- and software. This includes, for example, interference
with the hardware, passing on of data to third parties, loss of data by
erroneous erasure, etc.
If you decide to purchase the program after the adequate trial period
provided, you will henceforth use the program at your own responsibility
resp. your own risk.
ARISTO expressly reserves the right to decline further support for the
program at any time, or to decline responsibility for or any warranty claims
deriving from usage or eventual malfunctions of the product.
In any case, ARISTO´s liability for any possible faults or malfunctions of
the product and damages claims deriving from that, whatever their size
or nature may be, is limited in value by an amount of money representing
a full refund of the initial purchase price paid by the individual user.
The product is copyrighted and all unauthorised use and misuse is prohibited and may be prosecuted.
All legal procedures in connection with problems deriving from purchase
or use of the program are subject to the laws of Germany. Court of Jurisdiction is Hamburg, Germany.
ARISTO Graphic Systeme GmbH & Co. KG
P.O. Box 54 01 62 • D-22501 Hamburg
Schnackenburgallee 117 • D-22525 Hamburg
Fon: 49-40-547 47 - 0 • Fax: 49-40-547 47 - 111
Internet:www.aristo.de • e-mail: [email protected]
© 1999 by ARISTO Graphic Systeme GmbH & Co. KG
Contents
Contents
What does ARISTO Plotbridge do?............................... 5
Feature Summary............................................................................... 6
Getting Started ................................................................. 8
Installing Plotbridge ........................................................................... 8
CAD Designing for Plotbridge ........................................................... 9
A Short Tour of ARISTO Plotbridge ............................ 11
The Plot Preview Window ................................................................11
Getting Help ...................................................................................... 13
Loading and Converting a DXF File ............................................... 13
Assigning Lines to Different Tools .................................................. 14
Zooming ............................................................................................ 15
Shifting the Drawing’s Position on the table .................................. 16
Job Setups ........................................................................................ 17
Polishing your Plot ........................................................................... 18
Optimizing ...................................................................................................... 18
Circles and Arcs ............................................................................................ 19
Smoothing ...................................................................................................... 19
Joining Ends .................................................................................................. 21
Starting a Plot ................................................................................... 21
Restarting a Plot .............................................................................. 22
Using Frames ................................................................................... 23
File Conversion .............................................................. 26
File Formats ...................................................................................... 26
DXF Files........................................................................................................ 26
HPGL Files ..................................................................................................... 27
VectorWorks Script Files .............................................................................. 27
File Conversion Problems ............................................................... 28
The Drawing is Too Big or Too Small .......................................................... 28
Different colours are present in the DXF file than were expected. ........... 28
Non-standard Colours are found in the DXF file ........................................ 30
Checking for Problems .................................................................... 30
ARISTOPlotbridge V. 4.16
3
Contents
Saving and Loading Setups ......................................... 31
Loading a Saved Setup ................................................................... 31
Plotbridge Menus ........................................................... 33
The File Menu .................................................................................. 33
The Screen Menu ............................................................................. 34
The Setup Menu ............................................................................... 36
The Help Menu ................................................................................. 36
Controlling Plotbridge .................................................. 37
File Conversion Dialog .................................................................... 37
File Conversion Options .................................................................. 38
Drawing Scale ................................................................................................ 38
Tool Associations ........................................................................................... 38
Colour Remapping ......................................................................................... 40
Preserving Offsets in the Original Drawing ................................................. 40
Plotting Table Setup ........................................................................ 41
Setting the Screen Colours .......................................................................... 42
The Plotting Boundaries ............................................................................... 42
Plotting Output Setup ...................................................................... 44
Tidying up your drawings with Snap, Close Polygons and Optimize ........ 45
Using Arc Conversion ................................................................................... 46
Maximum Segment Size (Max. Seg. Size) .................................................. 47
Maximum Error (Max. Error) ......................................................................... 47
Break Angle ................................................................................................... 49
Fit to Tangents First ...................................................................................... 49
Machine Speeds/Variables Setup ................................................... 49
Tool Speeds ................................................................................................... 50
Machine Variables ......................................................................................... 50
Machine Type Setup ........................................................................ 51
Changing Machine Drivers ........................................................................... 52
Serial Port Settings ....................................................................................... 53
Machine Calibration ......................................................................... 53
Adjusting Tool Offset Values ........................................................................ 55
The Plot Dialog ................................................................................. 56
Using File Watch Mode.................................................................... 58
Running File Watch Automatically ............................................................... 59
ARISTO Plotbridge Registration ................................................. 60
4
ARISTOPlotbridge V. 4.16
Introduction
What does ARISTO Plotbridge do?
Plotbridge is a program designed to allow you to quickly and
efficiently read, convert DXF and HPGL files from most CAD
design packages and send them to virtually any sort of two dimensional plotter and/or cutting machine (including CNC machines)
connected to the serial port of your computer. Plotbridge will also
read and convert MiniCAD/VectorWorks Text files.
Plotbridge comes with a separate program called “Machseta.exe”
which can be used to develop or customise Plotbridge’s machine
driver files. End users and machinery manufacturers can easily develop
drivers for almost any machine by simply entering the appropriate
commands for each stage of the plotting or machining process. Please
refer to the separate documentation on Plotbridge Driver File Setup for more information.
ARISTO Plotbridge V. 4.16
5
Introduction
Feature Summary
• Plotbridge has been designed to provide a very simple user
interface so the day-to-day user will not be confused with an
array of options. The underlying power of the program is hidden
for normal use.
• Plotbridge is a WSIWG (What You See Is What You Get!) program. You can view the drawing as it will be plotted on your screen
in the Plot Preview Window.
• Plotbridge will select and separate the different lines in your
input file based on line colour (or Pen number), layer or thickness and assign them to up to ten different tools on the output
machine. These tools could be pens, blade cutters, routers, punches
- whatever your machine supports. Plotbridge can automatically
hide a specified colour or layer so that you can plot your files
without having to first remove design-specific information such
as dimension lines or annotations from the drawing.
• Plotbridge optimizes the drawing to reduce machine time by linking
matching end points. A user settable Snap parameter will even
join lines whose endpoints are not exactly the same to avoid
unnecessary Tool movements.
• Plotbridge can optionally convert curves made of line segments
back into arcs to allow super smooth curve cutting and better
machine speed control.
• Plotbridge will divide drawings longer than your machine into table
length frames that can be plotted/cut sequentially or individually.
You don’t need to fill your factory with a huge machine just to
handle the occasional big project! Plotbridge supports both manual
and automatic loading of new frames of material. In the case of
manual frames the program will pause to allow the next frame of
material to be drawn down by hand then continue with the click
of a button. Optional Alignment marks can be drawn at the ends
of each frame to enable you to easily align the material in the
next frame before continuing the plot or cut.
• Plotbridge will optionally close and smooth the common “chunky”
polygons produced from some drawing packages to provide the
smoothest curves regardless of your machine’s physical size.
• Drawings can be scaled and repositioned before plotting. You
can also run the machine’s head around the borders of your drawing
to ensure there is enough material for the job.
• You can quickly restart a job at any point by visually locating the
start location on the screen using Plotbridge’s “Plot From” feature.
6
ARISTO Plotbridge V. 4.16
Introduction
• File Watch mode allows Plotbridge to run as a background task
that will automatically load, ready to plot, any new DXF, HPGL or
VectorWorks Text output file saved by your CAD design software.
• Physical mounting offsets between pen and cutter heads are
automatically handled. Tool safety borders can be set to lift these
tools to prevent damage when plotting or cutting close to the
edge of the material.
• Up to 50 Setup configurations can be saved (including a long
description) and recalled instantly allowing you to change jobs
with all the conversion and plotting options, speeds and machine
variable settings for that job set with the click of the mouse button.
• Plotbridge comes as a fully functional 30 day evaluation package that you can try before you buy. Entering the registration
codes instantly removes the reminder screen and time limitation.
ARISTO Plotbridge V. 4.16
7
Getting Started
Getting Started
Installing Plotbridge
Simply run the installer program, Setup.exe. This will load Plotbridge
and other related files into the ARISTO Plotbridge directory on your
hard disk. The following files will be installed:
Plotbridge.exe
Plotbridge Program
Machseta.exe
Plotbridge Machine Driver Setup Program
*.dxf
Some sample DXF files
*.plt
Some sample HPGL files
MiniCad1.txt
A sample miniCAD text file
Readme.txt
Information about the program and how to
register
Release4.txt
The latest release notes for the current version
Setups
A directory which contains the saved setups
information
Drivers
A directory containing various same driver files
(*.pld)
Docs
A directory containing this Manual and Machseta.exe
manual
Splash.bmp
Splash screen of ARISTO Plotbridge
The Plotbridge icon will appear on your desktop and shortcuts will
be installed in your Startup menu.
8
ARISTO Plotbridge V. 4.16
Getting Started
CAD Designing for Plotbridge
When using your CAD program to design drawings that will be sent
to the plotter/cutter, there are a few points to remember to make it
easier to get the results you expect when plotting through Plotbridge:
1. Always use SNAP to ensure that end points are aligned. Even
though points may appear to be aligned at normal zoom settings, if you design without SNAP and then zoom in, chances are
you will find a small gap between end points. This may cause the
plotter’s pen or cutter to stop and lift at this point when you would
expect it to run through the intersection. Plotbridge has a
function that fixes this problem, but it’s good to get it right in the
first place!
2. Separate the parts of the drawing that you wish to draw, from
those that you wish to cut, by putting them on different layers or
setting them to different colours. Extra information in your
drawing such as dimension lines, notes and borders can be left
in the drawing if you also put them on a different layer again or
in a different colour from the draw and cut lines. Alternatively you
can disable these layers before exporting them and they will be
ignored by Plotbridge.
Some CAD packages automatically set different colours for
each layer. If yours does not, then you may have to do this
manually.
3. Be consistant with the use of colours in your drawing. For
example if all lines to be cut are always in red and all lines to be
drawn are always in green then you will not need to make any
changes to Plotbridge each time you use it. If possible, try to
stick to using the first nine colours (0-8) in your CAD program.
Plotbridge can handle any colours but will convert colours with
numbers greater than this into any unused colours in this range.
4. Any text that you wish to have plotted needs to be first converted
into lines or polylines before saving. Most CAD packages have
this feature.
5. Spline curves are best converted to a series of short line
segments often called a polyline or a polygon, if it is a closed
shape. These may appear a little “chunky” on the screen,
however Plotbridge can be set to smooth them when plotting.
6. If you are using AutoCAD, make sure all blocks are exploded
before saving or else they will not be plotted.
ARISTO Plotbridge V. 4.16
9
Getting Started
7. Save your file as a DXF format file before plotting. You can use
the same name that you normally use for the drawing with a .DXF
extension or the same name every time (eg PLOT.DXF). If you
choose the latter, you can have PLOTBRIDGE automatically
detect, load and convert this file ready for plotting. This is
covered in the section called File Watch Mode
8. If you are using MiniCAD/VectorWorks then saving your files in
“MiniCAD text” or “VectorWorks script” rather than DXF format
will result in smaller files and faster loading into Plotbridge.
10
ARISTO Plotbridge V. 4.16
A Short Tour of ARISTO Plotbridge
A Short Tour of ARISTO Plotbridge
To start Plotbridge, double click on the Plotbridge Icon. If you have
already registered the program, you will then see the Plot Preview
Window as shown below.
The first time you run the program it will ask you to enter your Name
and Company and to read and accept the conditions of use of the
program. If you accept, click on the Accept button. If not, you may
decline and the program will end.
When running an unregistered version of Plotbridge, each time that
you start the program you will be reminded as to how long you can
still use it before you need to register. In this case, click on the
Register Later button when it becomes enabled after a few seconds wait.
The Plot Preview Window
The coloured centre area represents the plotting area of your table.
The height of this area is the currently set Material Width. The
length of the coloured area is the length of your table or the currently set Frame Length. (These sizes can be changed in the Setup, Plotting/Cutting Dialog). If you have a long table you may not
be able to see the right hand edge of the plotting area. You can
change this by clicking and dragging on the border of the Plotbridge
window to change its size so that it is wider and not as high.
ARISTO Plotbridge V. 4.16
11
A Short Tour of ARISTO Plotbridge
On the right-hand edge of the window are the screen
display colours for each tool. To see or hide the tool
names click on the green arrow at bottom of that panel. In this example there are four tools: the display
colour for the first tool (the crease wheel) is yellow
and the next tool (the Cutter) is green and so on. The
tool names may be setup differently on your machine.
Note: These are the colours used to identify on the screen the lines
for each tool and are not related to the colours of the lines in your
DXF file. The screen display colours can be changed in the Setup,
File Conversion Dialog. (This notation means that to get to the dialog box you select the File Converion Menu Item under the Setup
pull-down menu.)
When plotting, Plotbridge always sends the drawing to the plotter
in the same order as the tools appear in this list. In this case, creasing
lines will be plotted first followed by Cutter lines then finally the
Pen. The order of the tools is setup in the Machine Driver Setup
Program.
12
ARISTO Plotbridge V. 4.16
A Short Tour of ARISTO Plotbridge
Getting Help
If you are not sure of what something is used for in the Plotbridge
program, select Show Hints from the Help Menu. After that, simply
move the cursor over an object anywhere in the program and a
short description of its use will appear.
Loading and Converting a DXF File
To load a DXF drawing file, click on the Open Button in the main
window. Make sure that the “List files of type” is set to DXF files
and locate the file that you saved from your CAD program or try the
sample “Cutcolor.dxf” file. Click OK to load and convert the file.
If some of your current settings are not suitable for the file that you
are loading then Plotbridge will alter the settings so that the drawing will be converted in a reasonable manner. It will then display a
warning message telling you about the problem.
The most common causes of these messages are discussed in the
File Conversion Problems section of the Reference part of this
document.
ARISTO Plotbridge V. 4.16
13
A Short Tour of ARISTO Plotbridge
Assigning Lines to Different Tools
Each Tool can be assigned lines from the loaded drawing based on
the colour or thickness of the line. You can change this in the Setup, File Conversion Dialog as shown below:
Clicking on color for a particular tool will open a pop-up menu of
possible colours. After a drawing has been loaded, only those
colours or line thickness’s actually present in the drawing will be
enabled in the pop-up menu Missing ones will be “greyed out”. So if
you are uncertain of what the colours are then open the drawing
first and then click on a Tool item and the popup menu will show
you which ones are present in the drawing. You can also display
the file in its original colours by selecting the Screen, Show Original Colours Menu in the Plot Preview Window.
Plotbridge also provides the “All Others” option so you can easily
set a particular colour for the first Tool and assign all other lines (by
colour or thickness) to another Tool. If you don’t want a tool to plot
anything, select None for that tool.
You can also choose a colour which will not be plotted or cut by
selecting its colour in the Hidden Lines are box. This is useful
when you want to prevent your design-specific information, such as
dimension lines or borders, from being plotted. Simply place these
on a separate layer in your CAD program and Hide the colour of
that layer.
14
ARISTO Plotbridge V. 4.16
A Short Tour of ARISTO Plotbridge
Zooming
If your drawing is too long to be displayed on the screen, you can
click on the Zoom Out button to squash up the horizontal axis by 2
times each time you click. You can also use the scrollbar at the
bottom of the window to slide your view along so you can see the
right hand end. This scrollbar only becomes active after a drawing
is opened.
ARISTO Plotbridge V. 4.16
15
A Short Tour of ARISTO Plotbridge
Shifting the Drawing’s Position on the table
When a drawing is loaded, it is normally placed in the bottom left
corner of the Plot Preview Window (See later section on Preserving Offsets in the Orginal Drawing). This also represents the bottom left corner of your Machine and the place where you would
normally like to start plotting/cutting from.
It is possible to change the position where the drawing will be plotted or cut. You can do this in one of two ways:
1. Enter the new offset values into the Offset X= and Y= boxes in
the status bar at the bottom of the window and press the TAB or
RETURN keys. Positive values of X move the drawing to the
right. Positive values of Y move the drawing upwards. You can
enter negative value.
2. Click anywhere on the drawing and, while holding the mouse
down, drag the drawing to a new start position. The values of the
offset positions in the Status Bar will show the new position.
Normally you can only drag the drawing in positive X & Y
directions. To drag in a negative direction, hold the ALT key
down while dragging.
Remember that any part of the drawing that is beyond the top or
bottom edges of the window or past the ends of the frame will not
be plotted.
16
ARISTO Plotbridge V. 4.16
A Short Tour of ARISTO Plotbridge
Note: Plotbridge will automatically offset the drawing in the Y axis
direction to allow all tools on your machine to reach the bottom left
corner of the material. For example if the second tool is mounted
100mm lower than the first tool. The drawing will be offset 100 mm
higher so the first tool can reach the bottom edge of the drawing.
Job Setups
Plotbridge allows you to save different Job Setups. Each setup contains
all the file conversion settings, plotter speeds and other values
related to a particular type of job.
The currently loaded Job Setup Description is shown next to the
Exit Button in the Plot Preview Window.
You can view and select other saved Setups by choosing the Setup, Load a Saved Setup. A list of all saved setups will appear in
alphabetical order. Notice that the currently loaded setup is outlined in red. Click on the line of the setup that you want to change
to and then click on the Load button to load that setup.
Before plotting, make sure the correct Setup is loaded for the
material that you are cutting.
ARISTO Plotbridge V. 4.16
17
A Short Tour of ARISTO Plotbridge
Polishing your Plot
To get the best results out of your plotting, Plotbridge provides a
few important features. These are Optimizing, Smoothing and Joining
Ends.
Optimizing
When Optimizing is turned on, Plotbridge will automatically order
your drawing as follows:
1. All objects (that is lines, arcs, and polylines) in the drawing will
be sorted such that objects with matching end points will be one
after another. The direction of the object may be reversed if
necessary. For example, if Plotbridge finds two line segments
with different start points but the same end points, it with reverse
the second segment so the lines will be draw in one continuous
move.
2. For each tool, the object whose start or end point is closest to the
bottom left corner of the table is drawn first.
4. After drawing an object, Plotbridge will then draw the next
closest object.
The result of Optimizing is that parts that are joined together will be
plotted together in one continuous action and the distance that the
plotter has to move to complete the plotting will be minimised, reducing the overall plotting time.
Optimizing can be turned on or off in the Setup, File Conversion
Setup Dialog. It is recommended that you normally keep Optimizing on.
18
ARISTO Plotbridge V. 4.16
A Short Tour of ARISTO Plotbridge
Circles and Arcs
Any circles or arcs in the input file are stored in Plotbridge in original format. Depending on the capabilities of your machine, Plotbridge will either output these using “Arc” commands to your machine or convert them to a series of line segments. In the later case,
the size of the line segments is proportional to the radius of the arc
or circle and the Curve Smoothness setting that you select in the
Setup, Plotting Output Dialog.
Possible settings are Very Coarse, Coarse, Medium, Fine or Very
Fine. This setting also affects the size of the resulting line segments generated for Smoothed Polylines as described in the next
section.
Even, if your machine does support Arc Commands then you can
turn this off for all arcs by selecting Convert Arcs and Circles to
polylines or just smaller arcs sizes by setting a maximum arc radius
for arc commands.
Smoothing
Many CAD packages output curved lines as a series of short line
segments joined together in a polyline. Depending on the scale used
in the original drawing, these segments may be quite long when
plotted on a big table and would produce a “chunky curve”. Smoothing
can be used to correct this problem.
Smoothing only works with polylines and polygons (polygons are
polylines that start and end at the same point).
ARISTO Plotbridge V. 4.16
19
A Short Tour of ARISTO Plotbridge
There are two values that you can enter that affect the way smoothing works. The first is the Angle. Smoothing will only be applied
between two line segments where the angular difference between
them is less than the set amount (20 degrees in this case).
The second is the maximum distance along each line segment from
their joining point where the smoothing is to stop. If the lines are
shorter than this distance smoothing will automatically stop halfway between two smoothed corners or at the end of a line with a
smoothed corner at one end only.
The following examples show the effect of smoothing with different
Angle and Distance Settings.
A: The original shape without smoothing.
B: Smoothing on with the angle set to 40° and a distance longer
than the line lengths.
C: Smoothing on with the angle set to 80° and a distance longer
than the line lengths.
D: Smoothing on with the angle set to 40° and a shorter distance.
20
ARISTO Plotbridge V. 4.16
A Short Tour of ARISTO Plotbridge
Joining Ends
If the end points of the lines in your drawings do not meet exactly
then a tool following the lines will stop an the end of the first line,
lift, move to the start of the next line, lower then start drawing or
cutting again resulting extra action that will slow down the plotting
time.
While the ends of adjacent lines may appear to be joined on the
screen, there may be a very slight gap between them. This usually
occurs if the drawing was created in a CAD system without using
“snap” to exactly match end points.
You can prevent this by entering a number greater than zero into
the above box in the Setup, File Conversion Dialog. A good value
might be between 0.25 mm and 1.0 mm however this depends on
the level of accuracy you need in your plotting and cutting. In this
case, if the end points of two lines are within 1.0 mm from each
other the end point of the first line will be moved to be exactly the
same point as the start point of the next line.
Remember that certain tangential tools (such as the pizza wheel
cutter and drag knife) will still stop, lift and turn if the next line’s
angle is sufficiently different.
Starting a Plot
To start a plot, click on the Plot Button or select then File, Plot
Menu Item. The Plot Dialog will appear:
ARISTO Plotbridge V. 4.16
21
A Short Tour of ARISTO Plotbridge
When you Click on the Plot button, the plotting/cutting commands
for the drawing are sent to the machine or to a file (if the Send to
File box is checked).
Restarting a Plot
You can use the Plot From Button to start or restart a plot from any
point in the drawing. To set the new start point, click and drag the
slider button in the Set Start Point Dialog Box while watching the
drawing in the Plot Preview Window. The part of the drawing to be
skipped will be redrawn in grey. When you reach the desired start
point, click on the Plot from Here Button.
22
ARISTO Plotbridge V. 4.16
A Short Tour of ARISTO Plotbridge
Using Frames
Frames allow you to plot drawings that are longer than your plotter
onto a continuous roll of material, one section at a time. In order to
enable frames, you need to have Use Frames checkbox set in the
Setup, Plotting Table dialog. You should also have the Plot Alignment Marks checkbox ticked so alignment marks will be drawn to
allow you to easily align each new frame of material with the last
With these settings, any drawings longer than the set Frame Length
will be broken up into frame sized pieces and plotted one after another. The effect of this can be more clearly seen on a long plotting
table if you use the Zoom Out menu commands. You can only select the next frame if it contains part of the drawing.
The length of the drawing in Frames is displayed in the status bar.
You can use the frames scroll buttons in the bottom right corner of
the Plot Preview Window to select any frame along the total drawing and either plot only this frame or from this frame to the end of
the drawing by selecting the appropriate button in the Plot Window.
ARISTO Plotbridge V. 4.16
23
A Short Tour of ARISTO Plotbridge
Plotbridge supports both Manual and Automatic loading of the next
frame of material. This is set in the Machine Driver File. If your
machine supports automatic frame loading then, at the end of
every frame Plotbridge will send the commands to the machine to
load the next frame of material followed by the plotting/cutting commands
for the next frame of material.
If automatic frame loading is not supported by your machine, you
have to do this manually! The program will pause at the end of
each frame so you can pull down the next frame of material. If you
have selected “Plot Alignment Marks” in the Setup, Plotting Table
Dialog, a pair of alignment marks will be drawn on the material at
the far end of each frame and you will see this message:
Pull the material down so the far end alignment marks are at the
start end of the table.
The Alignment marks consist of a pair of L shaped lines (approx.
7 mm x 7 mm) that are drawn on outside edges at the end of each
frame. The marks drawn on the next frame are an inverted L-shape.
The frame is correctly aligned when the corners of the two L’s touch.
24
ARISTO Plotbridge V. 4.16
A Short Tour of ARISTO Plotbridge
After completing each Frame, you should draw the next frame of
material down so the end-of-frame alignment marks close to the
start position.
Click on the Draw Alignment Marks Button to have the next frame’s
corresponding set of marks plotted. Not correctly aligned? Readjust the material and draw the alignment marks again. You can do
this as many times as you like. When the corners of the L’s touch,
the material is correctly aligned and you can click on the Continue
Button to start plotting the next frame.
ARISTO Plotbridge V. 4.16
25
File Conversion
File Conversion
File Formats
Plotbridge will read and convert DXF files, HPGL files and MiniCAD/VectorWorks text files. In all three cases it uses the line colour or line thickness of each object that it finds in the file to decide
which object should be handled by which tools on the machine. The
association between the drawing colours/thicknesses and the machine tools can be set in the Setup, File Conversion Dialog.
DXF Files
These are the “standard” Drawing Exchange Format files that can
be written by most CAD and many drawing programs. Most versions of DXF files do not contain any unit information about the
drawing. That is the values in the file are just numbers that may
represent millimetres or feet or miles! Plotbridge works internally in
millimetres and converts all values to these units. Therefore, you
must tell Plotbridge what the units of the original drawing are so
drawings can be converted correctly. This is done in the Setup, File
Conversion Dialog.
Plotbridge will recognises most 2D DXF drawing object including
points (locus), lines, polylines, arcs and circles.
The order of objects in a DXF file can usually bears no realationship to the shape. This fine if you viewing the drawing on the screen
or plotting it as a drawing, however it can be very inefficient if you
are cutting the shape with a machine. Plotbridge has an Optimise
function that fixes this problem and you can read about it in the
Setup, File Conversion Section.
26
ARISTO Plotbridge V. 4.16
Introduction
HPGL Files
HPGL stands for Hewlett Packard Graphics Language and these
filetypes are a common format produced by many drawing programs,
primarily to drive ink plotters. An ink plotter usually has one or more
coloured pens numbered pen 0, pen 1, pen 2 etc.
When reading these files Plotbridge automatically assigns each pen
number to a colour as follows (0) Default or Black, (1) Red,
(2) Yellow, 3 (Green), (4) Cyan, (5) Blue, (6) Magenta, (7) White,
(8) Gray.
Plotbridge will recognises the following HPGL commands: PU, PD,
PA, PR, SP, AA, AR, CI. All others commands are ignored.
HPGL file are usually, but not always, in HPGL units. These are 40
units/mm. You will find that HPGL Units are one of the available
options in the Units of Original File Pop-Up menu box.
VectorWorks Script Files
This is a compact format used by the VectorWorks (formerly MiniCAD) CAD program. Plotbridge recognised the following commands
in these files:
Moveto, Lineto, BeginPoly, EndPoly, Poly, ClosePoly, OpenPoly,
PenFore, PenSize, Rect.
Plotbridge looks for the occurance of the text "{MiniCAD" or “{VectorWorks” in the first 512 characters of the file in order to determine
if the file is a valid MiniCAD/Vectorworks file.
Curve commands are not supported so you should use the VectorWorks "Convert to Polygons" function before exporting as script
file for loading into Plotbridge.
ARISTO Plotbridge V. 4.16
27
File Conversion
File Conversion Problems
Plotbridge offers a range of options for converting and plotting files.
These are setup in the Setup, File Conversion and Setup, Plotting
Table Dialogs. Once setup, they can be saved in a Setup File (see
later section) for later use.
If some of your current settings are not suitable for the file that you
are loading then Plotbridge will alter the settings so that the drawing will be converted in a reasonable manner. It will then display a
warning message telling you about the problem.
If you see any messages when loading a file, you should
always check the drawing before plotting.
The most common causes of these messages are discussed below.
The Drawing is Too Big or Too Small
This usually means that the drawing was saved in units other than
those set in Plotbridge. For example, if the CAD drawing was saved
in Inches, but the Units of Original File were set to Millimetres,
then the drawing would be only 1/25th of the expected size. To correct this, simply change the Units of Original File in the Setup,
File Conversion Dialog.
Perhaps the drawing is just too wide for the currently set Material
Width. You can change this in the Setup, Plotting Table Dialog.
Different colours are present in the DXF file than were expected.
If you had set that all green lines were to be cut and all red lines
were to be drawn, but the DXF file only contained blue lines then no
lines would appear in the Plot Preview Window. In this case Plotbridge will set the first tool’s colour to one of the colours present in
the file and the second tool’s colour to All Others so the drawing
will be visible in the Plot Preview Window.
You can change these setttings after the file is loaded by altering
the Tool Association in the Setup, File Conversion Dialog as shown
in the picture below. For each tool (or pen in this case) you can set
a particular colour or thickness. All lines in your DXF file with that
colour or thickness will be drawn or cut by that tool.
28
ARISTO Plotbridge V. 4.16
File Conversion
Click on the Pen No/Colour/Thickness box for each tool to set
colour for that tool. A pop-up will appear showing a list of all the
colours. If you have already loaded a DXF file, then only the colours actually found in the file will be selectable, all others will be
“greyed out”. In this next example, all the lines in the drawing were
either red and white in colour.
You can use the All Others option to pick up any lines not already
assigned to a particular tool.
If you wish to not plot or cut a particular colour, then set the Hidden
Lines to that colour. This can be used to hide such things as borders, notes or dimension lines contained in your drawings.
You can also select lines by thickness. A thin line is one with a
thickness of zero. This is usually the default from most CAD programs. To be classified as a Thick Line, a line must have a thickness of one or more.
Note: Because all lines have both Colour and Thickness, it is possible to select the same lines for more than one tool. In the example at the top of the page, any thick red lines in the input file would
be drawn by both Pen and the Cutter. This may not be what you
expected!
ARISTO Plotbridge V. 4.16
29
File Conversion
Non-standard Colours are found in the DXF file
In a DXF file each colour has a number and Plotbridge only uses
colour numbers 0 through 8. If your DXF file contains lines with
colour numbers above number 8 then Plotbridge will convert (or remap) those colours into any unused colours in the 0 to 8 range,
starting with the higher colour number and working down.
For example, if grey (colour no 8) is not used, the first high numbered colour found will be converted to grey, the next high-number
colour will be converted to white (if not already used) and so on. If
you are not sure which colours are for which tool you can always
check the drawing on the Plot Preview Window and then reassign
them as previously explained.
Note: If you have more than nine different colours in your DXF file,
you will get some doubling up of colours, (that is, more than two
colours will be re-mapped to one colour) so it’s best to avoid this.
Checking for Problems
If you are importing a drawing for the first time or it is from a different source from normal, it is a good idea to have a closer look at it
before plotting. If you have multiple tools on your machine, then
lines drawn in the Plot Preview Window by a later tool can cover up
lines drawn by an previous tool. For example, if your drawing contained two rectangles of exactly the same size and in the same
position one for the pen and one for the cutter, you would only see
the lines drawn by the cutter as they would exactly cover the lines
drawn by the pen. You may not realise that they are present until
you actually start the plot!
To double check on a situation like this, after loading the drawing,
set the Tool Associations for all tools except one to None. In the
previous example, you would first set the Cutter’s Colors to None
and the Scorer’s colors to None in the Setup, File Conversion Dialog. Then only the lines to be drawn by the Pen would be displayed.
Happy with this? OK, now set all tools except the Cutter to None to
check what the cutter will be doing.
Repeat this for all tools then re-assign all the colours back to all the
tools to get the total picture before you start the plot.
30
ARISTO Plotbridge V. 4.16
Saving and Loading Setups
Saving and Loading Setups
You can save all of the settings from the Setup pages by simply
selecting the Setup, Save Current Setup. When saving, you can
enter a unique description for the setup to be saved and later load
that setup by referring to that description.
If the Setup, Save Setup on Exit Menu Item is checked, any changes that you make to the program’s setup will be saved into the currently loaded Setup when you Exit the program. The next time you
run the program, it will start with the settings as they were when
you Exited. If you do not want any changes made to the current
setup saved then uncheck this menu item by selecting it.
Note: Part of the settings that are saved include the machine driver
file name. It is therefore possible to change machine drivers simply
by loading another setup.
Loading a Saved Setup
To load a previously saved setup select the Setup, Load a Saved
Setup. All of the available setups will be displayed in Alphabetical
order as shown below:
The currently loaded Setup will appear outlined in a red border.
Simply click on another setup to load it.
ARISTO Plotbridge V. 4.16
31
Saving and Loading Setups
If you click on the “Arrow” Button in the bottom left corner, the dialog box will expand to include extra information about the saved
setups. This includes the setup’s ID number which is stored internally in the DXPLOTSU.INI file (where the setups are stored), and
the file name of the machine driver used with this setup.
You can save up to 50 different Setups. All setups are saved in the
file DXPLOTSU.INI located in the Setups Folder in the same folder
as the Plotbridge program. Having a large number of setups saved
will increase the time the program takes to start up. You should
therefore delete any unwanted setups using the Delete Button.
32
ARISTO Plotbridge V. 4.16
Plotbridge Menus
Plotbridge Menus
The File Menu
Use Open File to load a new DXF, HPGL or VectorWorks Text file.
This is the same function as theOpen button in the Plot Preview
Window.
Generally DXF files have a .dxf filename extension.
HPGL files usually have extensions of .gl, .hpg, .hpl, .plt, .igl.
Regardless of the filename extension of the chosen file Plotbridge
always checks if the file is a DXF type by looking for the SECTION
phrase near the beginning of the file. If this phrase is not found
Plotbridge then checks if the file contains either “{MiniCAD” or “{VectorWorks” and if found, loads the file as a MiniCAD/VectorWorks
Text file. Otherwise it assumes that the file is a HPGL file and tries
to convert it accordingly.
Clear Screen removes any loaded files and clears the display.
File Watch sets the program into background monitoring mode.
See Using File Watch Mode Section for more information on the
feature.
Plot Menu Item has the same function as the Plot Button on the
Plot Preview Window. It opens the Plot Dialog .
ARISTO Plotbridge V. 4.16
33
Plotbridge Menus
The Screen Menu
The Zoom menu items are used to expand or compress the horizontal axis of the Plotting Area display by factors 1, 2, 4 or 8. Setting the Zoom X Out to x4 will make the X axis one quarter the
normal size on the screen. The Zoom settings have no effect on the
plotting output.
Show Original Colors displays the colours used on the loaded file
rather than the selected colours used to indicate the different Tools.
You can use this to help you work out which colours used in the
drawing should be selected for drawing or cutting. You can then set
these in the Setup, File Conversion Dialog. This option only works
with colours; different line thickness’ are not displayed.
Show Arcs is only active if you machine supports Arc Commands
and they are enabled in the Setup, Plotting Output Dialog. When
checked, all arcs in the drawing are draw as black “pie slices”, showing
the extent and centre of the arc as shown below.
34
ARISTO Plotbridge V. 4.16
Plotbridge Menus
Show Tool Up Path. When selected, a small square is placed on
the drawing at every point when a tool will be lifted and a black line
is drawn showing the path of the tool when it is not drawing or cutting. This is useful for showing where the tool will start and stop on
closed shapes and whether the drawing needs to be optimized.
Only one of the above three menu items can be enabled at one
time.
Show Edge Clipping hides the parts of the drawing that will be
removed when the drawing is plotted. These are all those parts
outside the plotting boundary set by the Frame Size, the Material
Width (in the Setup, Plotting/Cutting Dialog) and the Tool Safety
borders (which are setup in the Machine Driver Setup program).
The diagam below shows the tool path of the original imported drawing
on the left and the result of optimizing on the right.
Status Bar. You can de-select this to hide the status bar at the
bottom of the screen if you want more screen area to display the
drawings.
Tool Colour Bar. You can de-select this to hide the Tool Colour Bar
and obtain more screen area.
ARISTO Plotbridge V. 4.16
35
Plotbridge Menus
The Setup Menu
The first part of the Setup Menu takes you to the Plotting and Cutting Setup Dialog which is in three parts. These are used to control
the way the drawing file is converted and output to the Plotter/Cutter. You can select them by either opening the dialog on any page
and then clicking on the appropriate tab leaf at the top of the form,
or jumping directly to a page from the Setup Menu.
The second part if the Setup Menu takes you to the Machine Setup
Dialog. This is used to set machine related variables such as speeds,
interface options and machine types.
The Help Menu
About... displays information about Plotbridge and its author. User
Registration information can also be found here.
Show Hints... enables the display of Hints on all windows and dialog boxes. Turn it on and place the cursor over most items to get
information on that item. Turn Hints off by selecting this menu item
again.
36
ARISTO Plotbridge V. 4.16
Controlling Plotbridge
Controlling Plotbridge
File Conversion Dialog
This Dialog sets the options for converting the incoming file. If you
are reading drawing files configured the same way each time you
will generally only need to set this up once.
Once you have finished changing your settings, click on OK to have
the new settings saved and the program return to the Plot Preview
Window. Alternatively, you can click on the Apply button and see
the effects of the change in the Plot Preview Window without leaving the Setup Dialog. To get a better look at the changes, move this
window to one side by clicking and dragging on its title bar.
Use the Cancel Button to close the Setup Dialog without saving any
changes that you made.
The next few pages cover the use of the various Setup options.
These options determine how the incoming DXF, HPGL or MinCAD/
VectorWorks Text files are interpreted by Plotbridge and so, ultimately, how they will be plotted.
ARISTO Plotbridge V. 4.16
37
Controlling Plotbridge
File Conversion Options
Drawing Scale
Units of Original drawing. This can be in millimetres, centimetres, metres, inches, feet or HPGL Units (40 units/mm). If your drawing
is none of these or you wish to change the scale, use the Other
option. When this is selected you can enter you own scale factor in
the box below. This can be between 0.0001 and 1000.
Remember, many DXF files do not include the scale of the original
drawing so, if you are not sure of this value, you should check the
resulting size of your drawing before plotting. These sizes are shown
in the bottom in the Status Bar of the Plot Preview Window.
If your drawing is obviously under or oversized at the currently set
scale, Plotbridge will make an intelligent guess as to what the units
should be and ask you if you want to change them. If the drawing
doesn’t seem to fit any of the standard units, Plotbridge will ask you
if you want to set the scale to make the drawing fit the current material width. You can turn off this option by un-checking the “Guess
Units and Show Warnings” checkbox.
Tool Associations
Each Tool can be assigned lines based on the colour or thickness
of the line.
Line Thickness. (This applies to DXF input files only). Thick lines
are any lines whose thickness is non-zero. The default in a DXF file
is usually for thin lines.
Colour/Layer. In DXF files the colour and layer are normally associated. That is, each layer can be assigned its own unique colour.
You can choose the colour of the lines for each Tool from the popup list.
After a drawing has been Opened, only those colours or line thickness’s actually present in the drawing will be enabled. Missing ones
will be “greyed out”. So if you are uncertain of what the colours are
then Open the drawing first and then click on a Tool item and the
popup menu will show you which ones are present in the drawing.
You can also display the file in its original colours by selecting the
Screen, Show Original Colours Menu.
38
ARISTO Plotbridge V. 4.16
Controlling Plotbridge
WARNING: Because lines have both thickness and colour, it is possible
to select the same line for more than one tool. For example, a thick
red line selected as thick for Tool 1 and red for Tool 2 would be
drawn by both tools. Likewise, you can select the same line for
different tools by specifying, for example, that both Tool 1 and Tool
2 use red lines.
Plotbridge supports the basic 9 colours. If the drawing contains other
colours, then Colour Remapping (see later section) will occur so all
colours end up being assigned to one of these basic colours.
When reading HPGL files, the Pen number is shown to the left of
each colour.
As HPGL files don’t associate a particular pen with a colour, Plotbridge does it for you! Use the pop-up list to see what Plotbridge is
using.
Plotbridge also provides the “All Others” option so you can easily
set a particular colour for the first Tool and assign all other lines (by
colour or thickness) to another Tool.
If you don’t want a tool to plot anything, select None for that tool.
Hide Colour. This feature overrides the above settings (including
the All Remaining setting) by hiding any lines that are of this specific colour or thickness. This facility is useful when you want to prevent your design-specific information, such as dimension lines or
borders, from being plotted. Simply place these on a separate layer
and hide the colour of that layer.
ARISTO Plotbridge V. 4.16
39
Controlling Plotbridge
You can plot certain lines more than once by assigning two or more
tools with the same colour/thickness. These may be actually the
same tool, depending how you have setup your Driver Commands,
allowing a set of lines to be “cut deeper”.
These are set by clicking and selecting on the Screen Colour boxes
in the bottom of the File Conversion Setup. These settings are saved
when you exit the program. Use the Default Button to restore these
to a standard set of colours.
Remember that the drawing’s original colours will be displayed in
the Plot Preview Window if you have Screen, Show Original Colours Menu option set.
Colour Remapping
When converting a DXF file, Plotbridge only works with the standard nine base colours. These are colour numbers 0 through 8. If
you have saved the DXF file from a CAD program supporting higher colour numbers (that is, colour numbers 9 and onwards), then
Plotbridge will change these colours to fit into the 0-8 range. It does
this by assigning the first high colour number to the highest free
base colour number. The next high colour number to the next highest free base colour number.
For example, if you have a drawing containing colour numbers 3, 7,
13, 100 and 240, colour 13 will be remapped to 8, 100 to 6 and 240
to 5. If you have more than nine different colours in the drawing
then all colours after the ninth will all be remapped to colour 0.
This system also applies to HPGL files containing pen numbers 9
and onwards. These pens are also remapped the same way.
Plotbridge provides a warning message when you load the file if
colour remapping is applicable.
Preserving Offsets in the Original Drawing
Normally Plotbridge will automatically remove any positional offset
in the original drawing and locate the drawing in the bottom left
corner of the plotting table. However, if your drawing contains an
offset that you wish to keep, you can check the Keep Offsets and
the drawing will be located on the drawing table with the original
offset provided that the offset does not cause any part of the
drawing to be located off the edge of the table area. In this latter case, a warning message will tell you that the offset is being
removed for this reason.
40
ARISTO Plotbridge V. 4.16
Controlling Plotbridge
Plotting Table Setup
The Frame Length and Material Width parameters are used to
set the size of one frame of Plotting Area. These affect the view of
the drawing in the Plot Preview Window.
You normally set the Frame Length to the physical length of your
table less any X axis offset amounts for the tools. This will ensure
that all tools can reach all parts of the table. This is dicsussed in
more detail in the “Plotting Boundries” Section below.
Material Width. This is the width of the material that you will be
cutting. Obviously it can be no wider than the plotter but may be set
to any width less than this. The scale of the Plot Preview Window is
automatically adjusted so its vertical size is the width of the material. Therefore, if your drawing extends off the top of the Plot Preview Window it means that it is too wide for the currently set Material Width. You should check that you have set the correct material
width and/or the conversion scale is correct.
Also see Using Frames, Curve Smoothing and Snap.
ARISTO Plotbridge V. 4.16
41
Controlling Plotbridge
Setting the Screen Colours
You can select the display colour for the Plotting table, the colours
used for each tool when the drawing is displayed in the Plot Preview Window.
The Plotting Boundaries
If the tools on your machine are not located at exactly the same
point (which will usually be the case if you don’t have a turret style
tool holder or a tool loader), the effective usage area of your machine will be reduced by the distance apart of the outermost tools.
For example, say that you have a machine with a pen and cutter
and the cutter is mounted higher by 100 mm and to the right by 50
mm of the pen’s position. If we assume that the bottom left corner
of the machine is the start point, then when the pen is at the bottom, left home position, the closest that the cutter can move to this
position will be 100 mm above and 50 mm to the right.
Therefore, in order to allow all tools to reach the bottom left corner
of the drawing, Plotbridge will automatically shift the drawing up
and to the right by the distance from the lowermost tool to the upper most tool and the distance from the leftmost tool to the rightmost tool. In the above case it will be up by 100 mm and across by
50 mm. You set the offset positions of each tool (relative to the first
tool’s position) in Driver Setup.
42
ARISTO Plotbridge V. 4.16
Controlling Plotbridge
Note that the X axis start position is the position of the rightmost
tool and the Y axis start position is the position of the uppermost
tool.
As can be seen in the diagram in the above diagram, the pen can’t
travel as far upwards or to the right as the cutter and if it tried, it
would hit the machines end-of-travel limit.
This can be avoided in two ways:
If you set the Frame Length of the machine to be the physical
maximum length less the horizontal (x-axis) distance between the
leftmost tool’s position and that of the rightmost tool, Plotbridge will
stop all lines at that point and continue them in the next frame.
Using the values of the previous example, you would make the frame
length 50 mm shorter than the table’s actual length.
Any part of the drawing longer than the Frame Length will be clipped
at that edge.
That takes care of the X-axis!
For the Y-axis, Plotbridge will clip any lines drawn by a tool when
those lines mean that the uppermost tool reaches the top edge of
the table as set by the maximum table width in the Driver Setup. In
the above example, pen lines will stop 100 mm short of the top
edge. If your material width is 100 mm or more, smaller than the
table width, then the pen will reach the top edge of the material.
Each tool can also be assigned a Safety Border that prevents movement
of that tool closer to the bottom or the top edges of the material (as
set by the Material Width parameter) by that amount. This value is
set in the Machine Driver Setup program.
The Safety Border can also be used to prevent a tool from running
over the edge of the material while plotting or cutting or to restrict a
wide tool from getting to close to the top or bottom physical limits of
travel of the machine. The Safety border for the first tool is visually
represented by the gray borders on the top and bottom edges of
the Plot Preview Window.
ARISTO Plotbridge V. 4.16
43
Controlling Plotbridge
Plotting Output Setup
The use of the Polygons and Polylines Section as well as the Arc,
Circles and Curves sections was covered in the previous “Tour of
Plotbridge” Section. Please also refer to the later Section on Arc
Conversion which describes using the Convert Polylines to Arcs
options.
Plotbridge supports the plotting of points (or Locii) if required. These
may be used to identify locations on the material for later reference. You can choose to either Ignore them, plot them as a Cross
or plot them as Point.
If Cross is selected then a small “X” about 10 mm across will be
plotted with its centre on the locii.
If Point is selected then the tool is simply lowered, then raised at
this point. This option should be used when you are controlling a
punching style tool and want it to do a single stroke on the point.
44
ARISTO Plotbridge V. 4.16
Controlling Plotbridge
Tidying up your drawings with Snap, Close Polygons and Optimize
Snap Value (see also Joing Ends) is used to remove any slight
errors with the alignment of the end points of the lines in your drawing that would normally cause the plotter to stop and lift the pen.
These errors are often found in drawings created without using snap
or a grid. A good value to have this set at is 0.5 mm. This setting
also affects the sorting and linking of lines by Plotbridge’s Optimizer.
Close Polygons. If checked, all polyline’s in drawing will be forced
closed. This is done by adding an extra line between the last point
and the first point in the polyline. Use this only if you know that all
shapes in your drawing should be closed (That is: the first and last
points are the same).
Optimize. If checked, all objects in the drawing will be sorted into
continuous paths, starting as close to the bottom left of the screen
as possible. Many CAD programs don’t connect the elements of a
drawing together in a logical way - especially if they were constructed
out of order. As an example, a rectangle in AUTOCAD could consist of four intersecting lines.
The lefthand drawing shows how the original file might be drawn.
Note: the corner points have been separated for clarity (or been
drawn badly off snap!). The right-hand drawing shows the results
of optimizing done by Plotbridge.
If you set Screen, Show Tool Up Path, you should see a fewer number of pen lifts “Dots” after optimizing is done. Optimizing is not
reversible, so once optimized, unchecking the Optimise box will
not “un-optimize” the drawing.
ARISTO Plotbridge V. 4.16
45
Controlling Plotbridge
Using Arc Conversion
Many CAD programs will convert any curves contained in a drawing into a series of small line segments when the drawing is exported or plotted to a file. While this is generally useful because
every machine supports this basic format, it does however, introduce some problems:
1. The smoothness of the curve is preset by the number of line
segments generated for the curve. There may be sufficient
segments to display a smooth curve on a computer screen, but,
if plotted on a large machine, the curve may be unacceptably
“chunky”. (This can also be rectified by using Plotbridge’s
Polygon Smoothing option.)
2. The drawing file will contain a lot more data and this may slow
down the plotting and/or cutting speeds on your machine.
If your machine supports arc commands, a better solution is to have
Plotbridge convert the line segments in a curve back into true arcs.
The Arc Conversion feature of Plotbridge is a powerful way to improve the smoothness and speed of plotting and cutting on your
machine.
The lefthand picture below shows the original curves as a series of
line segments. The righthand picture shows the arcs generated
after the conversion. (Screen, Show Arcs is on).
46
ARISTO Plotbridge V. 4.16
Controlling Plotbridge
To enable arc conversion, both Use Machine Arc Commands and
Convert Polylines to Arcs must be enabled in the Setup, Plotting
Output Dialog:
As seen in the previous illustration, when using Arc Conversion, it
is a good idea to have the Screen, Show Arcs menu checked so
you can visually check that the arc conversion process has produced the results that you expected.
Arc conversion is controlled by a number of adjustable settings:
Maximum Segment Size (Max. Seg. Size)
This sets the maximum length (in mm) of any line segment which is
to be included in the arc conversion process. Any lines longer than
this value will remain as separate line segments. For example, if
your drawing is a rectangle with rounded corners, you would set
this value to be a little less than the length of the straight side segments.
Because this value will usually vary with the size and style of drawing, you can have Plotbridge automatically estimate this value by
checking the"Auto" box.
Maximum Error (Max. Error)
This is the Maximum Positional Error that is allowed between the
original drawing points and any generated arcs from the arc conversion process. Setting this to a small number will generally produce a larger number of more accurate arcs. As you increase this
value, the number of arcs generated will decrease but so will their
accuracy. You need to decide where this balance should be based
on the final requirements of what you will be doing with the drawing.
ARISTO Plotbridge V. 4.16
47
Controlling Plotbridge
When setting this value, it is recommended that you start with a
small value (say 0.01 mm) and increase it until the minimum number of arcs are generated within an acceptable error.
The actual maximum positional error of the drawing after arc conversion is displayed to the right of this box. This value will always
be less than or equal to the Maximum Error value that you set.
Segmented arcs in DXF files will usually convert back to arcs with
little error because the point data in the file is stored as a real number (eg 54.2351234). HPGL files, on the other hand, are usually
already rounded to the nearest 40th of a millimetre and so will always generate some positional error when converted.
The follwing pictures show the effect of different Maximum Error
settings on the way arcs are generated in the same drawing.
48
ARISTO Plotbridge V. 4.16
Controlling Plotbridge
Break Angle
This sets the maximum angle change between adjacent polygon
segments that is allowed to be included in a converted arc. This is
used to disable arc conversion at the corners in the drawing.
Fit to Tangents First
Having this option on will cause the arc conversion to first try to
make the generated arcs tangent to any long lines in the polygon.
Generally arc conversion works better with this option turned off.
Machine Speeds/Variables Setup
In this Setup Dialog, you can set the speeds of the various tools
and the values of any Machine Variables associated with your machine.
ARISTO Plotbridge V. 4.16
49
Controlling Plotbridge
Tool Speeds
The speeds of each tool will initally be set to the default values
(contained in the Machine Driver File) for your machine. You can
override these settings in this dialog box and the new values can
be saved with the current Setup.
The units for the speed are defined by the way your Machine Driver
File is configured. Please refer to you Machine Supplier for information on this.
Machine Variables
Depending on how your Machine Driver File is configured, there
may be one or more Machine Variables. These are used to control
various settings on the machine. The values that you set can be
saved with the current setup.
To return all the values to their Default settings, click on the Set to
Default Values Button.
50
ARISTO Plotbridge V. 4.16
Controlling Plotbridge
Machine Type Setup
Plotbridge can be configured to control a wide range of single and
multiple tool machines. All of the parameters associated with a particular machine configuration are stored in a Machine Driver file
with the extension “.PLD” (eg. HPGL.PLD) which is located in the
Drivers folder in same directory as the Plotbridge program.
A number of example drivers files are be included with the Plotbridge general distribution package. It is possible to change these,
create new ones and make copies of existing drivers specially configured for different applications. This is done in the separate Machine Driver Setup program called Machseta.exe. You should refer
to the Manual for this program for more information about configuring machine drivers.
Some parameters stored in the Machine Driver file an be altered
from within Plotbridge. These are the Output Scale values, Tool
Offsets and Communication Port settings.
ARISTO Plotbridge V. 4.16
51
Controlling Plotbridge
Changing Machine Drivers
You can select another Driver file by clicking the Change Button in
this section. The following dialog will appear:
If you click on the right-arrow button, the dialog box will widen to
include a column containing the actual filename of each machine
driver.
Select the line containing the Driver that you wish to use and Click
on the Load button.
The selected Machine Driver can be saved with the current Setup,
so that loading a setup will automatically load another Machine Driver.
52
ARISTO Plotbridge V. 4.16
Controlling Plotbridge
Serial Port Settings
You can select which Serial Port on you computer that the plotter is
connected to as either COM1: to COM4:. This is done in the Setup,
Machine Dialog. To change the serial port parameters, click on the
Settings... button to see this dialog:
Check with your machine supplier for the correct settings applicable to your machine. For ARISTOMAT machines the display values
a recommended.
Machine Calibration
All position outputs sent to the machine for each axis are first multiplied by the output scale values shown in the Setup, Machine Dialog. For example if you are moving the pen to location (X=100,Y=50)
and the output scale values are set to X=10 and Y=10, then Plotbridge will output a move command to position (X=1000,Y=500).
If your machine is pre-calibrated (that is, it will moves exactly 1
millimetre on a move command with a 1 unit value) then the calibration values should be all set to 1.00.
If your machine is calibrated to HPGL units then the Output Scale
factors should be both set to 40. This is the number if HPGL units
per drawing millimetre. ARISTOMAT machines works with the factors 40.
Obviously, if these values are incorrectly set, your output will not be
the expected size!
ARISTO Plotbridge V. 4.16
53
Controlling Plotbridge
You should check with your machine manufacturer as to what values to use here. Alternatively, you can try plotting a drawing of known
size and measure the size of the resulting plot. The new output
scale values can be calculated by the following formula:
New Output Scale Value = Drawing Distance x Current Calibration Value
Plotted Distance
Alternatively, you can Click on Plotbridge’s Calibration button to get
the Calibration Dialog as shown below:
To use this, first enter the size of the Calibration Box that you wish
to plot. It should be less than the size of your maximum plotting
area and likely more than 1 m in each direction. A larger plot will
allow more accurate calibration. You can also enter the start point
so the box is plotted away from the edge.
Select the Tools that you wish to use in the Use Tools area. Generally you should use only one tool (such as the Pen, if fitted) to set
the machine’s Output Scale. You can then draw or cut with the other tools to make any corrections to each tool offset positions. So,
first let us look at the overall machine calibration.
Click on the Start Plot button to have the selected tool(s) draw or
cut a calibration rectangle. Measure the actual plotted size and enter
the X and Y values into the boxes under the Measured Size heading. Click on the Calculate button to recalculate the new X & Y Axis
54
ARISTO Plotbridge V. 4.16
Controlling Plotbridge
Output Scale values. You should then plot and measure again.
When the measured size equals the expected size then you have
the correct Output Scale figures. Clicking on the Use New Values
button when you exit this dialog will save the new output scale and
tool offset values in the Machine Driver file.
Adjusting Tool Offset Values
Adjusting is not necessarry for ARISTOMAT machines. The offsets
already adjusted in plotter firmware. All tool offsets are relative to
the first tool’s position which is assumed to have an offset of X=0
and Y=0. This cannot be changed. So in order to check for the
correct offset value setting of a tool, you need to use the first tool
and the tool being checked together.
To check the offset position of the Cutter in the above example, you
should first check both the Pen and the Cutter. When you click on
Start Plot the Pen will first draw the rectangle and then the cutter
should cut the rectangle exactly over the lines drawn by the pen. If
the cut line and the pen lines are not aligned then the tool offset
position for the cutter needs to be changed.
To do this, measure the X axis and Y axis errors. If the X position of
the Cutter line is too far to the right then you need to reduce the X
offset value by the error amount. If the Y position of the Cutter line
is too far to the top then you need to reduce the Y offset value by
the error amount.
In the above diagram, the cutter’s X position is 7 mm too far to the
right and 10 mm too low, so you would reduce the cutters X Offset
position by 7 mm and increase its Y Offset position by 10 mm.
To make these corrections click the Adjust Tool Offsets Button
and make the changes in the dialog box.
ARISTO Plotbridge V. 4.16
55
Controlling Plotbridge
The Plot Dialog
To start a plot, click on the Plot Button in the Plot Preview Window
or select then File, Plot Menu Item. (You must have a drawing
loaded first.) The Plot Dialog will appear:
The plotting options are:
Pen for all Tools: where Pen is the name for the first Tool on your
machine. Checking this box forces all lines to be plotted using only
the first tool regardless of the Tool Associations setup in the Setup,
File Conversion Dialog. This is useful if you want to plot the cut
lines instead of cutting them or to test run a plot with no plotting or
cutting.
Pause between Tools: The program will stop after each tool and
continue when you click on the Continue Button. Since the drawing is sent to the machine in Tool order, the lines for the first tool
are sent first followed by the lines for the next tool and so on. With
the Pause between Tools option selected Plotbridge will pause
after completing the lines for each tool. This is useful if you need to
manually prepare for the next Tool. Use the Continue button in the
progress box when ready to start the machine again.
56
ARISTO Plotbridge V. 4.16
Controlling Plotbridge
Send to File: This option will send the output to a file instead of the
plotter. This is normally only used to check that a machine has been
setup correctly. You will be asked for the name of the file when you
start the Plot. If you are using a HPGL style driver, then you can
load this file back into Plotbridge to see the actual output shape on
the screen. Remember, if you are plotting more than one frame,
the lines from every frame will be superimposed on each other!
User Buttons: Depending on your machine setup you may also
have up to four User Buttons and one User Option box. Selecting
these will cause special functions to occur. These items are setup
as part of the Machine Driver that you are using. Please refer the
Plotbridge Machine Driver Setup Manual for more information on
these.
The Show Bounds Button will cause the plotter’s head to move
around the smallest rectangle enclosing the drawing. This is useful
for quickly checking that the plotting will occur in the area of the
table that you expect. Remember, any portion of the drawing that is
beyond the edges of the set Material Width or Frame Length will
not be drawn. In this case, the edge of the Show Bounds rectangle
will stop at the table’s edges so you should always check that all of
your drawing is visible in the Plot Preview Window before plotting.
When you Click on the Plot button, the plotting commands are sent
to the machine or to a file (if the Send to File box is checked).
Frame Number. This is enabled if you have Use Frames set in
Setup, Plotting/ Cutting Dialog. You can plot all frames, the currently selected frame only or from the currently selected frame to the
last frame. Select the current frame using the Frame Buttons in the
bottom right corner of the Plot Preview Window.
The User Option checkbox and User Buttons will appear if they
has been setup with commands in the Machine Driver File. If the
User Option is checked, User Option Command Set is sent to the
machine at the start of each frame. Likewise clicking on one of the
User Buttons will send the Commands setup for that button immediately to the machine.
ARISTO Plotbridge V. 4.16
57
Controlling Plotbridge
Plot From allows you to start the plot from any point in the drawing.
The following dialog appears:
Sliding the scroll bar to the right will start to “black out” lines in the
drawing, starting from the first lines drawn till the start point. When
you reach the point where you wish to start the plot simply click on
the Plot Button. See the Short Tour or Plotbridge Section for more
examples of using the Plot From feature.
Using File Watch Mode
File Watch mode puts Plotbridge into background mode where it
periodically checks for a newly written version of a nominated drawing
file. When this file is found, Plotbridge loads the file and displays it
in the Main Window. You can then plot the file as normal. After
plotting Plotbridge hides the main window again and returns to File
Watch Mode.
With File Watch running, you can have easily plot a drawing from
another CAD package by simply outputting the drawing to a DXF or
HPGL file with the name as that which Plotbridge is watching for.
Remember you must output the file to the same name, disk and
directory as setup in Plotbridge.
When running in File Watch Mode Plotbridge displays the following
small window in the bottom right-hand corner of your screen:
58
ARISTO Plotbridge V. 4.16
Controlling Plotbridge
Use the Change... Button to change the name of the watched file
and Cancel to return Plotbridge to normal use mode.
You can put Plotbridge in File Watch Mode by selecting File Watch...
from the File Menu or from a command line as described in the
section Running File Watch Automatically
Running File Watch Automatically
Plotbridge can be automatically loaded and put in File Watch Mode
when you start your computer by executing the following command
line:
Plotbridge -a <watchfilename>
where <watchfilename> is the full MSDOS pathname of the DXF or
HPGL file to be watched. e.g. C:\Drawings\output.dxf
To have Plotbridge automatically startup this way when you start
Windows, you should do the following:
In Windows 95:
1. Click on the Start Menu, select Settings, then Taskbar.
2. In the Window that appears, click on the Start Menu Programs
Tab at the top.
3. Click on the Add Button.
4. In the new Window, enter the new Command Line:
C:\Plotbridge -a <watchfilename>
5. Click on the Next > Button.
6. Select the folder to put the item in as Start Menu -> Programs > Startup.
7. Enter the name as Plotbridge Startup, click on the Finish Button
and close all Windows.
8. You can check this is working by selecting Plotbridge Startup
from Start Menu-> Programs->Startup. You should see the
Plotbridge file watch mode window appear in the bottom right
corner of your screen. If you still haven’t registered, the registration window will appear first. Click the Cancel then Exit Buttons
to exit the program.
ARISTO Plotbridge V. 4.16
59
Plotbridge Registration
ARISTO Plotbridge Registration
Plotbridge is designed to allow you to evaluate it before deciding to
purchase. When you first run Plotbridge you will be asked to enter
your name and your company’s name and accept the terms and
conditions of use of the program. This information is used to generate a unique key code that is displayed in the Registration Window.
The number of days remaining in your evaluation period is also
displayed. After a short delay the Register Later button will be enabled.
Click on this to continue to use the program in Evaluation Mode.
When you decide to register, simply send all the information contained in the Your User Information box along with your payment to
the author. Plotbridge pricing is contained the Readme file that comes
with the program. If you wish to change the User Information before registering, click on the Change... Button.
You can continue to use the program in evaluation mode until you
receive your registration code.
After you have received the registration code, complete the registration process the next time you run the program by entering the
number in the box provided and click on Register Now Button. After doing this, the registration window will no longer appear when
you start the program.
60
ARISTO Plotbridge V. 4.16
Plotbridge Registration
You can use the Copy to Clipboard button to save the Your User
Information and the Mail, Fax and Email details of ARISTO Graphic Systeme ready for Pasting into your Word Processor.
ARISTO Plotbridge V. 4.16
61
ARISTO Graphic Systeme GmbH & Co. KG
Postfach 54 01 62 • 22501 Hamburg
Schnackenburgallee 117 • 22525 Hamburg
Tel.: 040-547 47 - 0 • Fax: 040-547 47 - 111
Internet:www.aristo.de • e-mail: [email protected]
Frankreich
INTEGRAL TECHNOLOGIE SARL
1, rue Montespan
F-91024 Evry Cedex
Tel.: 0033-1-64978182
Fax: 0033-1-64978166
Issue 12.99
Art. No. 0000 182..
Österreich
ARISTO GRAPHIC SYSTEME
Ges.m.b.H.
Jakob Prandtauer Str. 1
A-6300 Wörgl
Tel.: 0043-5332-787335
Fax: 0043-5332-787333