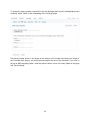
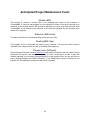
1
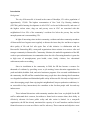
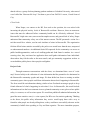
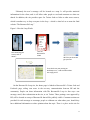
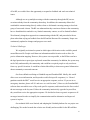
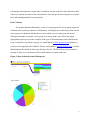
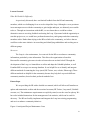
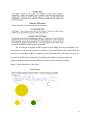
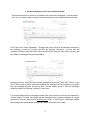
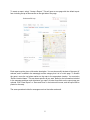
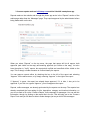
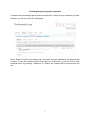
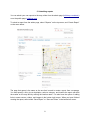
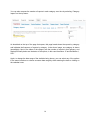
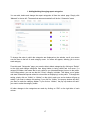
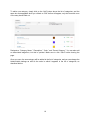
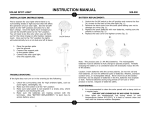
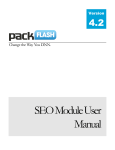
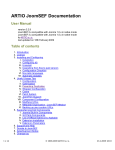
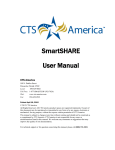
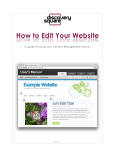
 Final Report – Crowd Sourced City Aisha Qamar Danielle Dowler Norabelle Greenberger Stephanie Servetz 15 December, 2011 Introduction
Background
The city of Brownsville is located in the center of Brooklyn, NY with a population of
approximately 117,000. The highest concentration of New York City Housing Authority
(NYCHA) public housing developments in all of NYC are located in Brownsville, and some of
the highest violent crime, drug use and poverty rates in NYC are associated with this
neighborhood. Over 50% of the community’s residents live below the poverty line, and the
unemployment rate is an astonishing 32%.
In light of increasing crime in their community, residents and other community members
of Brownsville have begun to meet regularly to discuss the issues they face and how to improve
their quality of life and feel safe again. Part of this initiative is collaboration with the
Brownsville Partnership (BP), a non-profit organization whose mission is to create a safer and
stronger community in Brownsville. Community Solutions, the umbrella organization of the BP,
works to prevent homelessness in communities where the risk of becoming homeless is great due
to high rates of unemployment, poor health, crime, family violence, low educational
achievement, and overcrowding.
Since its installation in the community in 2008, the BP has become a resource for
thousands of residents by providing access to job training, better education opportunities for
youth and adults, healthier food, and social assistance programs. Now a trusted establishment in
the community, the BP staff has remarked that many people have been sharing their frustrations
over degraded conditions and diminished public safety in Brownsville. Not only are high rates of
crime discouraging people from enjoying their neighborhood, but poor pedestrian conditions (i.e.
no crosswalks in busy intersections) also contribute to the fact that people walk less and stay
indoors more.
These informal discussions with community members have been very helpful for the BP
staff to understand their concerns, but without a formal tool to measure them, their ability to
effectively advocate for better public safety and take action is limited. As a non-profit
organization, the BP has already maximized the capacity of its staff members and has limited
financial resources to create an effective tool for advocacy. These concerns and objectives were
1 shared with us, a group of urban planning graduate students at Columbia University, who created
a tool called the “Brownsville Loop” for them as part of our Fall 2011 course, Crowd Sourced
City.
Client Needs
When Nupur, our contact at the BP, first took on her position, she was tasked with
increasing the physical activity levels of Brownsville residents. However, there are numerous
issues that must be addressed before community health can be effectively addressed. Given
Brownsville’s high crime rates, uneven and incomplete streets, and general lack of safety, Nupur
understood that community safety was of the utmost concern. The BP presented a vision for a
tool that would be a website, used to track incidents of crime in Brownsville. The organization
felt that official crime statistics recorded by the police were much lower than the true, unreported
or undocumented numbers. An additional desire BP expressed for the community was access to
public health opportunities, such as safe walking paths and fresh farmer’s markets. As a crowd
sourcing class, they envisioned an application that could gather information from individuals
about where they felt the safest or the most unsafe, and get community suggestions on how to
create healthier public places where people could gather.
Project Goals
Through numerous conversations with the client, we determined that a sort of “crisis
map” devoted solely to the collection of crime information had the potential to be detrimental to
the Brownsville community psyche and image. We then shifted our focus to creating an online
community space where people could share information about what’s happening in Brownsville.
The focus would be on information sharing, similar to how Facebook encourages people to keep
friends informed of what’s happening in each other’s lives. In Brownsville, this would include
information such as the best restaurants in town, planned community events, places where public
safety is a concern, as well as crime reports. We would not publish all submitted information, but
guard the more sensitive ones (i.e. crime reports) for BP to use for statistics gathering. Thinking
to the future, the public safety information they receive would equip them with a way to
formalize what people are already telling them, so they could more successfully advocate on the
community’s behalf when speaking to City and State agencies. The more immediate purpose,
2 though, would be to keep the BP informed about news in the neighborhood and encourage a new
form of community interaction.
While developing the website, there were a number of considerations. Some of the
information BP sought to gather is very sensitive, so it was imperative that the language of the
site encourages people to share information and not “snitch” on others in the community.
Therefore, anonymous input and control over site content were major factors stressed by the
client. Although many residents in the community have blackberries and other smart phones, one
requirement of the site was to provide multiple ways in which one could share information, such
as directly on the site or via email. Finally, since the website would be promoted as an
information-sharing tool, it was also important to the client that there was room for feedback and
comments or suggestions from the community on others’ reporting or other general information
shared on the site. With limited resources within the BP organization, it was also important that
the site was low maintenance, requiring little to no money to operate and maintain, and little dayto-day maintenance to keep it running.
The Solution: The Brownsville Loop
Given the needs of the community and the BP, we determined that data could be best
visualized and contextualized using the Ushahidi platform. This form of crowd sourcing
information was born out of a need for information sharing in a crisis situation. In fact, it was
developed as a crisis mapping application to facilitate the connections between responders and
victims during disaster-type situations.
Although we didn’t want to create exactly a crisis map, the platform was a perfect fit for the
goals of this project. After reviewing some of the Ushahidi-based websites, such as the map
created during for Haitians in the aftermath of the 2010 earthquake, we realized how diverse the
site was and how pertinent its applications were. Even though in our case, BP will control the
site content, there is a rather immediate visible response when someone shares information.
Using a Frontline SMS texting database, text messages sent to a designated phone number get
redirected to the website. It is a relatively user-friendly program for people without advanced
technical skills, so this was a good option for a non-profit organization with limited resources.
3 Ultimately the user’s message will be located on a map. It will provide statistical
information for the client, and it will allow other people to read and comment on what was
shared. In addition, the site provides space for Twitter feeds or links to other news sources,
which is another way to keep everyone in the loop – which is what led us to name the final
website “The Brownsville Loop.”
Figure 1: How the Loop Works
See something you want to tell us about? There is a street light out. I feel unsafe
Text the Brownsville LOOP
We’ll let you know we got your text
Then check out your posting on bvilleloop.com … And see what others are saying too!!!
On the Brownsville Loop site, the home page is linked to Brownsville’s Twitter feed and
Facebook page, aiding even more in the two-way communication between BP and the
community. People can share information with The Brownsville Loop in four ways: text
message, email, direct submission on the site, or via Twitter. These postings, once approved by
BP, will be located on a map of Brownsville that will be publicly visible. Comment sections are
provided for each message to encourage people to elaborate on what others post, should they
have additional information or other opinions about the topic. There is a place on the site for
4 feedback as well, so if anyone has suggestions on how to improve the site or other ideas, they
can send them directly to the BP administration.
Figure 2: Crowdsourcing Data for Advocacy
Finally, the site is a very low maintenance application that only requires one person to check
messages daily and post on the site. Considering that this is not a crisis map and that daily is not
expected to be extremely high, this is a reasonable option at this time. The site is also very cost
effective. There is an up-front cost of $20 for a modem that is necessary to receive and manage
incoming text messages for the website. There is an annual fee of $10 for the website’s domain
name. And there is a monthly fee of $30 for an unlimited text messaging data plan (sending and
receiving).
Challenges
Brownsville Partnership and the Community Challenges
The primary goal of the project was to develop a tool for Brownsville through a
collaborative process with the community. We anticipated regular meetings with BP and the
community in order to obtain ideas and feedback for our product - not only to determine the
direction our project would take, but also to refine it using community input. Through interaction
with community, we believed that we could build some level of trust and willingness to use our
product once implemented. In addition, without properly testing the website before handing it
5 off to BP, we wouldn’t have the opportunity to respond to feedback and work out technical
issues.
Although we set up multiple meetings with the community through the BP, on two
occasions nobody from the community showed up. In addition, the community did not feel
comfortable communicating directly with us when we did attend a meeting among a close-knit
group of concerned citizens. The BP was adamant that they remain our liaison to the community,
but we found that this resulted in very limited community contact, as well as limited feedback.
We ultimately changed our approach to communicating with the BP, and proceeded with our
plans rather than relying on feedback from the BP and the Brownsville community. Nupur was
continuously updated as changes and progress were made.
Technical Challenges
We originally envisioned a system in which signs with location codes would be posted
around Brownsville. People could then text information and the location code to allow for
precise information mapping. However, this system was not possible, as the BP does not have
the legal permission to post signs or placards around the community. In addition, the system may
not be fully understood by the community and would have required people to only send texts
from very specific locations. It would have limited the ability to share more general information
about community events and concerns.
Our focus shifted to utilizing an Ushahidi map and FrontlineSMS. Ideally, this would
allow users to text information, and keywords would elicit specific responses (i.e. “I heard
gunshots outside the BRC” would receive an appropriate response, such as “If you are in an
emergency situation, please call 911 and move to a safe location.”) However, the FrontlineSMS
software does not enable to use of keyword-specific responses, and instead uses the first word of
the text message as the keyword. Unless the community instinctively types the keyword first,
they would not receive the appropriate response. We decided to choose a generic response to all
messages instead in order to simplify the communication until an alternative and improved
system is in place.
Our technical skills were limited, and adapting the Ushahidi platform for our project was
challenging. We needed to make the website user-friendly and accessible for the BP staff that
6 will manage and implement it in the future. In addition, the site needs to be time-efficient so that
it does not consume too much of the staff member’s time if people do start using this on a regular
basis and sending hundreds of messages daily.
Data Collection
Our original timeline allotted three weeks as a testing period for a focus group comprised
of Brownsville community members. Unfortunately, Al Sharpton was in Brooklyn at the time the
focus group was scheduled, and therefore we were unable to get a testing group for the site.
Subsequent attempts to organize a focus group were unsuccessful, and we therefore began
prepopulating the map to provide examples of the type of information that can be shared on the
Loop. Testing the Loop within our group, we found that the [email protected] address we
created is not compatible with Ushahidi. The new email address, [email protected], was then
linked and now the emails are able to go directly to the site. The BP staff has slowly started to
text and we hope to see an increase in the overall number of reports on the site.
Figure 3: Data Collected from bvilleloop.com
7 Lessons Learned
What We Would Do Differently
As previously discussed, there was limited feedback from the BP and community
members, which was challenging for us as we developed the Loop. Although we were persistent
in our attempts to meet with the community to gain insight and input, we ultimately were unable
to do so. Through our interactions with the BP, we now know that we could have taken
alternative routes to receiving feedback and testing the Loop. If presented with the opportunity to
start this project over, we would have performed outreach to youth groups and other community
members earlier. Rather than relying on the BP as a link to the community, we believe that we
could have taken more initiative in researching and identifying stakeholders and reaching out to
different groups.
Successes
The Loop is a low-maintenance, low-cost tool for the BP to crowdsource community
information, particularly crime information. This allows the organization to formalize
Brownsville community grievances in order to better advocate on their behalf. Through the
development of the Loop, we learned how to utilize and adapt the Ushahidi platform, as well
FrontlineSMS to set up a text message database. It was helpful for us to identify and integrate
different methods of contacting the Loop (email, BP Twitter, text, website, iPhone app). These
different methods are helpful for the community because they help the Loop reach different
community members, based on their preferred method of use.
Future Steps
We are providing the BP with a detailed user manual, which will allow staff members to
update and maintain the website and the associated accounts (BP Twitter, Loop email, Ushahidi
account, etc). The maintenance requirements are explicitly stated, as are the costs for upkeep. We
have also included instructions for the management of site statistics, which can be used for
advocacy. The BP can feasibly implement and integrate the Loop into existing programming
and use it to enhance community initiatives.
Figure 4: Anticipated Project Maintenance Costs
8 The overall goal is to allow the BP to capture what is taking place at the community level
in a formal way to then quantify and use for advocacy. We hope that these tools will facilitate the
use of the Loop and help the BP in community safety and health efforts. The Loop will serve as a
resource for the BP and the community, facilitating stewardship, promoting community
engagement and empowerment, and ultimately, lead to positive community change.
Figure 5: Report Statistics for Advocacy
9 References
Community Solutions. “The Brownsville Partnership.” 2011. Web. Accessed October 2011.
http://cmtysolutions.org/projects/brownsville-partnership
Ushahidi. 2011. Web. Accessed October 2011. http://ushahidi.com/
FrontlineSMS. 2011. Web. Accessed October 2011. http://www.frontlinesms.com/
10 User Manual
1
Day to day operations
2
1. Log into the admin side of bvilleloop.com
bvilleloop.com/admin
username: admin
password: admin
3
2. Access messages sent via text, email and twitter
All reports that were not posted on the website are received as “messages.” From the admin
site, you can classify them as “reports” and localize them on the website’s Brownsville map.
On the top menu, select “Messages”. The page that opens will show all messages received by
text message in order by the time received. By selecting “Reporters,” you can view the
messages sorted by who sent them. Each reporter will be listed (by their phone number) with
the number of messages they sent listed below.
Messages sent via email and twitter can be accessed by selecting “Email” and “Twitter” on the
menu. When either of these options are selected, the messages will be displayed in the same
way: all messages received, in order by date. You can always choose to view the messages
sorted by reporter by selecting “Reporter” on the menu.
For each message listed, the message, sender, date, and actions you can take are displayed. If
“Create a Report” is listed, this means that the message has not yet been classified as a report
(and has not yet been placed on the bvilleloop.com map). If “View Report” is displayed instead,
this message has already been classified as a report and posted on the map.
4
To create a report, select “Create a Report.” This will open a new page with the default report
form including a map of Brownsville on the right side of the page.
Each report must be given a title and a description. You can also modify the date of the report (if
relevant, and if included in the message) and the category that it is in on this page. To localize
the report, move the red place marker on the map to the appropriate location. You must also
“Refine Location Name.” This can be as specific as you want, based on the information included
in the message and how much disclosure you want. All other form fields on the report page are
optional. Click “Save Report” or “Save and Close” in the bottom left corner, and the report will be
posted on the map.
The same procedure holds for messages received via twitter and email.
5
3. Access reports made on bvilleloop.com and the Ushahidi smartphone app
Reports made on the website and through the phone app arrive in the “Reports” section of the
admin page rather than the “Messages” page. They require approval by the administrator before
being made public on the site.
When you select “Reports” on the top menu, the page that opens will list all reports, both
approved (and visible on the map) and awaiting approval (not visible on the map). You also
have the option to “Verify” reports, but reports both verified and unverified will be visible on the
map. This is simply a further measure to confirm/classify the reports.
You can approve reports either by checking the box to the left of the report and selecting
“Approve” on the above menu, or by simply selecting “Approve” to the right of the report.
If “Approve” is green, the report has already been approved. If it is blue, it has yet to be
approved. If you click on a green “Approve,” you will unapprove the report.
Reports, unlike messages, are already geolocated by the reporter on the map. The reporter has
already completed the form asking for title, description, category and location information, so
you do not need to fill out the “Create a Report” form necessary for messages. You can edit this
information, though, by clicking on the report title in the list. This will bring you to the “Create a
Report” form and you will then be able to make changes just as you did for the messages.
6
4. Deleting/Unapproving report comments
Comments are automatically approved when posted online. If there are any comments you want
to delete, you can do so from the admin page.
Select “Reports” from the top heading, and “Comments” from the subheading. All comments will
be listed. To view the comment and the report that it is in reference to, you can click on each
individual report. By selecting “Unapprove” or “Delete” the comment will be removed from the
site.
7
5. Submitting reports
You can submit your own reports to the map, either from the admin page (bvilleloop.com/admin)
or on the public page, bvilleloop.com.
To submit a report from the admin page, select “Reports” on the top menu, and “Create Report”
on the menu below.
The page that opens is the same as the one that is used to create a report from a message.
You must specify a title, give a description, select a category, and localize the report with both
the marker on the map and by refining the location name. You also have the option of adding
links to news sources, videos, and images in the bottom right corner. When you have finished
creating the report, select either “Save Report” or “Save and Close” in the bottom left corner.
8
If you choose to submit a report on the public website, bvilleloop.com, select “Keep Us in the
Loop” on the top menu or “Submit a Report” in the upper right corner. You will be directed to a
page very similar to the admin “Create Report” page. When you have filled out all necessary
form fields, select “Submit” on the bottom of the page.
9
6. Submitting comments
If you want to comment on reports, you must do this from the public site (bvilleloop.com), not
from the admin site. On the homepage of the site, either click on the report in the “Reports” box
below the map, or click on the marker on the map, and then on the title of the report that pops
up (the image below shows the pop up box that has been displayed after clicking on the
marker).
When you click on the report (on the map, or in the reports box), a new page will open,
displaying the report details.
To submit a comment, simply write it in the “Leave a Comment” box that appears on the left,
enter the security code below it, and click “Submit Comment.”
10
Report statistics
11
1. Accessing site statistics
There are a variety of ways that you can get statistics about site usage and reports from the
admin page. To do so, click on “Stats” on the top menu.
The first page that will open shows the statistics of visitors to the site, broken down into three
categories: unique visitors, visits, and pageviews (definitions of these three terms is displayed
on the bottom left corner). In the menu above the graph, you can select the date range that you
want statistics for. You can simply select “1 Month,” “3 Months,” “Six Months,” or “All,” or you
can specify dates by either entering the date ranges in the fields to the right or by clicking on the
calendar icons next to the entry fields.
12
2. Report statistics
You will most likely be interested in gathering statistics on the reports that have been submitted.
There are a number of different ways that you can do so. The first is by selecting “Report Stats”
on the top menu.
The first chart on this page compares the types of reports that you are getting by category. In
this instance, since all of the reports are related to streetlights, the pie chart is 100% streetlight
reports. The two smaller charts below compare verified versus unverified and approved versus
unapproved reports. Again, in this image 100% of the reports are unverified (so the circle on the
left is entirely yellow), and 100% of the reports have been approved (so the circle on the right is
entirely green).
Just as you were able to do on the previous stats page, on the menu above the charts, you can
select the date range that you are interested in.
13
You can also compare the number of reports in each category over time by selecting “Category
Impact” on the top menu.
As described on the top of the page that opens, this page breaks down the reports by category
and indicates the frequency of reports by category. In the above image, one category is shown
(streetlights). Next to the name of the category are the number of reports in that category, and
displayed lineally below are the dates of the reports, in this case November 15 and December 1,
2011.
Again, to change the date range of the statistics being shown, you can select any of the options
in the menu bar above or choose a custom date range by either entering the date or clicking on
the calendar icons.
14
For statistics on when people are submitting reports most often, select “Report Punchcard” on
the menu bar.
The y-axis displays the day of the week on which reports were submitted and the x-axis displays
the time of day. For example, here the two equally-sized dots are showing that an equal number
of people submit reports on Tuesdays around 1pm and on Thursdays around 8pm. The larger
the dot in relation to the other points, the more frequent the submissions at that day/time.
15
Changing site settings
16
1. Adding/deleting/changing report categories
You can add, delete and change the report categories all from the admin page. Simply click
“Manage” in the top left. The page that opens automatically will be the “Categories” page.
To change the order in which the categories are displayed on the website, scroll your mouse
over the area to the left of each category name. An arrow will appear, allowing you to move
each category.
From this main “Categories” page, you are also able to delete categories (by clicking on “Delete”
to the right) and change categories from being hidden to being visible and vice versa. If a
category is hidden, this means that is only visible to you (the administrator) but not to the public.
In the image above, you can see that the “Crime” category is hidden. This allows you to gather
and store information/reports related to crime while not displaying it to the public. To change this
setting, simply click on “Visible” or “Hidden” on the right in each row, and a window will pop up
asking if you want to change this setting. If you click on “Visible,” the pop up window will ask if
you want to make the category hidden. If you click on “Hidden,” the pop up window will ask if
you want to make the category visible.
All other changes to the categories are made by clicking on “Edit” on the right side of each
column.
17
When you click on “Edit,” a new box will be displayed above the list of categories, as shown
below.
In this add/edit box, you can change the “Category Name,” “Description,” the color of the marker
(a color spectrum pops up when you click on the entry field below “Color”) and the “Parent
Category.” Currently, all of the categories are “Top Level Categories.” You can change this here
and make a category a subcategory by changing the “Parent Category.” If you want to have an
image/icon for a category, you can upload the image on this page as well. When you have
made all the changes, click on “Save.”
18
To add a new category, simply click on the “Add” button above the list of categories, and the
same box that appeared when you clicked on “Edit” before will appear, only this time with none
of the entry boxes filled out.
Designate a “Category Name,” “Description,” “Color,” and “Parent Category.” You can also add
an associated image/icon, but this is optional. Make sure to click “Save” before leaving the
page.
Once you save, the new category will be added to the list of categories, and you can change the
hidden/visible settings as well as the order in which it appears in the list of categories, as
described before.
19
2. Adding/deleting newsfeeds
To change the feeds connected to the newsfeed box displayed on the bottom of bvilleloop.com
select “News Feeds” on the “Manage” page. The page that opens will list all news feeds
currently displayed.
Just like on the “Categories” page, from this list, you can change whether the feeds are visible
or hidden, delete feeds, or edit them by selecting “edit.” When you select “Edit,” the information
for that news feed will appear in the “Add/Edit” box below the newsfeed list. Here, you can
change the “Feed Name” displayed on the website and the “Feed URL” (the RSS feed
connected to the news source). Make any necessary edits, and make sure to click “Save”
before leaving the page.
To add new newsfeeds, simply fill out the entry form fields in the “Add/Edit” box at the bottom of
the page.
20
3. Adding/deleting/editing bvilleloop.com emails, phone numbers, and twitter accounts
To update the email connected to the website, select “Settings” on the upper right corner of the
admin page and “Email” in the subheading. This is the email that the public can email
messages/reports to. By setting up the mail server, all messages/reports sent to this email will
be forwarded to the bvilleloop.com admin page.
Update any appropriate entry fields and click “Save Settings” in the upper right corner. You can
also test the new settings before you click “Save Setting,” by clicking “Test Settings.”
21
To update the phone number connected to the site (through which all text message/reports are
received), select “SMS” on the subheading of the “Settings” page.
The phone number shown in this image is the number of the modem used during the length of
the Columbia class project, and will be disconnected at the end of the semester. If you wish to
set up an SMS reporting system, enter the phone number in one of the entry fields on this page
and “Save Settings.”
22
The other means of receiving messages and reports is through twitter. Any tweets that contain
#BrowsvilleLoop will be directly sent to the bvilleloop.com admin page for administrative
approval (described previously). To change the twitter account connected to the website, click
on “Settings.” The page that opens is the general “Website” settings.
Scroll down to the bottom of the page to the “Twitter Search Terms.” For each twitter search
term that you put in this entry box (separated by commas), all tweets containing these terms will
be forwarded as messages to the bvilleloop.com inbox (and you can then create reports from
these messages, as described earlier). Once you have made all necessary changes, select
“Save Settings” either on the bottom or top of the page.
23
Anticipated Project Maintenance Costs
Modem ($20)
This modem is needed to receive texts to be managed and sorted on the computer in
FrontlineSMS. It needs to stay plugged in to the computer in order for the texts received to be
compiled in the program and for the automatic response to be sent. Any texts received while
FrontlineSMS is not running or the computer is off would be uploaded into the program upon
restart of the program.
Data plan ($30/month)
This plan would allow for unlimited sending and receiving of texts.
FrontlineSMS (free)
This program is free to download and install on any computer. The rules we create could be
uploaded to the computer that you end up installing the program on.
Domain name ($10/year)
We purchased the domain name bvilleloop.com and paid for hosting for the year. Both of these
purchases will expire in one year (on November 15, 2012). At this point, in order to keep the
website operating, you will need to pay another $10 for the domain name, and you will need to
pay for hosting (normally around $5-$10/month). If you already have a server on which you can
host the site, this additional monthly cost will not be necessary.
24
Passwords
Username
Password
bvilleloop.com/admin
Admin
admin
gmail.com
Brownsvilleloop
ushahidi
twitter.com
Brownsvilleloop
ushahidi
25
For help/any further questions....
check out http://wiki.ushahidi.com/
or email
Danielle Dowler [email protected]
Norabelle Greenberger [email protected]
Aisha Qamar [email protected]
Stephanie Servetz [email protected]
26