1
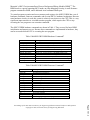
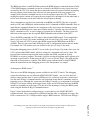
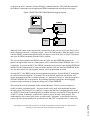
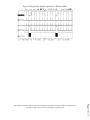
Session 1420
New Laboratory Tools and Techniques for Embedded Microcontrollers
Todd Morton
Western Washington University
Abstract
Some modern microcontrollers are being introduced with on-chip debug facilities called
background debug modules (BDM) along with on-chip Flash EPROM. These microcontrollers
open new doors in education. For the first time they make development of single-chip final
product designs practical in the laboratory at a reasonable cost. This paper covers the
development tools, both software and hardware, and processes used to take advantage of these
new devices and to overcome some of the challenges of single-chip designs. It will show
methods that will allow the students greater insight into real-time operation of their assembly and
C programs in the final product configuration. Specifically, the M68HC912B32 microcontroller
is covered. Tools covered include evaluation boards used as BDM pods and targets, a sourcelevel BDM debugging system, and the HP54645D Mixed-Signal Oscilloscopes.
Introduction
The use of microcontrollers in academic laboratories is increasing in many different disciplines
such as engineering, engineering technology, and the sciences. The application of
microcontrollers in the lab is well documented. This is especially true for student senior and
research projects, which tend to require a final standalone product.
Occasionally, a technology breakthrough in industry can have a very significant effect on the
educational laboratory. For example, when EEPROM-based PALs became available, students
could reuse parts after programming errors or for multiple laboratories4. This made it practical to
cover programmable logic devices in the academic lab. The technologies described here should
have a similar effect because they, for the first time, have made it practical for students and
faculty to develop final products using microcontrollers that are running in single-chip mode.
Therefore, instead of focusing on the applications of microcontrollers, this paper covers some of
the new technologies and techniques used to develop and test microcontroller software in the
final product.
This paper first covers the challenges involved in developing and testing programs for final
products. It will then briefly cover the traditional methods used for meeting these challenges.
Two new technologies, Flash EEPROM and Motorola’s background debugging module (BDM)
will then be covered. This will be followed with the description of two typical development
systems based on the BDM – An inexpensive system using two Motorola evaluation boards and
Page 6.751.1
Proceedings of the 2001 American Society for Engineering Education Annual Conference & Exposition
Copyright © 2001, American Society for Engineering Education
a more expensive, full-featured, source level debugging system for large C programs. Finally,
this paper will describe some techniques for debugging real-time programs. These techniques
become especially important when using a single-chip microcontroller because, since the bus
signals are not available externally, normal bus analysis tools can not be used.
Introduction to Developing Microcontroller Programs
The focus of this paper is on development systems and techniques that can be used in an
academic laboratory for developing final products that contain single-chip embedded
microcontrollers. A final product is defined as a standalone embedded system that executes the
developer’s code once power is applied or the system is reset. The final product operates without
the help of development tools such as a host or resident monitor program.
The ultimate goal of any development system is to provide an environment that enables the
programmer to efficiently construct reliable programs3. Therefore, the system must be able
provide insight into the detailed operation of the program while, at the same time, the
development system should be as non-invasive to the final product as possible. A good
development system is especially important in the academic lab. It is very important that students
have access to tools that will allow them to analyze and gain insight into how their program
works.
Normally, a student is introduced to programming microprocessors or microcontrollers using a
simulator or a platform that runs the user’s program in the target’s RAM. When the target is a
microcontroller trainer board or evaluation board, the code is downloaded and executed with the
help of a monitor program. When using the Motorola 68HC912B32 evaluation board 5,6,7
(912EVB) the D-Bug12 monitor program is used to load machine code into on-chip RAM and
control execution. This system is a simple and effective way to develop small programs,
routines, and code snippets. It is simple and efficient and allows the student to focus on the
application code without having to be concerned about the details involved in initialization and
configuration. However, because of the lack of RAM space, it is generally not useful for larger
programs. Nor is it very useful for programs designed for final products or real-time debugging
because of the invasiveness of the resident monitor and the volatility of the RAM.
Developing a final product presents several challenges beyond simply developing the application
code. The code must include reset and interrupt vectors, fault tolerance code, and configuration
code. It must also be contained in non-volatile memory so it will be there when power is first
applied. When the final product is a single-chip microcontroller, there are additional challenges
because the bus system is not available.
The Tradition Methods
This section discusses some of the traditional methods used to develop code for a final product.
Note that some of these methods can not be used when the microcontroller is run in single-chip
mode.
Page 6.751.2
Proceedings of the 2001 American Society for Engineering Education Annual Conference & Exposition
Copyright © 2001, American Society for Engineering Education
The traditional development process to create a final product starts with developing the
application code under the control of a monitor program. This allows the programmer to easily
download and debug the code. Then, at some point, the ties to the monitor program must be cut
and the MCU must run the final product code by itself. The complexity of this transition depends
on which development tools are being used. Traditional development tools, especially most
trainers developed for education, made this transition very difficult.
The most common method that has been used is to write and debug as much of the application
code with a monitor program, then once the application code is working, the final product code is
programmed into an EPROM. The EPROM is then placed in the target board and the program is
executed by resetting the processor. By itself, this development system does not include any way
to control the CPU execution besides the system reset. Since a monitor program is not available
at this stage, a logic analyzer is used to debug the code.
A couple problems make this process very inefficient. First, the EPROM programming process is
manual and time consuming. It also requires an EPROM programmer, which is not always
available. This can be improved by using a battery-backed RAM to emulate the EPROM until
the code is complete. The second problem is the lack of program control for debugging. The
logic analyzer can be used to watch the bus activity but it can not be used to control program
execution. To solve this, some development systems have dual-boot capability and include
sufficient memory to hold both the monitor program and the user code. In this way, the user’s
program can be almost completely debugged under the monitor and the transition to running the
program standalone is very simple.
In addition to this process being inefficient, it is limited to microcontrollers that run in expanded
mode. To design a final product that uses a single-chip microcontroller, an expensive in-circuit
emulator or an evaluation board that emulates the single-chip mode would be required. The final
product code would then be programmed on an on-chip ROM. Unfortunately, this process is not
practical for academic projects because of the expense and the time it takes for the manufacturer
to provide programmed parts.
Another problem with the traditional methods is that they rely on a monitor program that is
contained in memory. These programs tend to be very invasive because of the memory space
they require and their effect on real-time execution. One solution to this has been to use an incircuit emulator. However, emulators for microcontrollers are relatively expensive and may not
be available for all MCU versions.
Using On-Chip Flash EEPROM and Background Debug Systems
The development process for a single-chip design can be dramatically improved by using a
microcontroller that combines Flash EEPROM and an on-chip debugging system. The Flash
EEPROM allows automated, in-circuit programming. The on-chip debug system adds the
capabilities of a debug monitor without the invasiveness of a resident monitor program.
Page 6.751.3
Proceedings of the 2001 American Society for Engineering Education Annual Conference & Exposition
Copyright © 2001, American Society for Engineering Education
Motorola’s 68HC12 microcontrollers all have a Background Debug Module (BDM)5,6. The
BDM involves a special operating MCU mode, on-chip debugging circuitry, a small firmware
program contained in ROM, and a dedicated serial communications port.
To control program execution and access memory and registers, the 68HC12 BDM has a set of
hardware commands, firmware commands, and on some MCUs, hardware breakpoints. Because
extra hardware circuitry is used, this system is relatively non-invasive to the CPU. This is a very
significant improvement over a resident monitor program, which requires the CPU to stop
executing the user program to run a monitor command.
The 68HC12 BDM hardware commands are shown in Table 1. They are used for basic BDM
initialization and memory access. Because these commands are implemented in hardware, they
can be executed while the CPU is executing the user program.
Table 1 M68HC912B32 BDM Hardware Commands6
Command
BACKGROUND
READ_BD_BYTE
STATUS
READ_BD_WORD
READ_BYTE
READ_WORD
WRITE_BD_BYTE
ENABLE_FIRMWARE
WRITE_BD_WORD
WRITE_BYTE
WRITE_WORD
Description
Enter background mode.
Read 8-bit word from memory with BDM ROM in map
Read BDM status register
Read 16-bit word from memory with BDM ROM in map.
Read 8-bit word without BDM ROM in map
Read 16-bit word without BDM ROM in map
Write 8-bit word to memory with BDM ROM in map
Set ENBDM bit in BDM status register
Write 16-bit word to memory with BDM ROM in map
Write 8-bit word to memory without BDM ROM in map
Write 16-bit word to memory without BDM ROM in map
Table 2 M68HC912B32 BDM Firmware Commands6
Command
READ_NEXT
READ_PC
READ_D
READ_X
READ_Y
READ_SP
WRITE_NEXT
WRITE_PC
WRITE_D
WRITE_X
WRITE_Y
WRITE_SP
GO
TRACE1
TAGGO
Description
Read next 16-bit word pointed to by IX
Read Program Counter, PC
Read accumulator D, ACCD
Read index register IX
Read index register IY
Read stack pointer, SP
Read next 16-bit word pointed to by IX
Write to Program Counter, PC
Write to accumulator D, ACCD
Write to index register IX
Write to index register IY
Write to stack pointer, SP
Go to user program
Execute one instruction then return to BDM
Enable tagging and go to user program
Page 6.751.4
Proceedings of the 2001 American Society for Engineering Education Annual Conference & Exposition
Copyright © 2001, American Society for Engineering Education
The BDM also utilizes a small ROM that contains the BDM firmware commands shown in Table
2. The BDM firmware commands can not be executed by the BDM circuitry so they have to be
executed by the CPU. This means that these commands can not be executed without preempting
the user program, which means they affect the real-time operation of the user program. For
example, notice that the commands used to access the registers require the CPU. This means
reading the register contents will require the user program to be preempted. On the other hand, a
read or write to memory can be done while the user program is running.
These commands are sent by a host connected to the BDM port, BKGD. The host is typically
made up of PC and a BDM pod, which translates the PC commands to BDM commands. Keep in
mind that the commands shown here are transparent to the user because development systems
designed for the BDM provide a more user-friendly interface. Typically, the user will enter DBug12 commands on a PC or select widgets in a graphical user interface. The host system will
then convert that request into the required BDM commands and send them to the MCU.
To use the BDM commands, the CPU must be placed under BDM control. To accomplish this,
there is a Special Single-Chip mode in addition to the Normal Single-Chip mode. In Special
Single-Chip mode, the CPU is placed under BDM control and the BDM firmware ROM is
available. There are also some subtle differences in MCU configuration between the two modes.
For example, the COP monitor resets are disabled in the Special Single-Chip mode.
During the debugging process, the MCU is reset in the Special Single-Chip mode. Once reset, the
CPU is placed under BDM control, which is waiting for a command to be sent by a host. The
host can send command sequences that load a program into RAM, program an on-chip
EEPROM, or execute a program. This mode is used to develop the program until it appears to be
operating to specification. At that point, the MCU is reset in Normal Single-Chip mode and the
transition to final product is complete. This BDM system combined with on-chip EEPROM
makes the transition from the debugging process to the final product very simple.
An Inexpensive BDM System 3,7
There are several BDM debugging systems available for the 68HC12 family. The debugging
system described here uses two Motorola M68EVB912B32 boards – one is used as the final
product (target) and the other is used as a BDM pod. It is a relatively inexpensive solution and
uses the same D-Bug12 command interface and evaluation boards that are commonly used in a
beginning course. Although this system uses the D-Bug12 interface, it is important to realize that
D-Bug12 is no longer resident on the target board. It runs on the POD board and uses the BDM
interface to communicate to the target. This has all of the advantages of using the BDM system
while using the familiar D-Bug12 command interface.
Figure 2 shows the hardware configuration for a system that uses two M68EVB912B32
evaluation boards. One is configured as a BDM pod and the other is configured as a target. The
POD is connected to a PC COM port and the target’s BDM connector. The POD runs D-Bug12
Page 6.751.5
Proceedings of the 2001 American Society for Engineering Education Annual Conference & Exposition
Copyright © 2001, American Society for Engineering Education
so the user on the PC interacts with the D-Bug12 command interface. The POD then translates
the D-Bug12 commands into the appropriate BDM commands and sends them to the target.
Figure 2 M68EVB912B32 BDM-Based Debugging System
POD EVB
P1
Serial
Port
BDM
OUT
Personal Computer
BDM Cable
Power
Supply
BDM IN
Target EVB
When the reset button on the target board is pressed, the target will reset in Normal Single-Chip
mode, which uses the user’s exception vectors – this is the final product. When the target is reset
with the RESET command through the POD, the target is reset in the Special Single-Chip mode
and waits for BDM commands from the POD to operate.
The user can load programs into RAM or into one of the on-chip EEPROM memories. In
general, the application code for a final product will be loaded into Flash EEPROM. Once +12V
is applied to VFP pin on the MCU, the FBULK command can be used to erase the flash EEPROM
and the FLOAD command can be used to load the machine code into the Flash EEPROM. In this
way, the non-volatile, on-chip program memory can be programmed in-circuit.
On some MCU’s the BDM system also has hardware breakpoints. Normal D-Bug12 breakpoints
are called software breakpoints. To stop the CPU at the desired instruction, the monitor will
replace that instruction with a software interrupt, swi, instruction. However, when the program is
in Flash EEPROM, this is not possible. By including hardware breakpoints, the debugging
system can stop execution of a program running out of Flash EEPROM.
This system has several advantages in the student laboratory. First it uses two inexpensive,
readily available evaluation boards – the same boards can be used in the traditional resident
monitor system. The D-Bug12 user interface is simple and familiar to students that have used it
on a 68HC12 board with a resident monitor or students that have used the BUFFALO monitor in
a 68HC11 system. In addition, it enables the student to easily develop a final product. The
disadvantage to this system really shows up when using C programs. As described in the next
section, the user must manually look up references to map CPU execution to the C source code.
Page 6.751.6
Proceedings of the 2001 American Society for Engineering Education Annual Conference & Exposition
Copyright © 2001, American Society for Engineering Education
In addition, this system does not allow a variable or signal to be monitored at a fixed rate. For
example, it would be impossible to look at a variable in memory every 10ms using this system.
Let alone synchronizing a sample with another real-time event.
A Source-Level Debugging System
Programming in C has many advantages but it also complicates the debugging task. When C is
used there is no longer a one-to-one correspondence between the source code and the CPU
operations. The programmer has to translate the code executed by the CPU back to the C source.
When using the D-Bug12 BDM system described in the previous section, the programmer must
translate the CPU operations to the C source code by making use of the listing files generated by
the compiler. For example, to set a breakpoint at the start of a line of C code, the user must first
correlate the line with the resulting assembly code and find its absolute address. Once the
absolute address of the line is found, a breakpoint can be set. This can be a tedious process,
which may discourage students from debugging their code.
In general, a source level debugger refers to a computer application and external hardware that
can control program execution on a target system and correlate the program execution with the
original source code. Many programmers are first introduced to this type of system while taking
a programming course for writing PC applications. In traditional source level debugging systems,
an emulator is used to control the CPU, collect data from the CPU memory, and load programs
into memory. These are the most powerful debugging tools available for debugging high-level
language programs. However, they are also the most expensive because extensive hardware is
required to emulate the processor. The on-chip debugging features that are found on many new
microcontrollers provide an ideal solution to this problem. Because the debugging hardware is
integrated into the microcontroller, the CPU emulation circuitry is no longer required. The only
hardware required is the BDM pod to communicate with the on-chip debugging circuitry. This
type of system provides us with most of the capabilities of a full emulator, yet at a reduced cost.
In this section, the Noral Micrologics Flex BDM Debugger for the 68HC12 family of
microcontrollers will be covered. It takes advantage of the 68HC12’s Background Debug
Module (BDM) to provide real-time source level debugging. The system consists of a sourcelevel debugging application and a BDM pod connected between a PC parallel port and the target
hardware. It is more expensive than using Motorola’s 68HC12 EVB as a background debug pod
but less expensive than a full emulator – if one existed. In the student lab, this system provides
much better control and insight for the student debugging large C programs. Figure 3 shows an
example of the Noral 68HC12 BDM debugger’s working environment. A few of the features of
this debugger are shown in the figure including the Source window, the Registers window, the
Monitor Points window, the Watch window, and the Call Tree window.
The buttons on the top of the display control program execution and run debugging macros. The
program can be executed with the Go button or single-step to the next instruction with the Step
Instr button.
Page 6.751.7
Proceedings of the 2001 American Society for Engineering Education Annual Conference & Exposition
Copyright © 2001, American Society for Engineering Education
The source window shows the source code of the program being tested. In Figure 3, the source
window shows both the C source code and the assembly code contained in target memory in
mixed mode. It also shows the module name and the routine name for the source of each
function. Optionally, the display can show only assembly or only C but, when testing code for
embedded microcontrollers, it is important for the student to see both the source and assembly
code so the mixed mode should be used. The debugger correlates the code from target memory
with the code in the source files by using information contained in an IEEE-695 standard debug
file. The highlighted line in the figure shows where the code execution has been stopped with a
breakpoint. The breakpoint was set be clicking on the breakpoint box directly to the left of the
assembly code line.
The Registers window is roughly equivalent to the RD command in D-Bug12. It shows the
register contents at the breakpoint, the current module and routine, and the disassembled source
code from memory. The Call Tree window displays the current source code context. It includes
the module name followed by the function name for each nested function call. The Monitor
Points window is used to display the current contents of a memory location. It is roughly
equivalent to the MD command in D-Bug12. The points are absolute memory locations such as
the MCU control and status registers. In Figure 3, the system set to monitor PORTP and DDRP
of the MCU. Since the 68HC12 BDM can read address contents without interrupting the
program execution, the system can monitor these locations in real-time. The update time for this
window is configurable. It can be updated at a fixed rate or updated at designated points in the
code execution called Refresh Points. Refresh Points, however, are implemented with
breakpoints so they can affect the real-time execution of the code. The Watch window is
essentially the same as the Monitor Points window except it allows us to monitor C data objects
by name.
These are the main features of the Noral 68HC12 BDM debugger. There are many other features
such as loading Flash EEPROM, monitoring local variables, and automating the debug process
by creating debugging macros. Although this system is relatively expensive for the laboratory, it
is a great way for students to debug and understand the operation of large C programs.
Real-Time Techniques 1,3
In this section, techniques to help debug and analyze real-time programs running in a single-chip
microcontroller will be covered. When debugging real-time programs the tools must be as noninvasive as possible. They must collect as much data as required while affecting the system
timing as little as possible. In a real system, there is a trade-off between the amount and type of
debugging data that can be watched or saved and the invasiveness of the debugging tool. This is
especially true when working with single-chip microcontrollers.
Page 6.751.8
Proceedings of the 2001 American Society for Engineering Education Annual Conference & Exposition
Copyright © 2001, American Society for Engineering Education
Figure 3 Noral 68HC12 BDM Source Level Debugging Environment
The easiest source of data is external signals. Access to these signals can be achieved in a very
non-invasive way by using an oscilloscope or logic analyzer. At minimum, the external signals
on a system will indicate if the system meets its system requirements. However, these signals can
also help the student gain insight into why the system is not working, especially if they have
access to external signals that contain information about program execution. The most obvious
and helpful external signals for this are the bus signals. If the bus system is accessible, a logic
analyzer can be used to see exactly what the program is doing bus cycle by bus cycle. This is one
of the most powerful debugging tools for real-time systems. It is essentially non-invasive and it
provides detailed information about the program’s operation. The problem is that more and more
Page 6.751.9
Proceedings of the 2001 American Society for Engineering Education Annual Conference & Exposition
Copyright © 2001, American Society for Engineering Education
designs today are using single-chip microcontrollers where the bus is not accessible. For these
systems, it is more difficult to gain information about detailed program operation.
The student programmer can gain as much insight as possible from the accessible signals but, if
that is not enough, software and hardware debug helpers must be used. Software and hardware
debug helpers are additional code and hardware resources used solely for the purpose of
debugging and analysis. They are not part of the specified function of the system but may remain
in the final product for diagnostic purposes. Two basic forms of helpers are those that capture
and store data at run-time to be accessed later, and those that provide additional external signals
that can be watched while the program is running. One of the best examples of a hardware debug
helper is the BDM on the 68HC12 microcontrollers. It allows the programmer to watch internal
variables and signals in real-time. Most debug helpers that are added by the programmer require
additional software. Therefore, they are invasive and will affect the program timing. However,
many times the software can be reduced to a single move or store instruction.
The first type of debug helper is one that captures and stores critical data during run-time. At
critical points in program operation, debug code is added to save the value of a critical variable.
The data is stored in a location reserved for the helper and can be examined by a monitor
program once the program has stopped or the BDM while the program continues running.
The second type of debug helper is used to add external signals that contain debug information.
These signals are normally binary indicators that provide more information about the program’s
operation. They can then be watched externally with an LED, an oscilloscope, or a logic
analyzer. Another way to provide external information is to send data out the serial port for
display. This, however, can be very invasive because of the time it takes to send data through the
serial port.
For example, Figure 4 shows a captured set of external debug signals that are used to examine
the timing of a multitasking program based on a time-slice scheduling loop. In this case, there are
four cooperative tasks. For each task, code is added to make the corresponding output bit goes
high when the CPU is executing that task. Figure 4 shows these debug signals captured with an
HP54645 Mixed Signal Oscilloscope. If the signal is high, the CPU is executing that task. Once
these signals are captured, the task times can be measured on the scope for a complete timing
analysis and CPU load calculations. This technique can also be used in a preemptive kernel if the
programmer has access to the kernel task switching routine.
This technique can be used to effectively analyze and debug real-time programs running in
single-chip microcontrollers, as long as there are adequate resources. For example, there must be
extra GPIO ports for the debugging signals and enough CPU time available to change signal
values.
Page 6.751.10
Proceedings of the 2001 American Society for Engineering Education Annual Conference & Exposition
Copyright © 2001, American Society for Engineering Education
Figure 4 Debug Helper Signals Captured on a HP54645 MSO
Page 6.751.11
Proceedings of the 2001 American Society for Engineering Education Annual Conference & Exposition
Copyright © 2001, American Society for Engineering Education
Bibliography
1. Ball, Stuart R., Debugging Embedded Microprocessor Systems, Butterworth-Heinemann, Woburn, MA, 1998
2. Labrosse, John J., MicroC/OS-II, The Real-Time Kernel, R&D Books, Lawrence, KS, 1999.
3. Morton, Todd, Embedded Microcontrollers, Prentice-Hall, Upper Saddle River, NJ, 2001.
4. Morton, Todd, A Digital System Design Laboratory, ASEE National Conference, June 1991, New Orleans, La.
5. CPU12 Reference Manual, CPU12RM/AD, Motorola
6. MC68HC912B32 Technical Data, MC68HC912B32/D, Motorola
7. M68EVB912B32 Evaluation Board User’s Manual, 68EVB912B32UM/D, Motorola
TODD MORTON
Todd Morton has been teaching the upper level microprocessor and digital courses for Western Washington
University's Electronics Engineering Technology program for 13 years. He is the author of the text ’Embedded
Microcontrollers’, which covers assembly and C programming for the 68HC12. He has also worked as a design
engineer at Physio Control Corporation and has worked several summers at NASA's Jet Propulsion Laboratory as an
ASEE-NASA Summer Faculty Fellow. He has a BSEE and MSEE from the University of Washington.
Page 6.751.12
Proceedings of the 2001 American Society for Engineering Education Annual Conference & Exposition
Copyright © 2001, American Society for Engineering Education