1
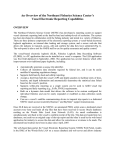
A comparative study to the 2011/2013 water quality
assessments in the Pasquotank Watershed in
Northeastern North Carolina with a
sea level rise component
Linda Hayden, Principal Investigator
Jamal Stevenson, Raveen McKenzie
Elizabeth City State University
1704 Weeksville Road, Campus Box 672
Elizabeth City, North Carolina 27909
Mississippi Valley State University
14000 Highway 82 West
Itta Bena, MS 38941
Jeff Wood, Mentor
Elizabeth City State University
1704 Weeksville Road, Campus Box 672
Elizabeth City, North Carolina 27909
Abstract- The Pasquotank River Watershed is found in
Northeast North Carolina beginning in the Great Dismal
Swamp at the Virginia/North Carolina border and flows into
the Albemarle Sound. The watershed provides a transition
between spawning grounds and the waters of the Albemarle
Sound. The sound serves as a nursery area for many fish
species and is home to numerous sport and commercial species.
Due to indications of rising global temperature and the
monitoring of melting ice sheets, these coastal watersheds could
be a leading indicator of rising sea levels as their chemical
compositions changes. The effects of sea-level rise were also
taken into consideration for future monitoring.
The 2014 Research Experience for Undergraduates
Pasquotank River Watershed Team completed two sets of tests
of five tributaries and the river itself. These test points were
derived from the 2011 and 2013 Watershed Team research
projects with the addition of four points created to sample
further downstream in the Pasquotank River itself. Results
were compared with previous readings utilizing a Water
Quality Index (WQI). The streams tested were the Pasquotank
River, Newbegun Creek, Knobbs Creek, Areneuse Creek, Mill
Dam Creek, and Sawyers Creek. These streams, along with the
river, cover a large portion of the watershed and provide a
wide area of study for the watershed.
Tests performed in the laboratory on this year’s samples
included pH, salinity, total dissolved solids, and conductivity.
Air/water temperature, dissolved oxygen, wind speed/direction,
and turbidity/clarity measurements were taken in the field.
The results collected were placed online and displayed in
correlation to their position utilizing Google Maps. The data
were then compared to the 2011 and 2013 project results and
examined for any variations or similarities.
It was found that the water quality for some water sources
remained in their respective ranges from the past years. The
others, such as Knobbs Creek, varied from the previous years.
Newbegun Creek, with a water quality index of 59, stayed
within the two previous teams’ WQI of 50 (2011) and 66
(2013). Mill Dam Creek had a very slight increase in water
quality from the previous teams’ readings 47 (2013) and 48
(2011) but still managed to acquire a bad reading of 49.
Areneuse Creek increased from 49 (2011) and 47 (2013) to
reach a medium water quality of 57. The Pasquotank River,
ranking as the lowest, has dropped significantly from 64 (2011)
to 44 (2013) and continued to be lower in 2014 standing at 41
for its WQI. Sawyers Creek remained consistent between 54
(2011) and 50 (2013) at a low medium range with this year’s
water quality being 51. Knobbs Creek WQI, having the highest
water quality reading, increased from the two past readings of
52 (2011) and 50 (2013) with a WQI of 63.
Keywords: Water quality, Pasquotank, watershed,
dissolved oxygen, pH, salt, conductivity, clarity, turbidity, sea
level rise, global warming.
I. INTRODUCTION
A. Overview
A watershed is a group of smaller bodies of water that
flow into a larger body of water. The Targeted Local
Watershed (TLW) for this year’s research was the
Pasquotank Watershed, which included the Pasquotank River
and several of its tributaries. The contributing waterways
tested in this research were Knobbs Creek, Sawyers Creek,
Areneuse Creek, Mill Dam Creek, and Newbegun Creek.
There are three types of watersheds: continental divides,
major drainage divides, and minor drainage divides. The
Pasquotank is a minor drainage because it divides, but
eventually rejoins. [1]. Watersheds maintain many life forms.
According to the Environmental Protection Agency (EPA),
more than $450 billion in foods, fiber, manufactured goods
and tourism depend on clean, healthy watersheds. That is
why proper watershed protection is necessary. [2].
The 2014 Pasquotank Water Quality Team gathered the
following data in order to evaluate the quality of the water:
dissolved oxygen, turbidity, clarity, total dissolved solids
(TDS), salinity, pH, and conductivity. Other items such as
wind
speed/direction,
air/water
temperature,
latitude/longitude, and date/time were also recorded as
factors that could influence the final analysis. This data was
compared to the 2011 and 2013 summer research projects,
which targeted the same waterways.
An added component to this year’s research was a focus
on salinity as a result of sea level rise. As sea level rise
occurs, coastal estuaries and ground water supplies are
inundated with higher levels of salt affecting local plant and
animal populations as well as residents living along the
coast. Reduction in coastal forests has been documented in
other areas of the United States. A drop in the number of
species has also been recorded as their nesting and feeding
areas undergo change. Testing points added in the lower
Pasquotank River out to the mouth of the Newbegun Creek
will allow for an increase monitoring of salinity levels in the
Pasquotank Watershed. [29]
B. Dissolved Oxygen
Dissolved Oxygen is a key factor in marine life.
Dissolved oxygen is a relative measure of the amount of
oxygen that is dissolved or carried in a given medium. The
volume and velocity of water flowing, the climate, the water
temperature, and the types of organisms living within the
water are factors to the dissolved oxygen. [3] During the
summer, the water temperature has a high influence on
dissolved oxygen because a high water temperature equals a
lower reading in dissolved oxygen [4]. Dissolved oxygen
usually is rather higher in shallow areas and decreases in
deeper waters. The width of the waterway being tested also
influences the readings as wide waterways are disturbed
more by winds passing over them than narrow waterways.
The standard unit of measurement used for the tests
completed in the laboratory was milligrams per liter (mg/L).
This information was converted into a unit of “percent
saturation” (%sat) in order to use the readings in the Water
Quality Index calculations.
C. Turbidity
Turbidity refers to the optical property that causes light to
be scattered and absorbed by particles and molecules. [5]
Higher turbidity increases water temperatures because
suspended particles,[6] which can promote regrowth of
microorganisms in the distribution system, absorb the light
converting it into heat. It is measured in inches and converted
into [7] Streams with high turbidity absorb more heat, and
also reduce the amount of light penetrating the water, which
reduces photosynthesis and the production of Dissolved
Oxygen (DO). [6]
D. Clarity
Water clarity is a measure of the amount of sunlight that
can penetrate through the water. [8] Water clarity is affected
by water color. [9] Two types of color of water are apparent
color and true color. Apparent color is water sample that has
not had substances filtered out of the water, and true color is
water sample that has had all the substances filtered out of
the water. [10]
E. Total Dissolved Solids (TDS)
Total Dissolved Solids are the total amount of mobile
charged ions. These mobile charged ions include minerals,
salts, and metals that are dissolved in a given volume of
water. TDS is related to the purity of water. A high level of
TDS is an indicator that the water has toxic ions which is
often caused by the presence of potassium. [11]
F. Salinity
Salinity is the amount of dissolved salt in a body of
water. Salinity determines what types of living things live in
that specific environment. The unit of measurement for
salinity is parts per millions (ppm). The higher the salinity
reading, the lower the dissolved oxygen reading will be. [12].
Salinity can also be an indicator of sea level rise as ocean
waters encroach on brackish and coastal watersheds. The sun
can affect salinity more in the summer than the winter
because higher temperatures increase levels of evaporation.
G. Conductivity
Conductivity is the measure of water’s capability to pass
electrical flow. It is affected by negative charged ions such as
chloride and nitrates or positive charged ions like calcium
and sodium. The more ions present, the higher the
conductivity will be. Conductivity is also affected by water
temperature as both factors will either increase together or
decrease simultaneously. Conductivity is measured in
Siemens (mho) which is a reciprocal of resistance (ohm).
[12].
H. pH
The pH measurement is used to determine if a solution is
acidic or basic. The pH readings range from 0 to 14 with
acidic levels between 0 and 6.9 units and basic levels
between 7.1 and 14. A reading of 7 is considered to be
neutral. If either substance is very acidic or very basic, then
the substance is reactive as it can cause a serious chemical
burn. [13].
II. EQUIPMENT
A. Positions
Latitude and longitude points were taken from the 2011
and 2013 Water Quality Team projects for each waterway to
assist in comparing data. All of the longitudes and latitudes
were loaded into the Garmin GPSMAP 60CSx, a handheld
Global Positioning System (GPS) device, which was loaded
the Garmin BaseCamp software. There were four points
added to the Pasquotank River with the Garmin BaseCamp
software, also. Garmin BaseCamp software is a three-
dimensional application that allows waypoints, tracks and
routes to be transferred from one device to another. [14]
B. Research Platforms
A canoe was used to travel through each of the small,
narrow creeks. The LH Viking, a 22-foot Sea Pro Model 210
fiberglass boat, was used to travel through the Pasquotank
River, Newbegun Creek, and the first trip through Areneuse
Creek. During testing of the Newbegun Creek, the kayak was
used to travel under a bridge to obtain the remaining test
points of that waterway.
C. Water Temperature
The thermometer is a tool that measures water
temperature in degrees Fahrenheit and Celsius. The
protective plastic case protects the glass thermometer from
breakage. The thermometer was lowered to a depth of three
feet for one minute to allow the temperature to settle and
then raised to the surface to view the temperature of the
water.[15]
D. Wind Speed/Air Temperature
The Skymate Wind Meter is an anemometer that was
used to measure wind speed. The test equipment also has a
digital temperature gauge to measure the air temperature.
The wind speed was measured in knots, where one knot is
one nautical mile per hour, which is 6076 feet per hour. [16]
The temperature was measured in degrees Celsius (°C) for
this project.
When measuring the wind speed hold the meter away
from the body and in the air. Give the meter time to stabilize
and record the wind speed. The reading will rarely
completely settle due to fluctuations in wind speed. When
reading the temperature, the same steps apply. After
obtaining the readings from the Skymate Wind Meter, it
should be closed to protect the instrument impeller blades.
E. Dissolved Oxygen
The MW600 Dissolved Oxygen Meter is an instrument
used to measure dissolved oxygen in waters such as creeks,
rivers, and ponds. It is calibrated at two points: 100%
saturated air and in a 0% oxygen solution. It has an
Automatic Temperature Compensation which will guarantee
the highest accuracy. [17]
To operate the Dissolved Oxygen Meter, first make sure
the device is on and set to 0.0 milligrams per liter (mg/L).
Next, remove the red and black cap, which exposes the
probe. Set the probe in the electrolyte for approximately 5 to
10 minutes. Gently tap the sides of the membrane with a
pencil to avoid any air bubbles that may form. As the meter
starts to calibrate, press and hold the “CAL” button and set
the display to 100%. Then, release the CAL key and the
LCD will display a value in mg/L of oxygen. [18].
Before testing in bodies of water, remove the plastic cap
which exposes the membrane. Set the membrane in the body
of water and wait until the meter reading is steady.
F. Turbidity/Clarity
The Secchi disk is a circular plate with two sides, a side
divided into quarters and painted black and white and a side
that is completely black. The side that is completely black
measures the turbidity of the water. The side that is divided
into quarterly parts measures the clarity of the water. The
plate is able to be detached in order to change the sides to
perform the measurements. This plate is attached to a rope
that has marked lines that represent the depth of the disk in
inches.
The plate was lowered into the water until it could no
longer be seen. The point on the rope which was at the
water’s surface was then used to determine the depth
reading. The rope was lowered farther then slowly brought
back up until it was visible again, then the reading was taken
again. The average of these two readings was then
calculated. This procedure was completed for clarity and
turbidity.
Clarity is how clear the water is. Turbidity is a measure
of the degree of the degree to which the water loses it
transparency due to the presence of suspended particles. [19].
With clarity and turbidity, the lower the disk the clearer the
water. The secchi disk readings are subjective because of the
difference in the tester’s vision as well as the weather
conditions.
G. Conductivity/ Salinity/ Total Dissolved Solids
The Tracer Pocket Tester is a self-calibrated tester that
measure salinity, conductivity, and total dissolved solids
(TDS). Conductivity determines the amount of particles in
that area of water and is measured in Siemens (mho). Salinity
determines the saltiness of the water and is measured in parts
per million (ppm). TDS measures all of the dissolve solids
in the water and is also measured in parts per million (ppm).
This pocket tester has two probes that are protected by an
electrode. The probes should not be touched by anything but
the water as it can cause an inaccurate reading. [20]
To change between the three modes, press and hold
“MODE” until SAL, CON, or TDS appears at the bottom of
the screen. SAL is salinity; CON is conductivity, and TDS is
total dissolved solids. At the top of the screen, under the
curved line, there are also indications that will tell what
mode the pocket tester is in. In TDS mode, “ppm” will
appear in the top left corner. In CON mode, μS or mS will
appear in the middle. In SAL mode, “ppm” will appear in the
top left corner and “S” will appear in the middle. When
placing the pocket tester into the sample of water, stir it
slowly to get rid of any air bubbles that may be on the probe.
Allow the pocket tester reading to settle in order to get an
accurate measurement for each mode.
H. pH
The Aquarium Testing Unit (pH meter) is an instrument
used to measure if a solution is acidic or base. The pH
meter’s range is from 0.0 (acidic) to 14.0 (base) with 7.0
being neutral. From 0.0 to 6.9, it is an acidic while a base is
in the pH range of 7.1 - 14. [21].
To use this device, first calibrate the pH meter to a
neutral setting of 7.0 by pouring distilled water into a cup
and placing a 7.0 mini-buffer tablet into the water. Stir the
water to dissolve the tablet. Set the pH meter in the water,
stir for thirty seconds, and then calibrate the meter to 7.0 by
using the screwdriver on the calibration potentiometer until it
reaches the midpoint of 7.0. The meter is now ready to be
used for the water samples acquired. Set the pH meter in
other solutions to obtain the specific pH reading.
III. SOFTWARE APPLICATIONS
A. Overview
After recording all the results from the testing, the team
used a variety of software packages to make the analysis
easier. All of the software contributed in different ways as far
as moving from and to destinations and recording data. The
following software packages were used during this research:
Garmin BaseCamp, Google Maps, Adobe Dreamweaver,
Microsoft Excel, and the Water Quality Index Calculator.
B. Google Maps
Google Maps is a three-dimensional software feature that
allows people to get an accurate reading on a specific
location. This is because of the SkyBox Imaging Satellites
that are offered for this feature. [22] This allows for precise
turn by turn navigation. Google Maps was used to display the
map results from the field work and in-house testing.
C. Dreamweaver
Adobe Dreamweaver CS5 is a software application that
can use to create and maintain a website. [23] Adobe
Dreamweaver allowed for the use of JavaScript and HTML
in order to create visualization pages for the test results.
Dreamweaver was also used to create the Water Quality
Team’s project documentation pages and results.
D. Microsoft Excel
Microsoft Excel is a spreadsheet to organize, manage,
calculate, and convert data. [24]
This software was used to put in data in order to assist in
analyzing and comparing the data gathered. Microsoft Excel
was also used for graphing and charting to assist in
identifying trends and comparing data. [25] This project also
used Excel for calculations in completing the Water Quality
Index and averaging stream data.
E. Water Quality Index Calculator
The Water Quality Index Calculator is an Excel
spreadsheet that uses specific calculations to form a water
quality index reading. Factors are entered and multiplied by
the respectable weight factors to get subtotals. The subtotals
are then added together to get the water quality index. If
there are less than nine factors entered, the same methods are
applied. [26].From zero to fifty, the water quality would be
bad. The water quality is normal from the range of fifty to
seventy. Seventy to ninety shows a good water quality
reading. To achieve an excellent water quality, the water
quality index has to read at ninety or higher.
F. Garmin Base Camp
Garmin Base Camp is a mapping application that allows
the user to transfer waypoints, tracks, and routes between the
computer and the Garmin device. [27] This software assisted
with creating and organizing waypoints and routes. A total of
seventy-six test points, including four new points being
added in the Pasquotank River, were tested this year. Each of
these points was visited twice during this research project.
IV. METHODOLOGY
A. Pre-Field Work
Preparing for the fieldwork, the Global Positioning
Systems (GPS) devices were loaded with points and routes
by using the Garmin BaseCamp software for each waterway.
Before each waterway was tested, the Dissolved Oxygen
(DO) meter was calibrated using zero solution and distilled
water. Once the meter was calibrated, a checklist was
completed to ensure that all test equipment was gathered and
fresh batteries were installed. Duplicate test equipment was
taken on each trip to ensure that data would be captured.
B. Field Work
The canoe or boat was launched into the water and was
loaded with the gear needed such as paddles, communication
devices, test equipment, and data sheets. The test equipment
was secured to the boat in case of an accident.
At each test point, several pieces of data were recorded.
The time was noted as a reference for samples being taken as
several test results could vary during the day. Once the time
was taken, wind speed, wind direction, and air temperature
were obtained. The water temperature and water sample
were acquired utilizing the thermometer and bottle attached
to a pole allowing them to be obtained at a consistent depth
of three feet. The clarity and turbidity were acquired using
the Secchi disk and the amount of dissolved oxygen in the
water was obtained by using the DO meter.
C. Post-Field Work
Once all the data was collected, in-house tests were
performed to obtain the pH, conductivity, salinity and the
total dissolved solids information. The pH meter was
calibrated using distilled water and a pH tablet. The water
samples that were taken from the field work were poured
into small styrofoam cups for testing. The pH meter was
placed into the sample and the pH readings were recorded.
This was also done for the Pocket Tester which was used to
test salinity, conductivity, and total dissolved solids.
D. Data Entry
When all the testing was completed, the data readings
were transferred to a Microsoft Excel spreadsheet. Microsoft
Excel was used to calculate averages and for visual
comparison utilizing graphs. This spreadsheet contained data
in the following columns: name of the waterway, point in the
waterway, time, date, pH, DO, corrected DO, water
temperature, air temperature, clarity, turbidity, total dissolved
solids, conductivity, salinity, wind speed, and wind direction.
Columns and rows were also used to average the data. The
data in the spreadsheet was merged with HTML and
JavaScript to be used in Google Maps to be displayed in the
web browser.
V. ANALYSIS
A. Water Quality Index
The overall water quality index (WQI) for all of the
waterways that were tested remained constant. Individually,
some have either fallen, some have risen, and the others
remain in a range set by the past teams.
Newbegun Creek’s water quality fell between the two
water qualities recorded by the 2011 team and the 2013 team
with a medium WQI. Mill Dam Creek’s water quality has
risen higher than both teams' readings but still has a bad
WQI. Areneuse Creek’s water quality is greater than the
previous years and advanced to have a medium WQI. The
Pasquotank River’s water quality is lower than the 2013 and
2011 teams' readings and has the lowest reading for the 2014
Watershed Research Project. Sawyers Creek’s water
quality fell between the two previous teams' WQIs with a
medium water quality index. Knobbs Creek’s water quality
recorded a higher WQI than the two preceding teams and the
highest for 2014. This year is the first year the lower
Pasquotank has been tested. The lower Pasquotank had a
good WQI due to it width.
Figure 1. Water Quality Comparison between the
2014, 2013 and 2011 Projects
Figure 2. Averaged Water Source Readings for 2014, 2013, and 2011 Projects
B. Dissolved Oxygen
The dissolved oxygen measurements for 2014
corresponded to the 2013 and 2011 projects. the
measurements differed between the head of the each
waterway and their intersection with the Pasquotank River.
The leading factor for calculating dissolved oxygen was
wind and the width of the waterway. From the waterways
that have been previously compared, Knobbs Creek had the
best water quality this year, mainly due to its high dissolved
oxygen readings. The lower Pasquotank River had a better
reading than any other waterway this year, possibly due to its
width and the winds affects.
C. TDS/Salinity/Conductivity
The 2014 readings for total dissolved solids (TDS),
salinity, and conductivity have all decreased from the 2013
readings. The air temperature was lower in 2014 possibly
illustrating a lower amount of evaporation which would yield
a lower salinity reading. The lower salinity is, the lower the
amount of ions in the water leading to lower conductivity
readings.
Knobbs Creek had a high reading of salinity, TDS, and
conductivity. This was possibly due to rain at the first set of
test points. Rain decreases the salinity reading as it dilutes
the salt. Newbegun Creek, Areneuse Creek, and the
Pasquotank River had a high salinity reading as these
brackish (high levels of salt) waterways are located nearer to
the ocean. The TDS, salinity, and conductivity readings for
the lower Pasquotank River were higher than any other
waterway for this year’s project.
Salinity in freshwater streams is a major indicator in sea
level rise. This year’s readings were much lower than
previous years, which may have been due to more moderate
temperatures during this year’s research.
D. pH
The pH levels remained similar to the previous years’
readings. Newbegun Creek, Mill Dam Creek, and Areneuse
Creek had a base pH this year (7.1-14). The Pasquotank
River, Sawyers Creek, and Knobbs Creeks had a reading of
either 6.9 or lower which made them acidic. The lower
Pasquotank River’s pH readings were close to the other
waterways this year.
E. Clarity/Turbidity
The clarity and turbidity readings have kept a constant
standard from previous years. The clarity was always ten
inches or higher than turbidity because turbidity determines
the amount of suspended particles in the water and clarity
determines how clear the water is. No variations were
recognized. The lower Pasquotank River’s readings were
close to Mill Dam Creek, Areneuse Creek, and Newbegun
Creek as these three waterways empty into the lower
Pasquotank.
VI. CONCLUSION
A. Overall
In this year’s project, the data and graphs present the
continued healthiness of the Pasquotank Watershed.
Determined by the Water Quality Index Calculator, this
year’s water quality has not greatly differed from 2013 and
2011 water quality tests.
B. Variations
There were minor variations found in the WQI, but the
overall quality of the waterways this year was within the
medium range or close to it. The most noticeable variation
was the comparison between the 2014, 2013, and 2011 TDS,
salinity, and conductivity readings. The readings for 2014
decreased greatly from the 2013 and 2011 readings. This
may have been due to the lower temperatures during this
year’s research period.
C. The Lower Pasquotank River
This is the first year of testing the lower Pasquotank
River. The water quality of this water was good compared to
the other waterways. This was due to the width of the water
waterway, its saltiness, and the close attachment to the
ocean. The lower Pasquotank River is connected with Mill
Dam Creek, Areneuse Creek, and Newbegun Creek. These
waterways have similar pH, clarity, turbidity, dissolved
oxygen, salinity, conductivity, and TDS readings.
D. Areneuse; Mill Dam; and Newbegun Creek
This year’s readings continued to follow the pattern of
last year’s readings in that the salinity, TDS, and
conductivity were much higher in the waterways below
Elizabeth City where the Pasquotank River widens. With the
addition of the four new waypoints in the lower Pasquotank,
the team was able to gather data confirming this correlation.
Continued testing of these new points will add to the further
monitoring of this section of the watershed.
E. Data Sampling
The team was provided with sufficient tools to perform
the field testing needed for each waterway. The test
equipment allowed the team to gather two sets of data from
each waterway. More data allows for more accuracy
providing a more definite assessment of the Pasquotank
watershed.
F. Data Presentation
The team used an online interactive map of data points
created in 2011 and expanded in 2013. The code for this
project utilized JavaScript and Hypertext Markup Language
(HTML) to merge the spreadsheet information with the
Google Maps interface.
Four points were added to the Pasquotank River, which is
labeled as the lower Pasquotank Watershed for this project.
These points are not as close together as the other waterways,
but will allow for a larger area to be sampled.
VII. FUTURE WORKS
A. Boating/ Testing
For accurate testing, it is suggested that during the
weekly boating trips on the LH Viking, tests be taken for
points 28, 29, 30, and 31 of the lower Pasquotank River. This
will increase the amount of data for these four points over a
longer period of time.
B. Research Platform
The acquisition of a small outboard engine for the canoe,
with costs between $100 and $1000, would decrease the time
needed to test each waterway. This engine could be electric
or gas with electric being the preferred due to stopping and
starting conditions of testing each waterway.
C. Digital Thermometer
For a more accurate reading, a digital thermometer is
suggested to be used in the field work. The Water-Proof
Thermometer by Hoskin Scientific [28] has a probe cord of
five feet and has retail price of $32. This meter will provide a
more accurate reading of the water temperature as compared
to the current mercury thermometer being used.
D. Database Development
An online database that gives access to any set of data
from any project year should be developed for future
analysis. Developing a PHP Hypertext Preprocessor (PHP)
interface with the data needed would allow for better
comparison and contrasting of multiple sets of data.
E. Added Test
Adding the testing of nitrate or nitrogen would increase
the accuracy of the Water Quality Index calculation. These,
along with the other tests currently being performed, are
major factors of determining the health of the water. The
Hanna Instruments HI 764 Checker HC Handheld
Colorimeter, For Nitrate, which is manufactured by Hanna
Instruments, is a capable of measuring Nitrate. With this
meter, nitrate is measured in parts-per-billion (ppb). The
retail price of this instrument is approximately $47.30.
F. Inclement Weather Data Recording
During this year’s trip, the inclement weather inhibited us
to record data due to wet data sheets. This occurred on three
trips. On the first trip, the data sheet was wet and difficult to
read. The second trip, the equipment bags assisted in keeping
the data sheet dry. The third trip, grease pens and laminated
data sheets were used, but the data was not as readable. The
“Rite in the Rain” company provides all-weather paper and
writing utensils. It is recommended that the paper and pens
be purchased from this company.
ACKNOWLEDGEMENT
We would like to acknowledge Dr. Linda Hayden for her
leadership of the Research Experience for Undergraduates
(REU) program, Mr. Lee Hayden for his assistance with the
boat, Center for Remote Sensing of Ice Sheets (CReSIS) and
the National Science Foundation (NSF) for their funding of
this program, and the REU staff for their daily assistance.
REFERENCES
[1] Briney, A. (2014). “Overview of Watersheds and Watershed
Management.”
[Online].
Available.
http://geography.about.com/od/physicalgeography/a/watershe
ds.htm.
[2] The Nature Conservancy. (2014). “The Importance of
Watersheds.”
[Online].
Available.
http://www.nature.org/ourinitiatives/regions/northamerica/uni
tedstates/indiana/journeywithnature/watersheds-101.xml.
[3] Murphy, S. (2007). “General Information on Dissolved
Oxygen.”
[Online].
Available.
http://bcn.boulder.co.us/basin/data/NEW/info/DO.html.
[4] USGS Water Science School. (2014). “Water properties,
Dissolved
Oxygen.”
[Online].
Available.
http://water.usgs.gov/edu/dissolvedoxygen.html.
[5] United States Environmental Protection Agency. (1999).
“Importance
of
Turbidity.”
[Online].
Available.
http://www.epa.gov/ogwdw000/mdbp/pdf/turbidity/chap_07.p
df.
[6] United States Environmental Protection Agency. (2012).
“Turbidity | Monitoring & Assessment.” [Online]. Available.
http://water.epa.gov/type/rsl/monitoring/vms55.cfm.
[7] USGS Water Science School. (2014). “Turbidity.” [Online}.
Available. http://water.usgs.gov/edu/turbidity.html.
[8] Chesapeake Bay Program Science. Restoration. Partnership.
“Water
Clarity.”
[Online].
Available.
https://www.chesapeakebay.net/discover/bayecosystem/water
clarity.
[9] Wilson, C. “Water Quality Notes: Water Clarity (Turbidity,
Suspended Solids, and Color).” [Online]. Available.
http://edis.ifas.ufl.edu/pdffiles/SS/SS52600.pdf.
[10] University of Florida. “Measuring Water Clarity.” [Online].
Available.
http://lakewatch.ifas.ufl.edu/circpdffolder/claritypt1to3.pdf.
[11] HM Digital. (2012). “What is TDS?.” [Online]. Available.
http://www.tdsmeter.com/what-is#where.
[12] Fondriest
Environmental
Incorporation.
(2014).
“Conductivity, Salinity, and Total Dissolved Solids.”
[Online]. Available. http://www.fondriest.com/environmentalmeasurements/parameters/water-quality/conductivity-salinitytds/#cond6.
[13] United States Environmental Protection Agency. (2012).
“What
is
pH?.”
[Online].
Available.
http://www.epa.gov/acidrain/measure/ph.html.
[14] MacUpdate. (2014). “Garmin BaseCamp.” [Online].
Available.
http://www.macupdate.com/app/mac/31527/garminbasecamp.
[15] Davis Instrument. (2014). “DURAC PLUS BLUE Spirit
Pocket Thermometer Window Plastic Case 0 220F from
Davis
Instruments.”
[Online].
Available.
http://www.davis.com/Product/DURAC_PLUS_BLUE_Spirit
_Pocket_Thermometer_Window_Plastic_Case_0_220F/YX90260-58?referred_id=3388&gclid=CMYsabD9L4CFTJp7AodUgoADA[16]
[16] Fairman, J. (1996). “Knots versus Miles per Hour.” [Online].
Available.
http://www.grc.nasa.gov/WWW/k12/WindTunnel/Activities/knots_vs_mph.html.
[17] Milwaukee. (2011). “MW600 Standard Portable Dissolved
Oxygen
Meter.”
[Online].
Available.
http://www.milwaukeeinst.com/site/component/content/article
/36-standard-portable-meters/87-products-g-standardportable-meters-g-mw600.
[18] Milwaukee. “Milwaukee User Manual.” [Online]. Available.
http://www.milwaukeetesters.com/pdf/MW600.pdf.
[19] Department of Ecology State of Washington. “A Citizen’s
Guide to Understanding and Monitoring Lakes and Streams.”
[Online].
Available.
http://www.ecy.wa.gov/programs/wq/plants/management/joys
manual/secchi.html.
[20] LaMotte. (2014). “Salt/pH/TDS/Temp TRACER.” [Online].
Available.
http://www.lamotte.com/en/education/instrumentation/pocket
esters/1766.html.
[21] Hanna Instruments. (2014). “pH Meters.” [Online]. Available.
http://hannainst.com/usa/subcat.cfm?id=040.
[22] Rouse, M. (2013). “What is Google Maps?.” [Online].
Available.
http://whatis.techtarget.com/definition/GoogleMaps.
[23] Heng, C. (2014). “Dreamweaver CS5 Tutorial: How to design
a Website with Dreamweaver CS5.” [Online]. Available.
http://www.thesitewizard.com/dreamweaver/dreamweavercs5-tutorial-1.shtml.
[24] Portland Community College. “What is Microsoft Excel?.”
[Online]. Available. https://www.pcc.edu/resources/computerlabs/sylvania/documents/excel-guide.pdf.
[25] French, T. (2014). “What is Microsoft Excel and When
Would
I
Use
it?.”
[Online].
Available.
http://spreadsheets.about.com/od/tipsandfaqs/f/excel_use.htm.
[26] Portland State University. (2007). “Water Quality Index
Calculator.”
[Online].
Available.
http://www.swrp.esr.pdx.edu/teacher_info/presentations/wqi_
calculator.htm.
[27] Garmin. (2014). “BaseCamp for Mac Software version 4.3.4.”
[Online].
Available.
http://www8.garmin.com/support/download_details.jsp?id=44
49.
[28] Hoskin Scientific. (2014). “Water-Proof Thermometer.”
[Online].
Available.
http://www.hoskin.ca/catalog/index.php?main_page=product_
info&cPath=2_795_860_862&products_id=2243
[29] Duke
Biology
Department,
[Online]
Available.
http://biology.duke.edu/bio217/2001/sealevel/page5.html