1
Using the TSK3000 Embedded Tools
GU0111 May 05, 2008
Software, hardware, documentation and related materials:
Copyright E 2008 Altium Limited. All Rights Reserved.
The material provided with this notice is subject to various forms of national and international intellectual property protection, including but not
limited to copyright protection. You have been granted a non−exclusive license to use such material for the purposes stated in the end−user
license agreement governing its use. In no event shall you reverse engineer, decompile, duplicate, distribute, create derivative works from or in
any way exploit the material licensed to you except as expressly permitted by the governing agreement. Failure to abide by such restrictions may
result in severe civil and criminal penalties, including but not limited to fines and imprisonment. Provided, however, that you are permitted to
make one archival copy of said materials for back up purposes only, which archival copy may be accessed and used only in the event that the
original copy of the materials is inoperable. Altium, Altium Designer, Board Insight, DXP, Innovation Station, LiveDesign, NanoBoard, NanoTalk,
OpenBus, P−CAD, SimCode, Situs, TASKING, and Topological Autorouting and their respective logos are trademarks or registered trademarks
of Altium Limited or its subsidiaries. All other registered or unregistered trademarks referenced herein are the property of their respective owners
and no trademark rights to the same are claimed. v8.0 31/3/08
Table of Contents
Table of Contents
Getting Started with Embedded Software
1.1
1.2
1.3
1.3.1
1.3.2
1.4
1.4.1
1.4.2
1.5
1.5.1
1.5.2
1.6
1.6.1
1.6.2
1.6.3
1.6.4
Introduction . . . . . . . . . . . . . . . . . . . . . . . . . . . . . . . . . . . . . . . . . . . . . . . . . . . . . . . . . . . . . . . . . . . . . .
Embedded Software Tools . . . . . . . . . . . . . . . . . . . . . . . . . . . . . . . . . . . . . . . . . . . . . . . . . . . . . . . . .
Creating an Embedded Project . . . . . . . . . . . . . . . . . . . . . . . . . . . . . . . . . . . . . . . . . . . . . . . . . . . . .
Adding a new source file to the project . . . . . . . . . . . . . . . . . . . . . . . . . . . . . . . . . . . . . . . . . . . . . . .
Adding an existing source file to the project . . . . . . . . . . . . . . . . . . . . . . . . . . . . . . . . . . . . . . . . . .
Setting the Embedded Project Options . . . . . . . . . . . . . . . . . . . . . . . . . . . . . . . . . . . . . . . . . . . . . . .
Selecting a device . . . . . . . . . . . . . . . . . . . . . . . . . . . . . . . . . . . . . . . . . . . . . . . . . . . . . . . . . . . . . . . .
Setting the tool options . . . . . . . . . . . . . . . . . . . . . . . . . . . . . . . . . . . . . . . . . . . . . . . . . . . . . . . . . . . .
Building your Embedded Application . . . . . . . . . . . . . . . . . . . . . . . . . . . . . . . . . . . . . . . . . . . . . . . .
Compiling a single source file . . . . . . . . . . . . . . . . . . . . . . . . . . . . . . . . . . . . . . . . . . . . . . . . . . . . . .
Rebuiling your entire application . . . . . . . . . . . . . . . . . . . . . . . . . . . . . . . . . . . . . . . . . . . . . . . . . . . .
Debugging your Embedded Application . . . . . . . . . . . . . . . . . . . . . . . . . . . . . . . . . . . . . . . . . . . . . .
Setting breakpoints . . . . . . . . . . . . . . . . . . . . . . . . . . . . . . . . . . . . . . . . . . . . . . . . . . . . . . . . . . . . . . .
Evaluating and watching expressions . . . . . . . . . . . . . . . . . . . . . . . . . . . . . . . . . . . . . . . . . . . . . . . .
Viewing output . . . . . . . . . . . . . . . . . . . . . . . . . . . . . . . . . . . . . . . . . . . . . . . . . . . . . . . . . . . . . . . . . . .
Viewing memory . . . . . . . . . . . . . . . . . . . . . . . . . . . . . . . . . . . . . . . . . . . . . . . . . . . . . . . . . . . . . . . . . .
Using the C Compiler
2.1
2.2
2.3
2.3.1
2.4
2.5
2.6
2.6.1
2.6.2
2.6.3
2.7
2.8
Introduction . . . . . . . . . . . . . . . . . . . . . . . . . . . . . . . . . . . . . . . . . . . . . . . . . . . . . . . . . . . . . . . . . . . . . .
Compilation Process . . . . . . . . . . . . . . . . . . . . . . . . . . . . . . . . . . . . . . . . . . . . . . . . . . . . . . . . . . . . . .
Calling the Compiler . . . . . . . . . . . . . . . . . . . . . . . . . . . . . . . . . . . . . . . . . . . . . . . . . . . . . . . . . . . . . .
Overview of C Compiler Options . . . . . . . . . . . . . . . . . . . . . . . . . . . . . . . . . . . . . . . . . . . . . . . . . . . .
How the Compiler Searches Include Files . . . . . . . . . . . . . . . . . . . . . . . . . . . . . . . . . . . . . . . . . . . .
Compiling for Debugging . . . . . . . . . . . . . . . . . . . . . . . . . . . . . . . . . . . . . . . . . . . . . . . . . . . . . . . . . .
Compiler Optimizations . . . . . . . . . . . . . . . . . . . . . . . . . . . . . . . . . . . . . . . . . . . . . . . . . . . . . . . . . . . .
Generic optimizations (frontend) . . . . . . . . . . . . . . . . . . . . . . . . . . . . . . . . . . . . . . . . . . . . . . . . . . . .
Core specific optimizations (backend) . . . . . . . . . . . . . . . . . . . . . . . . . . . . . . . . . . . . . . . . . . . . . . .
Optimize for Size or Speed . . . . . . . . . . . . . . . . . . . . . . . . . . . . . . . . . . . . . . . . . . . . . . . . . . . . . . . . .
C Code Checking: MISRA−C . . . . . . . . . . . . . . . . . . . . . . . . . . . . . . . . . . . . . . . . . . . . . . . . . . . . . . .
C Compiler Error Messages . . . . . . . . . . . . . . . . . . . . . . . . . . . . . . . . . . . . . . . . . . . . . . . . . . . . . . . .
Profiling
3.1
3.1.1
3.2
3.2.1
3.2.1.1
3.2.1.2
3.2.2
3.2.3
1−1
1−1
1−4
1−4
1−5
1−5
1−5
1−6
1−7
1−7
1−7
1−8
1−8
1−8
1−9
1−9
2−1
2−1
2−1
2−2
2−3
2−5
2−6
2−6
2−7
2−8
2−8
2−9
2−10
3−1
What is profiling? . . . . . . . . . . . . . . . . . . . . . . . . . . . . . . . . . . . . . . . . . . . . . . . . . . . . . . . . . . . . . . . . .
Three methods of profiling . . . . . . . . . . . . . . . . . . . . . . . . . . . . . . . . . . . . . . . . . . . . . . . . . . . . . . . . .
Profiling using Code Instrumentation . . . . . . . . . . . . . . . . . . . . . . . . . . . . . . . . . . . . . . . . . . . . . . . .
Step 1: Build your Application for Profiling . . . . . . . . . . . . . . . . . . . . . . . . . . . . . . . . . . . . . . . . . . . .
Profiling Modules and Libraries . . . . . . . . . . . . . . . . . . . . . . . . . . . . . . . . . . . . . . . . . . . . . . . . . . . . .
Linking Profiling Libraries . . . . . . . . . . . . . . . . . . . . . . . . . . . . . . . . . . . . . . . . . . . . . . . . . . . . . . . . . .
Step 2: Execute the Application . . . . . . . . . . . . . . . . . . . . . . . . . . . . . . . . . . . . . . . . . . . . . . . . . . . . .
Step 3: Displaying Profiling Results . . . . . . . . . . . . . . . . . . . . . . . . . . . . . . . . . . . . . . . . . . . . . . . . .
Using the Assembler
4.1
4.2
4.3
4.3.1
4.4
4.5
4.6
4.7
1−1
Introduction . . . . . . . . . . . . . . . . . . . . . . . . . . . . . . . . . . . . . . . . . . . . . . . . . . . . . . . . . . . . . . . . . . . . . .
Assembly Process . . . . . . . . . . . . . . . . . . . . . . . . . . . . . . . . . . . . . . . . . . . . . . . . . . . . . . . . . . . . . . . .
Calling the Assembler . . . . . . . . . . . . . . . . . . . . . . . . . . . . . . . . . . . . . . . . . . . . . . . . . . . . . . . . . . . . .
Overview of Assembler Options . . . . . . . . . . . . . . . . . . . . . . . . . . . . . . . . . . . . . . . . . . . . . . . . . . . .
How the Assembler Searches Include Files . . . . . . . . . . . . . . . . . . . . . . . . . . . . . . . . . . . . . . . . . .
Assembler Optimizations . . . . . . . . . . . . . . . . . . . . . . . . . . . . . . . . . . . . . . . . . . . . . . . . . . . . . . . . . .
Generating a List File . . . . . . . . . . . . . . . . . . . . . . . . . . . . . . . . . . . . . . . . . . . . . . . . . . . . . . . . . . . . .
Assembler Error Messages . . . . . . . . . . . . . . . . . . . . . . . . . . . . . . . . . . . . . . . . . . . . . . . . . . . . . . . .
3−1
3−1
3−2
3−2
3−3
3−3
3−4
3−5
4−1
4−1
4−1
4−2
4−3
4−4
4−5
4−5
4−6
iii
Using the TSK3000 Embedded Tools
Using the Linker
5.1
5.2
5.2.1
5.2.2
5.3
5.3.1
5.4
5.4.1
5.4.2
5.5
5.6
5.7
5.8
5.9
5.9.1
5.9.2
5.9.3
5.9.4
5.9.5
5.9.6
5.9.7
5.9.8
5.10
5.11
5.12
Introduction . . . . . . . . . . . . . . . . . . . . . . . . . . . . . . . . . . . . . . . . . . . . . . . . . . . . . . . . . . . . . . . . . . . . . .
Linking Process . . . . . . . . . . . . . . . . . . . . . . . . . . . . . . . . . . . . . . . . . . . . . . . . . . . . . . . . . . . . . . . . . .
Phase 1: Linking . . . . . . . . . . . . . . . . . . . . . . . . . . . . . . . . . . . . . . . . . . . . . . . . . . . . . . . . . . . . . . . . . .
Phase 2: Locating . . . . . . . . . . . . . . . . . . . . . . . . . . . . . . . . . . . . . . . . . . . . . . . . . . . . . . . . . . . . . . . .
Calling the Linker . . . . . . . . . . . . . . . . . . . . . . . . . . . . . . . . . . . . . . . . . . . . . . . . . . . . . . . . . . . . . . . . .
Overview of Linker Options . . . . . . . . . . . . . . . . . . . . . . . . . . . . . . . . . . . . . . . . . . . . . . . . . . . . . . . .
Linking with Libraries . . . . . . . . . . . . . . . . . . . . . . . . . . . . . . . . . . . . . . . . . . . . . . . . . . . . . . . . . . . . . .
How the Linker Searches Libraries . . . . . . . . . . . . . . . . . . . . . . . . . . . . . . . . . . . . . . . . . . . . . . . . . .
How the Linker Extracts Objects from Libraries . . . . . . . . . . . . . . . . . . . . . . . . . . . . . . . . . . . . . . .
Incremental Linking . . . . . . . . . . . . . . . . . . . . . . . . . . . . . . . . . . . . . . . . . . . . . . . . . . . . . . . . . . . . . . .
Linking the C Startup Code . . . . . . . . . . . . . . . . . . . . . . . . . . . . . . . . . . . . . . . . . . . . . . . . . . . . . . . .
Importing Binary Files . . . . . . . . . . . . . . . . . . . . . . . . . . . . . . . . . . . . . . . . . . . . . . . . . . . . . . . . . . . . .
Linker Optimizations . . . . . . . . . . . . . . . . . . . . . . . . . . . . . . . . . . . . . . . . . . . . . . . . . . . . . . . . . . . . . .
Controlling the Linker with a Script . . . . . . . . . . . . . . . . . . . . . . . . . . . . . . . . . . . . . . . . . . . . . . . . . .
Purpose of the Linker Script Language . . . . . . . . . . . . . . . . . . . . . . . . . . . . . . . . . . . . . . . . . . . . . .
Altium Designer and LSL . . . . . . . . . . . . . . . . . . . . . . . . . . . . . . . . . . . . . . . . . . . . . . . . . . . . . . . . . .
Structure of a Linker Script File . . . . . . . . . . . . . . . . . . . . . . . . . . . . . . . . . . . . . . . . . . . . . . . . . . . . .
The Architecture Definition . . . . . . . . . . . . . . . . . . . . . . . . . . . . . . . . . . . . . . . . . . . . . . . . . . . . . . . . .
The Derivative Definition . . . . . . . . . . . . . . . . . . . . . . . . . . . . . . . . . . . . . . . . . . . . . . . . . . . . . . . . . . .
The Processor Definition: Using Multi−Processor Systems . . . . . . . . . . . . . . . . . . . . . . . . . . . . .
The Memory Definition . . . . . . . . . . . . . . . . . . . . . . . . . . . . . . . . . . . . . . . . . . . . . . . . . . . . . . . . . . . .
The Section Layout Definition: Locating Sections . . . . . . . . . . . . . . . . . . . . . . . . . . . . . . . . . . . . . .
Linker Labels . . . . . . . . . . . . . . . . . . . . . . . . . . . . . . . . . . . . . . . . . . . . . . . . . . . . . . . . . . . . . . . . . . . .
Generating a Map File . . . . . . . . . . . . . . . . . . . . . . . . . . . . . . . . . . . . . . . . . . . . . . . . . . . . . . . . . . . . .
Linker Error Messages . . . . . . . . . . . . . . . . . . . . . . . . . . . . . . . . . . . . . . . . . . . . . . . . . . . . . . . . . . . .
Using the Utilities
6.1
6.2
6.2.1
6.2.2
6.3
6.3.1
6.3.2
6.3.3
6.4
6.4.1
6.4.2
6.4.3
Index
iv
Introduction . . . . . . . . . . . . . . . . . . . . . . . . . . . . . . . . . . . . . . . . . . . . . . . . . . . . . . . . . . . . . . . . . . . . . .
Control Program . . . . . . . . . . . . . . . . . . . . . . . . . . . . . . . . . . . . . . . . . . . . . . . . . . . . . . . . . . . . . . . . . .
Calling the Control Program . . . . . . . . . . . . . . . . . . . . . . . . . . . . . . . . . . . . . . . . . . . . . . . . . . . . . . . .
Overview of Control Program Options . . . . . . . . . . . . . . . . . . . . . . . . . . . . . . . . . . . . . . . . . . . . . . .
Make Utility . . . . . . . . . . . . . . . . . . . . . . . . . . . . . . . . . . . . . . . . . . . . . . . . . . . . . . . . . . . . . . . . . . . . . .
Calling the Make Utility . . . . . . . . . . . . . . . . . . . . . . . . . . . . . . . . . . . . . . . . . . . . . . . . . . . . . . . . . . . .
Overview of Make Utility Options . . . . . . . . . . . . . . . . . . . . . . . . . . . . . . . . . . . . . . . . . . . . . . . . . . . .
Writing a MakeFile . . . . . . . . . . . . . . . . . . . . . . . . . . . . . . . . . . . . . . . . . . . . . . . . . . . . . . . . . . . . . . . .
Librarian . . . . . . . . . . . . . . . . . . . . . . . . . . . . . . . . . . . . . . . . . . . . . . . . . . . . . . . . . . . . . . . . . . . . . . . . .
Calling the Librarian . . . . . . . . . . . . . . . . . . . . . . . . . . . . . . . . . . . . . . . . . . . . . . . . . . . . . . . . . . . . . . .
Overview of Librarian Options . . . . . . . . . . . . . . . . . . . . . . . . . . . . . . . . . . . . . . . . . . . . . . . . . . . . . .
Examples . . . . . . . . . . . . . . . . . . . . . . . . . . . . . . . . . . . . . . . . . . . . . . . . . . . . . . . . . . . . . . . . . . . . . . . .
5−1
5−1
5−1
5−2
5−3
5−4
5−5
5−7
5−8
5−8
5−9
5−9
5−10
5−10
5−11
5−11
5−11
5−12
5−14
5−15
5−16
5−16
5−17
5−19
5−21
5−21
6−1
6−1
6−2
6−2
6−3
6−5
6−6
6−6
6−7
6−13
6−13
6−13
6−14
Manual Purpose and Structure
Manual Purpose and Structure
Windows Users
The documentation explains and describes how to use the TASKING TSK3000 toolset to program a TSK3000 processor.
You can use the tools either with the graphical Altium Designer or from the command line in a command prompt window.
Structure
The toolset documentation consists of a user’s manual (this manual), which includes a Getting Started section, and a separate
reference manual (TSK3000 Embedded Tools Reference).
Start by reading the Getting Started in Chapter 1.
The other chapters explain how to use the compiler, assembler, linker and the various utilities.
Once you are familiar with these tools, you can use the reference manual to lookup specific options and details to make full use
of the TASKING toolset.
The reference manual describes the C language implementation and the assembly language.
v
Using the TSK3000 Embedded Tools
Short Table of Contents
Chapter 1: Getting Started
Overview of the toolset and its individual elements. Explains step−by−step how to write, compile, assemble and debug your
application. Teaches how you can use embedded projects to organize your files.
Chapter 2: Using the C Compiler
Describes how you can use the C compiler. An extensive overview of all options is included in the reference manual.
Chapter 3: Profiling
Describes the process of collecting statistical data about a running application.
Chapter 4: Using the Assembler
Describes how you can use the assembler. An extensive overview of all options is included in the reference manual.
Chapter 5: Using the Linker
Describes how you can use the linker. An extensive overview of all options is included in the reference manual.
Chapter 6: Using the Utilities
Describes several utilities and how you can use them to facilitate various tasks. The following utilities are included: control
program, make utility and librarian.
vi
Manual Purpose and Structure
Conventions Used in this Manual
Notation for syntax
The following notation is used to describe the syntax of command line input:
bold
Type this part of the syntax literally.
italics
Substitute the italic word by an instance. For example:
filename
Type the name of a file in place of the word filename.
{}
Encloses a list from which you must choose an item.
[]
Encloses items that are optional. For example
c3000 [ −? ]
Both c3000 and c3000 −? are valid commands.
|
Separates items in a list. Read it as OR.
...
You can repeat the preceding item zero or more times.
Example
c3000 [option]... filename
You can read this line as follows: enter the command c3000 with or without an option, follow this by zero or more options and
specify a filename. The following input lines are all valid:
c3000 test.c
c3000 −g test.c
c3000 −g −s test.c
Not valid is:
c3000 −g
According to the syntax description, you have to specify a filename.
Icons
The following illustrations are used in this manual:
Note: notes give you extra information.
Warning: read the information carefully. It prevents you from making serious mistakes or from loosing information.
This illustration indicates actions you can perform with the mouse. Such as Altium Designer menu entries and dialogs.
Command line: type your input on the command line.
Reference: follow this reference to find related topics.
vii
Using the TSK3000 Embedded Tools
Related Publications
C Standards
• ISO/IEC 9899:1999(E), Programming languages − C [ISO/IEC]
More information on the standards can be found at http://www.ansi.org
• DSP−C, An Extension to ISO/IEC 9899:1999(E),
Programming languages − C [TASKING, TK0071−14]
MISRA−C
• Guidelines for the Use of the C Language in Vehicle Based Software [MIRA limited, 1998]
See also http://www.misra.org.uk
• MISRA−C:2004: Guidelines for the use of the C Language in critical systems [MIRA limited, 2004]
See also http://www.misra−c.com
TASKING Tools
• TSK3000 Embedded Tools Reference
[Altium, TR0109]
• TSK3000A 32−bit RISC Processor Core Reference
[Altium, CR0121]
viii
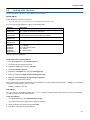
1 Getting Started with Embedded Software
Summary
1.1
This tutorial shows how to create an embedded software project with Altium
Designer.
Introduction
This tutorial presumes you are familiar with programming in C/assembly and have basic knowledge of embedded programming.
It contains an overview of the TASKING tools available in Altium Designer. It describes how you can add, create and edit source
files in an embedded project and how to build an embedded application. An embedded software project is normally used as a
subproject for an FPGA project and once they are built, they are downloaded and executed inside an FPGA device.
The example used in this tutorial is a Hello World program in C. Other examples are supplied in the \Examples\NanoBoard
Common\Processor Examples folder relative to the installation path.
1.2
Embedded Software Tools
With the TASKING embedded software tools in Altium Designer you can write, compile, assemble and link applications for
several targets, such as the TSK51x/TSK52x, TSK80x, TSK165x, PowerPC, TSK3000, MicroBlaze, Nios II and ARM.
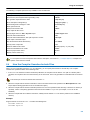
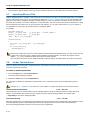
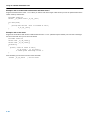
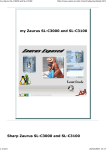
Figure 1−1 shows all components of the TASKING toolset with their input and output files.
The C compiler, assembler, linker and debugger are target dependent, whereas the librarian is target independent. The bold
names in the figure are the executable names of the tools. Substitute target with one of the supported target names, for
example, c3000 is the TSK3000 C compiler, cppc is the PowerPC C compiler, etc.
1−1
Using the TSK3000 Embedded Tools
C source file
.c
C compiler
ctarget
assembly file
.asm
(hand coded)
assembly file
.src
assembler
as target
librarian
tlb
error messages .err
list file .lst
error messages .ers
relocatable object file
.obj
relocatable object library
.lib
relocatable linker object file
.out
linker script file
.lsl
linker
lktarget
memory definition
file .mdf
relocatable linker object file
.out
Intel Hex
absolute object file
.hex
ELF/DWARF 2
absolute object file
.abs
debugger
simulator
or
hardware
Figure 1−1: Toolset overview
1−2
linker map file .map
error messages .elk
Motorola S−record
absolute object file
.sre
Getting Started with Embedded Software
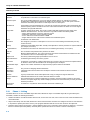
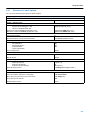
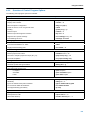
The following table lists the file types used by the TASKING toolset.
Extension
Description
Source files
.c
C source file, input for the C compiler
.asm
Assembler source file, hand coded
.lsl
Linker script file
Generated source files
.src
Assembler source file, generated by the C compiler, does not contain macros
Object files
.obj
ELF/DWARF 2 relocatable object file, generated by the assembler
.lib
Archive with ELF/DWARF 2 object files
.out
Relocatable linker output file
.abs
ELF/DWARF 2 absolute object file, generated by the locating part of the llinker
.hex
Absolute Intel Hex object file
.sre
Absolute Motorola S−record object file
List files
.lst
Assembler list file
.map
Linker map file
.mcr
MISRA−C report file
.mdf
Memory definition file
Error list files
.err
Compiler error messages file
.ers
Assembler error messages file
.elk
Linker error messages file
Table 1−1: File extensions
1−3
Using the TSK3000 Embedded Tools
1.3
Creating an Embedded Project
To start working with Altium Designer, you first need a project. A project makes managing your source documents and any
generated outputs much easier. For embedded software, you need to create an Embedded Software project.
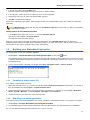
To create a new Embedded Software project:
1. Select File » New » Project » Embedded Project form the menu, or click on Blank Project (Embedded) in the New
section of the Files panel. If this panel is not displayed, click on the Files tab at the bottom of the Design Manager panel.
The Projects panel displays a new project file, Embedded_Project1.PrjEmb.
2. Rename the new project file (with a .PrjEmb extension) by selecting File » Save Project As.
Navigate to the location where you want to save your project, type the name GettingStarted.PrjEmb in the File name
field and click on Save.
1.3.1
Adding a new source file to the project
If you want to add a new source file (C or assembly or text file) to your project, proceed as follows:
1. In the Projects panel, right−click on GettingStarted.PrjEmb and select Add New to Project » C File.
A new C source file, Source1.C, is added to the Embedded Software project under the folder named Source Documents
in the Projects panel. The Text Editor opens ready for your input.
For a new assembly file select Assembly File instead of C File and for a new text file select Text Document.
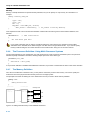
2. Enter the source code required. For this tutorial enter the following code:
#include <stdio.h>
void printloop(void)
{
int loop;
for (loop=0; loop<10; loop++)
{
printf("%i\n",loop);
}
}
void main(void)
{
printf("Hello World!\n");
printloop();
}
1−4
Getting Started with Embedded Software
3. Save the source file by selecting File » Save As.
Navigate to the location where you want to store the source, type the name hello.c in the File name field and click on
Save.
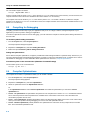
4. Save your project by right−clicking on GettingStarted.PrjEmb in the Projects panel and select Save Project.
Your project now looks like:
1.3.2
Adding an existing source file to the project
If you want to add an exisiting source file to your project, proceed as follows:
1. In the Projects panel, right−click on GettingStarted.PrjEmb and select Add Existing to Project.
The Choose Documents to Add to Project dialog appears.
2. Navigate to the file you want to add to your project and click Open.
The source file is added to the project and listed in the Projects panel.
To edit or view the recently added file in the Text Editor:
3. Double−click on the filename.
Save your project:
4. In the Projects panel, right−click on GettingStarted.PrjEmb and select Save Project.
1.4
Setting the Embedded Project Options
An embedded project in Altium Designer has a set of embedded options associated with it. After you have added files to your
project, and have written your application (hello.c in our example), the next steps in the process of building your embedded
application are:
• selecting a device (resulting in an associated toolset)
• specifying the options of the tools in the toolset, such as the C compiler, assembler and linker options. (Different toolset
configurations may have different sets of options.)
1.4.1
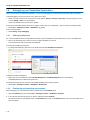
Selecting a device
For an embedded project, you must specify the device for which you want to build your embedded project first:
1. In the Projects panel, right−click on GettingStarted.PrjEmb and select Project Options.
Alternatively: select Project » Project Options.
1−5
Using the TSK3000 Embedded Tools
The Options for Embedded Project dialog appears.
2. In the Compiler Options tab, select the Device. You can make a selection based on manufacturer, or you can select a
generic device. If you select a device from a manufacturer, the correct processor type is selected automatically. If you select
a generic device, you have to specify the target processor type manually.
To specify the target processor type manually (only for a Generic device):
3. In the left pane, expand the Processor entry and select Processor Definition.
4. In the right pane, expand the General entry and set Select processor to the correct target processor.
5. Click OK to accept the new device.
1.4.2
Setting the tool options
You can set embedded options commonly for all files in the project and you can set file specific options.
Setting project wide options
1. In the Projects panel, right−click on GettingStarted.PrjEmb and select Project Options.
Alternatively: select Project » Project Options.
The Options for Embedded Project dialog appears.
1−6
Getting Started with Embedded Software
2. In the left pane, expand the C Compiler entry.
This entry contains several pages where you can specify C compiler settings.
3. In the right pane, set the options to the values you want. Do this for all pages.
4. Repeat steps 2 and 3 for the other tools like assembler and linker.
5. Click OK to confirm the new settings.
Based on the embedded project options, Altium Designer creates a so−called makefile which it uses to build your embedded
application.
On the Miscellaneous page of each tool entry, the Command line options field shows how your settings are translated
to command line options.
Setting options for an individual document
1. In the Projects panel, right−click on hello.c and select Document Options.
Alternatively: select Project » Document Options.
The Options for Document dialog appears.
Steps 2 to 5 are the same as the steps for setting project wide options. The Files With Options tab in the Options for
Embedded Project dialog shows which files have deviating settings. If you right−click on a file in this tab, a menu provides you
with functions to copy options quickly from and to other individual files.
1.5
Building your Embedded Application
You are now ready to build your embedded application.
1. Select Project » Compile Embedded Project GettingStarted.PrjEmb or click on the
button.
The TASKING program builder compiles, assembles, links and locates the files in the embedded project that are out−of−date
or that have been changed during a previous build. The resulting file is the absolute object file GettingStarted.abs in the
ELF/DWARF format.
2. You can view the results of the build in the Output panel (View » Workspace Panels » System » Output).
1.5.1
Compiling a single source file
If you want to compile a single source file:
1. Right−click on the file (hello.c) you want to compile and select Compile Document hello.c. Alternatively, you can open a
file in the Text Editor and select Project » Compile Document hello.c.
2. Open the Messages panel to view any errors that may have occurred during compilation by selecting View » Workspace
Panels » System » Messages, or selecting System » Messages from the Panels tab.
3. Correct any errors in your source files. Save your project files.
1.5.2
Rebuiling your entire application
If you want to build your embedded application from scratch, regardless of their date/time stamp, you can perform a recompile:
1. Select Project » Recompile Embedded Project GettingStarted.PrjEmb.
2. The TASKING program builder compiles, assembles, links and locates all files in the embedded project unconditionally.
You can now debug the resulting absolute object file GettingStarted.abs.
1−7
Using the TSK3000 Embedded Tools
1.6
Debugging your Embedded Application
When you have built your embedded application, you can start debugging the resulted absolute object file with the simulator.
To start debugging, you have to execute one or more source lines:
• Select one of the source level or instruction level step options (Debug » Step Into, Step Over) to step through your source
or select Debug » Run to run the simulation.
A blue line indicates the current execution position.
To view more information about items such as registers, locals, memory or breakpoints, open the various workspace panels:
• Select View » Workspace Panels » Embedded » (a_panel).
To end a debug session:
• Select Debug » Stop Debugging.
1.6.1
Setting breakpoints
You can set breakpoints when the embedded source file is opened. Small blue points indicate where you can set breakpoints:
• Click on the left margin next to the source line to toggle a breakpoint on and off.
A red crossed circle and red line mark the breakpoint.
To change the breakpoint’s properties:
• To change the breakpoint, right−click on the breakpoint and select Breakpoint Properties...
To disable or enable a breakpoint:
• Right−click on the breakpoint and select Disable Breakpoint (or Enable Breakpoint when it was disabled)
A disabled breakpoint is marked with green color.
The breakpoint panel gives an overview of all (disabled) breakpoint and their properties:
• Select View » Workspace Panels » Embedded » Breakpoints.
1.6.2
Evaluating and watching expressions
While debugging, you can examine the value of expressions in the Evaluate panel.
1. Open the Evaluate panel by selecting View » Workspace Panels » Embedded » Evaluate.
2. In the edit field enter the expression you want to evaluate and click Evaluate.
The expression and its value appear below in the Evaluate panel. Click on the Evaluate button every time the variable in the
code is modified.
1−8
Getting Started with Embedded Software
To watch an expression continuously, you can set a watch:
3. Select Add Watch
The new expression and its value appear in the Watches panel. The values in the Watches panel are updated continuously
when the code is executing.
Alternatively: Select Debug » Add Watch; enter an expression and click OK.
The way an expression is evaluated, depends strongly on the amount of debug information in the object file. Also the
optimization level influences the ease of debugging.
1.6.3
Viewing output
It is possible to view the output generated by your embedded application. Remember, you must be in debugging mode.
To open the Output panel:
• Select View » Workspace Panels » System » Output.
The Output panel opens showing the output of the embbeded application.
1.6.4
Viewing memory
It is possible to view the contents of the memory. You can open several memory windows. Remember, you must be in
debugging mode. The type of memory windows you can open, depends on the selected target processor.
To open for example the Main memory window:
1. Select View » Workspace Panels » Embedded » Main.
The Main memory window opens showing the contents of the memory.
1−9
Using the TSK3000 Embedded Tools
2. In the edit field you can specify the address you want to start viewing from.
1−10
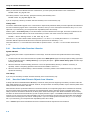
2 Using the C Compiler
This chapter describes the compilation process and explains how to call the compiler.
Summary
2.1
Introduction
Altium Designer uses a makefile to build your entire embedded project, from C source till the final ELF/DWARF 2 object file
which serves as input for the debugger.
Although in Altium Designer you cannot run the compiler separately from the other tools, this section discusses the options that
you can specify for the compiler.
On the command line it is possible to call the compiler separately from the other tools. However, it is recommended to use the
control program for command line invocations of the toolset (see section 6.2, Control Program, in Chapter Using the Utilities).
With the control program it is possible to call the entire toolset with only one command line.
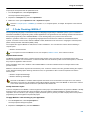
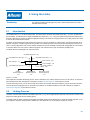
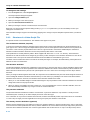
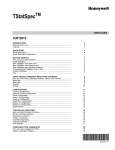
The compiler takes the following files for input and output:
C source file
.c
C compiler
compiler
intermediate file
.mil
assembly file
.src
Figure 2−1: C compiler
This chapter first describes the compilation process which consists of a frontend and a backend part. Next it is described how to
call the C compiler and how to use its options. An extensive list of all options and their descriptions is included in the reference
manual. Finally, a few important basic tasks are described, such as performing various optimizations.
2.2
Compilation Process
During the compilation of a C program, the compiler ctarget runs through a number of phases that are divided into two groups:
frontend and backend.
The backend part is not called for each C statement, but starts after a complete C module or set of modules has been
processed by the frontend (in memory). This allows better optimization.
The compiler requires only one pass over the input file which results in relative fast compilation.
Frontend phases
1. The preprocessor phase:
The preprocessor includes files and substitutes macros by C source. It uses only string manipulations on the C source. The
syntax for the preprocessor is independent of the C syntax but is also described in the ISO/IEC 9899:1999(E) standard.
2. The scanner phase:
The scanner converts the preprocessor output to a stream of tokens.
2−1
Using the TSK3000 Embedded Tools
3. The parser phase:
The tokens are fed to a parser for the C grammar. The parser performs a syntactic and semantic analysis of the program,
and generates an intermediate representation of the program. This code is called MIL (Medium level Intermediate
Language).
4. The frontend optimization phase:
Target processor independent optimizations are performed by transforming the intermediate code.
Backend phases
1. Instruction selector phase:
This phase reads the MIL input and translates it into Low level Intermediate Language (LIL). The LIL objects correspond to a
processor instruction, with an opcode, operands and information used within the compiler.
2. Peephole optimizer/instruction scheduler/software pipelining phase:
This phase replaces instruction sequences by equivalent but faster and/or shorter sequences, rearranges instructions and
deletes unnecessary instructions.
3. Register allocator phase:
This phase chooses a physical register to use for each virtual register.
4. The backend optimization phase:
Performs target processor independent and dependent optimizations which operate on the Low level Intermediate
Language.
5. The code generation/formatter phase:
This phase reads through the LIL operations to generate assembly language output.
2.3
Calling the Compiler
Altium Designer uses a makefile to build your entire project. This means that you cannot run the compiler separately. If you
compile a single C source file from within Altium Designer, the file is also assembled. However, you can set options specific for
the compiler. After you have built your project, the output files of the compilation step are available in your project directory,
unless you specified an alternative output directory in the Build Options page of the Project Options dialog.
To compile and assemble your program
Click either one of the following buttons:
(Compile Active Document)
Compiles and assembles the currently selected file. This results in a relocatable object file (.obj).
(Compile Active Project)
Builds your entire project but only updates files that are out−of−date or have been changed since the last build, which
saves time.
Or select Recompile Embedded Project from the Projects menu.
Builds your entire project unconditionally. All steps necessary to obtain the final .abs file are performed.
Select the right toolset
First make sure you have selected the correct toolset for your target.
1. From the Project menu, select Project Options...
The Project Options dialog box appears.
2. Select the correct Device.
2−2
Using the C Compiler
Select a target processor (core)
If you have selected a toolset that supports several processor cores, by means of a Generic device, you need to choose a
processor type first.
To access the processor options:
1. From the Project menu, select Project Options...
The Project Options dialog box appears.
2. Expand the Processor entry and select Processor Definition.
3. In the Select Processor box select a processor type.
Processor options affect the invocation of all tools in the toolset. In Altium Designer you only need to set them once.
Based on the target processor, the compiler includes a special function register file. This is a regular include file which enables
you to use virtual registers that are located in memory.
To access the compiler options
1. From the Project menu, select Project Options...
The Project Options dialog box appears.
2. Expand the C Compiler entry.
3. Select the sub−entries and set the options in the various pages.
The command line variant is shown simultaneously.
Invocation syntax on the command line (Windows Command Prompt)
The invocation syntax on the command line is:
ctarget [ [option]... [file]... ]...
The input file must be a C source file (.c or .ic). ctarget can be one of the supported C compilers. For example, c3000 (for the
TSK3000).
Example:
c3000 test.c
This compiles the file test.c and generates the file test.src which serves as input for the assembler.
2.3.1
Overview of C Compiler Options
You can set the following C compiler options in Altium Designer.
Menu entry
Command line
Build Options
Include files path
−Idir
Processor » Processor Definition
Multiply/Divide unit present
−−use−hardware=flags,...
C Compiler » Code Generation
Alignment of composite types
−−align−composites=[n|o]
Enable allocation in sdata
−−sdata=size
Allocation in sdata for objects smaller than threshold
Select call mode (default: near)
−−call=[f|n]
C Compiler » Preprocessing
Preprocessing: Define macro,value
−Dmacro[=value]
Include this file before source
−Hfile
Store the C Compiler preprocess output (file.pre)
−E
2−3
Using the TSK3000 Embedded Tools
Menu entry
Command line
C Compiler » Optimization
Optimization level
−O[0|1|2|3]
Size / speed trade−off (default: size)
−t{0|4}
Maximum code size increase caused by inlining
−−inline−max−incr
Maximum size for functions to always inline
−−inline−max−size
C Compiler » Language
ISO C standard: C 90 or C 99 (default: 99)
−c{90|99}
Treat ’char’ variables as unsigned
−u
Treat ’int’ bit−fields as signed
−−signed−bitfields
Language extensions:
−Aflag
Allow C++ style comments in C source
Relax const check for string literals
−Ap
−Ax
C Compiler » Debug Information
Generate symbolic debug information
−g
Generate profiling information
−p[flags]
Run−time checks
−r[flags]
C Compiler » Floating−Point
Use single precision floating−point only
−F
Floating−point trap/exception handling
n.a.
C Compiler » Diagnostics
Warnings
Report all warnings
Suppress all warnings
Suppress specific warnings
no option −w
−w
−wnum[,num]...
Treat warnings as errors
−−warnings−as−errors[=n,...]
C Compiler » MISRA−C
MISRA−C
−−misrac={all|nr[−nr] ,...}
MISRA−C configuration file
n.a
Turn advisory rule violation into warning
−−misrac−advisory−warnings
Turn required rule violation into warning
−−misrac−required−warnings
Produce MISRA−C report
n.a
C Compiler » Miscellaneous
Merge C source code with assembly in output file (.src)
−s
Additional C compiler options
options
Table 2−1: C Compiler options in Altium Designer
2−4
Using the C Compiler
The following C compiler options are only available on the command line:
Description
Command line
Display invocation syntax
−−help[=item,...]
Check source (check syntax without generating code)
−−check
Also generate dependencies for make
−−dep−file=[file]
Show description of diagnostic(s)
−−diag=[fmt:]{all|nr,...}
Redirect diagnostic messages to a file
−−error−file[=file]
Read options from file
−f file
Always inline function calls
−−inline
Keep output file after errors
−k
Specify target name for −Em/−−dep−file output
−−make−target=name
Generate intermediate MIL file
−−mil
Generate intermediate MIL file, also split output into .ms files
−−mil−split
Send output to standard output
−n
Skip the standard include files directory
−−no−stdinc
Specify name of output file
−o file
Rename default section name
−R[name]={suffix | −f | −m | −fm}
Treat external definitions as "static"
−−static
Remove preprocessor macro
−Umacro
Display version header only
−V
Table 2−2: Additional C Compiler options
For a complete overview of all options with extensive description, see section 4.1, C Compiler Options, of Chapter Tool
Options of the reference manual.
2.4
How the Compiler Searches Include Files
When you use include files (with the #include statement), you can specify their location in several ways. The compiler
searches the specified locations in the following order:
1. If the #include statement contains an absolute pathname, the compiler looks for this file. If no path or a relative path is
specified, the compiler looks in the same directory as the source file. This is only possible for include files that are enclosed
in "".
This first step is not done for include files enclosed in <>.
2. When the compiler did not find the include file, it looks in the directories that are specified in the Build Options tab of the
Project Options dialog (equivalent to the −I command line option).
3. When the compiler did not find the include file (because it is not in the specified include directory or because no directory is
specified), it looks in the path(s) specified in the environment variable CtargetINC (for example, C3000INC for the
TSK3000).
4. When the compiler still did not find the include file, it finally tries the default include directory relative to the installation
directory.
Example
Suppose that the C source file test.c contains the following lines:
#include <stdio.h>
#include "myinc.h"
2−5
Using the TSK3000 Embedded Tools
You can call the compiler as follows:
ctarget −Imyinclude test.c
First the compiler looks for the file stdio.h in the directory myinclude relative to the current directory. If it was not found, the
compiler searches in the environment variable and then in the default include directory.
The compiler now looks for the file myinc.h, in the directory where test.c is located. If the file is not there the compiler
searches in the directory myinclude. If it was still not found, the compiler searches in the environment variable and then in the
default include directory.
2.5
Compiling for Debugging
Compiling your files is the first step to get your application ready to run on a target. However, during development of your
application you first may want to debug your application.
To create an object file that can be used for debugging, you must instruct the compiler to include symbolic debug information in
the source file.
To include symbolic debug information
1. From the Project menu, select Project Options...
The Project Options dialog box appears.
2. Expand the C Compiler entry and select Debug Information.
3. Enable the option Generate symbolic debug information.
Debug and optimizations
Due to different compiler optimizations, it might be possible that certain debug information is optimized away. Therefore, if you
encounter strange behavior during debugging it might be necessary to reduce the optimization level, so that the source code is
still suitable for debugging. For more information about optimization see section 2.6, Compiler Optimizations.
Invocation syntax on the command line (Windows Command Prompt)
The invocation syntax on the command line is:
ctarget −g −O1 file...
2.6
Compiler Optimizations
The compiler has a number of optimizations which you can enable or disable.
1. From the Project menu, select Project Options...
The Project Options dialog appears.
2. Expand the C Compiler entry and select Optimization.
3. Select an optimization level in the Optimization level box.
Or:
In the Optimization level box select Custom optimization and enable the optimizations you want in the Custom
optimization box.
• Level 0 − No optimization: No optimizations are performed. The compiler tries to achieve a 1−to−1 resemblance between
source code and produced code. Expressions are evaluated in the order written in the source code, associative and
commutative properties are not used.
• Level 1 − Few optimizations: Enables optimizations that do not affect the debug−ability of the source code. Use this level
when you encounter problems during debugging your source code with optimization level 2.
• Level 2 − Medium optimization (default): Enables more optimizations to reduce the memory footprint and/or execution
time. This is the default optimization level.
2−6
Using the C Compiler
• Level 3 − Full optimization: This is the highest optimization level. Use this level when your program does not fit in the
memory provided by your system anymore, or when your program/hardware has become too slow to meet your real−time
requirements.
• Custom optimization: you can enable/disable specific optimizations.
Optimization pragmas
If you specify a certain optimization, all code in the module is subject to that optimization. Within the C source file you can
overrule the compiler options for optimizations with #pragma optimize flag and #pragma endoptimize. Nesting is
allowed:
#pragma optimize e
...
... C source ...
...
#pragma optimize c
...
... C source ...
...
#pragma endoptimize
...
#pragma endoptimize
...
/* Enable expression
simplification
*/
/* Enable common expression
elimination. Expression
simplification still enabled */
/* Disable common expression
elimination
/* Disable expression
simplification
*/
*/
The compiler optimizes the code between the pragma pair as specified.
You can enable or disable the optimizations described below. The command line option for each optimization is given in
brackets.
See also C compiler option −−optimize (−O) in section 4.1, C Compiler Options, of Chapter Tool Options of the reference
manual.
2.6.1
Generic optimizations (frontend)
Common subexpression elimination (CSE)
(option −Oc/−OC)
The compiler detects repeated use of the same (sub−)expression. Such a "common" expression is replaced by a variable that is
initialized with the value of the expression to avoid recomputation. This method is called common subexpression elimination
(CSE).
Expression simplification
(option −Oe/−OE)
Multiplication by 0 or 1 and additions or subtractions of 0 are removed. Such useless expressions may be introduced by macros
or by the compiler itself (for example, array subscription).
Constant propagation
(option −Op/−OP)
A variable with a known value is replaced by that value.
Function Inlining
(option −Oi/−OI)
Small fuctions that are not too often called, are inlined. This reduces execution time at the cost of code size.
Code compaction (reverse inlining)
(option −Or/−OR)
Compaction is the opposite of inlining functions: large chunks of code that occur more than once, are transformed into a
function. This reduces code size at the cost of execution speed.
Control flow simplification
(option −Of/−OF)
A number of techniques to simplify the flow of the program by removing unnecessary code and reducing the number of jumps.
For example:
2−7
Using the TSK3000 Embedded Tools
Switch optimization:
A number of optimizations of a switch statement are performed, such as removing redundant case labels or even removing
an entire the switch.
Jump chaining:
A (conditional) jump to a label which is immediately followed by an unconditional jump may be replaced by a jump to the
destination label of the second jump. This optimization speeds up execution.
Conditional jump reversal:
A conditional jump over an unconditional jump is transformed into one conditional jump with the jump condition reversed.
This reduces both the code size and the execution time.
Dead code elimination:
Code that is never reached, is removed. The compiler generates a warning messages because this may indicate a coding
error.
Subscript strength reduction
(option −Os/−OS)
An array of pointers subscripted with a loop iterator variable (or a simple linear function of the iterator variable), is replaced by
the dereference of a pointer that is updated whenever the iterator is updated.
Loop transformations
(option −Ol/−OL)
Temporarily transform a loop with the entry point at the bottom, to a loop with the entry point at the top. This enables constant
propagation in the initial loop test and code motion of loop invariant code by the CSE optimization.
Forward store
(option −Oo/−OO)
A temporary variable is used to cache multiple assignments (stores) to the same non−automatic variable.
2.6.2
Core specific optimizations (backend)
Coalescer
(option −Oa/−OA)
The coalescer seeks for possibilities to reduce the number of moves (MOV instruction) by smart use of registers. This optimizes
both speed as code size.
Interprocedural register optimization
(option −Ob/−OB)
Register allocation is improved by taking note of register usage in functions called by a given function.
Peephole optimizations
(option −Oy/−OY)
The generated assembly code is improved by replacing instruction sequences by equivalent but faster and/or shorter
sequences, or by deleting unnecessary instructions.
Instruction Scheduler
(option −Ok/−OK)
Instructions are rearranged to avoid structural hazards, for example by inserting another non−related instruction.
Loop unrolling
(option −Ou/−OU)
To reduce the number of branches, short loops are eliminated by replacing them with a number of copies.
Generic assembly optimizations
(option −Og/−OG)
A set of target independent optimizations that increase speed and decrease code size.
2.6.3
Optimize for Size or Speed
You can tell the compiler to focus on execution speed or code size during optimizations. You can do this by specifying a
size/speed trade−off level from 0 (speed) to 4 (size). This trade−off does not turn optimization phases on or off. Instead, its level
is a weight factor that is used in the different optimization phases to influence the heuristics. The higher the level, the more the
compiler focusses on code size optimization.
2−8
Using the C Compiler
To specify the size/speed trade−off optimization level:
1. From the Project menu, select Project Options...
The Project Options dialog appears.
2. Expand the C Compiler entry and select Optimization.
3. Enable one of the options Optimize for size or Optimize for speed.
See also C compiler option −−tradeoff (−t) in section 4.1, C Compiler Options, of Chapter Tool Options of the reference
manual.
2.7
C Code Checking: MISRA−C
The C programming language is a standard for high level language programming in embedded systems, yet it is considered
somewhat unsuitable for programming safety−related applications. Through enhanced code checking and strict enforcement of
best practice programming rules, TASKING MISRA−C code checking helps you to produce more robust code.
MISRA−C specifies a subset of the C programming language which is intended to be suitable for embedded automotive
systems. It consists of a set of rules, defined in MISRA−C:2004, Guidelines for the Use of the C Language in Critical Systems
(Motor Industry Research Association (MIRA), 2004).
The compiler also supports MISRA−C:1998, the first version of MISRA−C. You can select this version with the following C
compiler option:
−−misrac−version=1998
For a complete overview of all MISRA−C rules, see Chapter 8, MISRA−C Rules, in the reference manual.
Implementation issues
The MISRA−C implementation in the compiler supports nearly all rules. Only a few rules are not supported because they
address documentation, run−time behavior, or other issues that cannot be checked by static source code inspection, or because
they require an application−wide overview.
During compilation of the code, violations of the enabled MISRA−C rules are indicated with error messages and the build
process is halted.
MISRA−C rules are divided in required rules and advisory rules. If rules are violated, errors are generated causing the compiler
to stop. With the following options warnings, instead of errors, are generated for either or both the required rules and the
advisory rules:
−−misrac−required−warnings
−−misrac−advisory−warnings
Note that not all MISRA−C violations will be reported when other errors are detected in the input source. For instance,
when there is a syntax error, all semantic checks will be skipped, including some of the MISRA−C checks. Also note that
some checks cannot be performed when the optimizations are switched off.
Quality Assurance report
To ensure compliance to the MISRA−C rules throughout the entire project, the TASKING linker can generate a MISRA−C Quality
Assurance report. This report lists the various modules in the project with the respective MISRA−C settings at the time of
compilation. You can use this in your company’s quality assurance system to provide proof that company rules for best practice
programming have been applied in the particular project.
To apply MISRA−C code checking to your application
1. From the Project menu, select Project Options...
The Project Options dialog box appears.
2. Expand the C Compiler entry and select MISRA−C.
2−9
Using the TSK3000 Embedded Tools
3. Select a MISRA−C configuration. Select a predefined configuration for conformance with the required rules in the MISRA−C
guidelines.
It is also possible to have a project team work with a MISRA−C configuration common to the whole project. In this case the
MISRA−C configuration can be read from an external settings file.
4. (Optional) In the MISRA−C Rules entry, specify the individual rules.
On the command line you can use the −−misrac option.
ctarget −−misrac={all | number [−number],...]
See C compiler option −−misrac in section 4.1, C Compiler Options in Chapter Tool Options of the reference manual.
See linker option −−misra−c−report in section 4.3, Linker Options in Chapter Tool Options of the reference manual.
2.8
C Compiler Error Messages
The C compiler reports the following types of error messages.
F ( Fatal errors)
After a fatal error the compiler immediately aborts compilation.
E (Errors)
Errors are reported, but the compiler continues compilation. No output files are produced unless you have set the C compiler
option −−keep−output−files (the resulting output file may be incomplete).
W (Warnings)
Warning messages do not result into an erroneous assembly output file. They are meant to draw your attention to assumptions
of the compiler for a situation which may not be correct. You can control warnings in the C Compiler » Diagnostics page of the
Project » Project Options... menu (C compiler option −−no−warnings (−w)).
I (Information)
Information messages are always preceded by an error message. Information messages give extra information about the error.
S (System errors)
System errors occur when internal consistency checks fail and should never occur. When you still receive the system error
message
S9##: internal consistency check failed − please report
please report the error number and as many details as possible about the context in which the error occurred.
Display detailed information on diagnostics
1. From the View menu, select Workspace Panels » System » Messages.
The Messages panel appears.
2. In the Messages panel, right−click on the message you want more information on.
A popup menu appears.
3. Select More Info.
A Message Info box appears with additional information.
On the command line you can use the compiler option −−diag to see an explanation of a diagnostic message:
ctarget −−diag=[format:]{all | number,...]
See C compiler option −−diag in section 4.1, C Compiler Options in Chapter Tool Options of the reference manual.
2−10
3 Profiling
Summary
3.1
Profiling is the process of collecting statistical data about a running application. With
these data you can analyze which functions are called, how often they are called and
what their execution time is. This chapter describes the TASKING profiling method
with code instrumentation techniques.
What is profiling?
Profiling is a collection of methods to gather data about your application which helps you to identify code fragments where
execution consumes the greatest amount of time.
TASKING supplies a number of profiler tools each dedicated to solve a particular type of performance tuning problem.
Performance problems can be solved by:
• Identifying time−consuming algorithms and rewrite the code using a more time−efficient algorithm.
• Identifying time−consuming functions and select the appropriate compiler optimizations for these functions (for example,
enable loop unrolling or function inlining).
• Identifying time consuming loops and add the appropriate pragmas to enable the compiler to further optimize these loops.
A profiler helps you to find and identify the time consuming constructs and provides you this way with valuable information to
optimize your application.
TASKING employs various schemes for collecting profiling data, depending on the capabilities of the target system and different
information needs.
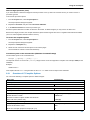
3.1.1
Three methods of profiling
There are several methods of profiling: recording by an instruction set simulator, profiling using the debugger and profiling with
code instrumentation techniques. Each method has its advantages and disadvantages.
Profiling by an instruction set simulator
On way way to gather profiling information is built into the instruction set simulator (ISS). The ISS records the time consumed by
each instruction that is executed. The debugger then retrieves this information and correlates the time spent for individual
instructions to C source statements.
Advantages
−
it gives (cycle) accurate information with extreme fine granularity
−
the executed code is identical to the non−profiled code
Disadvantages
−
the method requires an ISS as execution environment
Profiling with the debugger
The second method of profiling is built into the debugger. You specify which functions you want to profile. The debugger places
breakpoints on the function entry and all its exit addresses and measures the time spent in the function and its callees.
Advantages
−
the executed code is identical to the non−profiled code
Disadvantage
−
each time a profiling breakpoint is hit the target is stopped and control is passed to the debugger. Although the debugger
restarts the application immediately, the applications performance is significantly reduced.
3−1
Using the TSK3000 Embedded Tools
Profiling using code instrumentation techniques
The TASKING compiler contains an option to add code to your application which takes care of the profiling process. This is
called code instrumentation. The gathered profiling data is first stored in the target’s memory and will be written to a file when
the application finishes execution or when the function __prof_cleanup() is called.
Advantages
−
it can give a complete call graph of the application annotated with the time spend in each function and basic block
−
this profiling method is execution environment independent
−
the application is profiled while it executes on its aimed target taking real−life input
Disadvantage
−
instrumentation code creates a significant run−time overhead, and instrumentation code and gathered data take up target
memory
This method provides a valuable complement to the other two methods and will be described into more detail below.
3.2
Profiling using Code Instrumentation
Profiling can be used to determine which parts of a program take most of the execution time.
Once the collected data are presented, it may reveal which pieces of your code execute slower than expected and which
functions contribute most to the overall execution time of a program. It gives you also information about which functions are
called more or less often than expected. This information not only may lead to design flaws or bugs that had otherwise been
unnoticed, it also reveals parts of the program which can be effectively optimized.
Important considerations
The code instrumentation method adds code to your original application which is needed to gather the profiling data. Therefore,
the code size of your application increases. Furthermore, during the profiling process, the gathered data is initially stored into
dynamically allocated memory of the target. The heap of your application should be large enough to store this data. Since code
instrumentation is done by the compiler, assembly functions used in your program do not show up in the profile.
The profiling information is collected during the actual execution of the program. Therefore, the input of the program influences
the results. If a part/function of the program is not activated while the program is profiled, no profile data is generated for that
part/function.
It is not possible to profile applications that are compiled with the optimization Code compaction (−Or) option.
Overview of steps to perform
To obtain a profile using code instrumentation, perform the following steps:
1. Compile and link your program with profiling enabled
2. Execute the program to generate the profile data
3. Display the profile
3.2.1
Step 1: Build your Application for Profiling
The first step is to add the code that takes care of the profiling, to your application. This is done with compiler options:
1. From the Project menu, select Project Options...
The Project Options dialog box appears.
2. Expand the C Compiler entry and select Debug Information.
3. Enable the option Generate profiling information.
4. Enable one or more of the following suboptions to select which profiles should be obtained.
• Block counters (not in combination with with Call graph or Function timers)
• Call graph
• Function counters
3−2
Profiling
• Function timers
Note that the more detailed information you request, the larger the overhead in terms of execution time, code size and
heap space needed. The option Generate Debug information (−g or −−debug) does not affect profiling, execution time
or code size.
Block counters (not in combination with Call graph or Time)
This will instrument the code to perform basic block counting. As the program runs, it will count how many time it executed
each branch of each if statement, each iteration of a for loop, and so on. Note that though you can combine Block
counters with Function counters, this has no effect because Function counters is only a subset of Block counters.
Call graph (not in combination with Block counters)
This will instrument the code to reconstruct the run−time call graph. As the program runs it associates the caller with the
gathered profiling data.
Function counters
This will instrument the code to perform function call counting. This is a subset of the basic Block counters.
Time (not in combination with Block counters)
This will instrument the code to measure the time spent in a function. This includes the time spend in all called functions
(callees).
For the command line, see the C compiler option −−profile (−p) in section 4.1, C Compiler Options in Chapter Tool
Options of the reference manual.
Rebuild your application:
5. From the Project menu select Recompile Embedded Project name.
3.2.1.1
Profiling Modules and Libraries
Profiling individual modules
It is possible to profile individual C modules. In this case only limited profiling data is gathered for the functions in the modules
compiled without the profiling option. When you use the suboption Call graph, the profiling data reveals which profiled functions
are called by non−profiled functions. The profiling data does not show how often and from where the non−profiled functions
themselves are called. Though this does not affect the flat profile, it might reduce the usefulness of the call graph.
Profiling library functions
Altium Designer and/or the control program will link your program with the standard version of the C library c3000.lib.
Functions from this library which are used in your application, will not be profiled. If you do want to incorporate the library
functions in the profile, you must set the appropriate compiler options in the C library makefiles and rebuild the library.
3.2.1.2
Linking Profiling Libraries
When building your application, the application must be linked against the corresponding profile library. Altium Designer (or the
control program) automatically select the correct library based on the profiling options you specified. However, if you compile,
assemble and link your application manually, make sure you specify the correct library.
See section 5.4, Linking with Libraries, in Chapter Using the Linker for an overview of the (profiling) libraries.
3−3
Using the TSK3000 Embedded Tools
3.2.2
Step 2: Execute the Application
Once you have compiled and linked the application for profiling, it must be executed to generate the profiling data. Run the
program as usual: the program should run normally taking the same input as usual and producing the same output as usual.
The application will run somewhat slower that normal because of the extra time spent on collecting the profiling data.
Startup code
The startup code initializes the profiling functions by calling the function __prof_init(). Altium Designer will automatically
make the required modifications to the startup code. Or, when you use the control program, this extracts the correct startup code
from the C library.
If you use your own startup code, you must manually insert a call to the function __prof_init just before the call to _main
and its stack setup.
An application can have multiple entry points, such as main() and other functions that are called by interrupt. This does not
affect the profiling process.
Small heap problem
When the program does not run as usual, this is typically caused by a shortage of heap space. In this case the following
message is issued (when running with file system simulation, it is displayed on the Debug console):
To solve this problem, increase the size of the heap:
1. From the Project menu, select Project Options...
The Project Options dialog box appears.
2. Expand the Linker entry and select Stack/Heap
3. Enter a new value in the Heap size (bytes) field enter a new value and/or enable the option
Expand heap size if space left.
Presumable incorrect call graph
The call graph is based on the compiled source code. Due to compiler optimizations the call graph may therefore seem incorrect
at first sight. For example, the compiler can replace a function call immediately followed by a return instruction by a jump to the
callee, thereby merging the callee function with the caller function. In this case the time spent in the callee function is not
recorded separately anymore, but added to the time spent in the caller function (which, as said before, now holds the callee
function). This represents exactly the structure of your source in assembly but may differ from the structure in the initial C
source.
After execution
When the program has finished (returning from main()), the exit code calls the function __prof_cleanup(void). This
function writes the gathered profiling data to a file on the host system using the debugger’s file system simulation features. If
your program does not return from main(), you can force this by inserting a call to the function __prof_cleanup() in your
application source code. Please note the double underscores when calling from C code!
The resulting profiling data file is named amon.prf. This file is written to the current working directory.
If your program does not run under control of the debugger and therefore cannot use the file simulation system (FSS)
functionality to write a file to the host system, you must implement a way to pass the profiling data gathered on the target
to the host. Adapt the function _prof_cleanup() in the profiling libraries or the underlying I/O functions for this
purpose.
3−4
Profiling
3.2.3
Step 3: Displaying Profiling Results
The result of the profiler can be displayed in Altium Designer. First you must stop the stop the entire simulation. Altium Designer
then converts the profiling data in the file amon.prf to an XML file. This file is read and its information is displayed.
1. From the Debug menu, select Stop Debugging (Ctrl + F3).
The Profiler window opens automatically.
The Profiler window
The Profiler window contains the following tabs:
All Functions
Shows the profiling information of all functions in all C source modules belonging to your application.
Files
Shows the profiling data of the individual C source modules that make up your application. Only the functions
of the file you select in this tab are shown on the Functions tab. If you double click on a module, the functions
tab is shown with the functions of the selected module.
Functions
Shows the profiling data of the functions in the C source module you selected in the Files tab.
Each tab shows various panes with tables of information. Remember that it depends on the profiling options you have set before
compiling, which information is available.
Results pane
Shows the timing and call information for all functions and/or blocks in the profile. You can sort the list by
clicking on its column headers. To focus a function, click on a row.
Callers pane
Shows the functions that called the focus function.
Callees pane
Shows the functions that are called by the focus function.
• Double clicking on a function in any of the panes, makes the function the focussed function.
• To sort the rows in the table, click on one of the column headers.
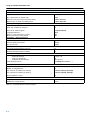
The profiling information
Based on the profiling options you have set before compiling your application, some profiling data may be present and some
may be not. The columns in the tables represent the following information:
Function
The function for which profiling data is gathered and
(if present) the code blocks in each function.
Module
The C source module in which the function resides.
% Time
The relative amount of time spent in this function. These should add up to 100%.
Hit Count
Number of times the function has been executed.
Time (s)
Amount of time in seconds that was totally spent executing this function.
Viewing previously recorded profiling results
Each time you run your application, new profiling information is gathered, stored in the file amon.prf and finally converted to an
XML files. The XML files of each run are stored in you project folder. At any time, you can reload these profiling results in the
profiler. First, open the Profiler if it is not open anymore:
1. From the Debug menu select Show Profiler.
The Profiler window opens and a workspace panel Profiling Target becomes active. The lower part of the workspace panel
shows a list of all profiling results in your directory.
2. To open a previously recorded profiling results, double click on one of the listed XML files.
3−5
Using the TSK3000 Embedded Tools
Filtering information
Especially with large application, the amount of profiling information may be overwhelming. The workspace panel Profiling
Target shows a hierarchic tree of your application. Expand and collapse the three branches and enable the check boxes of
those parts you want to view.
To view only the profiling information of a single C source module, double click on a C source module in the Files tab.
3−6
4 Using the Assembler
This chapter describes the assembly process and explains how to call the
assembler.
Summary
4.1
Introduction
The assembler converts hand−written or compiler−generated assembly language programs into machine language, resulting in
object files in the ELF/DWARF object format.
The assembler takes the following files for input and output:
assembly file .asm
(hand coded)
assembly file
.src
list file .lst
assembler
error messages .ers
relocatable object file
.obj
Figure 4−1: Assembler
The following information is described:
• The assembly process.
• How to call the assembler and how to use its options. An extensive list of all options and their descriptions is included in the
reference manual.
• The various assembler optimizations.
• How to generate a list file
• Types of assmbler messages
4.2
Assembly Process
The assembler generates relocatable output files with the extension .obj. These files serve as input for the linker.
Phases of the assembly process
1. Parsing of the source file: preprocessing of assembler directives and checking of the syntax of instructions
2. Optimization (instruction size and generic instructions)
3. Generation of the relocatable object file and optionally a list file
The assembler integrates file inclusion and macro facilities. See section 3.9, Macro Operations, in Chapter Assembly Language
for more information.
4−1
Using the TSK3000 Embedded Tools
4.3
Calling the Assembler
Altium Designer uses a makefile to build your entire project. You can set options specific for the assembler. After you have built
your project, the output files of the assembly step are available in your project directory, unless you specified an alternative
output directory in the Build Options page of the Project Options dialog.
To assemble your program
Click either one of the following buttons:
(Compile Active Document)
Assembles the currently selected assembly file (.asm or .src). This results in a relocatable object file (.obj).
(Compile Active Project)
Builds your entire project but only updates files that are out−of−date or have been changed since the last build, which
saves time.
Or select Recompile Embedded Project from the Projects menu.
Builds your entire project unconditionally. All steps necessary to obtain the final .abs file are performed.
Select the right toolset
First make sure you have selected the correct toolset for your target.
1. From the Project menu, select Project Options...
The Project Options dialog box appears.
2. Select the correct Device.
Select a target processor (core)
If you have selected a toolset that supports several processor cores, by means of a Generic device, you need to choose a
processor type first.
To access the processor options:
1. From the Project menu, select Project Options...
The Project Options dialog box appears.
2. Expand the Processor entry and select Processor Definition.
3. In the Select Processor box select a processor type.
Processor options affect the invocation of all tools in the toolset. In Altium Designer you only need to set them once.
To access the assembler options
1. From the Project menu, select Project Options...
The Project Options dialog box appears.
2. Expand the Assembler entry.
3. Select the sub−entries and set the options in the various pages.
The command line variant is shown simultaneously.
Invocation syntax on the command line (Windows Command Prompt)
The invocation syntax on the command line is:
astarget [ [option]... [file]... ]...
The input file must be an assembly source file (.asm or .src). astarget can be one of the supported assemblers. For example,
as3000 (for the TSK3000).
4−2
Using the Assembler
Example:
as3000 test.asm
This assembles the file test.asm and generates the file test.obj which serves as input for the linker.
4.3.1
Overview of Assembler Options
You can set the following assembler options in Altium Designer.
Menu entry
Command line
Build Options
Include files path
−Idir
Processor » Processor Definition
Multiply/Divide unit present
−−use−hardware=flags,...
Assembler » Preprocessing
User macro
−Dmacro[=value]
Include this file before source
−Hfile
Assembler » Optimization
Generic instructions
−Og
Jump chains
−Oj
Instruction size
−Os
Assembler » Debug Information
Symbolic Debug Generation
Automatic HLL or assembly level debug information
Custom debug information
No debug information
−gs
−gAHLS
Custom debug information
Assembler source line information
Pass HLL debug information
−gflags
−ga
−gh
Assembler local symbols information
−gl
Assembler » List File
Generate list file
−l
Display section information
−tl
List file format
−Lflags
Assembler » Diagnostics
Warnings
Report all warnings
Suppress all warnings
Suppress specific warnings
no option −w
−w
−wnum[,num]...
Treat warnings as errors
−−warnings−as−errors[=n,...]
Assembler » Miscellaneous
Assemble case sensitive (required for C language)
−c (case insensitive)
Labels are by default:
local (default)
global
−il
−ig
Insert a NOP after all jumps and branches
−−nop−insertion
Automatically generate GP−relative offsets
−−gp−relative
Additional assembler options
options
Table 4−1: Altium Designer assembler options
4−3
Using the TSK3000 Embedded Tools
The following assembler options are only available on the command line:
Description
Command line
Display invocation syntax
−−help[=item,...]
Check source (check syntax without generating code)
−−check
Show description of diagnostic(s)
−−diag=[fmt:]{all|nr,...}
Preprocess only
−E
Emit local symbols
−−emit−locals
Redirect diagnostic messages to a file
−−error−file[=file]
Set the maximum number of emitted errors
−−error−limit=number
Read options from file
−f file
Keep output file after errors
−k
Select TASKING preprocessor or no preprocessor
−m{t|n}
Allow nested sections
−N
Specify name of output file
−o file
Verbose information
−v
Display version header only
−V
Table 4−2: Additional assembler options
For a complete overview of all options with extensive descriptions, see section 4.2, Assembler Options, of Chapter Tool
Options of the reference manual.
4.4
How the Assembler Searches Include Files
When you use include files (with the .INCLUDE directive), you can specify their location in several ways. The assembler
searches the specified locations in the following order:
1. If the .INCLUDE directive contains a path name, the assembler looks for this file. If no path is specified, the assembler looks
in the same directory as the source file.
2. When the assembler did not find the include file, it looks in the directories that are specified in the Build Options page of the
Project Options dialog (equivalent to the −I command line option).
3. When the assembler did not find the include file (because it is not in the specified include directory or because no directory is
specified), it looks in the path(s) specified in the environment variable AStargetINC (for example, AS3000INC for the
TSK3000).
4. When the assembler still did not find the include file, it finally tries the default include directory relative to the installation
directory.
Example
Suppose that the assembly source file test.asm contains the following lines:
.INCLUDE ’myinc.inc’
You can call the assembler as follows:
astarget −Imyinclude test.asm
First the assembler looks for the file myinc.inc in the directory where test.asm is located. If the file is not there the
assembler searches in the directory myinclude. If it was still not found, the assembler searches in the environment variable
and then in the default include directory.
4−4
Using the Assembler
4.5
Assembler Optimizations
The assembler performs various optimizations to reduce the size of assembled applications. There are two options available to
influence the degree of optimization.
To enable or disable optimizations
1. From the Project menu, select Project Options...
The Project Options dialog box appears.
2. Expand the Assembler entry and select Optimization.
You can enable or disable the optimizations described below. The command line option for each optimization is given in
brackets.
See also option −−optimize (−O) in section 4.2, Assembler Options, in Chapter Tool Options of the reference manual.
Allow generic instructions
(option −Og/−OG)
When this option is enabled, you can use generic instructions in your assembly source. The assembler tries to replace
instructions by faster or smaller instructions.
By default this option is enabled. If you turn off this optimization, generic instructions are not allowed. In that case you have to
use hardware instructions.
Optimize jump chains
(option −Oj/−OJ)
When this option is enabled, the assembler replaces chained jumps by a single jump instruction. For example, a jump from a to
b immediately followed by a jump from b to c, is replaced by a jump from a to c. By default this option is disabled.
Optimize instruction size
(option −Os/−OS)
When this option is enabled, the assembler tries to find the shortest possible operand encoding for instructions. By default this
option is enabled.
4.6
Generating a List File
The list file is an additional output file that contains information about the generated code. You can customize the amount and
form of information.
If the assembler generates errors or warnings, these are reported in the list file just below the source line that caused the error
or warning.
To generate a list file
1. From the Project menu, select Project Options...
The Project Options dialog box appears.
2. Expand the Assembler entry and select List File.
3. Select Generate list file.
4. (Optional) Enable the options to include that information in the list file.
Example on the command line (Windows Command Prompt)
The following command generates the list file test.lst:
astarget −l test.asm
4−5
Using the TSK3000 Embedded Tools
4.7
Assembler Error Messages
The assembler produces error messages of the following types.
F ( Fatal errors)
After a fatal error the assembler immediately aborts the assembly process.
E (Errors)
Errors are reported, but the assembler continues assembling. No output files are produced unless you have set the assembler
option −−keep−output−files (the resulting output file may be incomplete).
W (Warnings)
Warning messages do not result into an erroneous assembly output file. They are meant to draw your attention to assumptions
of the assembler for a situation which may not be correct. You can control warnings in the Assembler » Diagnostics page of
the Project » Project Options... menu (assembler option −−no−warnings).
Display detailed information on diagnostics
1. From the View menu, select Workspace Panels » System » Messages.
The Messages panel appears.
2. In the Messages panel, right−click on the message you want more information on.
A popup menu appears.
3. Select More Info.
A Message Info box appears with additional information.
On the command line you can use the assembler option −−diag to see an explanation of a diagnostic message:
astarget −−diag=[format:]{all | number,...]
See assembler option −−diag in section 4.2, Assembler Options in Chapter Tool Options of the reference manual.
4−6
5 Using the Linker
This chapter describes the linking process, how to call the linker and how to control
the linker with a script file.
Summary
5.1
Introduction
The TASKING linker is a combined linker/locator. The linker phase combines relocatable object files (.obj files, generated by
the assembler), and libraries into a single relocatable linker object file (.out). The locator phase assigns absolute addresses to
the linker object file and creates an absolute object file which you can load into a target processor. From this point the term linker
is used for the combined linker/locator.
The linker can simultaneously link and locate all programs for all cores available on a target board. The target board may be of
arbitrary complexity. A simple target board may contain one standard processor with some external memory that executes one
task. A complex target board may contain multiple standard processors and DSPs combined with configurable IP−cores loaded
in an FPGA. Each core may execute a different program, and external memory may be shared by multiple cores.
The linker takes the following files for input and output:
relocatable object files .obj
relocatable linker object file .out
relocatable object library.lib
linker map file .map
linker script file .lsl
linker
relocatable linker object file .out
Intel Hex
absolute object file
.hex
ELF/DWARF 2
absolute object file
.abs
error messages .elk
memory definition
file .mdf
Motorola S−record
absolute object file
.sre
Figure 5−1: Linker
This chapter first describes the linking process. Then it describes how to call the linker and how to use its options. An extensive
list of all options and their descriptions is included in section 4.3, Linker Options, of the reference manual.
To control the link process, you can write a script for the linker. This chapter shortly describes the purpose and basic principles
of the Linker Script Language (LSL) on the basis of an example. A complete description of the LSL is included in Chapter 7,
Linker Script Language, of the reference manual.
5.2
Linking Process
The linker combines and transforms relocatable object files (.obj) into a single absolute object file. This process consists of two
phases: the linking phase and the locating phase.
In the first phase the linker combines the supplied relocatable object files and libraries into a single relocatable object file. In the
second phase, the linker assigns absolute addresses to the object file so it can actually be loaded into a target.
5−1
Using the TSK3000 Embedded Tools
Glossary of terms
Term
Definition
Absolute object file
Object code in which addresses have fixed absolute values, ready to load into a target.
Address
A specification of a location in an address space.
Address space
The set of possible addresses. A core can support multiple spaces, for example in a Harvard
architecture the addresses that identify the location of an instruction refer to code space, whereas
addresses that identify the location of a data object refer to a data space.
Architecture
A description of the characteristics of a core that are of interest for the linker. This encompasses the
address space(s) and the internal bus structure. Given this information the linker can convert logical
addresses into physical addresses.
Copy table
A section created by the linker. This section contains data that specifies how the startup code
initializes the data sections. For each section the copy table contains the following fields:
− action: defines whether a section is copied or zeroed
− destination: defines the section’s address in RAM
− source: defines the sections address in ROM
− length: defines the size of the section in MAUs of the destination space
Core
An instance of an architecture.
Derivative
The design of a processor. A description of one or more cores including internal memory and any
number of buses.
Library
Collection of relocatable object files. Usually each object file in a library contains one symbol definition
(for example, a function).
Logical address
An address as encoded in an instruction word, an address generated by a core (CPU).
LSL file
The set of linker script files that are passed to the linker.
MAU
Minimum Addressable Unit. For a given processor the number of bits between an address and the
next address. This is not necessarily a byte or a word.
Object code
The binary machine language representation of the C source.
Physical address
An address generated by the memory system.
Processor
An instance of a derivative. Usually implemented as a (custom) chip, but can also be implemented in
an FPGA, in which case the derivative can be designed by the developer.
Relocatable object
file
Object code in which addresses are represented by symbols and thus relocatable.
Relocation
The process of assigning absolute addresses.
Relocation
information
Information about how the linker must modify the machine code instructions when it relocates
addresses.
Section
A group of instructions and/or data objects that occupy a contiguous range of addresses.
Section attributes
Attributes that define how the section should be linked or located.
Target
The hardware board on which an application is executing. A board contains at least one processor.
However, a complex target may contain multiple processors and external memory and may be shared
between processors.
Unresolved
reference
A reference to a symbol for which the linker did not find a definition yet.
Table 5−1: Glossary of terms
5.2.1
Phase 1: Linking
The linker takes one or more relocatable object files and/or libraries as input. A relocatable object file, as generated by the
assembler, contains the following information:
• Header information: Overall information about the file, such as the code size, name of the source file it was assembled from,
and creation date.
• Object code: Binary code and data, divided into various named sections. Sections are contiguous chunks of code that have
to be placed in specific parts of the memory. The program addresses start at zero for each section in the object file.
• Symbols: Some symbols are exported − defined within the file for use in other files. Other symbols are imported − used in the
file but not defined (external symbols). Generally these symbols are names of routines or names of data objects.
5−2
Using the Linker
• Relocation information: A list of places with symbolic references that the linker has to replace with actual addresses. When in
the code an external symbol (a symbol defined in another file or in a library) is referenced, the assembler does not know the
symbol’s size and address. Instead, the assembler generates a call to a preliminary relocatable address (usually 0000),
while stating the symbol name.
• Debug information: Other information about the object code that is used by a debugger. The assembler optionally generates
this information and can consist of line numbers, C source code, local symbols and descriptions of data structures.
The linker resolves the external references between the supplied relocatable object files and/or libraries and combines the files
into a single relocatable linker object file.
The linker starts its task by scanning all specified relocatable object files and libraries. If the linker encounters an unresolved
symbol, it remembers its name and continues scanning. The symbol may be defined elsewhere in the same file, or in one of the
other files or libraries that you specified to the linker. If the symbol is defined in a library, the linker extracts the object file with the
symbol definition from the library. This way the linker collects all definitions and references of all of the symbols.
Next, the linker combines sections with the same section name and attributes into single sections. The linker also substitutes
(external) symbol references by (relocatable) numerical addresses where possible. At the end of the linking phase, the linker
either writes the results to a file (a single relocatable object file) or keeps the results in memory for further processing during the
locating phase.
The resulting file of the linking phase is a single relocatable object file (.out). If this file contains unresolved references, you can
link this file with other relocatable object files (.obj) or libraries (.lib) to resolve the remaining unresolved references.
With the linker command line option −−link−only, you can tell the linker to only perform this linking phase and skip the locating
phase. The linker complains if any unresolved references are left.
5.2.2
Phase 2: Locating
In the locating phase, the linker assigns absolute addresses to the object code, placing each section in a specific part of the
target memory. The linker also replaces references to symbols by the actual address of those symbols. The resulting file is an
absolute object file which you can actually load into a target memory. Optionally, when the resulting file should be loaded into a
ROM device the linker creates a so−called copy table section which is used by the startup code to initialize the data sections.
Code modification
When the linker assigns absolute addresses to the object code, it needs to modify this code according to certain rules or
relocation expressions to reflect the new addresses. These relocation expressions are stored in the relocatable object file.
Consider the following snippet of x86 code that moves the contents of variable a to variable b via the eax register:
A1 3412 0000 mov a,%eax
A3 0000 0000 mov %eax,b
(a defined at 0x1234, byte reversed)
(b is imported so the instruction refers to
0x0000 since its location is unknown)
Now assume that the linker links this code so that the section in which a is located is relocated by 0x10000 bytes, and b turns
out to be at 0x9A12. The linker modifies the code to be:
A1 3412 0100 mov a,%eax
A3 129A 0000 mov %eax,b
(0x10000 added to the address)
(0x9A12 patched in for b)
These adjustments affect instructions, but keep in mind that any pointers in the data part of a relocatable object file have to be
modified as well.
Output formats
The linker can produce its output in different file formats. The default ELF/DWARF 2 format (.abs) contains an image of the
executable code and data, and can contain additional debug information. The Intel−Hex format (.hex) and Motorola S−record
format (.sre) only contain an image of the executable code and data. You can specify a format with the options −−output (−o)
and −−chip−output (−c).
Controlling the linker
Via a so−called linker script file you can gain complete control over the linker. The script language is called the Linker Script
Language (LSL). Using LSL you can define:
• The memory installed in the embedded target system:
5−3
Using the TSK3000 Embedded Tools
To assign locations to code and data sections, the linker must know what memory devices are actually installed in the
embedded target system. For each physical memory device the linker must know its start−address, its size, and whether the
memory is read−write accessible (RAM) or read−only accessible (ROM).
• How and where code and data should be placed in the physical memory:
Embedded systems can have complex memory systems. If for example on−chip and off−chip memory devices are available,
the code and data located in internal memory is typically accessed faster and with dissipating less power. To improve the
performance of an application, specific code and data sections should be located in on−chip memory. By writing your own
LSL file, you gain full control over the locating process.
• The underlying hardware architecture of the target processor.
To perform its task the linker must have a model of the underlying hardware architecture of the processor you are using. For
example the linker must know how to translate an address used within the object file (a logical address) into an offset in a
particular memory device (a physical address). In most linkers this model is hard coded in the executable and can not be
modified. For the TASKING linker this hardware model is described in the linker script file. This solution is chosen to support
configurable cores that are used in system−on−chip designs.
When you want to write your own linker script file, you can use the standard linker script files with architecture
descriptions delivered with the product.
See also section 5.9, Controlling the Linker with a Script.
5.3
Calling the Linker
In Altium Designer you can set options specific for the linker. Altium Designer creates and uses a makefile to build your entire
project. After you have build your project, the output files of the linking step are available in your project directory, unless you
specified an alternative output directory in the Build Options page of the Project Options dialog.
To link your program
Click the following button:
(Compile Active Project)
Builds your entire project but only updates files that are out−of−date or have been changed since the last build, which
saves time.
Or select Recompile Embedded Project from the Projects menu.
Builds your entire project unconditionally. All steps necessary to obtain the final .abs file are performed.
To access the linker options
1. From the Project menu, select Project Options...
The Project Options dialog box appears.
2. Expand the Linker entry.
3. Select the sub−entries and set the options in the various pages.
The command line variant is shown simultaneously.
Invocation syntax on the command line (Windows Command Prompt)
The invocation syntax on the command line is:
lk3000 [ [option]... [file]... ]...
When you are linking multiple files, either relocatable object files (.obj) or libraries (.lib), it is important to specify the files in
the right order. This is explained in Section 5.4, Linking with Libraries.
Example:
lk3000 −d3000.lsl test.obj
This links and locates the file test.obj and generates the file test.abs.
5−4
Using the Linker
5.3.1
Overview of Linker Options
You can set the following linker options in Altium Designer.
Menu entry
Command line
Build Options
Library files path
−Ldir
Linker » Output Format
Output format
Absolute file for debuggers (.abs)
Library for TASKING linker (.lib)
−o[file][:format[:addr_size]]...
Intel Hex records for EPROM programmers (.hex)
Motorola S−records for EPROM programmers (.sre)
−c[basename]:IHEX[:addr_size],...
−c[basename]:SREC[:addr_size],...
Linker » Libraries
Link default C libraries
−lx
Rescan libraries to solve unresolved externals
−−no−rescan (disables rescan)
Linker » Optimization
Optimization level
No optimization
Default optimization
Full optimization
Custom optimization
−O0
−O1
−O2
Custom optimization
−Oflags
Linker » Map File
Generate a memory map file (.map)
−M
Map file format
−mflags
Linker » Diagnostics
Error reporting
Report all warnings
Suppress all warnings
Suppress specific warnings
no option −w
−w
−wnum[,num]...
Treat warnings as errors
−−warnings−as−errors[=number,...]
Linker » Miscellaneous
Include symbolic debug information
−S (strips debug information)
Link case sensitive (required for C language)
−−case−insensitive
Dump processor and memory info from LSL file
−−lsl−dump[=file]
Use project specific LSL file
−dfile
Additional linker options
options
Table 5−2: Altium Designer Linker options
5−5
Using the TSK3000 Embedded Tools
The following linker options are only available on the command line:
Description
Command line
Display invocation syntax
−−help[=item,...]
Define preprocessor macro
−Dmacro[=def]
Show description of diagnostic(s)
−−diag=[fmt:]{all|nr,...}
Specify a symbol as unresolved external
−esymbol
Redirect diagnostic messages to a file with extension .elk
−−error−file[=file]
Read options from file
−f file
Scan libraries in given order
−−first−library−first
Add dir to LSL include file search path
−Idir
Do not use standard copy table for initialization
−i
Search only in −L directories, not in default path
−−ignore−default−library−path
Import a binary file containing raw data
−−import−object=file,...
Keep output files after errors
−k
Link only, do not locate
−−link−only
Check LSL file(s) and exit
−−lsl−check
Do not generate ROM copy
−N
Locate all ROM sections in RAM
−−non−romable
Link incrementally
−r
Display version header only
−V
Verbose / extra verbose information
−v / −vv
Table 5−3: Additional Linker options
For a complete overview of all options with extensive description, see section 4.3, Linker Options, of the reference
manual.
5−6
Using the Linker
5.4
Linking with Libraries
There are two kinds of libraries: system libraries and user libraries.
System library
System libraries are stored in the directory:
<Altium Designer installation>\System\Tasking\c3000\lib\
An overview of the system libraries is given in the following table:
Libraries
Description
c3000.lib
c3000md.lib
C library (some functions also need the floating−point library)
md = support for hardware multiply/divide
c3000s.lib
c3000mds.lib
Single precision C library
(some functions also need the floating−point library)
fp3000.lib
fp3000md.lib
Floating−point library (non trapping)
fp3000t.lib
fp3000mdt.lib
Floating−point library (trapping)
pb3000.lib
pc3000.lib
pct3000.lib
pd3000.lib
pt3000.lib
p*3000md.lib
Profiling libraries: pb = block/function counter
pc = call graph
pct = call graph and timing
pd = dummy
pt = function timing
Table 5−4: Overview of libraries
To link the default C (system) libraries
1. From the Project menu, select Project Options...
The Project Options dialog box appears.
2. Expand the Linker entry and select Libraries.
3. Select Link default C libraries.
4. Expand the C Compiler entry and select Floating−Point.
5. Enable or disable Use single precision floating−point only.
6. Enable or disable Floating−point trap/exception handling.
7. Click OK to accept the linker options.
When you want to link system libraries from the command line, you must specify this with the option −−library (−l). For example,
to specify the system library c3000.lib, type:
lk3000 −lc3000 test.obj
User library
You can create your own libraries. Section 6.4, Librarian, in Chapter Using the Utilities, describes how you can use the librarian
to create your own library with object modules.
To link user libraries
1. From the Project menu, select Add Existing to Project...
The Choose Documents to add to Project dialog box appears.
2. Select the libraries you want to add and click Open.
3. Click OK to accept the new project settings.
5−7
Using the TSK3000 Embedded Tools
When you want to link user libraries from the command line, you must specify their filenames on the command line:
lk3000 start.obj mylib.lib
If the library resides in a sub−directory, specify that directory with the library name:
lk3000 start.obj mylibs\mylib.lib
If you do not specify a directory, the linker searches the library in the current directory only.
Library order
The order in which libraries appear on the command line is important. By default the linker processes object files and libraries in
the order in which they appear at the command line. Therefore, when you use a weak symbol construction, like printf, in an
object file or your own library, you must position this object/library before the C library.
With the option −−first−library−first you can tell the linker to scan the libraries from left to right, and extract symbols from the
first library where the linker finds it. This can be useful when you want to use newer versions of a library routine:
lk3000 −−first−library−first a.lib test.obj b.lib
If the file test.obj calls a function which is both present in a.lib and b.lib, normally the function in b.lib would be
extracted. With this option the linker first tries to extract the symbol from the first library a.lib.
Note that routines in b.lib that call other routines that are present in both a.lib and b.lib are now also resolved from
a.lib.
5.4.1
How the Linker Searches Libraries
System libraries
You can specify the location of system libraries in several ways. The linker searches the specified locations in the following
order:
1. The linker first looks in the directories that are specified in the Build Options page of the Project Options dialog (equivalent
to the command line option −−library−directory). If you specify the option −−ignore−default−library−path, the linker stops
searching after this step.
2. When the linker did not find the library (because it is not in the specified library directory or because no directory is
specified), it looks in the path(s) specified in the environment variable LIBTSK3000.
3. When the linker did not find the library, it tries the default lib directory relative to the installation directory (or a processor
specific sub−directory).
User library
If you use your own library, the linker searches the library in the current directory only.
5.4.2
How the Linker Extracts Objects from Libraries
A library built with the TASKING librarian tlb always contains an index part at the beginning of the library. The linker scans this
index while searching for unresolved externals. However, to keep the index as small as possible, only the defined symbols of the
library members are recorded in this area.
When the linker finds a symbol that matches an unresolved external, the corresponding object file is extracted from the library
and is processed. After processing the object file, the remaining library index is searched. If after a complete search of the
library unresolved externals are introduced, the library index will be scanned again. After all files and libraries are processed,
and there are still unresolved externals and you did not specify the linker option −−no−rescan, all libraries are rescanned again.
This way you do not have to worry about the library order on the command line and the order of the object files in the libraries.
However, this rescanning does not work for ’weak symbols’. If you use a weak symbol construction, like printf, in an object
file or your own library, you must position this object/library before the C library.
The −−verbose option shows how libraries have been searched and which objects have been extracted.
5−8
Using the Linker
Resolving symbols
If you are linking from libraries, only the objects that contain symbols to which you refer, are extracted from the library. This
implies that if you invoke the linker like:
lk3000 mylib.lib
nothing is linked and no output file will be produced, because there are no unresolved symbols when the linker searches through
mylib.lib.
It is possible to force a symbol as external (unresolved symbol) with the option −−extern (−e):
lk3000 −e main mylib.lib
In this case the linker searches for the symbol main in the library and (if found) extracts the object that contains main. If this
module contains new unresolved symbols, the linker looks again in mylib.lib. This process repeats until no new unresolved
symbols are found.
5.5
Incremental Linking
With the TASKING linker it is possible to link incrementally. Incremental linking means that you link some, but not all .obj
modules to a relocatable object file .out. In this case the linker does not perform the locating phase. With the second
invocation, you specify both new .obj files as the .out file you had created with the first invocation.
Incremental linking is only possible on the command line.
lk3000 −d3000.lsl −r test1.obj −otest.out
lk3000 −d3000.lsl test2.obj test.out
This links the file test1.obj and generates the file test.out. This file is used again and linked together with test2.obj to
create the file test.abs (the default name if no output filename is given in the default ELF/DWARF 2 format).
With incremental linking it is normal to have unresolved references in the output file until all .obj files are linked and the final
.out or .abs file has been reached. The option −−incremental (−r) for incremental linking also suppresses warnings and
errors because of unresolved symbols.
5.6
Linking the C Startup Code
You need the run−time startup code to build an executable application. The default startup code consists of the following
components:
• Initialization code. This code is executed when the program is initiated and before the function main() is called.
• Exit code. This controls the closedown of the application after the program’s main function terminates.
The startup code is part of the C library, and the source is present in the file cstart.asm in the directory lib\src. If the
default run−time startup code does not match your configuration, you need to modify the startup code accordingly.
To link the default startup code
1. From the Project menu, select Project Options...
The Project Options dialog box appears.
2. Expand the Linker entry and select Libraries.
3. Select Link default C libraries.
To use your own startup code
1. Make a copy (backup) of the file lib\src\cstart.asm, for example project_cstart.asm, and place it in your project
directory.
2. From the Project menu, select Add Existing to Project... and add the file project_cstart.asm to your project.
3. Modify the file project_cstart.asm to match your configuration.
5−9
Using the TSK3000 Embedded Tools
Altium Designer adds the startup code to your project, before the libraries. So, the linker finds your startup code first.
5.7
Importing Binary Files
With the TASKING linker it is possible to add a binary file to your absolute output file. In an embedded application you usually do
not have a file system where you can get your data from. With the linker option −−import−object you can add raw data to your
application. This makes it possible for example to display images on a device or play audio. The linker puts the raw data from
the binary file in a section. The section is aligned on a 4−byte boundary. The section name is derived from the filename, in which
dots are replaced by an underscore. So, when importing a file called my.mp3, a section with the name my_mp3 is created. In
your application you can refer to the created section by using linker labels.
For example:
#include <stdio.h>
extern __no_sdata char
_lc_ub_my_mp3; /* linker labels */
extern __no_sdata char
_lc_ue_my_mp3;
char*
mp3 = &_lc_ub_my_mp3;
void main(void)
{
int size = &_lc_ue_my_mp3 − &_lc_ub_my_mp3;
int i;
for (i=0;i<size;i++)
putchar(mp3[i]);
}
Because the compiler does not know in which space the linker will locate the imported binary, you have to make sure the
symbols refer to the same space in which the linker will place the imported binary. You do this by using the memory
qualifier __no_sdata, otherwise the linker cannot bind your linker symbols.
Also note that if you want to use the export functionality of Altium Designer, the binary file has to be part of your project.
5.8
Linker Optimizations
During the linking and locating phase, the linker looks for opportunities to optimize the object code. Both code size and
execution speed can be optimized.
To enable or disable optimizations
1. From the Project menu, select Project Options...
The Project Options dialog box appears.
2. Expand the Linker entry and select Optimization.
You can enable or disable the optimizations described below. The command line option for each optimization is given in
brackets.
See also option −−optimize (−O) in section 4.3, Linker Options, in Chapter Tool Options of the reference manual.
Delete unreferenced sections
(option −Oc/−OC)
This optimization removes unused sections from the resulting object file. Because debug information normally refers to all
sections, the optimization has no effect until you compile your project without debug information or use linker option
−−strip−debug to remove the debug information.
First fit decreasing
(option −Ol/−OL)
When the physical memory is fragmented or when address spaces are nested it may be possible that a given application cannot
be located although the size of the available physical memory is larger than the sum of the section sizes. Enable the
first−fit−decreasing optimization when this occurs and re−link your application.
5−10
Using the Linker
The linker’s default behavior is to place sections in the order that is specified in the LSL file (that is, working from low to high
memory addresses or vice versa). This also applies to sections within an unrestricted group. If a memory range is partially filled
and a section must be located that is larger than the remainder of this range, then the section and all subsequent sections are
placed in a next memory range. As a result of this gaps occur at the end of a memory range.
When the first−fit−decreasing optimization is enabled the linker will first place the largest sections in the smallest memory ranges
that can contain the section. Small sections are located last and can likely fit in the remaining gaps.
Copy table compression
(option −Ot/−OT)
The startup code initializes the application’s data areas. The information about which memory addresses should be zeroed and
which memory ranges should be copied from ROM to RAM is stored in the copy table.
When this optimization is enabled the linker will try to locate sections in such a way that the copy table is as small as possible
thereby reducing the application’s ROM image.
Delete duplicate code
Delete duplicate constant data
(option −Ox/−OX)
(option −Oy/−OY)
These two optimizations remove code and constant data that is defined more than once, from the resulting object file.
5.9
Controlling the Linker with a Script
With the options on the command line you can control the linker’s behavior to a certain degree. From Altium Designer it is also
possible to determine where your sections will be located, how much memory is available, which sorts of memory are available,
and so on. Altium Designer passes these locating directions to the linker via a script file. If you want even more control over the
locating process you can supply your own script.
The language for the script is called the Linker Script Language, or shortly LSL. You can specify the script file to the linker, which
reads it and locates your application exactly as defined in the script. If you do not specify your own script file, the linker always
reads a standard script file which is supplied with the toolset.
5.9.1
Purpose of the Linker Script Language
The Linker Script Language (LSL) serves three purposes:
1. It provides the linker with a definition of the target’s core architecture. This definition is supplied with the toolset.
2. It provides the linker with a specification of the memory attached to the target processor.
3. It provides the linker with information on how your application should be located in memory. This gives you, for example, the
possibility to create overlaying sections.
The linker accepts multiple LSL files. You can use the specifications of the core architectures that Altium has supplied in the
include.lsl directory. Do not change these files.
If you use a different memory layout than described in the LSL file supplied for the target core, you must specify this in a
separate LSL file and pass both the LSL file that describes the core architecture and your LSL file that contains the memory
specification to the linker. Next you may want to specify how sections should be located and overlaid. You can do this in the
same file or in another LSL file.
LSL has its own syntax. In addition, you can use the standard C preprocessor keywords, such as #include and #define,
because the linker sends the script file first to the C preprocessor before it starts interpreting the script.
The complete syntax is described in Chapter 7, Linker Script Language, in the reference manual.
5.9.2
Altium Designer and LSL
In Altium Designer you can specify the size of the stack and heap; the physical memory attached to the processor; identify that
particular address ranges are reserved; and specify which sections are located where in memory. Altium Designer translates
your input into an LSL file that is stored in the project directory under the name project.lsl and passes this file to the linker.
If you want to learn more about LSL you can inspect the generated file project.lsl.
5−11
Using the TSK3000 Embedded Tools
To change the LSL settings
1. From the Project menu, select Project Options...
The Project Options dialog box appears.
2. Open the Configure Memory tab.
3. Make your changes to the memory layout.
4. Open the Sections/Reserved Areas tab.
5. Make your changes to the list of sections and/or reserved areas.
Each time you close the Project Options dialog the file project.lsl is updated and you can immediately see how your
settings are encoded in LSL.
Note that Altium Designer supports ChromaCoding (applying color coding to text) and template expansion when you edit LSL
files.
5.9.3
Structure of a Linker Script File
A script file consists of several definitions. The definitions can appear in any order.
The architecture definition (required)
In essence an architecture definition describes how the linker should convert logical addresses into physical addresses for a
given type of core. If the core supports multiple address spaces, then for each space the linker must know how to perform this
conversion. In this context a physical address is an offset on a given internal or external bus. Additionally the architecture
definition contains information about items such as the (hardware) stack and the vector table.
This specification is normally written by Altium. Altium supplies LSL files in the include.lsl directory. The architecture
definition of the LSL file should not be changed by you unless you also modify the core’s hardware architecture. If the LSL file
describes a multi−core system an architecture definition must be available for each different type of core.
The linker uses the architecture name in the LSL file to identify the target. For example, the default library search path can be
different for each core architecture.
The derivative definition
The derivative definition describes the configuration of the internal (on−chip) bus and memory system. Basically it tells the linker
how to convert offsets on the buses specified in the architecture definition into offsets in internal memory. Microcontrollers and
DSPs often have internal memory and I/O sub−systems apart from one or more cores. The design of such a chip is called a
derivative.
When you design an FPGA together with a PCB, the components on the FPGA become part of the board design and there is no
need to distinguish between internal and external memory. For this reason you probably do not need to work with derivative
definitions at all. There are, however, two situations where derivative definitions are useful:
1. When you re−use an FPGA design for several board designs it may be practical to write a derivative definition for the FPGA
design and include it in the project LSL file.
2. When you want to use multiple cores of the same type, you must instantiate the cores in a derivative definition, since the
linker automatically instantiates only a single core for an unused architecture.
The processor definition
The processor definition describes an instance of a derivative. A processor definition is only needed in a multi−processor
embedded system. It allows you to define multiple processors of the same type.
If for a derivative ’A’ no processor is defined in the LSL file, the linker automatically creates a processor named ’A’ of derivative
’A’. This is why for single−processor applications it is enough to specify the derivative in the LSL file.
The memory and bus definitions (optional)
Memory and bus definitions are used within the context of a derivative definition to specify internal memory and on−chip buses.
In the context of a board specification the memory and bus definitions are used to define external (off−chip) memory and buses.
Given the above definitions the linker can convert a logical address into an offset into an on−chip or off−chip memory device.
5−12
Using the Linker
The board specification
The processor definition and memory and bus definitions together form a board specification. LSL provides language constructs
to easily describe single−core and heterogeneous or homogeneous multi−core systems. The board specification describes all
characteristics of your target board’s system buses, memory devices, I/O sub−systems, and cores that are of interest to the
linker. Based on the information provided in the board specification the linker can for each core:
• convert a logical address to an offset within a memory device
• locate sections in physical memory
• maintain an overall view of the used and free physical memory within the whole system while locating
The section layout definition (optional)
The optional section layout definition enables you to exactly control where input sections are located. Features are provided
such as: the ability to place sections at a given address, to place sections in a given order, and to overlay code and/or data
sections.
Example: Skeleton of a Linker Script File
A linker script file that defines a derivative "X’" based on the TSK3000 architecture, its external memory and how sections are
located in memory, may have the following skeleton:
architecture TSK3000
{
// Specification of the TSK3000 core architecture.
// Written by Altium.
}
derivative X
// derivative name is arbitrary
{
// Specification of the derivative.
// Written by Altium.
core TSK3000
// always specify the core
{
architecture = TSK3000;
}
bus addr_bus
// address bus
{
// maps to addr_bus in "TSK3000" core
}
// internal memory
}
processor proc1
{
derivative = X;
// processor name is arbitrary
// You can omit this part, except if you use a
// multi−core system.
}
memory ext_name
{
// external memory definition
}
5−13
Using the TSK3000 Embedded Tools
section_layout proc1:TSK3000:main
{
// section placement statements
// section layout
// sections are located in address space ’main’
// of core ’TSK3000’ of processor ’proc1’
}
5.9.4
The Architecture Definition
Although you will probably not need to program the architecture definition (unless you are building your own processor core) it
helps to understand the Linker Script Language and how the definitions are interrelated.
Within an architecture definition the characteristics of a target processor core that are important for the linking process are
defined. These include:
• space definitions: the logical address spaces and their properties
• bus definitions: the I/O buses of the core architecture
• mappings: the address translations between logical address spaces, the connections between logical address spaces and
buses and the address translations between buses
Address spaces
A logical address space is a memory range for which the core has a separate way to encode an address into instructions. Most
microcontrollers and DSPs support multiple address spaces. For example, separate spaces for code and data. Normally, the
size of an address space is 2 N, with N the number of bits used to encode the addresses.
The relation of an address space with another address space can be one of the following:
• one space is a subset of the other. These are often used for "small" absolute, and relative addressing.
• the addresses in the two address spaces represent different locations so they do not overlap. This means the core must
have separate sets of address lines for the address spaces. For example, in Harvard architectures we can identify at least a
code and a data memory space.
Address spaces (even nested) can have different minimal addressable units (MAU), alignment restrictions, and page sizes. All
address spaces have a number that identifies the logical space (id). The following table lists the different address spaces.
Space
Id
MAU Description
main
1
8
Address space
Table 5−5: TSK3000 address space
The TSK3000 architecture in LSL notation
The best way to program the architecture definition, is to start with a drawing. The figure below shows a part of the TSK3000
architecture:
space main
bus addr_bus
0
id = 1
mau = 8
mau = 8
width = 32
4G
Figure 5−2: Scheme of the TSK3000 architecture
The figure shows one address spaces called main. The address space has attributes like a number that identifies the logical
space (id), a MAU and an alignment. In LSL notation the definition of this address space looks as follows:
5−14
Using the Linker
space main
{
id
= 1;
mau
= 8;
align = 4;
map (size=4G, dest=bus:addr_bus);
}
The keyword map corresponds with the arrows in the drawing. You can map:
•
•
•
•
address space
=> address space (not shown in the drawing)
address space
=> bus
memory
=> bus (not shown in the drawing)
bus
=> bus (not shown in the drawing)
Next the internal bus named addr_bus must be defined in LSL:
bus addr_bus
{
mau = 8;
width = 32;
}
// there are 32 data lines on the bus
This completes the LSL code in the architecture definition. Note that all code above goes into the architecture definition, thus
between:
architecture TSK3000
{
All code above goes here.
}
5.9.5
The Derivative Definition
When you are building a personal ASIC (using FPGAs) you will probably not need to program the derivative definition (unless
you are using multiple cores), but the description below helps to understand the Linker Script Language and how the definitions
are interrelated.
A derivative is the design of a processor, as implemented on an FPGA. It comprises one or more cores and on−chip memory.
The derivative definition includes:
• core definition: an instance of a core architecture
• bus definition: the I/O buses of the core architecture
• memory definitions: internal (or on−chip) memory
Core
Each derivative must have at least one core and each core must have a specification of its core architecture. This core
architecture must be defined somewhere in the LSL file(s).
core TSK3000
{
architecture = TSK3000;
}
Bus
Each derivative can contain a bus definition for connecting external memory. In this example, the bus addr_bus maps to the
bus addr_bus defined in the architecture definition of core TSK3000:
bus addr_bus
{
mau = 8;
width = 32;
map (dest=bus:TSK3000:addr_bus, dest_offset=0, size=4G);
}
5−15
Using the TSK3000 Embedded Tools
Memory
Memory is usually described in a separate memory definition, but you can specify on−chip memory for a derivative. For
example:
memory internal_code_rom
{
type = rom;
size = 2k;
mau = 8;
map(dest = bus:addr_bus, size=2k,
dest_offset = 0x00100000); // src_offset is zero by default)
}
This completes the LSL code in the derivative definition. Note that all code above goes into the derivative definition, thus
between:
derivative X
// name of derivative
{
All code above goes here.
}
If you create a derivative and you want to use Altium Designer to select sections, the derivative must be called
"TSK3000" for the TSK3000, since Altium Designer uses this name in the generated LSL file. If you want to specify
memory in Altium Designer, the custom derivative must contain the bus "addr_bus" for the same reasons.
5.9.6
The Processor Definition: Using Multi−Processor Systems
The processor definition is only needed when you write an LSL file for a multi−processor embedded system. The processor
definition explicitly instantiates a derivative, allowing multiple processors of the same type.
processor proc_name
{
derivative = deriv_name;
}
If no processor definition is available that instantiates a derivative, a processor is created with the same name as the derivative.
5.9.7
The Memory Definition
Once the core architecture is defined in LSL, you may want to extend the processor with memory. You need to specify the
location and size of the physical external memory devices in the target system.
The principle is the same as defining the core’s architecture but now you need to fill the memory definition:
memory name
{
memory definitions.
}
space main
bus addr_bus
memory iram
0
id = 1
mau = 8
mau = 8
width = 32
0
mau = 8
512k
0
mau = 8
512k
memory xrom
4G
0
32k
memory my_nvram
mau = 8
Figure 5−3: Adding external memory to the TSK3000 architecture
5−16
Using the Linker
Suppose your embedded system has 512kB of internal RAM, named iram, 32kB of external NVRAM, named my_nvram and
512kB of external ROM, named xrom (see figure above.) All memories are connected to the bus addr_bus. In LSL this looks
like follows:
memory iram
{
mau = 8;
type = ram;
size = 512k;
map ( size = 512k, dest_offset=0, dest=bus:X:addr_bus);
}
memory xrom
{
mau = 8;
type = rom;
size = 512k;
map ( size = 512k, dest_offset=512k, dest=bus:X:addr_bus);
}
memory my_nvram
{
mau = 8;
type = ram;
size = 32k;
map ( size = 32k, dest_offset=1M, dest=bus:X:addr_bus);
}
If you use a different memory layout than described in the LSL file supplied for the target core, you can specify this in
Altium Designer or you can specify this in a separate LSL file and pass both the LSL file that describes the core
architecture and your LSL file that contains the memory specification to the linker.
In order to bypass the default memory setup, your memory definition file must contain a #define __MEMORY, and you
must specify this file before the core architecture LSL file.
Adding memory using Altium Designer
1. From the Project menu, select Project Options...
The Project Options dialog box appears.
2. Open the Configure Memory tab.
3. Disable the check box Automatically import when compiling FPGA project.
4. Right−click in the tab and select Add Memory...
The Processor Memory Definition dialog box appears.
5. Specify a new physical memory device, for example my_nvram.
5.9.8
The Section Layout Definition: Locating Sections
Once you have defined the internal core architecture and optional memory, you can actually define where your application must
be located in the physical memory.
During compilation, the compiler divides the application into sections. Sections have a name, an indication (section type) in
which address space it should be located and attributes like writable or read−only.
In the section layout definition you can exactly define how input sections are placed in address spaces, relative to each other,
and what their absolute run−time and load−time addresses will be.
Example: section propagation through the toolset
To illustrate section placement, the following example of a C program is used. The program prints the number of times it has
been executed.
5−17
Using the TSK3000 Embedded Tools
#define BATTERY_BACKUP_TAG
#include <stdio.h>
int
int
0xa5f0
uninitialized_data;
initialized_data = 1;
#pragma section non_volatile
__no_sdata int battery_backup_tag;
__no_sdata int battery_backup_invok;
#pragma endsection
void main (void)
{
if (battery_backup_tag != BATTERY_BACKUP_TAG )
{
// battery back−upped memory area contains invalid data
// initialize the memory
battery_backup_tag = BATTERY_BACKUP_TAG;
battery_backup_invok = 0;
}
printf( "This application has been invoked %d times\n",
battery_backup_invok++);
}
The compiler assigns names and attributes to sections. With the #pragma section and #pragma endsection the
compiler’s default section naming convention is overruled and a section with the name non_volatile appended is defined. In
this section the battery back−upped data is stored.
By default the compiler creates the section .sbss to store uninitialized data objects. With the __no_sdata qualifier this is
.bss.This section name tells the linker to locate the section in address space main and that the section content should be filled
with zeros at startup.
As a result of the #pragma section non_volatile, the data objects between the pragma pair are placed in
.bss.non_volatile. Note that .bss sections are cleared at startup. However, battery back−upped sections should not be
cleared and therefore we will change this section attribute using the LSL.
Section placement
The number of invocations of the example program should be saved in non−volatile (battery back−upped) memory. This is the
memory my_nvram from the example in section 5.9.7, The Memory Definition.
To control the locating of sections, you need to write one or more section definitions in the LSL file. At least one for each address
space where you want to change the default behavior of the linker. In our example, we need to locate sections in the address
space main:
section_layout ::main
{
Section placement statements
}
To locate sections, you must create a group in which you select sections from your program. For the battery back−up example,
we need to define one group, which contains the section .bss.non_volatile. All other sections are located using the
defaults specified in the architecture definition. Section .bss.non_volatile should be placed in non−volatile ram. To achieve
this, the run address refers to our non−volatile memory called my_nvram. Furthermore, the section should not be cleared and
therefore the attribute s (scratch) is assigned to the group:
group ( ordered, run_addr = mem:my_nvram, attributes = rws )
{
select ".bss.non_volatile";
}
5−18
Using the Linker
Section placement from Altium Designer
To specify the above settings using Altium Designer, follow these steps:
1. From the Project menu, select Project Options...
The Project Options dialog box appears.
2. Open the Sections/Reserved Areas tab.
3. Click Add Section.
The Section dialog box appears.
4. In the Name field, enter .bss.non_volatile
5. In the Location field, enter mem:my_nvram
This completes the LSL file for the sample architecture and sample program. You can now invoke the linker with this file and the
sample program to obtain an application that works for this architecture.
For a complete description of the Linker Script Language, refer to Chapter 7, Linker Script Language, in the reference
manual.
5.10
Linker Labels
The linker creates labels that you can use to refer to from within the application software. Some of these labels are real labels at
the beginning or the end of a section. Other labels have a second function, these labels are used to address generated data in
the locating phase. The data is only generated if the label is used.
Linker labels are labels starting with _lc_. The linker assigns addresses to the following labels when they are referenced:
Label
Description
_lc_ub_name
Begin of section name. Also used to mark the begin of the stack or heap or copy table.
_lc_b_name
_lc_ue_name
End of section name. Also used to mark the end of the stack or heap.
_lc_e_name
_lc_cb_name
Start address of an overlay section in ROM.
_lc_ce_name
End address of an overlay section in ROM.
_lc_gb_name
Begin of group name. This label appears in the output file even if no reference to the label exists in the
input file.
_lc_ge_name
End of group name. This label appears in the output file even if no reference to the label exists in the
input file.
Table 5−6: Linker labels
The linker only allocates space for the stack and/or heap when a reference to either of the section labels exists in one of the
input object files.
If you want to use linker labels in your C source for sections that have a dot (.) in the name, you have to replace all dots
by underscores.
See also section 7.9.4, Creating Symbols, in Chapter 7, Linker Script Language of the reference manual.
5−19
Using the TSK3000 Embedded Tools
Example: refer to a label with section name with dots from C
Suppose a section has the name .text. When you want to refer to the begin of this section you have to replace all dots in the
section name by underscores:
#include <stdio.h>
extern __no_sdata void *_lc_ub__text;
int main(void)
{
printf("The section .text is located at %X\n",
&_lc_ub__text);
}
Example: refer to the stack
Suppose in an LSL file a stack section is defined with the name "stack" (with the keyword stack). You can refer to the begin
and end of the stack from your C source as follows:
#include <stdio.h>
extern char _lc_ub_stack[];
extern char _lc_ue_stack[];
void main()
{
printf( "Size of stack is %d\n",
_lc_ub_stack − _lc_ue_stack );
/* stack grows from high to low */
}
From assembly you can refer to the end of the stack with:
.extern _lc_ue_stack
5−20
; end of stack
Using the Linker
5.11
Generating a Map File
The map file is an additional output file that contains information about the location of sections and symbols. You can customize
the type of information that should be included in the map file.
To generate a map file
1. From the Project menu, select Project Options...
The Project Options dialog box appears.
2. Expand the Linker entry and select Map File.
3. Select Generate a memory map file (.map)
4. (Optional) Enable the options to include that information in the map file.
Example on the command line (Windows Command Prompt)
lktarget −M test.obj
With this command the map file test.map is created.
See section 5.2, Linker Map File Format, in Chapter List File Formats of the reference manual for an explanation of the
format of the map file.
Linker option −−map−file (−M) (Generate task related map file)
Linker option −−map−file−format (−m) (Map file formatting)
5.12
Linker Error Messages
The linker produces error messages of the following types:
F Fatal errors
After a fatal error the linker immediately aborts the link/locate process.
E Errors
Errors are reported, but the linker continues linking and locating. No output files are produced unless you have set the linker
option −−keep−output−files.
W Warnings
Warning messages do not result into an erroneous output file. They are meant to draw your attention to assumptions of the
linker for a situation which may not be correct. You can control warnings in the Linker » Diagnostics page of the Project »
Project Options... menu (linker option −−no−warnings).
I Information
Verbose information messages do not indicate an error but tell something about a process or the state of the linker. To see
verbose information, use the linker option −−verbose.
S System errors
System errors occur when internal consistency checks fail and should never occur. When you still receive the system error
message
S6##: message
please report the error number and as many details as possible about the context in which the error occurred.
Display detailed information on diagnostics
1. From the View menu, select Workspace Panels » System » Messages.
The Messages panel appears.
5−21
Using the TSK3000 Embedded Tools
2. In the Messages panel, right−click on the message you want more information on.
A popup menu appears.
3. Select More Info.
A Message Info box appears with additional information.
On the command line you can use the linker option −−diag you can see an explanation of a diagnostic message:
lktarget −−diag=[format:]{all | number,...]
See linker option −−diag in section 4.3, Linker Options in Chapter Tool Options of the reference manual.
5−22
6 Using the Utilities
Summary
6.1
This chapter describes the utilities that are delivered with the product.
Introduction
The TASKING toolset comes with a number of utilities that are only available as command line tools.
cctarget
A control program. The control program invokes all tools in the toolset and lets you quickly generate an absolute
object file from C and/or assembly source input files.
tmk
A utility program to maintain, update, and reconstruct groups of programs. The make utility looks whether files are
out of date, rebuilds them and determines which other files as a consequence also need to be rebuilt.
tlb
A librarian. With this utility you create and maintain library files with relocatable object modules (.obj) generated
by the assembler.
6−1
Using the TSK3000 Embedded Tools
6.2
Control Program
The control program is a tool that invokes all tools in the toolset for you. It provides a quick and easy way to generate the final
absolute object file out of your C sources without the need to invoke the compiler, assembler and linker manually.
6.2.1
Calling the Control Program
You can only call the control program from the command line. The invocation syntax is:
cctarget [ [option]... [file]... ]...
where, target is the target you are building for.
Recognized input files
The control program recognizes the following input files:
•
•
•
•
•
•
Files with a .c suffix are interpreted as C source programs and are passed to the C compiler.
Files with a .asm suffix are interpreted as hand−written assembly source files which have to be passed to the assembler.
Files with a .src suffix are interpreted as compiled assembly source files. They are directly passed to the assembler.
Files with a .lib suffix are interpreted as library files and are passed to the linker.
Files with a .obj suffix are interpreted as object files and are passed to the linker.
Files with a .out suffix are interpreted as linked object files and are passed to the locating phase of the linker. The linker
accepts only one .out file in the invocation.
• An argument with a .lsl suffix is interpreted as a linker script file and is passed to the linker.
Options
The control program accepts several command line options. If you specify an unknown option to the control program, the control
program looks if it is an option for a specific tool. If so, it passes the option directly to the tool. However, for directly passing an
option to the C compiler, assembler or linker, it is recommended to use the control program options −−pass−c,
−−pass−assembler, −−pass−linker.
Example with verbose output
cc3000 −v test.c
The control program calls all tools in the toolset and generates the absolute object file test.abs. With option −−verbose (−v)
you can see how the control program calls the tools:
+ path\c3000 −o cc1692a.src test.c
+ path\as3000 −o cc1692b.obj cc1692a.src
+ path\lk3000 cc1692b.obj −o test.abs −d3000.lsl −M −O0
−lc3000md −lfp3000md
The control program produces unique filenames for intermediate steps in the compilation process (such as cc1692a.src and
cc1692b.obj in the example above) which are removed afterwards, unless you specify command line option
−−keep−temporary−files (−t).
Example with argument passing to a tool
cc3000 −Wc−Oc test.c
The option −Oc is directly passed to the compiler.
6−2
Using the Utilities
6.2.2
Overview of Control Program Options
The following control program options are available:
Description
Option
Information
Display invocation options
−−help / −?
Display version header
−−version / −V
Show description of diagnostics
−−diag=[fmt:]{all|nr}
Check the source, but do not generate code
−−check
Profiling
−−profile[=flags] / −p
Verbose output
−−verbose / −v
Verbose output and suppress execution
−−dry−run / −n
Suppress all or specific warnings
−−no−warnings[=num] / −w
Treat warnings as errors
−−warnings−as−errors
C Language
ISO C standard 90 or 99 (default: 99)
−−iso={90|99}
Treat external definitions as "static"
−−static
Single precision floating−point
−−no−double / −F
Preprocessing
Define preprocessor macro
−−define=macro[=def] / −D
Remove preprocessor macro
−−undefine=macro / −U
Store the C compiler preprocess output (file.pre)
−−preprocess[=flags] / −E
Force full compilation
−−no−preprocessing−only
Code generation
Use multiply/divide unit
−−use−hardware=flag,...
Generate symbolic debug information
−−debug−info / −g
Pass arguments
Pass arguments directly to the:
C compiler
−−pass−c=option
Assembler
−−pass−assembler=option
Linker
−−pass−linker=option
Libraries
Add library directory
−−library−directory=dir / −L
Add library
−−library=lib / −l
Ignore the default search path for libraries
−−ignore−default−library−path
Do not include default list of libraries
−−no−default−libraries
Use trapped floating−point library
−−fp−trap
Input files
Specify linker script file
−−lsl−file=file / −d
Read options from file
−−option−file=file / −f
Add include directory
−−include−directory=dir / −I
6−3
Using the TSK3000 Embedded Tools
Description
Option
Output files
Redirect diagnostic messages to a file
−−error−file
Select final output file:
relocatable output file
−−create=relocatable
MIL file(s)
−−create=mil
object file(s)
−−create=object
assembly file(s)
−−create=assembly
Specify linker output format (IEEE, ELF, IHEX, SREC)
−−format=type
Set the address size for linker IHEX/SREC files
−−address−size=n
Keep output file(s) after errors
−−keep−output−files / −k
Generate assembler list files
−−list−files[=name]
Do not generate linker map file
−−no−map−file
Specify name of output file
−−output=file / −o
Do not delete intermediate (temporary) files
−−keep−temporary−files / −t
Table 6−1: Overview of control program options
For a complete list and description of all control program options, see section 4.4, Control Program Options, in Chapter
Tool Options of the reference manual.
6−4
Using the Utilities
6.3
Make Utility
If you are working with large quantities of files, or if you need to build several targets, it is rather time−consuming to call the
individual tools to compile, assemble, link and locate all your files.
You save already a lot of typing if you use the control program cctarget and define an options file. You can even create a batch
file or script that invokes the control program for each target you want to create. But with these methods all files are completely
compiled, assembled and linked to obtain the target file, even if you changed just one C source. This may demand a lot of
(CPU) time on your host.
The make utility tmk is a tool to maintain, update, and reconstruct groups of programs. The make utility looks which files are
out−of−date and only recreates these files to obtain the updated target.
Make process
In order to build a target, the make utility needs the following input:
• the target it should build, specified as argument on the command line
• the rules to build the target, stored in a file usually called makefile
In addition, the make utility also reads the file tmk.mk which contains predefined rules and macros. See section 6.3.3,
Writing a Makefile.
The makefile contains the relationships among your files (called dependencies) and the commands that are necessary to create
each of the files (called rules). Typically, the absolute object file (.abs) is updated when one of its dependencies has changed.
The absolute file depends on .obj files and libraries that must be linked together. The .obj files on their turn depend on .src
files that must be assembled and finally, .src files depend on the C source files (.c) that must be compiled. In the makefile
makefile this looks like:
test.src : test.c
c3000 test.c
# dependency
# rule
test.obj : test.src
as3000 test.src
test.abs : test.obj
lk3000 test.obj −o test.abs −d3000.lsl −M −O0 −lc3000 −lfp3000
You can use any command that is valid on the command line as a rule in the makefile. So, rules are not restricted to
invocation of the toolset.
Example
To build the target test.abs, call tmk with one of the following lines:
tmk test.abs
tmk −f mymake.mak test.abs
By default the make utility reads makefile so you do not need to specify it on the command line. If you want to use
another name for the makefile, use the option −f my_makefile.
If you do not specify a target, tmk uses the first target defined in the makefile. In this example it would build test.src
instead of test.abs.
The make utility now tries to build test.abs based on the makefile and peforms the following steps:
1. From the makefile the make utility reads that test.abs depends on test.obj.
2. If test.obj does not exist or is out−of−date, the make utility first tries to build this file and reads from the makefile that
test.obj depends on test.src.
3. If test.src does exist, the make utility now creates test.obj by executing the rule for it: c3000 test.src.
4. There are no other files necessary to create test.abs so the make utility now can use test.obj to create test.abs by
executing the rule lk3000 test.obj −o test.abs .....
6−5
Using the TSK3000 Embedded Tools
The make utility has now built test.abs but it only used the assembler to update test.obj and the linker to create
test.abs.
If you compare this to the control program:
cc3000 test.c
This invocation has the same effect but now all files are recompiled (assembled, linked and located).
6.3.1
Calling the Make Utility
You can only call the make utility from the command line. The invocation syntax is:
tmk [ [option]... [target]... [macro=def]... ]
For example:
tmk test.abs
target
You can specify any target that is defined in the makefile. A target can also be one of the intermediate files
specified in the makefile.
macro=def
Macro definition. This definition remains fixed for the tmk invocation. It overrides any regular definitions for the
specified macro within the makefiles and from the environment. It is inherited by subordinate tmk’s but act as an
environment variable for these. That is, depending on the −e setting, it may be overridden by a makefile definition.
Exit status
tmk returns an exit status of 1 when it halts as a result of an error. Otherwise it returns an exit status of 0.
6.3.2
Overview of Make Utility Options
The following make utility options are available:
Description
Option
Information
Display invocation options
−?
Display version header only
−V
Print makefile lines while being read
−D/−DD
Display time comparisons which indicate a target is out of date
−d/−dd
Verbose option: show commands without executing (dry run)
−n
Do not show commands before execution
−s
Do not build, only indicate whether target is up−to−date
−q
Input files
Use makefile instead of the standard makefile
−f makefile
Change to directory before reading the makefile
−G path
Read options from file
−m file
Do not read the tmk.mk file
−r
Process
Always rebuild target without checking whether it is out−of−date
−a
Run as a child process
−c
Environment variables override macro definitions
−e
Do not remove temporary files
−K
On error, only stop rebuilding current target
−k
Overrule the option −k (only stop building current target)
−S
Touch the target files instead of rebuilding them
−t
Treat target as if it has just been reconstructed
−W target
6−6
Using the Utilities
Description
Option
Error messages
Redirect error messages and verbose messages to a file
−err file
Ignore error codes returned by commands
−i
Redirect messages to standard out instead of standard error
−w
Show extended error messages
−x
Table 6−2: Overview of control program options
For a complete list and description of all make utility options, see section 4.5, Make Utility Options, in Chapter Tool
Options of the reference manual.
6.3.3
Writing a MakeFile
In addition to the standard makefile makefile, the make utility always reads the makefile tmk.mk before other inputs. This
system makefile contains implicit rules and predefined macros that you can use in the makefile makefile.
With the option −r (Do not read the tmk.mk file) you can prevent the make utility from reading tmk.mk.
The default name of the makefile is makefile in the current directory. If you want to use other makefiles, use the option −f
my_makefile.
The makefile can contain a mixture of:
•
•
•
•
•
•
targets and dependencies
rules
macro definitions or functions
comment lines
include lines
export lines
To continue a line on the next line, terminate it with a backslash (\):
# this comment line is continued\
on the next line
If a line must end with a backslash, add an empty macro.
# this comment line ends with a backslash \$(EMPTY)
# this is a new line
Targets and dependencies
The basis of the makefile is a set of targets, dependencies and rules. A target entry in the makefile has the following format:
target ... : [dependency ...] [; rule]
[rule]
...
Target lines must always start at the beginning of a line, leading white spaces (tabs or spaces) are not allowed. A target line
consists of one or more targets, a semicolon and a set of files which are required to build the target (dependencies). The target
itself can be one or more filenames or symbolic names:
all:
demo.abs final.abs
demo.abs final.abs:
test.obj demo.obj final.obj
You can now can specify the target you want to build to the make utility. The following three invocations all have the same effect:
tmk
tmk all
tmk demo.abs final.abs
If you do not specify a target, the first target in the makefile (in this example all) is built. The target all depends on demo.abs
and final.abs so the second and third invocation have the same effect and the files demo.abs and final.abs are built.
6−7
Using the TSK3000 Embedded Tools
You can normally use colons to denote drive letters. The following works as intended:
c:foo.obj : a:foo.c
If a target is defined in more than one target line, the dependencies are added to form the target’s complete dependency list:
all:
all:
demo.abs
final.abs
# These two lines are equivalent with:
# all: demo.abs final.abs
For target lines, macros and functions are expanded at the moment they are read by the make utility. Normally macros are not
expanded until the moment they are actually used.
Special targets
There are a number of special targets. Their names begin with a period.
Target
Description
.DEFAULT
If you call the make utility with a target that has no definition in the makefile, this target is built.
.DONE
When the make utility has finished building the specified targets, it continues with the rules following this
target.
.IGNORE
Non−zero error codes returned from commands are ignored. Encountering this in a makefile is the same as
specifying the option −i on the command line.
.INIT
The rules following this target are executed before any other targets are built.
.PRECIOUS
Dependency files mentioned for this target are never removed. Normally, if a command in a rule returns an
error or when the target construction is interrupted, the make utility removes that target file.
.SILENT
Commands are not echoed before executing them. Encountering this in a makefile is the same as
specifying the option −s on the command line.
.SUFFIXES
This target specifies a list of file extensions. Instead of building a completely specified target, you now can
build a target that has a certain file extension. Implicit rules to build files with a number of extensions are
included in the system makefile tmk.mk.
If you specify this target with dependencies, these are added to the existing .SUFFIXES target in tmk.mk. If
you specify this target without dependencies, the existing list is cleared.
Rules
A line with leading white space (tabs or spaces) is considered as a rule and associated with the most recently preceding
dependency line. A rule is a line with commands that are executed to build the associated target. A target−dependency line can
be followed by one or more rules.
final.src : final.c
move test.c final.c
c3000 final.c
# target and dependency
# rule1
# rule2
You can precede a rule with one or more of the following characters:
@ does not echo the command line, except if −n is used.
−
the make utility ignores the exit code of the command (ERRORLEVEL in MS−DOS). Normally the make utility stops if a
non−zero exit code is returned. This is the same as specifying the option −i on the command line or specifying the special
.IGNORE target.
+ The make utility uses a shell or COMMAND.COM to execute the command. If the ’+’ is not followed by a shell line, but the
command is a DOS command or if redirection is used (<, |, >), the shell line is passed to COMMAND.COM anyway.
You can force tmk to execute multiple command lines in one shell environment. This is accomplished with the token
combination ’;\’. For example:
cd c:\Tasking\bin ;\
tmk −V
Note that the ’;’ must always directly be followed by the ’\’ token. Whitespace is not removed when it is at the end of the previous
command line or when it is in front of the next command line. The use of the ’;’ as an operator for a command (like a semicolon
’;’ separated list with each item on one line) and the ’\’ as a layout tool is not supported, unless they are separated with
whitespace.
6−8
Using the Utilities
Inline temporary files
The make utility can generate inline temporary files. If a line contains <<LABEL (no whitespaces!) then all subsequent lines are
placed in a temporary file until the line LABEL is encountered. Next, <<LABEL is replaced by the name of the temporary file.
Example:
lk3000 −o $@ −f <<EOF
$(separate "\n" $(match .obj $!))
$(separate "\n" $(match .lib $!))
$(LKFLAGS)
EOF
The three lines between <<EOF and EOF are written to a temporary file (for example mkce4c0a.tmp), and the rule is rewritten
as lk3000 −o $@ −f mkce4c0a.tmp.
Suffix targets
Instead of specifying a specific target, you can also define a general target. A general target specifies the rules to generate a file
with extension .ex1 to a file with extension .ex2. For example:
.SUFFIXES:
.c.src
:
.c
c3000 $<
Read this as: to build a file with extension .src out of a file with extension .c, call the compiler with $<. $< is a predefined
macro that is replaced with the basename of the specified file. The special target .SUFFIXES: is followed by a list of file
extensions of the files that are required to build the target.
Implicit rules
Implicit rules are stored in the system makefile tmk.mk and are intimately tied to the .SUFFIXES special target. Each
dependency that follows the .SUFFIXES target, defines an extension to a filename which must be used to build another file. The
implicit rules then define how to actually build one file from another. These files share a common basename, but have different
extensions.
If the specified target on the command line is not defined in the makefile or has not rules in the makefile, the make utility looks if
there is an implicit rule to build the target.
Example:
This makefile says that prog.abs depends on two files prog.obj and sub.obj, and that they in turn depend on their
corresponding source files (prog.c and sub.c) along with the common file inc.h.
LIB
=
−lc3000 −lfp3000
# macro
prog.abs:
prog.obj sub.obj
lk3000 prog.obj sub.obj $(LIB) −d3000.lsl −o prog.abs
prog.obj:
prog.c inc.h
c3000 prog.c
as3000 prog.src
sub.obj:
sub.c inc.h
c3000 sub.c
as3000 sub.src
The following makefile uses implicit rules (from tmk.mk) to perform the same job.
LKFLAGS =
prog.abs:
prog.obj:
sub.obj:
−lc3000 −lfp3000
prog.obj sub.obj
prog.c inc.h
sub.c inc.h
#
#
#
#
macro used by
implicit rule
implicit rule
implicit rule
implicit rules
used
used
used
6−9
Using the TSK3000 Embedded Tools
Macro definitions
A macro is a symbol name that is replaced with its definition before the makefile is executed. Although the macro name can
consist of lower case or upper case characters, upper case is an accepted convention. The general form of a macro definition is:
MACRO = text and more text
Spaces around the equal sign are not significant.
To use a macro, you must access its contents:
$(MACRO)
${MACRO}
# you can read this as
# the contents of macro MACRO
If the macro name is a single character, the parentheses are optional. Note that the expansion is done recursively, so the body
of a macro may contain other macros. These macros are expanded when the macro is actually used, not at the point of
definition:
FOOD = $(EAT) and $(DRINK)
EAT = meat and/or vegetables
DRINK = water
export FOOD
The macro FOOD is expanded as meat and/or vegetables and water at the moment it is used in the export line line and
the environment variable FOOD is set accordingly.
Predefined macros
Macro
Description
MAKE
Holds the value tmk. Any line which uses MAKE, temporarily overrides the option −n (Show commands
without executing), just for the duration of the one line. This way you can test nested calls to MAKE with the
option −n.
MAKEFLAGS
Holds the set of options provided to tmk (except for the options −f and −d). If this macro is exported to set
the environment variable MAKEFLAGS, the set of options is processed before any command line options.
You can pass this macro explicitly to nested tmk’s, but it is also available to these invocations as an
environment variable.
PRODDIR
Holds the name of the directory where tmk is installed. You can use this macro to refer to files belonging to
the product, for example a library source file.
DOPRINT = $(PRODDIR)/lib/src/_doprint.c
When tmk is installed in the directory c:/Tasking/bin this line expands to:
DOPRINT = c:/Tasking/lib/src/_doprint.c
SHELLCMD
Holds the default list of commands which are local to the SHELL. If a rule is an invocation of one of these
commands, a SHELL is automatically spawned to handle it.
$
This macro translates to a dollar sign. Thus you can use "$$" in the makefile to represent a single "$".
Dynamically maintained macros
There are several dynamically maintained macros that are useful as abbreviations within rules. It is best not to define them
explicitly.
Macro
Description
$*
The basename of the current target.
$<
The name of the current dependency file.
$@
The name of the current target.
$?
The names of dependents which are younger than the target.
$!
The names of all dependents.
The $< and $* macros are normally used for implicit rules. They may be unreliable when used within explicit target command
lines. All macros may be suffixed with F to specify the Filename components (e.g. ${*F}, ${@F}). Likewise, the macros $*, $<
and $@ may be suffixed by D to specify the Directory component.
6−10
Using the Utilities
The result of the $* macro is always without double quotes ("), regardless of the original target having double quotes (") around it
or not.
The result of using the suffix F (Filename component) or D (Directory component) is also always without double quotes ("),
regardless of the original contents having double quotes (") around it or not.
Makefile: Functions
A function not only expands but also performs a certain operation. Functions syntactically look like macros but have embedded
spaces in the macro name, e.g. ’$(match arg1 arg2 arg3 )’. All functions are built−in and currently there are five of them:
match, separate, protect, exist and nexist.
match
The match function yields all arguments which match a certain suffix:
$(match .obj prog.obj sub.obj mylib.lib)
yields:
prog.obj sub.obj
separate
The separate function concatenates its arguments using the first argument as the separator. If the first argument is enclosed in
double quotes then ’\n’ is interpreted as a newline character, ’\t’ is interpreted as a tab, ’\ooo’ is interpreted as an octal value
(where, ooo is one to three octal digits), and spaces are taken literally. For example:
$(separate "\n" prog.obj sub.obj)
results in:
prog.obj
sub.obj
Function arguments may be macros or functions themselves. So,
$(separate "\n" $(match .obj $!))
yields all object files the current target depends on, separated by a newline string.
protect
The protect function adds one level of quoting. This function has one argument which can contain white space. If the
argument contains any white space, single quotes, double quotes, or backslashes, it is enclosed in double quotes. In addition,
any double quote or backslash is escaped with a backslash.
Example:
echo $(protect I’ll show you the "protect" function)
yields:
echo "I’ll show you the \"protect\" function"
exist
The exist function expands to its second argument if the first argument is an existing file or directory.
Example:
$(exist test.c cc3000 test.c)
When the file test.c exists, it yields:
cc3000 test.c
When the file test.c does not exist nothing is expanded.
6−11
Using the TSK3000 Embedded Tools
nexist
The nexist function is the opposite of the exist function. It expands to its second argument if the first argument is not an
existing file or directory.
Example:
$(nexist test.src cc3000 test.c)
Conditional processing
Lines containing ifdef, ifndef, else or endif are used for conditional processing of the makefile. They are used in the
following way:
ifdef macro−name
if−lines
else
else−lines
endif
The if−lines and else−lines may contain any number of lines or text of any kind, even other ifdef, ifndef, else and endif
lines, or no lines at all. The else line may be omitted, along with the else−lines following it.
First the macro−name after the if command is checked for definition. If the macro is defined then the if−lines are interpreted
and the else−lines are discarded (if present). Otherwise the if−lines are discarded; and if there is an else line, the else−lines are
interpreted; but if there is no else line, then no lines are interpreted.
When using the ifndef line instead of ifdef, the macro is tested for not being defined. These conditional lines can be nested
up to 6 levels deep.
See also Defining Macros in section 4.5, Make Utility Options, in Chapter Tools Options of the reference manual.
Comment lines
Anything after a "#" is considered as a comment, and is ignored. If the "#" is inside a quoted string, it is not treated as a
comment. Completely blank lines are ignored.
test.src
: test.c
cc3000 test.c
# this is comment and is
# ignored by the make utility
Include lines
An include line is used to include the text of another makefile (like including a .h file in a C source). Macros in the name of the
included file are expanded before the file is included. Include files may be nested.
include makefile2
Export lines
An export line is used to export a macro definition to the environment of any command executed by the make utility.
GREETING = Hello
export GREETING
This example creates the environment variable GREETING with the value Hello. The macros is exported at the moment the
export line is read so the macro definition has to proceed the export line.
6−12
Using the Utilities
6.4
Librarian
The librarian tlb is a program to build and maintain your own library files. A library file is a file with extension .lib and contains
one or more object files (.obj) that may be used by the linker.
The librarian has five main functionalities:
•
•
•
•
•
Deleting an object module from the library
Moving an object module to another position in the library file
Replacing an object module in the library or add a new object module
Showing a table of contents of the library file
Extracting an object module from the library
The librarian takes the following files for input and output:
assembler
librarian
tlb
relocatable object file
.obj
relocatable object library
.lib
linker
Figure 6−1: Librarian
The linker optionally includes object modules from a library if that module resolves an external symbol definition in one of the
modules that are read before.
6.4.1
Calling the Librarian
You can only call the librarian from the command line. The invocation syntax is:
tlb key_option [sub_option...] library [object_file]
key_option
With a key option you specify the main task which the librarian should perform. You must always specify a key
option.
sub_option
Sub−options specify into more detail how the librarian should perform the task that is specified with the key option.
It is not obligatory to specify sub−options.
library
The name of the library file on which the librarian performs the specified action. You must always specify a library
name, except for the option −? and −V. When the library is not in the current directory, specify the complete path
(either absolute or relative) to the library.
object_file
The name of an object file. You must always specify an object file name when you add, extract, replace or remove
an object file from the library.
6.4.2
Overview of Librarian Options
The following librarian options are available:
Description
Option
Sub−option
Main functions (key options)
Replace or add an object module
−r
−a −b −c −u −v
Extract an object module from the library
−x
−v
Delete object module from library
−d
−v
Move object module to another position
−m
−a −b −v
Print a table of contents of the library
−t
−s0 −s1
Print object module to standard output
−p
Sub−options
Append or move new modules after existing module name
−a name
6−13
Using the TSK3000 Embedded Tools
Description
Option
Append or move new modules before existing module name
−b name
Create library without notification if library does not exist
−c
Preserve last−modified date from the library
−o
Print symbols in library modules
−s{0|1}
Replace only newer modules
−u
Verbose
−v
Sub−option
Miscellaneous
Display options
−?
Display version header
−V
Read options from file
−f file
Suppress warnings above level n
−wn
Table 6−3: Overview of librarian options and sub−options
For a complete list and description of all librarian options, see section 4.6, Librarian Options, in Chapter Tool Options of
the reference manual.
6.4.3
Examples
Create a new library
If you add modules to a library that does not yet exist, the library is created. To create a new library with the name mylib.lib
and add the object modules cstart.obj and calc.obj to it:
tlb −r mylib.lib cstart.obj calc.obj
Add a new module to an existing library
If you add a new module to an existing library, the module is added at the end of the module. (If the module already exists in the
library, it is replaced.)
tlb −r mylib.lib mod3.obj
Print a list of object modules in the library
To inspect the contents of the library:
tlb −t mylib.lib
The library has the following contents:
cstart.obj
calc.obj
mod3.obj
Move an object module to another position
To move mod3.obj to the beginning of the library, position it just before cstart.obj:
tlb −mb cstart.obj mylib.lib mod3.obj
Delete an object module from the library
To delete the object module cstart.obj from the library mylib.lib:
tlb −d mylib.lib cstart.obj
Extract all modules from the library
Extract all modules from the library mylib.lib:
tlb −x mylib.lib
6−14
Index
Index
A
Absolute object file, 5−2
Address, 5−2
Address spaces, 5−14
Architecture, 5−2
Architecture definition, 5−12, 5−14
Assembler, 4−1
error messages, 4−6
invocation, 4−2
optimizations, 4−5
setting options, 4−2
Assembly process, 4−1
B
Backend
compiler phase, 2−2
optimization, 2−2
Board specification, 5−13
Breakpoints, 1−8
Building an Embedded Application, 1−7
Bus, 5−15
Bus definition, 5−12
C
C compiler settings, 1−7
C prepocessor, 5−11
C programming, 1−1
C source files
Adding a new source file to a project, 1−4
Adding existing files to a project, 1−5
ChromaCoding, 5−12
Coalescer, 2−8
Code checking, 2−9
Code generator, 2−2
Code instrumentation, 3−2
Code modification, 5−3
Common subexpression elimination, 2−7
Compaction, 2−7
Compilation process, 2−1
Compiler
error messages, 2−10
invocation, 2−2
optimizations, 2−6
setting options, 2−3
Compiler phases
backend, 2−1
code generator phase, 2−2
optimization phase, 2−2
peephole optimizer phase, 2−2
pipeline scheduler, 2−2
frontend, 2−1
optimization phase, 2−2
parser phase, 2−2
preprocessor phase, 2−1
scanner phase, 2−1
Compiling a single source file, 1−7
Compiling for debugging, 2−6
Conditional jump reversal, 2−8
Constant propagation, 2−7
Control flow simplification, 2−7
Control program, 6−2
invocation, 6−2
options (overview), 6−3
Controlling the linker, 5−3
Copy table, 5−2
compression, 5−11
Core, 5−2, 5−15
CSE, 2−7
D
Dead code elimination, 2−8
Debug information, 2−6
Debugging, 2−6
Debugging an Embedded Application, 1−8
Evaluating expressions, 1−8
Setting breakpoints, 1−8
Viewing memory, 1−9
Viewing output, 1−9
Watching expressions, 1−8
Delete duplicate code sections, 5−11
Delete duplicate constant data, 5−11
Delete unreferenced sections, 5−10
Derivative, 5−2
Derivative definition, 5−12, 5−15
Device selection, 1−5
E
ELF/DWARF 2 format, 5−3
Embedded Applications
Building, 1−7
Debugging, 1−8
Rebuilding, 1−7
Embedded programming, 1−1
Embedded Project Options, 1−5
Tool options, 1−6
Embedded projects, 1−1
Adding a new source file, 1−4
Adding existing files, 1−5
Creating, 1−4
Setting options, 1−5
Embedded Software, Getting started, 1−1
Embedded Software Tools, 1−1
Embedded tool options, 1−6
Error messages
assembler, 4−6
compiler, 2−10
linker, 5−21
Expression simplification, 2−7
F
File extensions, 1−3
First fit decreasing, 5−10
Index−1
Using the TSK3000 Embedded Tools
Flow simplification, 2−7
Forward store, 2−8
Frontend
compiler phase, 2−1
optimization, 2−2
G
Generic assembly optimizations, 2−8
I
Include files
default directory, 2−5, 4−4, 5−8
search order, 2−5, 4−4
Incremental linking, 5−9
Inlining functions, 2−7
Instruction scheduler, 2−8
Intel−Hex format, 5−3
Interprocedural register optimization, 2−8
J
Jump chaining, 2−8
L
Labels, linker, 5−19
Librarian, 5−8, 6−13
invocation, 6−13
options (overview), 6−13
Libraries
extracting objects, 5−8
linking, 5−7
order on command line, 5−8
search order, 5−8
system, 5−7
user, 5−7
Library, 5−2
Library maintainer, 6−13
Linker
controlling from within Altium Designer, 5−11
controlling with a script, 5−11
error messages, 5−21
invocation, 5−4
labels, 5−19
optimizations, 5−10
Linker output formats
ELF/DWARF 2 format, 5−3
Intel−Hex format, 5−3
Motorola S−record format, 5−3
Linker script file, 5−3
architecture definition, 5−12, 5−14
board specification, 5−13
bus definition, 5−12
derivative definition, 5−12, 5−15
memory definition, 5−12, 5−16
processor definition, 5−12, 5−16
section layout definition, 5−13, 5−17
structure, 5−12
Index−2
Linker script language (LSL), 5−3, 5−11
internal memory, 5−15
on−chip memory, 5−15
Linking process, 5−1
incremental linking, 5−9
linking, 5−2
locating, 5−3
optimizations, 5−10
List file, generating, 4−5
Locating, 5−3
Logical address, 5−2
Loop transformations, 2−8
Loop unrolling, 2−8
LSL, 5−11
LSL file, 5−2
M
Make utility, 6−5
.DEFAULT target, 6−8
.DONE target, 6−8
.IGNORE target, 6−8
.INIT target, 6−8
.PRECIOUS target, 6−8
.SILENT target, 6−8
.SUFFIXES target, 6−8
comment lines, 6−12
conditional processing, 6−12
dependency, 6−7
drive letters, 6−8
else, 6−12
endif, 6−12
exist function, 6−11
export lines, 6−12
functions, 6−11
ifdef, 6−12
ifndef, 6−12
implicit rules, 6−9
include lines, 6−12
invocation, 6−6
macro definition, 6−6
macro definitions, 6−10
macro MAKE, 6−10
macro MAKEFLAGS, 6−10
macro PRODDIR, 6−10
macro SHELLCMD, 6−10
makefile, 6−5, 6−7
match function, 6−11
nexist function, 6−12
options (overview), 6−6
predefined macros, 6−10
protect function, 6−11
rules in makefile, 6−8
separate function, 6−11
special targets, 6−8
Makefile, 6−5
writing, 6−7
Map file, 5−21
Index
MAU, 5−2
Memory, 5−16
Memory definition, 5−12, 5−16
Memory viewing, 1−9
MISRA−C, 2−9
Motorola S−record format, 5−3
O
Object code, 5−2
Opimizations, size/speed trade−off, 2−8
Optimizations
assembler, 4−5
allow generic instructions, 4−5
jump chains, 4−5
optimize instruction size, 4−5
backend, 2−2
coalescer, 2−8
compaction, 2−7
compiler, 2−6
common subexpression elimination, 2−7
conditional jump reversal, 2−8
constant propagation, 2−7
control flow simplification, 2−7
copy table compression, 5−11
dead code elimination, 2−8
delete duplicate code sections, 5−11
delete duplicate constant data, 5−11
delete unreferenced sections, 5−10
expression simplification, 2−7
first fit decreasing, 5−10
flow simplification, 2−7
forward store, 2−8
frontend, 2−2
generic assembly optimizations, 2−8
inlining functions, 2−7
instruction scheduler, 2−8
interprocedural register optimization, 2−8
jump chaining, 2−8
linker, 5−10
loop transformations, 2−8
Loop unrolling, 2−8
peephole optimizations, 2−8
reverse inlining, 2−7
subscript strength reduction, 2−8
switch optimization, 2−8
Output formats. See Linker output formats
Output of application, 1−9
P
Parser, 2−2
Peephole optimization, 2−2, 2−8
Physical address, 5−2
Pipeline scheduler, 2−2
Processor, 5−2
class, 2−2, 4−2
selecting a core, 2−3, 4−2
Processor definition, 5−12, 5−16
Processors
Selecting a device, 1−5
Setting a target processor, 1−5
Profiling, 3−1
call graph incorrect, 3−4
code instrumentation, 3−2
heap too small, 3−4
Project, Embedded, 1−4
Projects, Embedded projects, 1−1
Q
Quality assurence report, 2−9
R
Register allocator, 2−2
Relocatable object file, 5−1, 5−2
debug information, 5−3
header information, 5−2
object code, 5−2
relocation information, 5−3
symbols, 5−2
Relocation, 5−2
Relocation expressions, 5−3
Relocation information, 5−2
Resolving symbols, 5−9
Reverse inlining, 2−7
S
Scanner, 2−1
Section, 5−2
Section attributes, 5−2
Section layout definition, 5−13, 5−17
Sections, locating, 5−17
Setting, Breakpoints, 1−8
Space names, 5−14
Startup code, 5−9
Subscript strength reduction, 2−8
Switch optimization, 2−8
T
Target, 5−2
Target processors in embedded projects, 1−5
TASKING tools, 1−1
U
Unresolved reference, 5−2
Utilities
control program, 6−2
librarian, 6−13
make utility, 6−5
V
Verbose option, linker, 5−8
Index−3
Using the TSK3000 Embedded Tools
Index−4