1
LabSpec 5 user manual
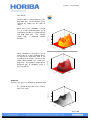
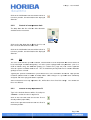
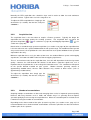
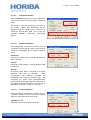
Show data limits
When “Show data limits” is ticked, the mapping
area is superimposed on the video image.
1 µm
Show data points
When “Show data points” is ticked, the individual
acquisition positions for the map are superimposed
on the video image.
1 µm
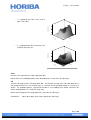
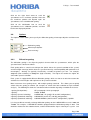
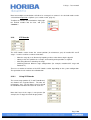
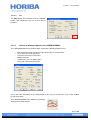
Show data name
When “Show data name” is ticked, the name of the
image component is superimposed on the video
image.
model_1
1 µm
Show index
When “Show index” is ticked, the XY index of the
individual acquisition positions for the map are
superimposed on the video image.
1:1
1:2
1:3
1:4
1:5
1:6
1:7
1:8
1:9
1:10
1:11
1:12
1:13
1:14
1:15
1:16
1:17
1:18
1:19
1:20
1:21
1:22
1:23
1:24
1:25
1:26
1:27
1:28
1:29
1:30
1:31
1:32
1:33
1:34
1:35
1:36
1:37
1:38
1:39
1:40
1:41
1:42
1:43
1:44
1:45
1:46
1:47
1:48
1:49
1:50
1:51
1:52
1:53
2:1
2:2
2:3
2:4
2:5
2:6
2:7
2:8
2:9
2:10
2:11
2:12
2:13
2:14
2:15
2:16
2:17
2:18
2:19
2:20
2:21
2:22
2:23
2:24
2:25
2:26
2:27
2:28
2:29
2:30
2:31
2:32
2:33
2:34
2:35
2:36
2:37
2:38
2:39
2:40
2:41
2:42
2:43
2:44
2:45
2:46
2:47
2:48
2:49
2:50
2:51
2:52
2:53
3:1
3:2
3:3
3:4
3:5
3:6
3:7
3:8
3:9
3:10
3:11
3:12
3:13
3:14
3:15
3:16
3:17
3:18
3:19
3:20
3:21
3:22
3:23
3:24
3:25
3:26
3:27
3:28
3:29
3:30
3:31
3:32
3:33
3:34
3:35
3:36
3:37
3:38
3:39
3:40
3:41
3:42
3:43
3:44
3:45
3:46
3:47
3:48
3:49
3:50
3:51
3:52
3:53
4:1
4:2
4:3
4:4
4:5
4:6
4:7
4:8
4:9
4:10
4:11
4:12
4:13
4:14
4:15
4:16
4:17
4:18
4:19
4:20
4:21
4:22
4:23
4:24
4:25
4:26
4:27
4:28
4:29
4:30
4:31
4:32
4:33
4:34
4:35
4:36
4:37
4:38
4:39
4:40
4:41
4:42
4:43
4:44
4:45
4:46
4:47
4:48
4:49
4:50
4:51
4:52
4:53
5:1
5:2
5:3
5:4
5:5
5:6
5:7
5:8
5:9
5:10
5:11
5:12
5:13
5:14
5:15
5:16
5:17
5:18
5:19
5:20
5:21
5:22
5:23
5:24
5:25
5:26
5:27
5:28
5:29
5:30
5:31
5:32
5:33
5:34
5:35
5:36
5:37
5:38
5:39
5:40
5:41
5:42
5:43
5:44
5:45
5:46
5:47
5:48
5:49
5:50
5:51
5:52
5:53
6:1
6:2
6:3
6:4
6:5
6:6
6:7
6:8
6:9
6:10
6:11
6:12
6:13
6:14
6:15
6:16
6:17
6:18
6:19
6:20
6:21
6:22
6:23
6:24
6:25
6:26
6:27
6:28
6:29
6:30
6:31
6:32
6:33
6:34
6:35
6:36
6:37
6:38
6:39
6:40
6:41
6:42
6:43
6:44
6:45
6:46
6:47
6:48
6:49
6:50
6:51
6:52
6:53
7:1
7:2
7:3
7:4
7:5
7:6
7:7
7:8
7:9
7:10
7:11
7:12
7:13
7:14
7:15
7:16
7:17
7:18
7:19
7:20
7:21
7:22
7:23
7:24
7:25
7:26
7:27
7:28
7:29
7:30
7:31
7:32
7:33
7:34
7:35
7:36
7:37
7:38
7:39
7:40
7:41
7:42
7:43
7:44
7:45
7:46
7:47
7:48
7:49
7:50
7:51
7:52
7:53
8:1
8:2
8:3
8:4
8:5
8:6
8:7
8:8
8:9
8:10
8:11
8:12
8:13
8:14
8:15
8:16
8:17
8:18
8:19
8:20
8:21
8:22
8:23
8:24
8:25
8:26
8:27
8:28
8:29
8:30
8:31
8:32
8:33
8:34
8:35
8:36
8:37
8:38
8:39
8:40
8:41
8:42
8:43
8:44
8:45
8:46
8:47
8:48
8:49
8:50
8:51
8:52
8:53
9:1
9:2
9:3
9:4
9:5
9:6
9:7
9:8
9:9
9:10
9:11
9:12
9:13
9:14
9:15
9:16
9:17
9:18
9:19
9:20
9:21
9:22
9:23
9:24
9:25
9:26
9:27
9:28
9:29
9:30
9:31
9:32
9:33
9:34
9:35
9:36
9:37
9:38
9:39
9:40
9:41
9:42
9:43
9:44
9:45
9:46
9:47
9:48
9:49
9:50
9:51
9:52
9:53
10:1
10:2
10:3
10:4
10:5
10:6
10:7
10:8
10:9
10:10
10:11
10:12
10:13
10:14
10:15
10:16
10:17
10:18
10:19
10:20
10:21
10:22
10:23
10:24
10:25
10:26
10:27
10:28
10:29
10:30
10:31
10:32
10:33
10:34
10:35
10:36
10:37
10:38
10:39
10:40
10:41
10:42
10:43
10:44
10:45
10:46
10:47
10:48
10:49
10:50
10:51
10:52
10:53
11:1
11:2
11:3
11:4
11:5
11:6
11:7
11:8
11:9
11:10
11:11
11:12
11:13
11:14
11:15
11:16
11:17
11:18
11:19
11:20
11:21
11:22
11:23
11:24
11:25
11:26
11:27
11:28
11:29
11:30
11:31
11:32
11:33
11:34
11:35
11:36
11:37
11:38
11:39
11:40
11:41
11:42
11:43
11:44
11:45
11:46
11:47
11:48
11:49
11:50
11:51
11:52
11:53
12:1
12:2
12:3
12:4
12:5
12:6
12:7
12:8
12:9
12:10
12:11
12:12
12:13
12:14
12:15
12:16
12:17
12:18
12:19
12:20
12:21
12:22
12:23
12:24
12:25
12:26
12:27
12:28
12:29
12:30
12:31
12:32
12:33
12:34
12:35
12:36
12:37
12:38
12:39
12:40
12:41
12:42
12:43
12:44
12:45
12:46
12:47
12:48
12:49
12:50
12:51
12:52
12:53
13:1
13:2
13:3
13:4
13:5
13:6
13:7
13:8
13:9
13:10
13:11
13:12
13:13
13:14
13:15
13:16
13:17
13:18
13:19
13:20
13:21
13:22
13:23
13:24
13:25
13:26
13:27
13:28
13:29
13:30
13:31
13:32
13:33
13:34
13:35
13:36
13:37
13:38
13:39
13:40
13:41
13:42
13:43
13:44
13:45
13:46
13:47
13:48
13:49
13:50
13:51
13:52
13:53
14:1
14:2
14:3
14:4
14:5
14:6
14:7
14:8
14:9
14:10
14:11
14:12
14:13
14:14
14:15
14:16
14:17
14:18
14:19
14:20
14:21
14:22
14:23
14:24
14:25
14:26
14:27
14:28
14:29
14:30
14:31
14:32
14:33
14:34
14:35
14:36
14:37
14:38
14:39
14:40
14:41
14:42
14:43
14:44
14:45
14:46
14:47
14:48
14:49
14:50
14:51
14:52
14:53
15:1
15:2
15:3
15:4
15:5
15:6
15:7
15:8
15:9
15:10
15:11
15:12
15:13
15:14
15:15
15:16
15:17
15:18
15:19
15:20
15:21
15:22
15:23
15:24
15:25
15:26
15:27
15:28
15:29
15:30
15:31
15:32
15:33
15:34
15:35
15:36
15:37
15:38
15:39
15:40
15:41
15:42
15:43
15:44
15:45
15:46
15:47
15:48
15:49
15:50
15:51
15:52
15:53
16:1
16:2
16:3
16:4
16:5
16:6
16:7
16:8
16:9
16:10
16:11
16:12
16:13
16:14
16:15
16:16
16:17
16:18
16:19
16:20
16:21
16:22
16:23
16:24
16:25
16:26
16:27
16:28
16:29
16:30
16:31
16:32
16:33
16:34
16:35
16:36
16:37
16:38
16:39
16:40
16:41
16:42
16:43
16:44
16:45
16:46
16:47
16:48
16:49
16:50
16:51
16:52
16:53
17:1
17:2
17:3
17:4
17:5
17:6
17:7
17:8
17:9
17:10
17:11
17:12
17:13
17:14
17:15
17:16
17:17
17:18
17:19
17:20
17:21
17:22
17:23
17:24
17:25
17:26
17:27
17:28
17:29
17:30
17:31
17:32
17:33
17:34
17:35
17:36
17:37
17:38
17:39
17:40
17:41
17:42
17:43
17:44
17:45
17:46
17:47
17:48
17:49
17:50
17:51
17:52
17:53
18:1
18:2
18:3
18:4
18:5
18:6
18:7
18:8
18:9
18:10
18:11
18:12
18:13
18:14
18:15
18:16
18:17
18:18
18:19
18:20
18:21
18:22
18:23
18:24
18:25
18:26
18:27
18:28
18:29
18:30
18:31
18:32
18:33
18:34
18:35
18:36
18:37
18:38
18:39
18:40
18:41
18:42
18:43
18:44
18:45
18:46
18:47
18:48
18:49
18:50
18:51
18:52
18:53
19:1
19:2
19:3
19:4
19:5
19:6
19:7
19:8
19:9
19:10
19:11
19:12
19:13
19:14
19:15
19:16
19:17
19:18
19:19
19:20
19:21
19:22
19:23
19:24
19:25
19:26
19:27
19:28
19:29
19:30
19:31
19:32
19:33
19:34
19:35
19:36
19:37
19:38
19:39
19:40
19:41
19:42
19:43
19:44
19:45
19:46
19:47
19:48
19:49
19:50
19:51
19:52
19:53
20:1
20:2
20:3
20:4
20:5
20:6
20:7
20:8
20:9
20:10
20:11
20:12
20:13
20:14
20:15
20:16
20:17
20:18
20:19
20:20
20:21
20:22
20:23
20:24
20:25
20:26
20:27
20:28
20:29
20:30
20:31
20:32
20:33
20:34
20:35
20:36
20:37
20:38
20:39
20:40
20:41
20:42
20:43
20:44
20:45
20:46
20:47
20:48
20:49
20:50
20:51
20:52
20:53
21:1
21:2
21:3
21:4
21:5
21:6
21:7
21:8
21:9
21:10
21:11
21:12
21:13
21:14
21:15
21:16
21:17
21:18
21:19
21:20
21:21
21:22
21:23
21:24
21:25
21:26
21:27
21:28
21:29
21:30
21:31
21:32
21:33
21:34
21:35
21:36
21:37
21:38
21:39
21:40
21:41
21:42
21:43
21:44
21:45
21:46
21:47
21:48
21:49
21:50
21:51
21:52
21:53
22:1
22:2
22:3
22:4
22:5
22:6
22:7
22:8
22:9
22:10
22:11
22:12
22:13
22:14
22:15
22:16
22:17
22:18
22:19
22:20
22:21
22:22
22:23
22:24
22:25
22:26
22:27
22:28
22:29
22:30
22:31
22:32
22:33
22:34
22:35
22:36
22:37
22:38
22:39
22:40
22:41
22:42
22:43
22:44
22:45
22:46
22:47
22:48
22:49
22:50
22:51
22:52
22:53
23:1
23:2
23:3
23:4
23:5
23:6
23:7
23:8
23:9
23:10
23:11
23:12
23:13
23:14
23:15
23:16
23:17
23:18
23:19
23:20
23:21
23:22
23:23
23:24
23:25
23:26
23:27
23:28
23:29
23:30
23:31
23:32
23:33
23:34
23:35
23:36
23:37
23:38
23:39
23:40
23:41
23:42
23:43
23:44
23:45
23:46
23:47
23:48
23:49
23:50
23:51
23:52
23:53
24:1
24:2
24:3
24:4
24:5
24:6
24:7
24:8
24:9
24:10
24:11
24:12
24:13
24:14
24:15
24:16
24:17
24:18
24:19
24:20
24:21
24:22
24:23
24:24
24:25
24:26
24:27
24:28
24:29
24:30
24:31
24:32
24:33
24:34
24:35
24:36
24:37
24:38
24:39
24:40
24:41
24:42
24:43
24:44
24:45
24:46
24:47
24:48
24:49
24:50
24:51
24:52
24:53
25:1
25:2
25:3
25:4
25:5
25:6
25:7
25:8
25:9
25:10
25:11
25:12
25:13
25:14
25:15
25:16
25:17
25:18
25:19
25:20
25:21
25:22
25:23
25:24
25:25
25:26
25:27
25:28
25:29
25:30
25:31
25:32
25:33
25:34
25:35
25:36
25:37
25:38
25:39
25:40
25:41
25:42
25:43
25:44
25:45
25:46
25:47
25:48
25:49
25:50
25:51
25:52
25:53
26:1
26:2
26:3
26:4
26:5
26:6
26:7
26:8
26:9
26:10
26:11
26:12
26:13
26:14
26:15
26:16
26:17
26:18
26:19
26:20
26:21
26:22
26:23
26:24
26:25
26:26
26:27
26:28
26:29
26:30
26:31
26:32
26:33
26:34
26:35
26:36
26:37
26:38
26:39
26:40
26:41
26:42
26:43
26:44
26:45
26:46
26:47
26:48
26:49
26:50
26:51
26:52
26:53
27:1
27:2
27:3
27:4
27:5
27:6
27:7
27:8
27:9
27:10
27:11
27:12
27:13
27:14
27:15
27:16
27:17
27:18
27:19
27:20
27:21
27:22
27:23
27:24
27:25
27:26
27:27
27:28
27:29
27:30
27:31
27:32
27:33
27:34
27:35
27:36
27:37
27:38
27:39
27:40
27:41
27:42
27:43
27:44
27:45
27:46
27:47
27:48
27:49
27:50
27:51
27:52
27:53
28:1
28:2
28:3
28:4
28:5
28:6
28:7
28:8
28:9
28:10
28:11
28:12
28:13
28:14
28:15
28:16
28:17
28:18
28:19
28:20
28:21
28:22
28:23
28:24
28:25
28:26
28:27
28:28
28:29
28:30
28:31
28:32
28:33
28:34
28:35
28:36
28:37
28:38
28:39
28:40
28:41
28:42
28:43
28:44
28:45
28:46
28:47
28:48
28:49
28:50
28:51
28:52
28:53
29:1
29:2
29:3
29:4
29:5
29:6
29:7
29:8
29:9
29:10
29:11
29:12
29:13
29:14
29:15
29:16
29:17
29:18
29:19
29:20
29:21
29:22
29:23
29:24
29:25
29:26
29:27
29:28
29:29
29:30
29:31
29:32
29:33
29:34
29:35
29:36
29:37
29:38
29:39
29:40
29:41
29:42
29:43
29:44
29:45
29:46
29:47
29:48
29:49
29:50
29:51
29:52
29:53
30:1
30:2
30:3
30:4
30:5
30:6
30:7
30:8
30:9
30:10
30:11
30:12
30:13
30:14
30:15
30:16
30:17
30:18
30:19
30:20
30:21
30:22
30:23
30:24
30:25
30:26
30:27
30:28
30:29
30:30
30:31
30:32
30:33
30:34
30:35
30:36
30:37
30:38
30:39
30:40
30:41
30:42
30:43
30:44
30:45
30:46
30:47
30:48
30:49
30:50
30:51
30:52
30:53
31:1
31:2
31:3
31:4
31:5
31:6
31:7
31:8
31:9
31:10
31:11
31:12
31:13
31:14
31:15
31:16
31:17
31:18
31:19
31:20
31:21
31:22
31:23
31:24
31:25
31:26
31:27
31:28
31:29
31:30
31:31
31:32
31:33
31:34
31:35
31:36
31:37
31:38
31:39
31:40
31:41
31:42
31:43
31:44
31:45
31:46
31:47
31:48
31:49
31:50
31:51
31:52
31:53
32:1
32:2
32:3
32:4
32:5
32:6
32:7
32:8
32:9
32:10
32:11
32:12
32:13
32:14
32:15
32:16
32:17
32:18
32:19
32:20
32:21
32:22
32:23
32:24
32:25
32:26
32:27
32:28
32:29
32:30
32:31
32:32
32:33
32:34
32:35
32:36
32:37
32:38
32:39
32:40
32:41
32:42
32:43
32:44
32:45
32:46
32:47
32:48
32:49
32:50
32:51
32:52
32:53
33:1
33:2
33:3
33:4
33:5
33:6
33:7
33:8
33:9
33:10
33:11
33:12
33:13
33:14
33:15
33:16
33:17
33:18
33:19
33:20
33:21
33:22
33:23
33:24
33:25
33:26
33:27
33:28
33:29
33:30
33:31
33:32
33:33
33:34
33:35
33:36
33:37
33:38
33:39
33:40
33:41
33:42
33:43
33:44
33:45
33:46
33:47
33:48
33:49
33:50
33:51
33:52
33:53
34:1
34:2
34:3
34:4
34:5
34:6
34:7
34:8
34:9
34:10
34:11
34:12
34:13
34:14
34:15
34:16
34:17
34:18
34:19
34:20
34:21
34:22
34:23
34:24
34:25
34:26
34:27
34:28
34:29
34:30
34:31
34:32
34:33
34:34
34:35
34:36
34:37
34:38
34:39
34:40
34:41
34:42
34:43
34:44
34:45
34:46
34:47
34:48
34:49
34:50
34:51
34:52
34:53
35:1
35:2
35:3
35:4
35:5
35:6
35:7
35:8
35:9
35:10
35:11
35:12
35:13
35:14
35:15
35:16
35:17
35:18
35:19
35:20
35:21
35:22
35:23
35:24
35:25
35:26
35:27
35:28
35:29
35:30
35:31
35:32
35:33
35:34
35:35
35:36
35:37
35:38
35:39
35:40
35:41
35:42
35:43
35:44
35:45
35:46
35:47
35:48
35:49
35:50
35:51
35:52
35:53
36:1
36:2
36:3
36:4
36:5
36:6
36:7
36:8
36:9
36:10
36:11
36:12
36:13
36:14
36:15
36:16
36:17
36:18
36:19
36:20
36:21
36:22
36:23
36:24
36:25
36:26
36:27
36:28
36:29
36:30
36:31
36:32
36:33
36:34
36:35
36:36
36:37
36:38
36:39
36:40
36:41
36:42
36:43
36:44
36:45
36:46
36:47
36:48
36:49
36:50
36:51
36:52
36:53
37:1
37:2
37:3
37:4
37:5
37:6
37:7
37:8
37:9
37:10
37:11
37:12
37:13
37:14
37:15
37:16
37:17
37:18
37:19
37:20
37:21
37:22
37:23
37:24
37:25
37:26
37:27
37:28
37:29
37:30
37:31
37:32
37:33
37:34
37:35
37:36
37:37
37:38
37:39
37:40
37:41
37:42
37:43
37:44
37:45
37:46
37:47
37:48
37:49
37:50
37:51
37:52
37:53
38:1
38:2
38:3
38:4
38:5
38:6
38:7
38:8
38:9
38:10
38:11
38:12
38:13
38:14
38:15
38:16
38:17
38:18
38:19
38:20
38:21
38:22
38:23
38:24
38:25
38:26
38:27
38:28
38:29
38:30
38:31
38:32
38:33
38:34
38:35
38:36
38:37
38:38
38:39
38:40
38:41
38:42
38:43
38:44
38:45
38:46
38:47
38:48
38:49
38:50
38:51
38:52
38:53
39:1
39:2
39:3
39:4
39:5
39:6
39:7
39:8
39:9
39:10
39:11
39:12
39:13
39:14
39:15
39:16
39:17
39:18
39:19
39:20
39:21
39:22
39:23
39:24
39:25
39:26
39:27
39:28
39:29
39:30
39:31
39:32
39:33
39:34
39:35
39:36
39:37
39:38
39:39
39:40
39:41
39:42
39:43
39:44
39:45
39:46
39:47
39:48
39:49
39:50
39:51
39:52
39:53
40:1
40:2
40:3
40:4
40:5
40:6
40:7
40:8
40:9
40:10
40:11
40:12
40:13
40:14
40:15
40:16
40:17
40:18
40:19
40:20
40:21
40:22
40:23
40:24
40:25
40:26
40:27
40:28
40:29
40:30
40:31
40:32
40:33
40:34
40:35
40:36
40:37
40:38
40:39
40:40
40:41
40:42
40:43
40:44
40:45
40:46
40:47
40:48
40:49
40:50
40:51
40:52
40:53
41:1
41:2
41:3
41:4
41:5
41:6
41:7
41:8
41:9
41:10
41:11
41:12
41:13
41:14
41:15
41:16
41:17
41:18
41:19
41:20
41:21
41:22
41:23
41:24
41:25
41:26
41:27
41:28
41:29
41:30
41:31
41:32
41:33
41:34
41:35
41:36
41:37
41:38
41:39
41:40
41:41
41:42
41:43
41:44
41:45
41:46
41:47
41:48
41:49
41:50
41:51
41:52
41:53
1 µm
1:1
1:2
1:3
1:4
2:1
2:2
2:3
2:4
3:1
3:2
3:3
3:4
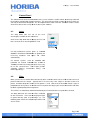
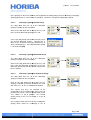
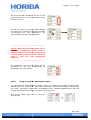
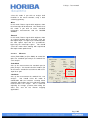
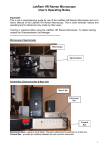
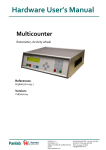
Overlay images
When “Overlay images” is ticked the Map or Score
image is superimposed on the video image. Note
that the overlay mode in the Map/Score window
will be reflected in the superimposition.
1 µm
Page | 223
LabSpec 5 user manual
The superimposed image will always be displayed
in True Color, whatever the palette setting in the
Colors dialog window – see section 8.6, page 210.
Font
Select the font style for the data index and data
name text display from the “Font” drop down box.
Note that the font color is automatically assigned
by LabSpec 5 to match the color of the object
being superimposed.
Available for:
8.18.
Video
Image3D
The Image3D dialog window allows control of formatting and display options for 3D images. It should
be used in conjunction with the Colors dialog window (see section 8.6, page 210).
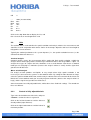
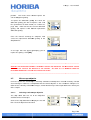
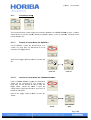
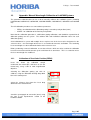
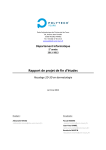
Type
Select the display mode from the following options:
Line
The line color is selected from the “Line”
drop down box.
Intensity (a.u.)
o
5
-100
0
X(
µm
)
100 100
0
)
µm
Y(
Page | 224
LabSpec 5 user manual
o
Line and Fill
When there is no “Gradation” selected
(i.e., X, Y and Z gradation boxes are all
unticked) the fill color is selected from the
“Fill” drop down box.
The example
shown right is displayed without
gradation.
Intensity (a.u.)
The line color is selected from the “Line”
drop down box. The line display can be
removed by setting the line color to
“None”.
5
-100
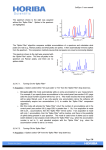
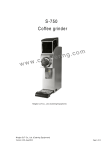
When “Gradation” is selected (i.e., one or
more of the X, Y and Z gradation boxes
are ticked) the graded fill color is set
according to the palette selected in the
Colors dialog window (see section 8.6,
page 210). The example shown right is
displayed with Z gradation using a
greyscale palette.
Intensity (a.u.)
X(
0
µm
)
100 100
0
)
µm
Y(
5
-100
0
X(
µm
)
100 100
0
)
µm
Y(
Gradation
Select the axis (or axes) direction for graded fill color:
X – graded fill from low X axis value to
high X axis value.
Intensity (a.u.)
o
5
-100
X(
0
µm
)
100 100
0
)
µm
Y(
Page | 225
LabSpec 5 user manual
Y – graded fill from low Y axis value to
high Y axis value.
Intensity (a.u.)
o
5
-100
X(
100 100
0
)
µm
Y(
Z – graded fill from low Z (intensity) axis
to high Z (intensity) axis.
Intensity (a.u.)
o
0
µm
)
5
-100
X(
0
µm
)
100 100
0
)
µm
Y(
Color
Select the line color from the “Color” drop down box.
Note that the Line and Width options in this drop down box are not active for 3D images.
Fill
Select the fill color from the “Fill” drop down box. The fill color selected in the “Fill” drop down box is
only displayed when the “Line and Fill” type is selected, and no gradation option is selected (see
above). If a gradation option is selected, the fill color is set according to the palette selected in the
Colors dialog window (see section 8.6, page 210).
Note that the Fill option in this drop down box is not active for 3D images.
Available for:
Video, SpIm, Map, Score (when displayed in 3D mode)
Page | 226
LabSpec 5 user manual
9.
Control Panel
The Control Panel located at the bottom of the screen contains sections which are directly related to
the hardware configuration of the instrument. This panel will only show sections for devices which are
correctly installed and configured. The description below shows all of the standard sections, but be
aware that some of these may not be visible in your software.
9.1.
Laser
The drop down box lists all of the laser
wavelengths available on the instrument.
Click on the drop down box to display the list, and
then select the laser wavelength to be used.
On fully automated systems (such as LabRAM
ARAMIS, automated LabRAM HR, or XploRA) the
necessary hardware and optics will switch
automatically.
On manual systems (such as LabRAM 300,
LabRAM 1B, manual LabRAM HR, U1000 or
T64000) remember to change the optics necessary
to use the selected laser. These optics include
switching mirror(s), interference filter(s) and
notch/edge filter(s).
9.2.
Filter
Most systems have a number of neutral density filters available which can be used to reduce the laser
power incident on the sample. Typically these are necessary if the sample is sensitive to the laser
power, and burns/degrades when the full power is used. Note that the detected Raman signal is
proportional to laser power, so the lower the laser power the longer your measurement will need to be
to obtain a good quality Raman spectrum.
These filters are motorized, and will automatically be inserted into the laser path once selected.
The drop down box lists all of the filters available
on the instrument. These will be displayed either
in optical density (OD) or percentage (%). The
following table shows the relationship between OD
and % values.
Page | 227
LabSpec 5 user manual
OD
%
--D0.3
D0.6
D1
D2
D3
D4
100% (no attenuation)
50%
25%
10%
1%
0.1%
0.01%
Click on the drop down box to display the list, and
then select the laser wavelength to be used.
9.3.
Hole
The confocal hole is used to define the spatial resolution and analysis volume of a measurement, and
should be used in conjunction with correct choice of microscope objective and laser wavelength to
fully optimise a measurement.
Typically the confocal performance of a system improves (i.e., the spatial resolution increases) as the
confocal hole diameter decreases.
Confocal analysis
Confocal analysis means the measurement will be made with high spatial resolution, suitable for
analysis of true microscopic particles and thin layers with dimensions in the range 500nm – 10µm. To
analyze these types of samples the hole should be set to a small diameter. Note that in a confocal
mode you are analysing less molecules (because the analysis volume is small), and the signal level
you observe will decrease.
Macro or bulk analysis
For analysis of bulk powders and liquids, or any sample where high spatial resolution is not
necessary, it is best to run the system in a non-confocal mode. By setting the hole diameter to a large
value the spatial resolution will be low, and the analysis volume of the measurement will be increased.
Note that in a non-confocal mode you are analysing more molecules (because the analysis volume is
large), and the signal level you observe will increase.
Some instruments have fully adjustable holes, whilst others have fixed hole settings. The controls on
these are different.
9.3.1.
Control of fully adjustable hole
Type in the desired diameter of the hole, and press
<enter > so that the value is registered.
Click on the left hand arrow to send the hole to a
closed position (0 µm diameter).
Click on the right hand arrow to send the hole to its
maximum position.
Page | 228
LabSpec 5 user manual
Click on the initialization icon to send the hole to its
reference position, and then back to the displayed
diameter.
9.3.2.
Control of fixed position hole
The drop down box lists all of the hole diameters
available on the instrument.
Click on the drop down box to display the list, and
then select the hole diameter to be used.
Click on the initialization icon to send the hole to its
reference position, and then back to the displayed
diameter.
9.4.
Slit
The slit is used to define spectral resolution, and should be used in conjunction with correct choice of
laser wavelength and diffraction grating. On most systems equipped with array detectors (such as a
CCD or InGaAs array) the diffraction grating (see section 9.6.1, page 231) has a more significant
effect on spectral resolution than the slit. The slit should only be adjusted once a suitable diffraction
grating has been selected.
Typically the spectral resolution of a system will increase as the slit width is decreased. High spectral
resolution (obtained with a narrow slit width) allows subtle changes in a spectrum to be confidently
analyzed, and close lying peaks to be separated.
Some instruments have fully adjustable slits, whilst others have fixed slit settings. The controls on
these are different.
9.4.1.
Control of fully adjustable slit
Type in the desired diameter of the slit, and press
<enter > so that the value is registered.
Click on the left hand arrow to send the slit to a
closed position (0 µm width).
Click on the right hand arrow to send the slit to its
maximum position.
Page | 229
LabSpec 5 user manual
Click on the initialization icon to send the slit to its
reference position, and then back to the displayed
width.
9.4.2.
Control of fixed position slit
The drop down box lists all of the slit diameters
available on the instrument.
Click on the drop down box to display the list, and
then select the slit diameter to be used.
Click on the initialization icon to send the slit to its
reference position, and then back to the displayed
width.
9.5.
Spectrometer
-1
The spectrometer control allows the wavelength (nm) or wavenumber (Raman shift, cm ) position to
be selected.
With an array detector (such as CCD or InGaAs array) the specified
wavelength/wavenumber position lies at the center of the detector, and a certain range either side of
this position will be detected. The precise range depends upon the spectrometer focal length, laser
wavelength, and diffraction grating.
-1
As an example, if the spectrometer position is set at 1500cm then the lowest position could be
-1
-1
970cm , and the highest position could be 2030cm . The central position in the spectrum will be
-1
1500cm .
The spectrometer position can be quickly controlled, allowing you to monitor Raman peaks in a
specific area of the full spectrum. In most cases,
cases, the detected range will be less than the full Raman
-1
spectrum range, which is typically 100-4000cm . If you wish to acquire a spectrum across the full
Raman range then you should use the Extended Range mode – see section 3.5.6, page 49.
Type in the desired central position of the
spectrometer, and press <enter > so that the
value is registered. The current units will be
displayed next to the input box.
Click on the left hand arrow to send the
spectrometer to the calibration ‘Zero Order’
position (0 nm).
Page | 230
LabSpec 5 user manual
Click on the right hand arrow to send the
spectrometer to its maximum position. Note that
the maximum position will depend upon the
spectrometer, laser and diffraction grating.
Click on the initialization icon to send the
spectrometer to its calibration position, and then
back to the displayed position.
9.6.
Options
The Options section allows you to specify the diffraction grating, microscope objective and data name
tag.
Diffraction grating
Microscope objective
Data name tag
9.6.1.
Diffraction grating
The diffraction grating is the dispersing optical element within the spectrometer, which splits the
spectrum into its constituent colours.
Each grating offers a certain level of dispersion (which affects the spectral resolution of the system)
and wavelength coverage (which affects the spectrum intensity, and compatibility with particular laser
wavelengths). Gratings are typically classified by a number of grooves per mm – for example,
300gr/mm (low resolution) or 3600gr/mm (high resolution). The higher the number the higher the
achievable spectral resolution.
Each system is equipped with different diffraction gratings, which are chosen to take into account the
available laser wavelengths and requirements for spectral resolution.
Most instruments have grating turrets, with multiple gratings attached. This allows you to quickly
switch from one grating to another (for example, to switch from low resolution to high resolution
analysis). The following list shows the standard maximum number of gratings available on the turret:
1 grating (fixed position):
1 grating:
2 gratings (manual switching):
2 gratings (motorized switching):
4 gratings (motorized switching):
HE spectrograph, Axial spectrograph
U1000, T64000
2
LabRAM 300 / 1B (and IR, IR and INV configurations)
2
LabRAM HR (and IR, IR and INV configurations)
2
LabRAM ARAMIS (and IR and IR configurations), XploRA
It is also possible to manually exchange diffraction gratings on the LabRAM HR base unit, U1000 and
T64000. For example, a LabRAM HR could be equipped with three diffraction gratings in total. Two
would be mounted on the motorized turret, and the third would be kept in a box by the system. One
Page | 231
LabSpec 5 user manual
of the gratings on the turret could be exchanged with the third grating if desired. Manually exchanging
grating typically takes a few minutes to complete, and there is no optical realignment required.
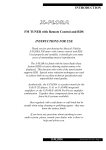
9.6.1.1.
Selecting a grating (manual turret)
The drop down box lists all of the diffraction
gratings available on the instrument.
Click on the drop down box to display the list, and
then select the diffraction grating to be used.
A message will prompt you to now manually select
the desired diffraction grating. Typically this is
done on the instrument using a push-pull bar, or
other switching device. Once the diffraction grating
is selected click [OK].
9.6.1.2.
Selecting a grating (motorized turret)
The drop down box lists all of the diffraction
gratings available on the instrument.
Click on the drop down box to display the list, and
then select the diffraction grating to be used. The
diffraction grating will now be moved into position
by the software.
9.6.1.3.
Selecting a grating for manual exchange
The drop down box lists all of the diffraction
gratings available on the instrument.
Click on the drop down box to display the list.
Gratings available for manual exchange are listed
with either “A->” or “B->” in front of their identifier.
This implies that they are intended to be
exchanged in the A position of the turret, or the B
position of the turret. The first grating listed (in this
case 1800) is in the A position. The second
grating listed (in this case the 600) is in the B
position.
This example shows that there is also a 300gr/mm
grating which could be exchanged in the B
Page | 232
LabSpec 5 user manual
position. This means that it would replace the
current 600gr/mm grating.
To replace the diffraction grating first select the
diffraction grating you wish to replace, and send
the spectrometer to Zero Order (see section 9.5,
page 230). Now take out the current diffraction
grating, and replace it with desired replacement
diffraction grating.
Once the manual exchange is complete, now
select the replacement diffraction grating in the
drop down list.
A message box will appear prompting you to
replace the grating. Click [OK].
_________________________________________________________________________________
CAUTION: THE DIFFRACTION GRATING IS EXTREMELY FRAGILE AND EXPENSIVE. ON NO ACCOUNT SHOULD
YOU TOUCH OR SCRATCH THE SURFACE OF THE GRATING. AS SOON AS IT IS REMOVED FROM THE
INSTRUMENT IMMEDIATELY PLACE IT IN ITS PROTECTIVE CASING.
_________________________________________________________________________________
9.7.
Microscope objective
On most systems the microscope is manually controlled, and objectives must be manually selected
and exchanged. However, it is important that the correct objective is also selected in LabSpec 5 in
order to have correctly scaled video images, and for Raman maps to be acquired over the correct part
of the sample.
9.7.1.1.
Selecting a microscope objective
The drop down box lists all of the objectives
available on the microscope.
Click on the drop down box to display the list and
then select the objective to be used.
Page | 233
LabSpec 5 user manual
A message will prompt you to now select the
desired objective. Once the correct objective is
selected on the microscope click [OK].
9.8.
Data name tag
The data name tag is a prefix which is used for every newly acquired spectrum. In addition, it is used
as the default file name during a File > Save As procedure.
If the data name is unchanged for multiple accumulations each new spectrum will be acquired with
the same prefix, and then sequentially numbered.
In the example shown to the right, the data name
tag has been set as sample_A. Each spectrum will
be acquired as sample_A_1, sample_A_2 etc.
If the data name tag is left blank, as in this
example, then spectra will be automatically
labelled as _1, _2 etc.
9.9.
Acquisition
The Acquisition section allows the user to specify acquisition times (also called exposure times) for
the Real Time Display, Spectrum Acquisition and Mapping Acquisition, and the number of
accumulations (or averages) for each measurement.
Real Time Display (RTD) acquisition time (s)
Acquisition time (s)
Number of accumulations
9.9.1.
Real Time Display (RTD) acquisition time
The Real Time Display (RTD) provides a continuous readout of the detector, and is useful to adjust
the fine focus of the sample to optimise Raman signal, and to monitor whether a sample is degrading
or burning. The RTD is started using the
/
icon – see section 4.5.1, page 95, for more details.
Page | 234
LabSpec 5 user manual
Normally the RTD acquisition time should be kept small in order to allow fast and continuous
spectrum read out. Typical values are in the range 0.2s–2s.
To adjust the RTD acquisition time simply type the
desired time (in seconds) into the box, and press
<enter >.
9.9.2.
Acquisition time
The acquisition time is the time taken to acquire a Raman spectrum. Typically the longer the
acquisition time the better quality the resulting spectrum. The acquisition time set affects the
Spectrum Acquisition (
section 4.5.4, page 96).
/
; see section 4.5.3, page 96) and Mapping Acquisition (
/
; see
Note that for an extended range spectrum acquisition (see section 3.5.6, page 49) the acquisition time
is the time taken for each spectral window within the full spectral range. For multidimensional spectral
array measurements, the acquisition time is the time taken for each spectral window of each spectrum
acquisition in the array.
Minimum acquisition times are in the order of 0.2s-0.5s for standard Raman spectra and mapping
experiments, and <50ms for SWIFT ultra-fast Raman mapping experiments.
There is no maximum value for the acquisition time, since this will depend on the desired spectrum
quality – however, the CCD detector will saturate at and above a particular signal level, so it is
important that the acquisition time is not so large that saturation occurs. The saturation level depends
on the specific detector installed on your system. Modern detectors generally saturate at
approximately 65,000 counts, whereas older detectors may saturate at lower values (such as
approximately 32,000 counts).
To adjust the acquisition time simply type the
desired time (in seconds) into the box, and press
<enter >.
9.9.3.
Number of accumulations
Acquiring multiple accumulations of data and averaging them results in improved spectrum quality.
However, with array detectors such as CCDs and InGaAs arrays it is generally best to improve
spectrum quality by first increasing the acquisition time. When the saturation point is reached, then it
is worth increasing the number of accumulations.
Depending on the chosen mode of the spike (or cosmic ray) filter (see section 3.5.4.7, page 37) it is
recommended to have a minimum of two accumulations so that the spike filter can detect and remove
random spikes in the spectrum.
Page | 235
LabSpec 5 user manual
Data from multiple accumulations will either be averaged, or summed – the desired mode can be
selected from Acquisition > Options (see section 3.5.4.6, page 37).
To adjust the number of accumulations simply type
the desired number into the box, and press
<enter >.
9.10.
XYZ Coords
The XYZ Coords section shows the current position (in micrometers, µm) of installed XY and Z
stages. It can be used for a number of functions:
o
o
o
o
Move the stage by a set distance by inputting a value, rather than using the joystick
Noting a reference position on a sample, and returning to that position as required
Measuring distances moved by the stage
Switching between different stage configurations (for example, motorized XY stage and
DuoScan™).
There are a number of variants of the XYZ Coords section, depending on the system configuration.
The operation of each variant is described below.
9.10.1.
Using XYZ Coords
The current stage position (X, Y and Z coordinates)
are shown in the respective boxes. The units are
micrometers (µm). The tick boxes must be ticked
for coordinate read out to be active for each axis.
Note that if one of the stages is not present (for
example, the Z stage) then it will be greyed out.
Page | 236
LabSpec 5 user manual
The current position coordinates can be set to 0
µm by clicking on the ‘set current position as origin’
icons for each axis.
To move the stage to a specific position highlight
the current value and type in the desired position
(in micrometers, µm). Press <enter >. The
stage will now move to the desired location.
________________________________________
CAUTION: MOVE THE STAGE WITH CAUTION, SINCE IT
IS POSSIBLE TO DAMAGE THE SAMPLE, STAGE OR
MICROSCOPE OBJECTIVE IF THE SAMPLE HEIGHT IS NOT
CHECKED.
STAGE
THERE IS PARTICULAR RISK WHEN THE Z
IS
USED
WITH
HIGH
MAGNIFICATION
OBJECTIVES.
________________________________________
The coordinate read out and control can be
deactivated for each axis independently by
unticking the respective tick box.
9.10.2.
Using XYZ Coords with multiple stages
The main control of XYZ Coords when multiple stages are configured and active is identical to that
outlined above (see section 9.10.1, page 236). Note that the name of the XYZ stage is displayed in
this section – typically the stages will be “XYZ Motorized” for a standard motoriz
motorized stage, and “XYZ
Scanlab” for the DuoScan™ stage (see section 4.5.10, page 110)
Click on the ‘switch stage’ icon, to select the
desired stage.
Page | 237
LabSpec 5 user manual
9.11.
Instrument Setup
The Instrument Setup section is only present for the XploRA™ or LabRAM ARAMIS systems. It allows
control of the laser beam (on/off) and other hardware options (such as polarizors, trinocular head,
macro chamber etc).
9.11.1.
Control of Laser Beam (for XploRA™)
On the XploRA™ system the selected laser (see
section 9.1, page 227) can be turned on or off
using the laser toggle switch.
Click on the toggle switch to turn the laser on and
off.
Laser off
9.11.2.
Laser on
Control of Laser Beam (for LabRAM ARAMIS)
On the LabRAM ARAMIS system the mechanical
shutter for the selected laser (see section 9.1,
page 227) can be opened or closed using the
toggle switch. When the shutter is open the
sample will be exposed to the laser (if the laser is
turned on and active).
Click on the toggle switch to open or close the
shutter.
Laser shutter
closed
Laser shutter
open
Page | 238
LabSpec 5 user manual
9.11.3.
Control of Hardware Options (for XploRA™)
The XploRA Setup window allows control of the following optional items:
o
o
o
o
o
o
Trinocular head on the microscope
Raman polarizors
Laser polarizors
Internal adjustment camera
White lamp illuminator for the internal adjustment camera
Fibre entrance
Please note that depending on the configuration of your system certain items in the Setup window
may be greyed out.
The XploRA Setup window is opened by clicking
on the Setup button.
9.11.3.1.
Microscope
Select {Trino On} or {Trino off} to control the optical
path to the trinocular head.
Trino On
Microscope eye pieces and top camera are active;
Raman path is inactive.
Trino Off
Raman path is active; microscope eye pieces and
top camera are inactive.
Page | 239
LabSpec 5 user manual
9.11.3.2.
Adjustment Camera
Click on [Show] to activate the internal adjustment
camera and to switch the microscope to “Trino Off”
mode.
This camera is useful to visualize the laser spot on
the sample.
White light illumination can be
provided using the “White Lamp” slider bar to
control an internal white LED, or by using the
standard
XploRA™
microscope
illumination
options.
9.11.3.3.
Raman Polarization
Select {Horizontal}, {Vertical} or {Circular} to insert
a polarizor element into the Raman beam path to
control the polarization of the analyzed Raman
signal.
Horizontal
Only Raman signal which is horizontally polarized
will be detected.
Vertical
Only Raman signal which is vertically polarized will
be detected.
Circular
All Raman signal will be converted to circularly
polarized light prior to detection.
Most
spectrometers have different sensitivities for
horizontally and vertically polarized light.
By
converting the signal from horizontal/vertical
polarization to circular polarization the difference in
spectrometer performance will be removed, and all
light will be detected in exactly the same way.
9.11.3.4.
Laser Polarization
Select {Lambda/2}, {Lambda/4} or {None} to insert
a polarizor element into the laser beam path to
adjust the polarization of the laser beam.
Lambda/2 (or λ/2)
o
Rotates the laser beam polarization by 90 .
Page | 240
LabSpec 5 user manual
Lambda/4 (or λ/4)
Converts the laser beam polarization from linearly
polarized to circularly polarized.
None
Leaves the laser beam with its intrinsic linear
polarization.
9.11.3.5.
Fiber Entrance
Select {Fiber On} or {Fiber Off} to select whether
the Raman signal is detected from the microscope,
or from a separate fiber optically coupled remote
Raman probe head, such as a SuperHead.
Fiber On
In this mode, only Raman signal which is delivered
via a fibre optic to the FC connector on the
underside of the XploRA™ platform will be
detected. You should select this mode if you wish
to work with a remote Raman probe.
Fiber Off
In this mode, Raman signal which originates from
the microscope will be detected. You should select
this mode if you wish to make ‘standard’
microscope measurements with the XploRA™.
9.11.3.6.
White Lamp
The White Lamp slider controls the intensity of an
internal white LED to illuminate the sample when it
is visualized using the internal Adjustment Camera.
Page | 241
LabSpec 5 user manual
9.11.3.7.
Init
The [Init] button will re-initialize all of the XploRA
motors, and confirm that they are at their correct
positions.
9.11.4.
Control of Hardware Options (for LabRAM ARAMIS)
The LabRAM ARAMIS Setup window allows control of the following optional items:
o
o
o
o
o
o
Measurement location (microscope, fibre optic probe, macro chamber)
Laser and Raman path polarizors
Trinocular head on the microscope
Multiple detectors
“Point Mode” and “Line Mode” optics
UV/IR and visible dual path optics
Please note that depending on the configuration of your system certain items in the Setup window
may be greyed out.
The LabRAM ARAMIS Setup window is opened by
clicking on the Setup button.
Page | 242
LabSpec 5 user manual
9.11.4.1.
Visualization
Select {Video On} or {Video Off} to control the
internal camera optics.
Video On
Optics for internal camera and reflected white light
illumination are in the light path; Raman path is
inactive. This mode is used to visualize the
sample and acquire white light images of the
sample using the internal camera.
Video Off
Raman path is active; optics for internal camera
and reflected white light illumination are out of the
light path. This mode is used to acquire a Raman
spectrum.
Select {Trino On}, {Trino Off} or {FTIR} in the “Top
Video” section to control the optical path to the
optional trinocular head and FTIR module
Trino On
Microscope eye pieces and top camera are active,
with illumination beam splitter in place; Raman
path, internal camera optics and FTIR module are
inactive.
Trino Off
Raman path and internal camera optics are active;
microscope eye pieces, top camera and FTIR
module are inactive.
FTIR
FTIR module is active; Raman path and internal
camera optics are inactive; microscope eye pieces
and top camera are active for transmitted white
light illumination only, and inactive for reflected
white light illumination.
Page | 243
LabSpec 5 user manual
9.11.4.2.
Polarization
Select the required polarizor element to control the
polarization of the laser beam and the analysed
Raman signal.
Laser - Vertical
Allows the laser beam to be linearly polarized in a
vertical orientation.
Laser - Horizontal
Allows the laser beam to be linearly polarized in a
horizontal orientation.
Laser - Circular
Converts the laser beam polarization from linearly
polarized to circularly polarized.
Raman - Vertical
Only Raman signal which is linearly polarized in a
vertical orientation will be detected.
Raman - Horizontal
Only Raman signal which is linearly polarized in a
horizontal orientation will be detected.
Raman - Circular
All Raman signal will be converted to circularly
polarized light prior to detection.
Raman – Scrambler
The polarization of the Raman signal will be
scrambled (removed) prior to detection.
9.11.4.3.
Measure Location
Select the required measurement location on the
system, including the microscope, macro chamber
and external fibre optically coupled probes.
Macro 90
In this mode, Raman signal which originates from
o
the macro chamber in a 90 orientation will be
detected. You should select this mode if you wish
to analyse bulk materials in the macro chamber
o
using a 90 orientation.
Retro
In this mode, Raman signal which originates from
o
the macro chamber in a 180 back scattering
(retro) orientation will be detected. You should
Page | 244
LabSpec 5 user manual
select this mode if you wish to analyse bulk
materials in the macro chamber, using a back
scattering geometry.
Micro
In this mode, Raman signal which originates from
the microscope will be detected. You should select
this mode if you wish to make ‘standard’
microscope measurements with the LabRAM
ARAMIS.
External
In this mode, Raman signal which originates from
an external location will be detected, using the
fiber optical input. The light is passed directly from
the fiber optical input into the spectrometer,
bypassing the microscope optics. You should
select this mode when working with SuperHead
fiber optic remote probe heads
9.11.4.4.
Measure
Select {Point Mode} or {Line Mode} to control the
optics for standard spot analysis or confocal line
scan analysis.
Point Mode
Sets up the measurement for standard spot (or
point) analysis. You should select this mode if you
wish to make ‘standard’ measurements with a 0.510µm laser spot.
Line Mode
Sets up the measurement for confocal line scan
analysis.
You should select this mode in
combination with the LineScan scanning mirror
controller, which allows the laser spot to be rapidly
rastored across the sample. This is useful for
acquiring an average spectrum from along the
entire line, and for fast Raman mapping
applications.
Page | 245
LabSpec 5 user manual
9.11.4.5.
Detection
Select {CCD} or {PMT/IGA} to control the optics for
multiple detectors mounted on the LabRAM
ARAMIS.
CCD
In this mode the standard CCD detector will be
used for the analysis.
PMT/IGA
In this mode the detector mounted on the second
port will be used for the analysis. Typically this
detector will either be a photomultiplier tube (PMT),
InGaAs array (IGA) or a second specialized CCD.
9.11.4.6.
UV / Visible
Select {UV / IR} or {Visible} to control the dual path
optics in the LabRAM ARAMIS, which allow
optimised detection in either the UV/IR or visible
spectral regions.
UV / IR
In this mode, mirrored optics are used which are
optimised for UV and/or infra-red (IR) analysis.
Visible
In this mode achromatic lense optics are used
which are optimised for standard visible analysis.
Page | 246
LabSpec 5 user manual
10.
Appendix: Manual Wavelength Calibration of LabRAM Systems
The procedure outlined below can be used to manually calibrate the LabRAM systems (including
LabRAM 300, LabRAM 1B, LabRAM HR, LabRAM ARAMIS, LabRAM INV, LabRAM IR and LabRAM
2
IR ).
The full calibration procedure uses two software parameters
o
o
ZERO: for calibration of the diffraction grating’s zero order peak position (0 nm)
KOEFF: for calibration of the Raman peak position
Note that this calibration procedure is a diffraction grating calibration, and should be repeated for all
diffraction gratings on the system. The software will retain individual calibration values for each
diffraction grating.
A full calibration of a system with multiple lasers requires one of the lasers to be designated as the
‘reference laser’ – the wavelength of this laser is assumed to be constant, and known. The remaining
laser wavelengths are then calibrated relative to the reference laser.
Before performing a manual calibration, ensure that all lasers which are to be used for the calibration
have been turned on and left to warm up for a minimum of 15-30 minutes. This is essential to ensure
the laser wavelength has stabilised.
10.1.
Calibration of Zero Order Position (ZERO)
Insert the silicon (Si) calibration sample
underneath the microscope, and focus on it in the
normal way, using a 50x or 100x magnification
objective.
Selecting the diffraction grating you wish to
calibrate, using the Diffraction Grating drop down
box in the control panel.
Select the reference laser from the Laser drop
down box in the Control Panel.
Send the spectrograph to zero order (0 nm) using
the icon in the Spectrometer section of the
hardware toolbar.
Page | 247
LabSpec 5 user manual
Turn on the reference laser, and acquire a
spectrum at zero order (0 nm) using the real time
display (RTD) function. Ensure the detector is not
saturated - if the signal is too intense, insert a filter
in the laser path, reduce the confocal hole
diameter, or decrease the acquisition time.
Stop the spectrum readout by clicking [STOP].
Zoom in on the peak, using the Zoom icon in the
Graphical Manipulation toolbar.
Use the cursor to locate the center of the zero
order peak.
If the peak is within ±1 data point of 0 nm, the
calibration is acceptable. If the peak is at a
position greater than ±1 data point from 0 nm the
calibration must be adjusted.
To do this click on Setup > Instrument Calibration
to open the Calibration dialog window.
Adjust the ZERO parameter and then click the
[Apply]. You should see the peak move. Continue
to adjust the ZERO value until the band is within ±1
data point of 0 nm.
Click [OK] to save the calibration values for the
current grating and close the Calibration dialog
window.
Resend the spectrograph to zero order and retake
the spectrum. This will make sure that your
calibration changes have taken effect. Check the
zero order position again and if necessary, make
further adjustments (change ZERO, resend to
zero, check position etc) until the position is
acceptable.
NOTE: The ZERO parameter should be changed
in small increments e.g. ±5 at a time.
Page | 248
LabSpec 5 user manual
10.2.
Calibration of Raman Peak (KOEFF)
-1
Move the spectrometer to 520.7 cm to analyse
the silicon (Si) first order Raman peak.
520.7
Acquire a spectrum of the silicon (Si) sample using
the real time display (RTD) function. Ensure the
detector is not saturated - if the signal is too
intense, insert a filter in the laser path, reduce the
confocal hole diameter, or decrease the acquisition
time.
Stop the spectrum readout by clicking [STOP].
Zoom in on the peak, using the Zoom icon in the
Graphical Manipulation toolbar.
Use the cursor to locate the center of the
-1
520.7 cm silicon (Si) peak.
-1
If the peak is within ±1 data point of 520.7 cm , the
calibration is acceptable. If the peak is at a
-1
position greater than ±1 data point from 520.7 cm
the calibration must be adjusted.
To do this click on Setup > Instrument Calibration
to open the Calibration dialog window.
Adjust the KOEFF parameter and then click
[Apply]. You should see the peak move. Continue
to adjust the KOEFF value until the band is within
-1
±1 data point of 520.7 cm .
Click [OK] to save the calibration values for the
current grating and close the Calibration dialog
window.
Page | 249
LabSpec 5 user manual
10.3.
Calibration of Additional Lasers
The process outlined above is used to calibrate the
diffraction grating, using the reference laser.
Additional lasers must be calibrated using the
following procedure – each laser must be
calibrated individually, using this procedure.
Select the laser to be calibrated from the Laser
drop down box in the Control Panel.
-1
Move the spectrometer to 520.7 cm to analyse
the silicon (Si) first order Raman peak.
520.7
Acquire a spectrum of the silicon (Si) sample using
the real time display (RTD) function. Ensure the
detector is not saturated - if the signal is too
intense, insert a filter in the laser path, reduce the
confocal hole diameter, or decrease the acquisition
time.
Stop the spectrum readout by clicking [STOP].
Zoom in on the peak, using the Zoom icon in the
Graphical Manipulation toolbar.
Use the cursor to locate the center of the
-1
520.7 cm silicon (Si) peak.
-1
If the peak is within ±1 data point of 520.7 cm , the
calibration is acceptable. If the peak is at a
-1
position greater than ±1 data point from 520.7 cm
the calibration must be adjusted.
To do this manually adjust (by left clicking and
typing) the laser wavelength displayed in the Laser
drop down box in the Control Panel and press
<enter >.
Repeat this laser calibration procedure for all other
lasers which are to be calibrated.
Page | 250
LabSpec 5 user manual
INDEX
3
3D image display
Adjust shape and perspective ................................ 193
Format and display options ................................... 224
Select 3D display format ........................................ 206
A
Absolute
Positioning for multidimensional spectral arrays..... 98
Acquisition
Multidimensional spectral array
Acquisition time per point................................. 235
Number of accumulations per point ................. 235
Start acquisition .................................................. 96
Spectrum
Acquisition time ................................................ 235
Number of accumulations ................................. 235
Real time display (RTD) See Real time display (RTD)
Start acquisition .................................................. 96
Video
Start acquisition ................................................ 102
Start extended video image acquisition ............ 104
Acquisition menu .......................................................... 30
Autofocus ................................................................. 59
Custom info .............................................................. 30
Detector ................................................................... 57
Extended range ........................................................ 49
Extra images ............................................................. 63
Heat detector ........................................................... 66
Options .................................................................... 34
RTD........................................................................... 33
Trigger ...................................................................... 32
Acquisition parameters
Accumulation mode ................................................. 37
Acquire spectrum with pixel units for X axis ............ 73
Acquisition time ..................................................... 235
Auto exposure ................................ See Auto exposure
Auto save ............................................... See Auto save
Autofocus .............................................. See Autofocus
Denoise .................................................................... 46
Intensity correction ................ See Intensity correction
Mapping ............. See Multidimensional spectral array
Multidimensional spectral array See Multidimensional
spectral array
Number of accumulations...................................... 235
Photo-bleaching time .......... See Photo-bleaching time
Scanning device ........................................................ 40
Shutter mode ........................................................... 43
Signal mode .............................................................. 41
Spectral range .............................. See Extended range
Spike Filter............................................ See Spike filter
Templates.......................................... See LabAssistant
Add spectra ........................................................ See Math
Adjust intensity ................................. See Extended range
Alignment
Use internal alignment diode ................................... 74
ARAMIS ........................................... See LabRAM ARAMIS
Aspect ratio ................................................................. 207
Auto exposure
Configure .................................................................. 65
Turn off .................................................................... 42
Turn on ..................................................................... 42
Auto save ...................................................................... 47
Turn off .................................................................... 49
Turn on ..................................................................... 49
Auto scanning ................................... See Extended range
Autofocus
Configure .................................................................. 60
Set a focus offset ...................................................... 40
Set when Autofocus is applied ................................. 39
Status bar indicator ................................................ 199
The Autofocus procedure......................................... 60
Turn off .................................................................... 40
Turn on ..................................................................... 40
Axes
Format........................................................ See Format
B
Background subtraction ...............See Baseline correction
Baseline correction ..................................................... 115
Add baseline points manually ................................ 180
Attach baseline points to data ............................... 118
Automatically subtract baseline ............................. 116
Convert baseline to spectrum ................................ 116
Fit baseline ............................................................. 116
Options ................................................................... 117
Remove baseline points manually ......................... 181
Setting a baseline
For a multidimensional spectral array ............... 120
For a single spectrum ........................................ 118
Subtract baseline.................................................... 116
Baseline points
Adjust baseline points manually .............. See Baseline
correction
Page | 251
LabSpec 5 user manual
Batch processing ................................................ See Multi
Big icon ......................................................... See Icon bar
Binning factor
Detector image real time display (RTD) ................... 33
Spectrum acquisition ............................................... 36
C
Calibration
Instrument motors ................................................... 74
Internal alignment diode ......................................... 74
Manual procedure for LabRAM systems ................ 247
Video images .................................... See Video images
Camera
CCD camera for spectrum acquisition ..... See Detector
Video camera for optical visualisation ......... See Video
images
Close data ..................................................................... 11
Combine data
Combine individual spectral windows ... See Extended
range
Confocal pinhole ......................................................... 228
Context help ................................................................. 91
Control panel .............................................................. 227
Acquisition ............................................................. 234
Data name tag ........................................................ 234
Filter ....................................................................... 227
Hole ........................................................................ 228
Instrument setup ................................................... 238
Laser ....................................................................... 227
Microscope objective ............................................. 233
Options .................................................................. 231
Slit .......................................................................... 229
Spectrometer ......................................................... 230
XYZ coords.............................................................. 236
Copy and paste formatting ........................................... 18
Copy data ...................................................................... 18
Cursors
Display values/positions ........................................ 201
Format ................................................................... 218
Integral cursor ........................................................ 177
Multidimensional spectral array analysis cursors
Blue cursor
Activate ........................................................ 165
Format .......................................................... 220
Configure ........................................................... 147
Green cursor
Activate ........................................................ 165
Format .......................................................... 220
Red cursor
Activate ........................................................ 165
Format .......................................................... 220
Return to center of current window ........................ 92
Spectrum cursor ..................................................... 164
Custom info ................................................................... 30
Adding information .................................................. 31
Adding new information categories ......................... 31
Deleting information categories .............................. 32
Cut data......................................................................... 18
D
Data
Auto save ...............................................See Auto save
Close ......................................................................... 11
Custom information ........................... See Custom info
Display
Format and scale ............................................... 204
Legend ............................................................... 216
Overlay mode
Quick select single/overlay mode ................. 195
Select mode .................................................. 205
Spectrum format ............................................... 217
Window layout .......................... See Window menu
Extract ...................................................................... 21
File formats .............................................................. 10
Get current range values .......................................... 21
Label axes ................................................................. 21
Manually modify spectrum using pencil tool ......... 167
Mathematical processing .............................. See Math
Name tag in Control Panel ..................................... 234
Normalize ............................................................... 121
Open......................................................................... 11
Peak searching and fitting .......See Peak searching and
fitting
Range and values ..................................................... 20
Icon...................................................................... 92
Redo the last action ................................................. 18
Resize ....................................................................... 21
Restore deleted data ................................................ 18
Save all ..................................................................... 11
Save as ..................................................................... 11
Save picture as ......................................................... 12
Scale .............................................................. See Scale
Selecting data objects
Using data list ...................................................... 19
Using selector radio tags ................................... 198
Split spectral array ................................................... 11
Undo the last action ................................................. 18
Zero ........................................................................ 121
Data bar ...................................................................... 195
Fast graph settings ................................................. 197
Page | 252
LabSpec 5 user manual
Quick select
Single or multiple data view .............................. 195
Selector radio tags ................................................. 198
Data menu .................................................................... 19
Data range................................................................ 20
Database search........................................ See Spectral ID
Denoise ..................................................... See Smoothing
Derivative
First ........................................................................ 126
Second ................................................................... 126
Detector
Accumulation mode ................................................. 37
Binning factor.................................. See Binning factor
Configure ................................................................. 57
Dark subtract ........................................................... 41
Image real time display (RTD)
Configure ............................................................. 33
Shutter mode ........................................................... 43
Signal mode ............................................................. 41
Switching detector ................................................. 201
Temperature
Set temperature .................................................. 59
Status bar indicator ........................................... 200
Warm up to room temperature .......................... 66
Diffraction grating ....................................................... 231
Manual exchange ................................................... 232
Display ................................................................ See Data
DuoScan ...................................................................... 110
Modes of operation
Point .................................................................. 113
Scanning ............................................................ 111
Scanning zone ........................................................ 110
Using ...................................................................... 111
E
Edit menu...................................................................... 17
Copy ......................................................................... 18
Cut............................................................................ 18
Format... .................................................................. 18
Paste ........................................................................ 18
Redo ......................................................................... 18
Restore ..................................................................... 18
Undo ........................................................................ 18
Extended range ............................................................. 49
Adjust baselines of individual windows
After acquistion ................................................. 133
During acquisition ............................................... 55
Adjust intensity ........................................................ 55
Combine data ........................................................... 54
Combine individual windows
After acquisition ................................................ 133
During acquisition ............................................... 54
Icon ........................................................................ 102
Modes of operation ................................................. 50
Status bar indicator ................................................ 200
Sub-pixel................................................................... 52
Turn off .................................................................... 56
Turn on ..................................................................... 56
Extended video ........................................................... 102
Acquire ................................................................... 104
Extra images .................................................................. 63
Acquire an image ..................................................... 64
Acquire an image during a map acquisition ............. 64
What are they for? ................................................... 63
Extract data ................................................................... 21
F
Factor analysis............................................ See Modelling
Fiber entrance
XploRA .................................................................... 241
File formats ................................................................... 10
File menu ...................................................................... 10
Close ......................................................................... 11
Open......................................................................... 11
Page.......................................................................... 13
Print preview ............................................................ 13
Print setup… ............................................................. 13
Print… ....................................................................... 13
Save all ..................................................................... 11
Save as ..................................................................... 11
Save picture as ......................................................... 12
Split .......................................................................... 11
Format
3D image display .................................................... 224
Axes and labels
Fast settings ...................................................... 197
Properties
1D and 2D display ......................................... 213
3D display ..................................................... 215
Copy and paste......................................................... 18
Cursor ........................................................ See Cursors
Display style ........................................................... 204
Scale behaviour ...................................................... 208
Fourier transform...................................... See Smoothing
G
G.O. ................................... See Guided Operation Wizard
Get current data range values ...................................... 21
Page | 253
LabSpec 5 user manual
Graphical manipulation toolbar .................................. 164
Add baseline points................................................ 180
Add constant .......................................................... 170
Add peak ................................................................ 172
Adjust peak ............................................................ 174
Axes........................................................................ 182
Axes3D ................................................................... 193
Circle mapping ....................................................... 189
Correct shape ......................................................... 167
Hor line mapping.................................................... 187
Integral ................................................................... 177
Intensity shift ......................................................... 169
Line mapping.......................................................... 188
Map analysis cursors .............................................. 165
Multiply by constant .............................................. 171
Pointer ................................................................... 164
Points mapping ...................................................... 184
Polygon mapping ................................................... 190
Rectangular mapping ............................................. 187
Remove baseline points ......................................... 181
Remove peak ......................................................... 176
Remove spike ......................................................... 166
Scale shift ............................................................... 169
SpImBlue ................................................................ 165
SpImGreen ............................................................. 165
SpImRed ................................................................. 165
Ver line mapping .................................................... 190
Zoom ...................................................................... 168
Graphical user interface.................................................. 8
Guided Operation Wizard ............................................. 82
H
Help
Context help ............................................................. 91
Online topics ............................................................ 88
Help menu .................................................................... 88
About LabSpec... ...................................................... 88
Help topics ............................................................... 88
Language .................................................................. 88
I
Icon bar ......................................................................... 89
Big icon..................................................................... 89
Cursors and data information icons ......................... 91
Centre cursors ..................................................... 92
Data range ........................................................... 92
Intensity normalization ....................................... 92
Scale normalization ............................................. 91
Data acquisition icons .............................................. 95
DuoScan ............................................................ 110
Extended range acquisition ............................... 102
Extended video .................................................. 102
Mapping acquisition ............................................ 96
Mapping properties ............................................. 97
MultiPoint ......................................................... 104
Spectrum acquisition ........................................... 96
Spectrum RTD (real time display) ........................ 95
Video ................................................................. 102
Data management icons .......................................... 90
Help ..................................................................... 91
Open .................................................................... 90
Print ..................................................................... 91
Save ..................................................................... 91
Data processing and analysis icons ........................ 114
Baseline correction ............................................ 115
Create spectral profile ....................................... 149
Fourier transform .............................................. 127
Map analysis ...................................................... 147
Math .................................................................. 130
Modelling .......................................................... 154
Peak searching and fitting ................................. 134
Profile ................................................................ 145
Smoothing ......................................................... 124
Spectral ID search .............................................. 114
Spectral normalisation and correction .............. 120
Delete data icon ....................................................... 90
Delete .................................................................. 90
Small icon ................................................................. 89
Stop active function icon........................................ 163
Stop active function .......................................... 163
Switch between "Big" and "Small" icons .................. 89
Image
Color palettes ......................................................... 211
Contrast and brightness ......................................... 212
Overlay map/score information on video image ... 222
Scale bar ................................................................. 222
Smoothing ............................................ See Smoothing
Information
Custom information ........................... See Custom info
Parameters ............................................................... 92
Acquisition ........................................................... 94
Custom ................................................................ 94
History ................................................................. 95
Intensity correction ....................................................... 43
Apply correction after acquisition ............................ 45
Automatic correction during acquisition
Turn off................................................................ 45
Turn on ................................................................ 44
How is the correction factor calculated ................... 44
Select a filter ............................................................ 75
Page | 254
LabSpec 5 user manual
Status bar indicator ................................................ 199
Use with manually selected filters ........................... 75
Intensity profile........................................................... 145
L
LabAssistant
Templates ................................................................ 76
Create .................................................................. 78
Custom ................................................................ 77
Default................................................................. 76
Display templates in the Custom list ................... 79
Organising ........................................................... 79
Save ..................................................................... 78
LabAssistant menu
Create template ....................................................... 78
Custom templates .................................................... 77
Default templates .................................................... 76
G.O. (Guided Operation Wizard) .............................. 82
Manage templates ................................................... 79
Label axes ..................................................................... 21
Label peaks ....................... See Peak searching and fitting
LabRAM ARAMIS
Hardware control ................................................... 242
Measurement location ...................................... 244
Measurement mode (point / line)..................... 245
Polarization ....................................................... 244
Select detector .................................................. 246
Select Visible or UV/IR optical path................... 246
Visualization ...................................................... 243
Instrument setup ................................................... 238
Turn on laser .......................................................... 238
Language ....................................................................... 88
Laser
Create macro spot................................... See DuoScan
Polarization ........................................ See Polarization
Power filter ............................................................ 227
Reduce power ........................................................ 227
Scan spot over area ................................. See DuoScan
Selecting laser wavelength..................................... 227
Set laser spot marker position on video image ........ 67
Turning on
LabRAM ARAMIS ............................................... 238
XploRA ............................................................... 238
Layout of LabSpec 5 software ......................................... 8
Legend ........................................................................ 216
LineScan
Activate LineScan for XY mapping ............................ 40
Scale the video image for the scan size ................... 71
Log-in password ........................... See User log-in profiles
M
Map ......................... See Multidimensional spectral array
Math ........................................................................... 130
Drag spectrum with mouse to add constant .......... 170
Drag spectrum with mouse to multiply by constant
.......................................................................... 171
Mathematical manipulation .............................. See Math
Menu bar ...................................................................... 10
Acquisition ............................................................... 30
Data .......................................................................... 19
Edit ........................................................................... 17
File ............................................................................ 10
Help .......................................................................... 88
LabAssistant ............................................................. 76
Options ..................................................................... 22
Scripts....................................................................... 82
Setup ........................................................................ 73
Video ........................................................................ 66
Window .................................................................... 86
Microscope objective .................................................. 233
Modelling
Display
Error map .......................................................... 156
Model sum ........................................................ 156
How to automatically create a model .................... 161
How to manually model data ................................. 157
Using previously saved reference spectra ......... 160
Load current spectrum ........................................... 156
Load multiple spectra ............................................. 156
The "Create" factor analysis procedure ................. 155
Set number of factors........................................ 155
Start ................................................................... 157
The DCLS modelling procedure .............................. 154
Normalized ........................................................ 154
Unnormalized .................................................... 154
Threshold data ....................................................... 155
Montage video images .......................See Extended video
Motorized sample stage
Move by inputting coordinates .............................. 236
Switching stage ...................................................... 237
Viewing coordinate position .................................. 236
Motors
Calibrate ................................................................... 74
Reinitialize ................................................................ 75
Multi (batch processing) ............................................... 23
Multidimensional spectral array
Acquisition
Measurement order ............................................ 99
Changing the order ....................................... 101
Parameters .......................................................... 97
Page | 255
LabSpec 5 user manual
Start acquisition .................................................. 96
Use SWIFT for ultra-fast acquisition .................... 99
Adding a new array dimension .............................. 100
Baseline correction ................................................ 120
Correct spectrum in array ...................................... 148
Cursors for aray analysis ........................... See Cursors
Define position on video image
Circle ................................................................. 189
Line
Diagonal ....................................................... 188
Horizontal ..................................................... 187
Vertical ......................................................... 190
Points ................................................................ 184
Polygon ............................................................. 190
Rectangle........................................................... 187
Deleting an array dimension .................................. 101
Factor analysis....................................... See Modelling
Image properties .......................................... See Image
Mean spectrum
From selected area............................................ 219
From selected points ......................................... 219
Modellling ............................................. See Modelling
Overlay map/score information on video image ... 222
Peak searching and fitting ....... See Peak searching and
fitting
Restore "Point" window if it has been deleted ...... 148
Save all spectra in array as individual files ............... 11
Spectral profile
Add spectrum to profile .................................... 152
Create from individual spectra .......................... 151
Delete spectrum from profile............................ 153
Insert spectrum into profile .............................. 152
Threshold data ....................................................... 122
Multiply spectra ................................................. See Math
Multipoint acquisition
Marking points on video image.............................. 184
Using XYZ coordinate list........................................ 104
Creating a list .................................................... 109
Note about coordinates used ............................ 110
Saving data ........................................................ 107
Multiwindow..................................... See Extended range
N
Neutral density filter ................................................... 227
Normalize.................................................................... 121
Modes .................................................................... 123
O
Objective .................................. See Microscope objective
Open data ..................................................................... 11
Options menu ............................................................... 22
Multi ......................................................................... 23
Pressure unit ............................................................ 23
Profiles... .................................................................. 25
Template .................................................................. 29
Unit .......................................................................... 22
Overlay
Data for display ................................ See Data: Display
Map/score information on video image ................ 222
P
Paste data ..................................................................... 18
Peak area
By cursor ................................................................ 177
By fitting ................................................................. 135
Peak pick ........................... See Peak searching and fitting
Peak searching and fitting ........................................... 134
Add peak to spectrum ............................................ 172
Display options ....................................................... 143
Display peak parameters ........................................ 138
Fitting
Adjust peak position and shape manually ......... 174
Create image of fit parameters (for
multidimensional spectral array) .................. 139
Fit 137
Options .............................................................. 136
Remove peak manually ..................................... 176
Shape function
Define custom shape .................................... 144
Select ............................................................ 135
Variables
Add variables ................................................ 141
Configure ...................................................... 140
Delete variables ............................................ 142
Searching
Adjust peak position manually .......................... 174
Label peak manually .......................................... 172
Options .............................................................. 135
Remove peak manually ..................................... 176
Search ................................................................ 136
Pen tool ....................................................................... 167
Pencil tool ................................................................... 167
Photo-bleaching time .................................................... 35
Status bar indicator ................................................ 199
Turn off .................................................................... 36
Page | 256
LabSpec 5 user manual
Turn on..................................................................... 35
Pointer ........................................................... See Cursors
Polarization
Control laser polarization
LabRAM ARAMIS ............................................... 244
XploRA ............................................................... 240
Control Raman polarization
LabRAM ARAMIS ............................................... 244
XploRA ............................................................... 240
Polarizors ................................................ See Polarization
Pressure units ............................................................... 23
Printing functions.......................................................... 13
Print template page ................................................. 13
Profile
Intensity profile across 2D image . See Intensity profile
Spectral .............. See Multidimensional spectral array
User log-in profiles .................. See User log-in profiles
R
Real time display (RTD)
Acquisition time ..................................................... 234
Detector image read out RTD mode
Configure ............................................................. 33
Start acquisition .................................................. 96
Spectrum read out RTD mode
Start acquisition .................................................. 95
Reinitialize instrument .................................................. 75
Relative
Positioning for multidimensional spectral arrays..... 98
Report function ............................................................. 13
Rescale ............................................................... See Scale
Resize data .................................................................... 21
Resolution
Controlling depth resolution with confocal hole ... 228
Controlling spectral resolution
WIth diffraction grating ..................................... 231
With slit ............................................................. 229
Right click menus ........................................................ 203
Axes........................................................................ 213
Blue cursor ............................................................. 220
Centre cursors ........................................................ 212
Cursor..................................................................... 218
Fast settings ........................................................... 209
Format and scale .................................................... 204
Green cursor .......................................................... 220
Image ..................................................................... 221
Image colors ........................................................... 210
Image3D ................................................................. 224
Imposition .............................................................. 222
Legend.................................................................... 216
Red cursor .............................................................. 220
Rescale ................................................................... 209
Scale bar ................................................................. 222
Spectrum ................................................................ 217
Swap X axis ............................................................. 209
Swap Y axis ............................................................. 210
RTD........................................ See Real time display (RTD)
S
Save
Options for saving data ............................................ 12
Save all data ............................................................. 11
Save all spectra in array as individual files ............... 11
Save as ..................................................................... 11
Save picture as ......................................................... 12
Savitsky-Golay ........................................... See Smoothing
Scale
Format scale behaviour .......................................... 208
Rescale
All axes ................................................................ 91
Drag spectrum with mouse to rescale .......... 169
Intensity .............................................................. 92
Drag spectrum with mouse to rescale .......... 169
Scale bar for images ............................................... 222
Scale data manually (shift, stretch, compress axis) .. 21
Set scale of video images ................. See Video images
Scanner ........................................................ See LineScan
Scripts ........................................................................... 82
Add scripts to menu list ........................................... 85
Apply a script before/after acquisition .................... 85
Edit ........................................................................... 84
Load and manage ..................................................... 83
Menu list .................................................................. 86
Remove scripts from menu list ................................ 85
Trigger ...................................................................... 85
Use scripts to control motors ................................... 86
Scripts menu ................................................................. 82
Options ..................................................................... 83
Scroll bars.................................................................... 207
Setup menu ................................................................... 73
ICS Filters .................................................................. 75
Instrument calibration ............................................. 73
Instrument init ......................................................... 75
Slit ............................................................................... 229
Small icon ...................................................... See Icon bar
Smoothing
Data
Denoise
After acquisition ........................................... 124
Automatic Denoise during acquisition ........... 46
Page | 257
LabSpec 5 user manual
Turn off ...................................................... 47
Turn on ...................................................... 47
Fourier transform .............................................. 127
Median .............................................................. 126
Savitsky-Golay ................................................... 125
Image pixel smoothing ........................................... 221
Spectral database ..................................... See Spectral ID
Spectral ID
Configuring LabSpec correctly................................ 114
Start search from LabSpec ..................................... 114
Using ........................ See separate Spectral ID manual
Spectral profile........ See Multidimensional spectral array
Spectral range ................................... See Extended range
Spectrometer
Select diffraction grating .......... See Diffraction grating
Send to zero order reference position ................... 230
Spectral position .................................................... 230
Spectrum display ................................................ See Data
Spike filter
Automatic spike filter
After acquisition ................................................ 126
During acquisition ............................................... 37
Turn off........................................................... 38
Turn on ........................................................... 38
Manually remove spike after acquisition ............... 166
Split spectral array ........................................................ 11
Status bar .................................................................... 199
Active options ........................................................ 199
Cursor values ......................................................... 201
Detector temperature............................................ 200
Progress bar ........................................................... 201
System messages ................................................... 199
Stitch video images ............................ See Extended video
Sub-pixel ........................................... See Extended range
Subtract spectra ................................................. See Math
SWIFT ultra-fast mapping .See Multidimensional spectral
array
T
Temperature
Operating temperature of detector ........ See Detector
Spectral profile ... See Multidimensional spectral array
Templates .............................................. See LabAssistant
Threshold .................................................................... 122
Topography
Acquire topography image................ See Extra images
Use Autofocus to analyse rough samples .............. See
Autofocus
Trigger
Apply a script before/after acquisition .................... 85
Trigger message window .............................................. 32
U
Units .............................................................................. 22
Custom units ............................................................ 24
Pressure units........................................................... 23
User log-in profiles ........................................................ 25
Changing a user profile password ............................ 28
Creating a new user profile ...................................... 27
Log in during a session ............................................. 27
Log-in at start ........................................................... 26
User levels ................................................................ 25
V
Version number ............................................................ 88
Video images
Aspect ratio ............................................................ 207
Brightness and contrast ......................................... 212
Camera configuration .............................................. 67
Default X axis display.............................................. 209
Default Y axis display .............................................. 210
Define multidimensional spectral array position ... 184
Extended video image ...................See Extended video
List of installed cameras ........................................... 72
Overlay map/score information ............................. 222
Scale bar ................................................................. 222
Selecting a camera ................................................... 72
Set the image scale .................................................. 68
Manually.............................................................. 70
Using.................................................................... 68
Set the laser spot marker position ........................... 67
Set the LineScan image scale ................................... 71
Start acquisition ..................................................... 102
Video menu ................................................................... 66
Format...................................................................... 67
Laser position ........................................................... 67
List of installed cameras ........................................... 72
Offsets ...................................................................... 67
Source ...................................................................... 67
Video image scale .................................................... 68
Visual basic scripting ........................................ See Scripts
W
Warm detector to room temperature .......................... 66
Window menu .............................................................. 86
Cascade .................................................................... 87
Page | 258
LabSpec 5 user manual
Instrument setup ................................................... 238
Turn on laser .......................................................... 238
Tile ........................................................................... 87
X
Y
X axis
Reverse display ...................................................... 209
Units ......................................................................... 23
XploRA
Hardware control ................................................... 239
Adjustment camera ........................................... 240
Fiber entrance ................................................... 241
Microscope........................................................ 239
Polarizors
For laser ........................................................ 240
For Raman .................................................... 240
Re-initialise ........................................................ 242
White lamp ........................................................ 241
Y axis
Reverse display ...................................................... 210
Units ......................................................................... 23
Z
Zero data ..................................................................... 121
Zero order position
Manual calibration ............................... See Calibration
Send spectrometer to zero order ........................... 230
Zoom ........................................................................... 168
Page | 259