1
Operating Instructions
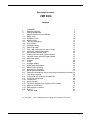
VMF 2000
Contents
1
2
3
4
4.1
4.1.1
4.2
4.3
4.4
4.5
4.6
4.7
4.8
5
5.1
5.2
5.3
5.5
6
6.1
6.2
6.3
6.4
6.5
6.6
6.7
6.8
6.9
6.10
6.11
6.12
6.13
6.14
6.15
7
Introduction
Operating elements
Putting into operation
Adjusting the measuring conditions
Master value
Calibration value
Nominal value
Tolerance monitoring
Classification
Correction factors
Measuring range
Start, stop, measuring time, pause, delay
Storing the settings permanently
Measurement and evaluation
Checking the transducer signal indication
Indication ranges of the dial-type indicator
Measuring results
Printouts
Annex
Analogue outputs
Digital inputs and outputs
Adjusting the sensitivity
Balancing the Symmetry
Blanking out disturbances
Zero point correction by means of the measuring/reference function
Transducer checking
Linearization of transducer characteristics
Instrument configuration
Function keys
Serial interfaces
Functional diagram, pin assignment of the sockets
Notes on maintenance
Exchanging the software
Error list
Technical Data
Oct. 30th, 2008
3
4
8
9
9
10
11
11
15
16
17
18
20
21
21
22
23
25
26
26
28
37
39
41
42
46
47
50
64
65
79
87
87
88
89
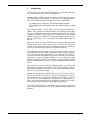
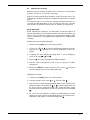
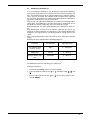
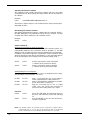
These operating instructions apply for the software version 3.46.
1
2
1
Introduction
The measuring and control instrument VMF 2000, in combination with either
one or two transducers, is used for acquiring thickness.
Measuring values or calculated results are output as exact numerical values on a
seven-digit display and, in addition, as scale values on a dial-type indicator.
This results in optimum read-off possibilities for all sorts of application:
For reading off measuring values, the numerical display is favorable,
for recognizing trends and reversing points, the analogue indicator is ideally
suited.
This instrument features a great variety of measuring and evaluation possibilities. They reach from the simple indication of the directly acquired value,
over sum and differential measurements with two transducers to the statistical
evaluation of complete measurement series including mean value, standard
deviation and range. In addition to the standard measuring range with a resolution of 0.1 µm, there is a fine measuring range with the high resolution of
0.01 µm.
Tolerances can be set and precisely monitored. The built-in pilot lamps which
arrange the test pieces into the groups "Accept", "Rework", and "Reject" are
used for the visual indication. The corresponding information on the test piece
can also be transferred via the interfaces to external instruments.
The VMF 2000 features a variety of inputs and outputs which can be connected directly to a stored program control (PLC). Printers and host computers
can be connected via two serial interfaces. Host computers can not only receive data sent by the VMF 2000, they can also control many of its functions.
Control units, recorders, indicating instruments, etc. can be connected to three
analogue outputs the parameters of which can be set independently from each
other, thus enabling the instrument's complete integration into the production
process.
This instrument also features numerous auxiliary functions, e.g. symmetry and
adjusting the sensitivity of the transducer. The function "blanking out disturbances" with its adjustable parameters can be used for largely suppressing interferences on the measuring signal.
Naturally, not all instrument functions will be used to the same extent. Therefore, you can tailor the user interface to suit your special demands. The possible evaluations can be restricted to the indication of the actually necessary results. If for some special application a not directly accessible function is required, the function in question may be assigned to a function key. The function can now be called up at any time by simply pressing this key.
In spite of its many functions, the VMF 2000 is easy to operate, such that even
non-specialists and temporary users can work with this instrument without any
difficulties.
3
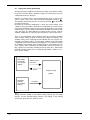
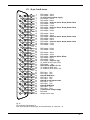
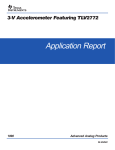
2
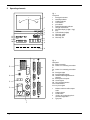
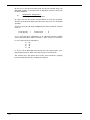
Operating elements
1
0
0
10
3
10
3
-
+
Vollmer
VMF 2000
T
13
12
11
10
inch
µm
2
3
4
5
6
7
8
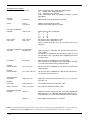
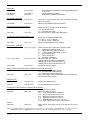
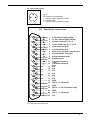
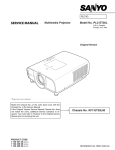
Fig. 1
Front panel
1
Analogue Instrument
2
Start/Stop indicator
3
Overflow indicator
4
Inch indicator
5
µm indicator
6
Setting/Configuration indicator
7
Change-over indicator
8
Numerical display (6 digits + sign)
9
Keys
10 Text indication (8 digits)
11 Pilot lamp, yellow
12 Pilot lamp, green
13 Pilot lamp, red
9
X5
X11
5
X7
KONFIG
X6
4
X4
O
I
X9
3
X2
230Vac~
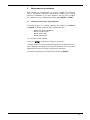
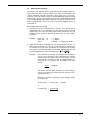
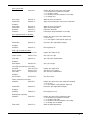
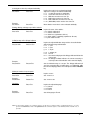
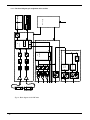
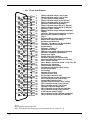
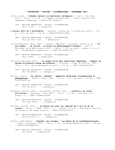
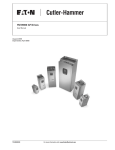
Fig. 2
Rear panel
X1: Mains connection
X2: Socket for connecting transducer
A
X3: Socket for connecting transducer
B
X4: Analogue output
X5: Analogue/digital outputs
X6: Interface measuring/reference instrument
X7: BCD inputs and outputs
X8: Control signals
X9: Host computer interface
X10: Printer interface
X11: not yet assigned
X8
2
X10
4
X1
X3
0
VOR ÖFFNEN DES GERÄTES NETZSTECKER ZIEHEN
1
2
3
4
DISCONNECT MAINS BEFORE OPENING THE HOUSING
5
1
4
Selector switch for cable compensation
Voltage selector
On/Off switch
"Konfig." key for changing the instrument configuration
Type plate
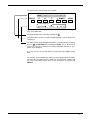
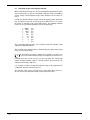
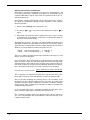
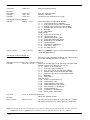
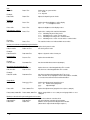
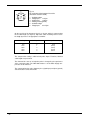
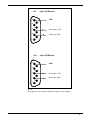
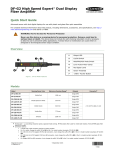
To each key, three function levels are assigned:
RESULT
0
Set
F1
F2
a
Test
b
START
Setting/Configuration
Catalogue
Position
Digit
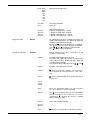
Fig. 3
Keys on the VMF 2000
The upper function level is reached by actuating key
.
The intermediate function level (Measuring/Evaluating) is active directly after
switching on.
The lower function level (Setting/Configuration) is activated either by actuating
and SETTING or by actuating the Konfig. key (cf. fig. 2 point 4)
the keys
on the rear side of the instrument. The setting/configuration indicator (cf. fig. 1
point 6) starts to light up.
As a rule, the keys of the VMF 2000 are actuated by only slightly touching
them.
The functions of the individual keys will be presented graphically on the following pages. By repeatedly pressing certain keys, the parameter catalogue will
be scrolled. The lower function level can be abandoned at any time with
RESULT.
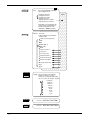
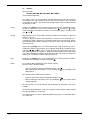
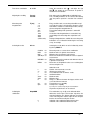
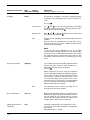
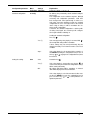
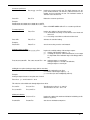
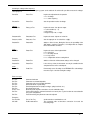
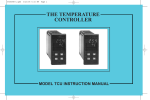
5
T
START
starts
the storing of MAX, MIN, and MEAN
values taking the time T:
T
resetting the memories
opening the memories
accepting meas. values
closing the memories
sending results to the statistics
sending results to the interface
(Depending on the configuration, the
storing is either completed after the
preset measuring time Tm or by
actuating the START key again.)
indicates
RESULT
the results.
Further actuation causes indication
of further results.
continuous measuring values
MAX
MIN
(MAX + MIN) / 2
MAX - MIN
MEAN
number of values n
last value xn
mean value x-bar
standard deviation s
maximum value Xmax
minimum value Xmin
R (range) Xmax-Xmin
Cp*
Cpk*
displays the current range of the dial-type
indicator for about 2 seconds.
If the keys are actuated again during
these 2 seconds, the range is changed.
10,000 µm
3,000 µm
1,000 µm
300 µm
100 µm
30 µm
10 µm
3 µm
1 µm
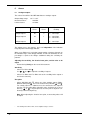
6
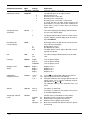
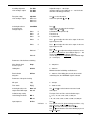
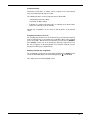
F1
executes SPECIAL FUNCTION 1
F2
executes
SPECIAL FUNCTION 2
Statistics
0
Check a
Check b
SETTING
sets
the current measuring value to the
value
( master value) or
nominal
zero.
indicates the individual probe value directly,
- without master value /0
i.e.
- without "Factor A
-ororwithout
B A+BA/B"
-- without nominal
value
or
RESULT
START
return with
starts
setting of measuring conditions.
Scrolling the
catalogue
Selecting
desired position
"Master actual value"
Changing
individual digits
-199,999.9 ... + 199,999.9 µm
"Nominal value"
0 ... +1,999,999 µm
Upper tolerance
-199,999.9 ... +199,999.9 µm
Lower tolerance
-199,999.9 ... +199,999.9 µm
return with
RESULT
or
START
7
3
Putting into operation
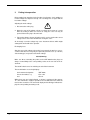
Before putting into operation for the first time, by all means check whether or
not the voltage was adjusted correctly. The set voltage has to agree with the
local mains voltage!
Adjusting the mains voltage:
!
1. Disconnect the mains plug.
2. Open the cover of the voltage selector (see figure 2) by means of a screw
driver and swing it down. For reasons of safety, the cover can only be
opened if the mains plug is disconnected.
3. Pull out the voltage selector roll and insert it in such a way that the correct
voltage can be seen in the window after closing the cover.
An incorrectly set mains voltage may cause instrument defects which might
endanger life and health of the operator!
Exchanging fuses:
After the cover of the voltage selector has been opened, the two fuses are accessible. Defective fuses may only be replaced by fine wire fuses (5 x 20 mm)
of the below type, irrespective of the mains voltage:
630 mA, time-lag
Make sure when connecting the probes to the VMF 2000 that the plugs are
always screwed firmly to the corresponding socket on the rear side of the instrument.
The On/Off switch serves for switching on and off the instrument.
The text indication successively displays:
the instrument designation
the version number, e.g.
and
"VMF 2000",
"Rev. 3.46"
"Check".
While these texts are being indicated, a self-test is performed. After approx.
15 s, the instrument is ready for operation. The text indication now shows the
master value stored last. The numerical display and the dial-type indicator display the corresponding measuring result.
8
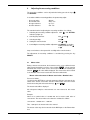
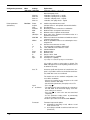
4
Adjusting the measuring conditions
The measuring conditions can be adjusted after having pressed the keys
and SETTING.
In accordance with the measuring problem, the operator may adjust:
-
the master value
the nominal value
the upper tolerance
the lower tolerance
"Master"
"Nom. val."
"up. Tol."
"low. Tol."
The standard routine for adjusting the measuring conditions is as follows:
1
Activating the measuring condition adjustment
Indicator (6) lights up.
and SETTING.
with
2. Selecting the parameter
with
and
3. Selecting the digit
with
.
4. Setting the numerical value
with
or
.
.
5. Concluding the measuring condition adjustment with RESULT or selecting
further parameters with
or
.
Steps 3 and 4 have to be repeated for each digit of the numerical value.
The adjustment of measuring conditions is concluded by pressing the key
RESULT.
4.1
Master value
During a master measurement, the instrument can be set to a defined master
value (master deviation) by means of the function
. Via the function
SETTING, this master value can be selected and entered. On activating the
function
, this value will be displayed. The master value to be entered
is the deviation of the master actual value from the nominal value.
Master value to be entered = Master actual value – Nominal value
Proceed as follows:
Use the function SETTING to select the parameter "Master" and enter the deviation of the master actual value from the nominal value. Place the master
into the measuring unit and actuate the keys
and
.
The master value will be displayed.
All subsequent workpiece measurements are now referred to this master
value.
Example:
Given are a nominal value of 122.050 mm and a master actual value of
121.010 mm. The master value to be entered is calculated as follows:
121.010 mm - 122.050 mm = -1.040 mm
Thus -1,040 µm is the master value to be entered.
The master value may also be entered via the BCD inputs or the RS232 interface.
9
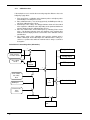
4.1.1
Calibration value
If the workpieces zero is outside the measuring range the difference has to be
bridged by a gage block.
1. Place gage block ( =calibration value) between probes and adjust probes
mechanically to a reading close to zero.
2. Enter calibration value (= size of the gage block)) via BCD inputs with signal „Enter calibration value“ (X5-5).
3. Activate input “zero setting“. The dial type indicator shows 0 if the nominal
value equals the calibration value. Depending on the parameterization the
numeric display shows the calibration value or zero.
4. Enter the nominal value via the BCD inputs by activating „Enter master
value “. Die dial-type indicator shows the deviation of this nominal value
while the numeric display shows the actual value or the deviation from the
nominal value.
5. The numeric range of the calibration value and the nominal value is
0000.0...9999,9 µm. Via the BCD inputs the calibration value is always assumed as a positive value while the nominal value is always assumed to
be negative.
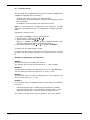
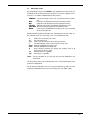
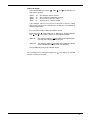
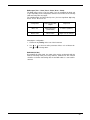
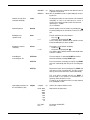
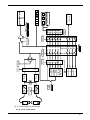
Calculation of a measuring value (Schematics)
A/D-converter
Fade out zero
set. value X8-44
Zero setting
X8-45
+
Dial-type indicator
-
Analog output
Zero
register
BCD-output
+
Calibration value
+
-
Enter calibration value
X5-5
+
Nomin
al
value
BCD-Input
+
Numeric display
+
Enter master
value
X7-50
Master value
Anz.Vkn 0/1
P6,....
10
4.2
Nominal value
In case actual values instead of relative ones are to be indicated, nominal values
in a range between 0 and 2 m, i.e. 0 and 1,999,999 µm, can be entered. Here,
only positive values are allowed.
The nominal value will be added to the measuring result. The sum will only be indicated on the numerical display, but not on the dial-type indicator, which continues to indicate the deviation from the nominal value. Please note that the tolerance indication and the tolerance limits are also referred only to the deviation from
the nominal value.
"Nom. val." (nominal value) is to be selected and entered (0 ... 1,999,999 µm) via
the function SETTING.
Example:
Given are a nominal value of 122.050 mm and an indicated measuring result of
85 µm. Use the function SETTING to select parameter "Nom. val." and enter the
nominal value in micrometers, i.e. 122,050 µm.
The numerical display now indicates the real actual value of the workpiece,
namely 122,135.0 µm, while the dial-type indicator continues to display the deviation from the nominal value, i.e. 85 µm.
NOTE
The range of indication of the numerical display is limited to
±1,999,999 µm. In case this range is exceeded, "+1" or "-1", respectively, will be
indicated. This is the reason why for large absolute values the resolution must be
reduced to 1 µm.
4.3
Tolerance monitoring
Tolerance monitoring means that all measuring values are compared with
the tolerance limits. Differently colored pilot lamps indicate whether the measuring
value
-
exceeds the upper tolerance limit,
lies within the tolerance zone,
exceeds the lower tolerance limit.
For tolerance monitoring, one of the measuring results below may be chosen:
-
COMBINE
MAX
MIN
(MX+M)/2
MAX - MIN
MEAN
current measuring value acc. to probe combination
maximum value during a measuring series
minimum value during a measuring series
arithmetic mean value of MAX and MIN
difference between MAX and MIN
mean value of all measuring values gathered in a measuring
series
The tolerance limits, which can be adjusted in a range between
-199,999.9 µm and +199,999.9 µm,
are selected via the parameters
"up. Tol." (upper tolerance limit) or
"low. Tol." (lower tolerance limit).
The smaller value is always assigned to the lower tolerance limit.
The larger value is always assigned to the upper tolerance limit.
11
If the measuring result lies within the preset tolerances, the green pilot lamp
(see fig. 1 point 12) starts to light up, thus classifying the workpiece into the
"Accept" group.
In case the upper or lower tolerance limits are exceeded, the yellow (see fig. 1
point 11) or red (see fig. 1 point 13) pilot lamps light up. These lamps indicate
"Reject" components (red lamp), for which too much material was taken off,
and
"Rework" components (yellow lamp), for which not enough material was removed.
Which of the two lamps in question will light up depends on the type of measurement carried out, i.e. an internal or external measurement. The type of
measurement to be carried out must thus be stated in the configuration settings beforehand.
Hysteresis of tolerance monitoring
Under adverse measuring conditions (e.g. vibrations), pilot lamp flickering in
case of close-to-tolerance measuring results is possible. In order to avoid this,
a switching hysteresis can be established. Here, the preset tolerance limit is
extended symmetrically by a certain, selectable value. If the measuring results
now lie within the hysteresis range of the tolerance limits, the state of the pilot
lamps does not change.
Basic principle of hysteresis:
With a switching hysteresis selected, the current and the preceding measuring
result determine whether or not a result lies within the tolerance limits. Thus,
the following is valid for measuring results in the range of the hysteresis:
Any result within the hysteresis range is considered to be within limits, if it and
the directly preceding result are within limits. In case the preceding result was
off limits, the current result in the hysteresis range is considered off-limits as
well.
The switching hysteresis can be adjusted in a range between 0 and 99.99 µm
after calling up parameter "Hystere." in the configuration level.
12
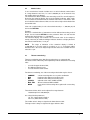
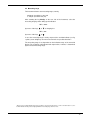
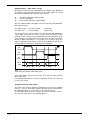
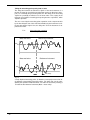
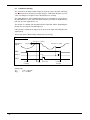
Fig. 5
Influence of the switching hysteresis on tolerance monitoring. The present example shows the course of the measuring values during an external measurement together with the tolerance monitoring results. (For reasons of improved illustration, the hysteresis is represented superproportionally large.)
13
14
4.4 Classification
The classification always refers to the measuring result which was selected for tolerance monitoring (with "Sel.tol"). Whenever the control signal "accept value into
statistics" is released or the measuring time Tm ended, the results are sorted into
groups according to their numerical values.
Classification, i.e. adjusting the class limits, is carried out automatically. The range
between the upper and lower tolerance limit is divided into classes of equal width.
The number of classes has to be set in the instrument configuration level.
After having actuated Konfig. on the rear of the instrument, use the key
to set the indication to "Classes" and actuate the keys
and
or
the desired number of classes (1 ... 30).
By entering "0", classification will be switched off.
or
to enter
The class limits are adjusted after leaving this menu point.
Example for automatic classification:
In case there are 5 classes between - 2,000 µm (lower tolerance limit) and +2,000
µm (upper tolerance limit), a class width of 800 µm and the following class limits will
result for automatic classification:
Cl.l. 0:-2,000.00
Cl.l. 1:-1,200.00
Cl.l. 2:-400.00
Cl.l. 3:400.00
Cl.l. 4:1,200.00
Cl.l. 5:2,000.00
(from
(from
(from
(from
(from
-2,000 µm to<-1,200 µm)
-1,200µm to<-400 µm)
- 400 µm to<+400 µm)
+400 µm to<+1,200 µm)
+1,200 µm to<+2,000 µm)
Please note that due to the chosen hysteresis, the reversing points between the individual classes are extended.
A measuring result which is in the range of the hysteresis is automatically assigned
to the lower class, provided that the directly preceding result was also assigned to
the lower class. If it was grouped into the higher class, the current result will be assigned to the higher class as well.
Printing out the classification results:
When printing out individual values, the class is printed out in the column following
the classified measuring result.
When calling up the function "Prnt stat" (= print statistics), a table is printed out
which contains the class limits, the number of individual values in this class and a
histogram with the graphical representation of the distribution function.
This histogram is deleted on deleting the statistics completely ("Clr stat").
Whenever changing the tolerance limits, the function "Clear statistics" has to be
called up since otherwise totally wrong classification results will be printed out.
15
4.5
Correction factors
The measuring values supplied by the transducers A and B are multiplied individually by an adjustable factor. On doing so,
-
sensitivity errors of the transducers are compensated for,
the lever factors of the reversing levers inside the measuring unit are taken
into consideration,
the multipliers for the measuring result are taken into account.
Note: For compensating for sensitivity errors of the transducers, the VMF
2000 offers two auxiliary functions (see "Adjusting the sensitivity" and "Symmetry”
Adjusting the correction factors:
1. Actuate the key Konfig. on the rear of the instrument.
2. Select "Factor A" or "Factor B" with
or
.
3. Set the numerical value with
,
and
.
(Range 0 ... 99.9999; only positive values are allowed. Negative values
have to be entered via the probe combination adjustment.)
4. Select further parameters with
or
or conclude with RESULT.
For both factors, the default setting is 1.0000.
If several correction factors are at hand for one transducer, these are multiplied with each other and then entered as one common "Factor A" or "Factor
B".
Examples for adjusting the correction factor
Example 1
Transducer A features a sensitivity error of + 0.5 %.
The correction factor ("Factor A") then amounts to (1 : 1.005 =) 0.9950.
Example 2
A reversing lever mounted in front of transducer B causes a demultiplication of
0.75. The value to be entered for "Factor B" is (1 : 0.75 =) 1.3333.
Example 3
The measuring result of transducer A divided by two is to be indicated. The
value of "Factor A" then is (1 : 2 =) 0.5.
Example 4
In a measuring set-up, the following transducer factors have to be considered
in common:
-
Correction factor due to the sensitivity error of the transducer = 0.9950
Correction factor due to the error caused by the reversing lever = 1.3333
Correction factor due to the conversion of the measuring result = 0.5
The common correction "Factor A" then is (0.9950 * 1.3333 * 0.5 =) 0.6633.
16
4.6 Measuring range
The instrument features two measuring ranges, namely
±2,000 µm (resolution 0.1 µm) and
± 200 µm (resolution 0.01 µm)
After actuating the key Konfig. on the rear side of the instrument, select the
measuring range by either calling up the indication
"MR. ± 2000"
by means of the keys
or
or changing it to
"MR. ± 200"
by means of the keys
or
.
In case the measuring range is clearly surpassed, the overflow indicator (see fig.
1 point 3) starts to light up. No more measurements are possible thereafter.*
The measuring range is not dependent on the indication range of the numerical
display. The resolution of all indicated and output values, however, is determined
by the selected measuring range.
* Moreover, the overflow indicator takes into account the selected correction factor, i.e. if the correction factor is <1, the
overflow indicator already starts to light up within the measuring range and vice versa.
17
4.7
Start, stop, measuring time, pause, delay
The measuring time is the time during which the memories for maximum, minimum
and mean value are open. The open state of the memories is indicated by "T" being
displayed. Before new measurements over the measuring time Tm are started, the
memories are cleared to enable the storing of new values. Whenever the measuring time Tm is ended, the result selected via the instrument configuration setting
"Sel.stat" is accepted into the statistics memory and the results selected via
"Sel.Prnt" are printed out.
The measuring time can be started and ended in three ways:
Manual
1. Manual control of the measuring time via Start/Stop
Press the key Konfig. on the rear of the instrument and select the
parameter
"STRT man".
The measuring time is started by simply pressing the START key
and ended whenever wanted by pressing the START key again.
Preset
2. Measurement over a certain preset period of time
Press the key Konfig. on the rear of the instrument and select the
parameter
"STRT Tm".
The measuring time starts after actuating the START key and ends
automatically after the preset time Tm.
For adjusting the measuring time (in seconds), set the parameter
"Tm [s]"
in the instrument configuration to a value in the range between 0.01 s
and 999.99 s by means of the keys
,
, or
.
Intervals
3. Given measuring time, cyclical repetition of measuring run (measurements in intervals)
Press the key Konfig. on the rear of the instrument and select the
parameter
"STRT Tp".
Pause
The measurement starts after having actuated the key START and
ends after the preset time Tm. After a pause time Tp, the measuring
run starts again. The cyclical repetition of the measuring time Tm
and the pause time Tp is ended on actuating the key START again.
The length of the pause "Tp [s]" is entered in the same way as the
measuring time Tm (0.01 ... 999.99 s).
Delay
By entering a delay time Td, between 0 and 99.99 seconds, the start
of the measurement will be delayed. Td is entered in the same way
as Tm.
Interruption
The measurement can be interrupted on actuating the keys
and
START and continued by actuating these keys again ( , START).
Adjusting the parameters Tm and Td is also necessary for the
measuring/reference function.
18
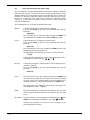
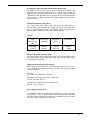
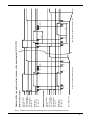
Measuring time controlled by Start/Stop
Start
Stop
...
Td
START
START
Measuring with preset measuring time Tm
Start
START
Td
Stop
Tm
Cyclical repetition of the measurement
Stop
Start
Td
Tm
Tp
Tm
Tp
START
Tm
etc.
START
Fig. 6
Measurements with differing measuring time control
Tm = measuring time
Td = (initial) delay time
Tp = pause time
19
4.8
Storing the settings permanently
Changed measuring conditions and instrument settings are deleted on switching off the instrument. When switching on again, the instrument presents the
settings that have been stored last.
However, all settings can be stored permanently by means of the function
"Save". For this, select "Save" in the instrument configuration and press
.
The following safety inquiry must be answered by pressing
or aborted by
pressing any other key.
Each time the instrument configuration is stored, the version number of the
software is also stored. When switching on the VMF 2000, the version number
stored in the EPROM is compared to the stored version number. If the version
numbers differ, e.g. after having exchanged the EPROM, the instrument indicates "Rev-Fehl". The VMF 2000 may no longer function correctly. Load the
standard configuration "S.config" and store it by means of the function "Save".
There is one permanently stored standard setting for measuring conditions
and instrument settings to which the instrument is adjusted on delivery. This
standard setting can be recalled at any time although the user may have permanently stored further settings. The measuring conditions and the instrument
configuration entered and stored permanently by the user, however, will only
be overwritten (and deleted!) if the standard setting is stored again by means
of the function "Save". Otherwise, the permanently stored user-specific settings continue to be valid after switching off and on again. Thus, intermediate
work with standard settings does not automatically entail the deletion of customer-specific settings.
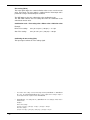
Non-volatile
memory for
user-specific
settings
Switching on the
instrument
"Save"
Working memory
(volatile)
Read-only
memory
for standard
settings
"S. config"
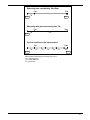
Fig. 7
Storing instrument settings in the volatile working memory, the non-volatile
memory, and the standard-settings memory. The settings in the working
memory are always the ones which are used.
20
5
Measurement and evaluation
After switching on, the instrument is in its basic condition. The transducer
value is determined continuously and indicated according to the selected
transducer combination. In case the instrument is not in its basic condition,
this condition can be re-established by actuating either RESULT or START.
5.1
Checking the transducer signal indication
For checking purposes (e.g. during setting-up), the actuation of key Check a
or Check b results in the indication of the current probe value,
-
without transducer combination,
without correction factor,
without master value,
without nominal value.
i.e. as an unprocessed raw value.
In this case,
(accept master value) has no function!
Usually, these keys are only used during setting-up for checking correct transducer clamping or ensuring perfect transducer functioning. The zero position
indicated here marks the electrical zero point of the transducer.
The transducer signal check is ended on pressing the key RESULT.
21
5.2
Indication ranges of the dial-type indicator
When monitoring measuring runs, the fast and reliable determination of trends
and reversing points is decisive. The dial-type indicator and the possibility to
choose among several indication ranges makes allowance for the above demand.
Usually, the dial-type indicator and the numerical display provide equal readings. Exceptions to this rule are formed by the setting "Sel. ins 2" as well as
the output of statistical results and nominal values. The following indication
ranges can be selected independently of the measuring range:
± 10,000
± 3,000
± 1,000
±
300
±
100
±
30
±
10
±
3
±
1
µm
µm
µm
µm
µm
µm
µm
µm
µm
The numerically displayed values are not influenced by the indication range
setting of the dial-type indicator.
The resolution of the displayed value is determined by the adjusted measuring
range (see measuring range).
In case the instrument is in its basic condition, the actuation of one of the keys
or
causes the valid indication range to be displayed for about two seconds.
If during these two seconds the keys are pressed again, the subsequently
smaller or larger indication range is selected. Continue pressing these keys
until the desired range is adjusted.
It is no longer possible to change the indication range via the keyboard if the
configuration locking is activated (Lock on).
The indication range can be selected via the control inputs Rxin (X8/14...17,
48...50), even if the configuration locking of the keyboard is active.
22
5.3
Measuring results
By repeatedly pressing the key RESULT, the following measuring results can
be indicated ("measuring result" here describes the result of a dynamic measurement, i.e. a number of individual measuring results):
- COMBINE current measuring result as per selected transducer combination
- MAX
maximum result during measurement (maximum value)
- MIN
minimum result during measurement (minimum value)
- (MX+M)/2 arithmetic mean value of maximum and minimum result
- (MAX-MIN) difference between maximum and minimum result
- MEAN
mean value of all individual measuring results assessed during
the measuring time Tm
Provided that the statistical evaluation was activated by the function "Stat. on",
the statistical results of a measuring series can be indicated as well:
-
n
xn
x (x/)
s
Xmax
Xmin
R
- cp*
- cpk*
*Note:
number of measurements or results
last measuring result
x-bar, mean value of all results of all measurements
standard deviation of these values from the mean value
maximum individual measuring result
minimum individual measuring result
range, difference between the largest and smallest result of all
measurements (Xmax - Xmin)
theoretical process capability
actual process capability
For the calculation of "cp" and "cpk", the gaussian distribution is not
determined.
The measuring results to be indicated have to be selected beforehand in the
instrument configuration.
For all statistical evaluations it is necessary to beforehand set "Stat. on" in the
instrument configuration and select a measuring result, e.g. (MAX - MIN).
23
5.4
Statistics
One of the results
Combine, MAX, MIN, (MX + M)/2, MAX - MIN or MEAN
can be evaluated statistically.
The statistics can be run for a maximum of 25,000 measurements. After the end of the
measuring time Tm or the activation of input "Accept value into statistics", the result will be
accepted into the statistics. The number of the already acquired results "n" will be indicated
for about two seconds.
Select
Actuate the key Konfig. on the rear of the instrument and select the configuration parameter "Stat. on". Afterwards, choose "Sel.stat" and depress the
key. Now use
to single
out the measuring result for which the statistics is to be run and set it to "1" by means of the
keys
and
.
Restrict
With parameter "n max" it is possible to restrict the number of measurements for which the
statistics is to be run.
As soon as the preset number of measurements is reached, no more results will be accepted into the statistics. Moreover, it is no longer possible to start a measurement. Only after having deleted the statistics completely or at least the last result, may commence the
next measurement.
Depress the key Konfig. on the rear of the instrument and call up the parameter "n max".
Establish the number of measurements to be evaluated statistically (0 to 25,000) by means
of the keys
,
and
. In case "0" is input, the number of measurements to be evaluated statistically will not be restricted, i.e. 25,000 measurements will be taken. After having
assessed the 25,000th measuring result, the instrument does not prevent the acquisition of
further results. The statistics, however, will not be carried on.
Print
Actuate the key Konfig. on the rear of the instrument and select the parameter "PrntStat".
The statistical record printout can now be started with
.
Delete
It is possible to delete the last result or the complete statistics.
The last result xn is deleted as follows:
-
Select "Clr xn" in the instrument configuration and press key
After answering the safety inquiry "n-1?↓" by actuating the
will be deleted.
.
key, the ultimate result
The complete statistics will be cleared as follows:
-
Select "Clr stat" in the instrument configuration and press key
.
After answering the safety inquiry "n=0?↓" by actuating the
key, the statistics will be
deleted completely.
The clear functions are executed directly. After the deletion, the instrument is in its basic
condition.
The above-mentioned functions can also be assigned to function key F1 or F2 for making
them directly available (see section 6.8).
The statistical results can also be deleted and printed out by means of control input signals
(see section 6.2).
24
5.5
Printouts
It is possible to print out measuring results, statistical values and histograms in
the form of a measuring record. All Epson or Epson-compatible printers with
serial interface can be used for this purpose.
The printer is connected to the RS 232 C interface (via the cable, order no.
6860215). For this, set the instrument configuration parameter "PrntPara" to
"1". Also check the baud rate and the transmission format.
Then, start the measurement by pressing the key START.
The measuring results Combine, MEAN, MAX, MIN, (MX+M)/2, and MAX-MIN
(depending on the presetting) will be printed out directly after the measurement.
-
START starts the measuring run the results of which will be stored.
The measuring run ends either after the preset time Tm or after actuating
the START key again.
The results are printed out as one line of a table.
Provided that classification and statistics have been activated, it is possible at
any time (i.e. during or after a measuring series) to print out the histogram and
the statistics.*
For this.
"Prnt stat" has to be set (
and
) and confirmed with
in the instrument configuration. As soon as the printout is complete, the
measuring series can be continued.
If only statistical results are to be printed out, we recommend to set all results
of the instrument configuration menu "Sel.Prnt" which are not required to "0".
This is particularly useful for transferring lots of data. In case of short measuring times and pauses, it may be that the printer receives the data too quickly.
This essentially depends on the printing speed and the selected transfer
(Baud) rate. If the printer receives the data too quickly, the VMF 2000 indicates the error message "Printer!" and individual characters or lines can be
lost.
The printing out of individual values can also be accomplished by activating
the input "Accept value into statistics".
The printout of statistical results can also be brought about by activating the
input "Print/cancel statistics".
The printing mode is switched off by setting the instrument configuration parameter "Printer" to "0".
•
If histograms or statistics are to be printed out quite frequently, we recommend to assign
this function to one of the function keys.
25
6
Annex
6.1
Analogue outputs
The sockets X4 and X5 of the VMF 2000 feature 3 analogue outputs.
Output voltage range:
Internal resistance:
Load resistance:
-10 V...+10 V
100 Ohm
> 2 kOhm
X5 socket
Pin no.
X4 socket
Pin no.
Adjustable
sensitivity
Analogue output 1
25
3
0 ... 150 mV/µm
Analogue output 2
24
1
0 ... 150 mV/µm
0 ... 150 V/full sc.
Analogue output 3
23
-
0 ... 150 mV/µm
The voltages across the outputs 1 and 3 are independent of the indication
range adjusted on the dial-type indicator.
When set to "DAC 2-rel" (see below), output number 2, however, depends on
the indication range of the dial-type indicator. At full-scale deflection, the output voltage is equal to the voltage established during the sensitivity adjustment.
Adjusting the sensitivity, the electrical zero point, and the value to be
output
- Actuate the key Konfig. on the rear of the instrument.
Sensitivity:
-
.
Select "Fac.-DA1" with
Use
,
and
to adjust the sensitivity of output 1.
-
Select "Fac.-DA2" and "Fac.-DA3" and set the sensitivity for the outputs 2
and 3 in the same way.
Zero point:
-
Select "Adj.-DAC" with
. Select one of the analogue outputs (DAC1,
DAC2 or DAC3) with
, and set its electrical zero point with
and
.
For control purposes, a voltmeter must be connected to the output in
question. The zero point will be adjusted in steps of about 5 mV. If one of
the keys
or
is kept depressed, the zero point is adjusted "continuously" until releasing the key.
Note: When adjusting the electrical zero point, no measuring values will
be output.
*
26
In the following named "DA" or "DAC", short for "digital-to-analogue converter".
Value to be output:
- Select "Comb.DAC" and actuate
tings can be selected:
"DAC1
"DAC1
"DAC1
"DAC1
off"
C"
A"
B"
. With
and
, the following set-
The analogue output is inactive.
The result of the combination is output.
The transducer value A is output.
The transducer value B is output.
If the analogue output is not used, we recommend to select the setting
"Off" in order to prevent the computer from wasting time on calculating an
unwanted output value.
-
Press key
and adjust "DAC2" and "DAC3" as well.
-
When depressing
again, "DAC2-fix" or "DAC2-rel" is displayed. With the
keys
and
, it is possible to choose one of the following settings:
"DAC2-fix"
The analogue output 2 is not dependent on the adjusted indication range of the dial-type indicator (mV/µm).
"DAC2-rel"
The analogue output 2 is dependent on the adjusted indication
range of the dial-type indicator (V/full-scale deflection).
This possibility only exists for the analogue output 2.
The secondary menu is left by pressing the key
until the secondary menu is left.
. The settings are not valid
27
6.2
Digital inputs and outputs
Inputs:
Optocouplers with protective resistor and reverse-biased diode for reversed
protection.
Limit:
High:
Low:
Ii
Vi
Vi
< 50 mA
> 4.5 V (Ii = (Vi-1.2V)/1 kOhm)
< 2.5 V (Ii = Vi/1.5 kOhm)
For activating BCD switches, a resistor of 220 Ohm/1 W has to be connected
in series to the output.
Outputs:
Optocouplers with Darlington output transistor and reverse-biased diode for
reversed protection.
Limits:
High:
VCE
VCE
< 35 V,
< 2 V,
IC <
IC>
80 mA
30 mA (typ. 45 mA)
The collectors of the output transistors and the cathodes of the input LED's
are combined to form groups which are assigned to common contacts of the
socket. Thus, the groups can be isolated electrically.
Note:
The electrical isolation does not fulfil safety requirements, it only
serves for metrological purposes (e.g. for avoiding earth loops).
All signals have a positive logic and are "high active", i.e. an active function
(= "On") causes a current to flow through the optocoupler.
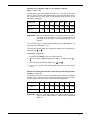
Transferring the input information:
The inputs are sampled at a rate of about 1.6 ms. 8 inputs are internally arranged to form a group (1 Byte). In order to suppress interferences effectively,
a changed input signal is ignored unless the logic level on all inputs of a group
was stable during 16 ms, i.e. for 10 successive samples.
28
Group 1:
Select indication range R1in ... R7in
Accept master value
Group 2:
BCD-Hold
Synchronize (measuring/reference instrument)
Symmetry
Accept value into statistics
Cancel/print statistics
Fade out zero setting value
Accept master value
Fade out master value
Group 3:
Zero setting
Accept upper tolerance limit
Accept lower tolerance limit
Cancel error signal
BCD output (X7/1 ... X7/10, X7/19 ... X7/27, X7/34 ... X7/44)
The BCD output consists of 21 lines which serve for outputting five digits and
a sign. Depending on the configuration, either the master value or the currently
valid measuring value are output.
The individual digits are BCD coded (8-4-2-1), the least significant digit being
D1out - C1out - B1out -A1 out.
Configuration
Output via the BCD
outputs
Output rate
Meas. val.
Measuring value
(actual value)
5 values/s (200 ms)
Master value
Master value
only in case of changes
Changing the configuration:
1. Actuate the key Konfig. on the rear of the instrument.
2. Use
and
or
or
to select one of the parameters "Meas. val." or "Master val."
to change them.
BCD-Hold (X7/X17)
By activating this input signal, the output value remains unchanged, while the
internal measuring value processing continues uninfluenced. This function
should be used when transferring data via the BCD outlet to a connected instrument.
29
BCD input (X7/13 ... X7/16, X7/46 ... X7/49)
BCD data are transferred to the VMF 2000 in the multiplex mode. Eight input
lines allow to read in two digits simultaneously. The strobe outputs S1, S2 and
S3 indicate the digits that are being input at the moment.
S1 :
S2 :
S3 :
sign and first digit (most significant digit)
second and third digit
fourth and fifth digit (least significant digit)
The most significant BCD coded digit is reserved for the sign (D2in-C2in-B2inA2in together with S1):
Line "A2in" inactive (= no current flowing)
Line "A2in" active
(= current flowing)
:
:
positive sign
negative sign
The strobe pulses S1, S2 and S3 which are created by the VMF 2000 feature
a pulse width of about 100 ms. There is a pause of 50 ms between the individual strobe pulses. At the latest, the BCD data have to be valid about 100 µs
before reaching the negative flank of the strobe pulse. The data can be fed in
directly via BCD coded switches. In case data are to be read in from computers or intelligent control circuits, the transfer of the BCD data must be synchronized with the strobe pulses generated by the VMF 2000.
S3
(X7/45)
S2
(X7/12)
S1
(X7/11)
BCDinput
LSD
MSD
100 ms
50
100
50
100
Fig. 8
Time-varying assignment of the strobe inputs
Via the BCD inputs, either the master value or the lower or upper tolerance
limits can be input.
For activating BCD switches, a resistor of 220 Ohm/1 W has to be connected
in series to the output.
Accepting the master value (X7/50)
The master value must be applied to the BCD input for at least one multiplex
period (3 * 150 ms). After having activated the input "Accept nominal value",
the VMF 2000 employs the read-in value as the new master value.
The VMF 2000 always assigns a negative sign to the master value, irrespective of the sign fed in via the corresponding input line.
30
Accepting the upper and lower tolerance limit (X8/46, X8/47)
The BCD value for the upper or lower tolerance limit must be applied to the
BCD input for at least one multiplex period (3 * 150 ms). After activating the
input signal "Accept upper tolerance limit" or "Accept lower tolerance limit", the
entered value (with sign) will be used as the new tolerance limit. When activating the "Accept ..." signal, the read-in value will be output via the BCD outlet
for check purposes.
Fading out the master value (X8/13)
For as long as this input signal is active, the master value will not be considered for the result calculation. This function has effects on all output channels, i.e. on the indications as well as the analogue outputs. The letter "S" only
lights up in the text indication if the master value is displayed.
Example:
Input
"Fade out nom.
value"
Result of the
combination
Numerical
display
Text indication
off (inactive)
on (active)
946.0 µm
946.0 µm
- 54.0 µm
946.0 µm
S 1000.0
1000.0
Master value equals presetting (X8/6)
This output signal is active, whenever the value across the BCD inputs equals
the master value which was either adjusted with signal "Accept nominal value"
or entered via the keyboard.
Fading out the zero setting value (X8/44)
When calling up this function, the stored zero setting value will be set to "0",
i.e. a preceding zero setting process will be cancelled. The stored zero setting
value will be deleted.
Example:
The current zero setting value is 57.6 µm.
Indication before "Fading out the zero setting value":
82.7 µm - 57.6 µm= 25.1 µm
Indication after "Fading out the zero setting value":
82.7 µm - 0.0 µm = 82.7 µm
Enter calibration value (X5/5)
The calibration value must be applied to the BCD input for at least one multiplex period (3 * 150 ms). After activating the input signal "Enter calibration
value" the entered value will be used as the new calibration value. The calibration value is always entered with positive sign.
31
Zero setting (X8/45)
This input signal adjusts the current indication value to zero or to the master
value, respectively. The zero setting is confirmed via the X8/8 output and is
performed as long as the X8/45 input is activated.
The VMF 2000 sets the zero setting value to the combination result.
The VMF 2000 subtracts the zero setting value from the combination result
and adds the master value.
Combination result – Zero setting value + Master value = Indication value
Example:
Before "Zero setting":
82.7 µm - 0.0 µm + (-100 µm) = - 17.3 µm
After "Zero setting":
82.7 µm - 82.7 µm + (-100 µm) = -100 µm
Confirming the zero setting (X8/8)
This input signal confirms the "Zero setting" signal.
*
The function "Zero setting" sets both measuring channels (transducer A + transducer
B) to zero. The individual transducer values can be output via the analogue outputs or
can be inquired via the computer interface with M98/M99.
**
(transducer A - zero setting value A) + (transducer B - zero setting B) + Master value =
indication value
Example:
Before "Zero setting":
(43.7 µm - 0.0 µm) + ((-22.3 µm) - 0.0 µm) + (-100 µm) = -78.6 µm
After "Zero setting":
(43.7 µm - 43.7 µm) + ((-22.3 µm) - (22.3 µm)) + (-100 µm) = -100 µm
32
Selecting the indication range of the dial-type indicator
(X8/14 ... 17, 48 ... 50)
The indication range of the dial-type indicator can be selected via the inputs
"R1in" to "R7in". Since the VMF 2000 features a total of nine indication ranges,
the assignment of the control inputs to the indication ranges depends on the
instrument configuration.
Configuration
R1in
R2in
R3in
R4in
R5in
R6in
MR. * 1
1
3
10
30
100
MR. * 10
10
30
100
300
1,000
Explanation:
300
R7in
1,000
3,000 10,000
With the configuration "MR.*1", signal "R4in" adjusts an indication range of 30 µm whereas a range of 300 µm will be adjusted with the same signal, if the configuration "MR. *10" is
adjusted.
If none of these inputs is activated when switching on the VMF 2000, the setting stored in the EEPROM is used.
The range of indication within one configuration setting can be changed by actuating the key
or
.
Changing the configuration:
1. Actuate the key Konfig. on the rear of the instrument.
2. Select one of the configuration parameters "MR.*1" or "MR.*10" with
.
3. Select the range of indication with the keys
and
or
.
4. If necessary, save the range setting permanently by means of the function
"Save".
Outputs for checking the indication range setting of the dial-type indicator (X8/1 ... 4, 34 ... 36)
Via the outputs "R1out" to "R7out", the indication range setting for the dial-type
indicator can be output. Here, the assignment between the indication ranges
and the outputs is also dependent on the instrument configuration.
Configuration
R1out
R2out
R3out
R4out
R5out
R6out
R7out
MR. * 1
1
3
10
30
100
300
1,000
MR. * 10
10
30
100
300
1,000
3,000 10,000
Explanation: With the configuration "MR.*1", the output "R4out" indicates a
range of 30 µm, while it indicates 300 µm for the configuration
"MR. "10".
33
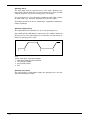
Symmetry (X8/11)
This input signal starts the symmetry process. The signal " Symmetry complete" will be switched off whenever a new symmetry process starts. It will be
switched on again as soon as the symmetry process is complete.
The symmetry process can be aborted by activating the input signal " Symmetry" again. In this case, the signal " Symmetry error" (X5/18) is output.
The balancing function can also be started via the configuration catalogue parameter "Symmetry".
Symmetry complete (X8/5)
This signal indicates the termination of a successful symmetry process.
After switching on the VMF 2000, this signal is not active. It will be switched on
after the first successful symmetry process and remains to be switched on until the next symmetry process starts.
1
2
3
4
Fig. 9
Course of the signal " Symmetry complete"
1 State when switching on the instrument
2 1st symmetry complete
3 2nd symmetry started
4 End
Symmetry error (X5/18)
This output signal is cancelled when starting the symmetry process and activated when aborting the function.
34
Transducer A or B overloaded (X8/7)
This signal will be activated, whenever one of the two analogue-to-digital converters is overloaded. This is the case, if the adjusted measuring range is exceeded by about 15 %. As soon as the overload is removed, the signal disappears.
Reject (X8/38), Rework (X8/37)
These two outputs signal the condition of the three pilot lamps for tolerance
monitoring. In case the result lies within the preset tolerance limits or tolerance
indication is switched off, the two outputs are inactive.
The assignment between the pilot lamps and the exceeded tolerance limits is
not fixed, but changes with the type of measurement (internal or external).
Thus, the valid assignment has to be adjusted in the instrument configuration
(see section "Tolerance monitoring").
Measuring value in case of
external meas.
internal meas.
Active output
Pilot lamp
red
< low. Tol.
> up. Tol.
Reject
> up. Tol.
< low. Tol.
Rework
low. Tol. < meas. value < up. Tol.
-
yellow
green
Blanking out a disturbance (interference) (X8/39)
Here, the detection of a disturbance and the start of the blank-out phase is
signaled. For as long as the disturbance takes place, the signal will be prolongated by multiples of 1.6 ms. After the disturbance disappeared, the signal
(and thus the blank-out time) will be extended by the holding time (see section
6.5 "Blanking out disturbances").
SI-Error, Error signal interference blanking (X8/41)
If the blank-out time exceeds the adjusted (error) delay time, the "SI-ERROR"
signal (error signal for interference blanking) will be activated. This signal remains to be active until the signal "Cancel error signal" is sent (see section
6.5 "Blanking out disturbances").
Cancelling the error signal (X8/9)
Via this input, the "SI-Error" signal is cancelled.
Transducer checking (X5/6)
This signal activates the transducer checking. The transducer checking is active until the signal is reset. When the transducer checking is deactivated, the
" Transducer checking error signal" (X5/19) is automatically reset.
Transducer checking error signal (X 5/19)
If the signal difference of a transducer after the preset time (tk[s]) is smaller
than the path (s(k)), the error signal X5/19 is set. If the function is activated,
the output can be reset via the input "Cancelling the error signal" (X8/9).
35
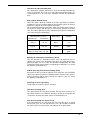
Print/cancel statistics (X8/43)
This input signal starts the printing out of statistical results via the serial interface "X10".
In case the input signal "Accept value into statistics" is activated simultaneously, all statistics registers are deleted. Therefore, printing out the results can
be repeated as often as desired (e.g. after paper jam) provided that the input
signal "Accept value into statistics" is not activated simultaneously.
Accept value into statistics (X8/42)
When activating this input, the measuring time is started according to the configuration setting ("STRT man"; "STRT Tm"; "STRT Tp").
If "STRT man" or "STRT Tp" has been chosen, the measuring time or the interval measurement is terminated when deactivating this input.
After the measuring time has run out, the result selected under "Sel.stat" is
accepted into the statistics. The measuring result is printed out if the printer interface has been activated in the configuration settings.
If "STRT Tm" has been chosen, the input has to be activated at least until the
preset measuring time has run out. If the input is deactivated before the
measuring time has run out, the measuring time will be aborted and the
measuring value will not be accepted into the statistics.
X8/42
X8/43
Print
n
1
2
3
...
5320
5321
Delete
Print
1
2
3
Fig. 10
Function of the input X8/42
Synchronization (start meas./ref.) (X8/10)
Via this input signal, the measuring/reference function, i.e. the zero point correction of a connected measuring instrument, is activated on the reference instrument (see section 6.6 "Zero point correction by means of the measuring/reference function").
Synchronization successful (X5/17)
Synchronization error (X5/16)
Both signals are cancelled when starting the function "Synchronize". In case
the harmonization of the zero points is successful, the X5/17 signal is activated. If an error occurs during the harmonization or if the calculated correction value exceeds the adjustable parameter "max.Corr.", the output X5/16 is
activated.
36
6.3
Adjusting the sensitivity
Deviations from the nominal sensitivity can be corrected for each transducer
by means of "Factor A" or "Factor B", respectively.
Besides the manual adjustment described in section "Correction factors", the
VMF 2000 also enables the automatic calculation and adjustment of correction
factors.
The automatic process is based on the comparison between the values assessed by the VMF 2000 (which, as the case may be, have to be corrected)
and a known increment which may be given, for example, by a gauge block.
Gauge block table
Before adjusting the sensitivity, it is indispensable to enter the height of at
least two gauge blocks into the gauge block table. One of the input values may
even be zero. The table may comprise up to 10 gauge block heights, which
makes it superfluous to specify gauge block heights whenever readjusting the
sensitivity.
Entering values into the gauge block table:
1. Actuate the key Konfig. on the rear of the instrument.
2. Use the keys
and press key
played.
and
to select the configuration parameter "G. block"
thereafter. The value for gauge block 1 will be dis-
3. If required, the value indicated for gauge block 1 can be modified by
means of the keys
,
and
.
4. Depress
. The value for gauge block 2 will be displayed.
5. Enter the value for gauge block 2 and, as the case may be, for further
gauge blocks.
6. Either press RESULT to return to the basic state, or press
the main catalogue and save the settings with "Save".
to return to
Adjusting the sensitivity:
1. Actuate the key Konfig. on the rear of the instrument.
2. Select the function "Sensit." with
or
and start it with
.
3. Now, "G. block 1" will be displayed together with the value entered into the
gauge block table. By using the key
or
, a different gauge block can
be chosen from the gauge block table. After having placed this gauge
block into the measuring device, the first measurement can be started with
.
4. As soon as the measurement is complete, the VMF 2000 offers another
gauge block. Again select the desired gauge block, insert it into the measuring device, and start the second measurement with
.
37
On the base of the two measuring results and the two nominal values, the
VMF 2000 calculates a correction factor "C" with which "Factor A" and "Factor
B" will be multiplied.
C=
Gauge block 2 - Gauge block 1
Measuring value 2 - Measuring value 1
As can be seen from the equation, only the differences in size are considered.
The input of the absolute gauge block values thus only serves for comfortable
operation.
"Factor A" and "Factor B" will be multiplied by the above-mentioned correction
factor "C":
Factor A (new)
Factor B (new)
=
=
Factor A (old)
Factor B (old)
*
*
C
C
In case of the transducer combinations +A, -A, +B and -B, only the sensitivity
of the selected transducer will be corrected, i.e. either "Factor A" or "Factor B".
In case of the transducer combinations
+A +B,
-A
-B,
+A
-B,
-A +B,
i.e. in case sum or differential measurements are to be carried out, the sensitivity of both transducers will be corrected ("Factor A" and "Factor B").
This, however, does only render correct results, if the transducers symmetry
has been balanced before the sensitivity was adjusted.
38
6.4
Balancing the Symmetry
Transducers and amplifier feature production-based sensitivity tolerances.
These tolerances cause a system-inherent error which is proportional to the
common deflection of the two transducers (above all in case of sum measurements). This error manifests itself for constant differential signals (touching
transducer tips, master measurement) in the form of a continuously increasing
or decreasing indication value, when moving the transducers together over the
entire measuring range. This error can be corrected by adapting "Factor A"
and "Factor B".
Balancing the Symmetry manually
1. Determine the stroke of the transducers. For this, select the transducer
combination "+A" or "+B". Afterwards, the transducers have to be moved
together from one stop to the other and the values indicated in the stop
positions must be noted. On the base of these values, the stroke will be
calculated.
Example:
lower stop : +A
upper stop : -A
stroke
:
= -1,980 µm
= 1,950 µm
1,980 µm - (-1,950 µm) = 3,930 µm
2. Adjust the transducer combination for sum measurements ("+A +B"). Together move the transducers from stop to stop and note the indicated values with the correct sign. Here, the direction of movement has to be taken
into account as well. Reading off the values will be simplified, if in one stop
and
.
position the indication is set to zero with the keys
Example:
For a deflection of 3,930 µm, the indicated value changes by
-25 µm. Here, transducer A was deflected in the positive,
transducer B in the negative direction. The change of -25 µm
shows that the transducer moved in negative direction, i.e.
transducer B, is too sensitive. The error relative to the entire
stroke is:
---25 µm
3930 µm
=0,006361
This means that transducer B features an oversensitivity of
0.64 % or, the other way round, transducer A features an insensitivity of 0.64 %.
Balancing can now be achieved by either changing "Factor
A" or "Factor B":
Factor A (new) = Factor A (old) * 1.006361
or
Factor B (new) = Factor B (old)
1.006361
39
Balancing the symmetry automatically:
Balancing the symmetry automatically is based on the manual process. All
necessary measurements, calculations and settings are automatically carried
out by the VMF 2000. It only has to be made sure that the transducers are deflected simultaneously.
Balancing the symmetry automatically can be started either via the "Symmetry" signal, the configuration catalogue function "Symmetry" or the computer
interface (P53/P59).
1. Depress the key Konfig. on the instrument's rear.
2. Use the key
start it.
or
to select the function "Symmetry" and press
to
3. Repeatedly move both transducers together from stop to stop. For every
second inversion of the direction of movement, a horizontal line will be indicated on the numerical display.
Throughout the first phase, the range to be balanced will be determined. The
VMF 2000 recognizes the range limits by the inversion of transducer signal A
(peak detector). First the positive, than the negative deflection of transducer A
will be assessed. The difference between the peaks must be
> 500 µm
> 50 µm
for the measuring range
for the measuring range of
± 2,000 µm or
±
200 µm .
This process will be repeated and the largest deflection reduced by 2.5 % will
then be assumed as travel limit.
In a second phase, the measuring values for determining the correction factor
will be assessed. For this, the transducer signal must exceed the range limits
determined before. After a 200 ms wait, the mean value of the transducer signals will be acquired for each transducer individually during the next 400 ms.
These measuring values are the base of the correction factor calculation:
Factor A (new) = Factor A (old) *
(Meas. value B) max - (Meas. value B) min
(Meas. value A) max - (Meas. value A) min
The second phase as well will be repeated and a new correction factor calculated, until "Factor A" and "Factor B" differ by less than one tenthousandth.
After successfully completing the symmetry process, the sensitivities of the
two transducers are harmonized with respect to each other. The output signal
"Symmetry complete" (X8/5) is activated. The absolute sensitivities, however,
are only correct, if the sensitivity of transducer B was adjusted correctly before
starting the balancing process.
In case the balancing process is aborted by activating the input signal " Symmetry " again, the output signal " Symmetry error" (X5/18) is set.
The " Symmetry complete" (X8/5) and " Symmetry error" (X5/18) outputs are
also set or cancelled when the synchronization is started via the keys or the
computer interface (P53).
40
6.5
Blanking out disturbances
In case of temporary disturbances (e.g. the lifting of a transducer), blanking is
to prevent the faulty signal to be fed to the control circuit via the analogue outputs. The blanking function will be activated whenever the adjusted signal increase speed is exceeded. The activation of this function has the effect that
the measuring value which was acquired immediately before the disturbance
appeared is continued to be sent for a longer time.
After the end of an adjustable holding time, the current measuring value will be
output again. The holding time is the time which elapses between the end of
the disturbance and the continuation of the measuring value output.
During blanking out, the output signal "Blanking out a disturbance" will be active.
If the blanking time exceeds the error indication delay time, the error is signalled via the output "Blanking out a disturbance". After having eliminated the
disturbance, this signal must be cancelled by another, namely "Cancel error
signal".
Please note that blanking out does only have an effect on the three analogue
outputs.
Blanking out can be adjusted via the following parameters:
Parameter
Text indication
adjustable range
max. allowed signal
increase speed
Slope
0 ... 999 µm/ms
Holding time
SI-Hold
0 ... 999.9 ms
(Error) Indication delay
time
SI-ERROR
0 ... 999.9 ms
At a holding time of 0.0 ms, blanking out is switched off.
Setting the parameters:
1. Actuate the key Konfig. on the rear of the instrument.
2. Select the parameter with the key
.
3. Choose further parameters with
tion with RESULT.
or
or
and adjust it with
,
and
or leave the parameter selec-
41
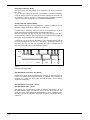
6.6
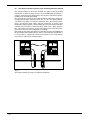
Zero point correction by means of the measuring/reference function
This function enables to correct the electrical zero point of every measuring
instrument in a control circuit by means of a second VMF 2000 operating as a
reference instrument. Only during tuning, the reference instrument operates
parallely to the measuring instrument.
The electrical zero point of the measuring instrument, which may change due
to temperature changes, transducer wear, etc., is to be corrected by comparison with the zero point of a reference instrument. Here, the reference instrument is presumed to keep stable, and both instruments to receive equal
though time-delayed signals. For determining the zero point, both instruments
calculate the mean value of their transducer signals over a given period of
time. The reference instrument sends its mean value to the measuring instrument which corrects its zero setting value accordingly.
Data between measuring and reference instrument are transferred digitally via
the electrically isolated serial interfaces X6. For correcting other instruments, it
is also possible to configure the reference instrument in such a way that the
mean value is output via an analogue output.
VOLLMER
VMF2000
X6
measuring instrument
X6
VOLLMER
reference instrument
Fig. 11
Zero point correction by means of a reference instrument
42
VMF2000
Correcting the zero point of a VMF 2000
The two instruments must be connected via their "X6" sockets (see figure of
the connecting cable in section 6.10). Data transfer between measuring and
reference instrument is accomplished via this interface.
In order to harmonize the zero points of the two instruments, the "Synchronize"
signal of the reference instrument (socket X8/10) will be activated. Whenever
the input "Synchronization" is activated, the "Meas./ref." function is restarted irrespective of the reference or measuring instrument. The reference instrument
now begins to communicate with the measuring instrument via the "X6" interface and starts the mean value determination. At the same time, the mean
value determination of the reference instrument commences. The process
ends
-
when the "Synchronize" signal is deactivated (for "Tman")
or
when the measuring time Tm is ended (for "Tm").
The operating mode "Tp" corresponds to the operating mode "Tman".
The reference instrument sends the established mean value to the measuring
instrument. The measuring instrument now corrects the so far valid zero setting value such that it indicates the same value as the reference instrument:
Zero setting value (new) =
Zero setting value (old) - (Mean value ref.ins - Mean value meas.ins)
The "Synchronization successful" (X5/17) output is activated when the measuring instrument is set to zero during the correction process (input of the
measuring value).
The maximum allowed correction can be limited by means of the parameter
"max.Corr." (in µm). In case the calculated correction value exceeds this parameter, no correction is accomplished and the output signal "Synchronization
error (X5/16)" is activated.
The speed with which the signal is set to the new corrected value can be adjusted by means of the parameter "s corr" (in µm/s).
Correcting the zero point of any other measuring instrument
If the parameter "max.Corr" is set to "0.0" in the reference instrument, the reference instrument outputs the mean value via the analogue output 3. This
voltage can be used as a correction value for any other measuring instrument.
43
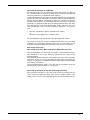
Taking the measuring point spacing into account
The delay time between the transducer signals of the two instruments is a
function of transport speed and measuring point spacing (in direction of transport). For sufficiently long measuring times, the time delay of the measuring
signals has practically no influence on the mean value. Thus, keying in the
transport speed and the measuring point spacing becomes superfluous, which
simplifies operation.
The error caused by the measuring point separation can be compensated for
by the time-delayed start of the value determination by the instrument receiving the time-delayed signal. Here, the delay time Td of the instrument is adjusted to the value:
Td =
Measuring point separation
Transport speed
Measured value
Measuring instrument
mvmeas
t
Measured value
Reference instrument
mvref
t
Time delay
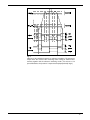
Fig. 12
Locally displaced measuring points (in direction of transport) cause a time delay between corresponding measuring values. The delay time can be calculated by the equation mentioned above. It is taken into account by entering a
Td value into the reference instrument (Mean = mean value).
44
Fig. 13
Flowchart of the zero point correction by means of the measuring/reference function
45
Zero setting value
TX+ (X6/3)
Mean value
determination
Synchronization
error (X5/6)
Synchronization
successful (X5/17)
Synchronization
(X8/10)
Measuring instrument
TX+ (X6/3)
Mean value
determination
Synchronization
error (X5/6)
Synchronization
(X8/10)
Synchronization
successful (X5/17)
Reference instrument
M
s
P
p
w
W.....<CR>
manual control without delay time
m
S
o
M
m
S
Tm
p
Tv
P
Tm
w
W.....<CR>
o
time-shifted control with delay time Td
s
Flowchart of the zero point correction by means of the measuring/reference function
6.7
Transducer checking
The " transducer checking" function outputs an error message, if the path covered by
one of the transducers after the preset time (Tk[s]) is smaller than the path s(k). This
serves for example to recognize if one of the transducers is sticking.
The signal differences of the individual transducers are evaluated for a preset time. If
the signal difference of one of the transducers after the preset time is smaller than the
path s(k), the error signal X5/19 is set.
The function is activated and deactivated via the input X5/6. When deactivating the
function, the error signal is automatically reset.
If the function is activated, the output can be reset via the input "Cancelling the error
signal" (X8/9).
The function can be switched off by entering 0 for s(k) or Tk[s].
Flow process diagram
Transducer is sticking
transducer
signal
Transducer is sticking
s(k) [µm]
X5/6
X5/19
X8/9
Activate
monitoring
Setting range
s(k)
:
0 µm ... 99.9 µm
Tk[s] :
0 s ... 9.999 s
46
Tk [s]
Reset error
Deactivate
monitoring
6.8
Linearization of transducer characteristics
The VMF2000 can linearize the characteristics of individual transducers. The
linearization is valid only for one individual transducer. After a replacement of
the probe it is necessary to linearize the new transducer once.
Linearization procedure
For each transducer a table is created which contains a correction value each
100 µm approximately. These correction values are subtracted from the
measured transducer values at the respective position. Values in between the
correction points are interpolated.
Manual entry of correction data
Each transducer has to be linearized individually. For that purpose the other
transducer has to be replaced by an adjustable stop, for example a micrometer. The reference for the linearization is a gage block. Before the linearization
procedure starts make sure that no offset has been introduced by the function
“zeroing” and the transducer travel is from +2100 µm to – 2300 µm.
The size of the gage block has to be entered in the configuration as parameter
„G. BL. 10“ (= gage block 10).
If necessary the old linearization data has to be cleared (see: „clear linearization table)
The linearization procedure is started via the function „AutoCorr“ in the menue
„ProbCorr“.
Next the respective channel and direction (sign) has to be selected, for example “Corr A+” as the linearization has to executed separately for channel A and
B and separately for the „plus“ and „minus“ direction.
The linearization may start at any point inside the measuring range but always
with the selected polarity.
It is recommended to start with the first point close to the transducers “zero” .
0“ und on the right the ac-
1.
On the left side of the display appears „M1
tual transducer position.
2.
Set transducer to approx. 0.0 without gage block.
3.
Accept M1 with ⇒ .
4.
On the display appears „M2
tered as “Gage block 10”)
5.
Insert gage block between adjustable Stop and transducer. Don’t move
the spindle position of the adjustable stop. Accept M2 with ⇒.
6.
The inclination of the curve is calculated and all entries of the linearization
table are corrected until the end of the measuring range.
7.
Again in the display appears „M1
0“ . The gage block has to be removed and the transducer touches the adjustable stop. The adjustable
stop now has to be moved to that position which the transducer had before with the gage block in this example 300 µm.
8.
Repeat step 3 to 6 up to the positive end of the measuring range. The
correction of each step starts with the correction point following the
measuring value „M1“
300“ (for example, if 300µm has been en-
47
9. After the positive part of the curve has been linearized the same procedure
has to be repeated for the negative part of the curve. Please note in case of
the negative part the first measuring has to be done with gage block and the
second measuring without gage block
The linearization may be repeated at any time at different points in order to
touch up the correction of the curve.
The precision of the calculation of the inclination is only influenced by the difference of the two measurements with and without gage block, not by the absolute value of the measurement.
Note :
If the error-message „Error“ appears when leaving the configuration at least one table entry has been calculated „out of
range“. The specific entry has to be decreased or the table
has to be cleared by „Clear A+“ or „Clear A-„.
The functions necessary for the linearization are called via the configuration menu „ProbCorr“.
ProbCorr
⇒
• A -xxxx.x
• A -yyyy.y
• ...
Entry of the linearization function
Correction table for channel A. With the right
arrow keys ⇑ and ⇓ the correction points can
be selected and if necessary changed with ⇒.
⇓
• B -xxxx.x
• B -yyyy.y
• ...
Correction table for channel B
⇓
AutoCorr
48
⇒
•
•
•
•
•
Korr A+ ⇒
M1
0 ⇒
M2 xxx ⇒
M1
0 ⇒
...
Linearization of transducer A with gage block in + direction
•
•
•
•
•
Korr AM1
0 ⇒
M2 xxx ⇒
M1
0 ⇒
...
Linearization of transducer A with gage block in - direction
•
•
•
•
•
Korr B+
M1
0 ⇒
M2 xxx ⇒
M1
0 ⇒
...
Linearization of transducer B with gage block in + direction
•
•
•
•
•
Korr BM1
0 ⇒
M2 xxx ⇒
M1
0 ⇒
...
Linearization of transducer B with gage block in - direction
⇓
Clear
⇒ Clear A+
Clears positive part of the correction table for transducer A
⇒ Clr ? ⇓
Confirm with ⇓ or abort with „Result“
⇓
Clear A-
Clears negative part of the correction table for transducer A
⇒ Clr ? ⇓
Confirm with ⇓ or abort with „Result“
⇓
Clear B+
Clears positive part of the correction table for transducer B
⇒ Clr ? ⇓
Confirm with ⇓ or abort with „Result“
⇓
Clear B-
Clears negative part of the correction table for transducer B
⇒ Clr ? ⇓
Confirm with ⇓ or abort with „Result“
⇒
Prints the correction table for A und B via printer port
⇓
Print
49
6.9
Instrument configuration
The instrument configuration level is reached by pressing the key Konfig. on the rear
of the instrument or, provided that the settings are not blocked by means of "Code", by
simultaneously actuating the keys F1 and F2.
Now, the desired parameter can be selected with key
(backward scrolling).
(forward scrolling) or
There are three possibilities for setting or changing parameters:
1. Parameters with several defined adjustments.
Adjust with
or
. Return with
or
.
2. Parameters to which numerical values are to be assigned.
Adjust with
,
, and
. Return with
or
.
3. Parameters with several assigned sub-parameters.
,
,
, and
.
Adjust with
Return with
.
As a rule, the instrument configuration level is left by pressing the key RESULT. Directly executed functions form an exception to this rule, for they automatically entail
leaving the instrument configuration.
50
List of configuration parameters
The following list shows the standard configuration to which the VMF 2000 is
adjusted on delivery.
Parameter
Indication
Tolerance monitoring
Selecting the result of tolerance monitoring
Hysteresis
Number of classes
Measuring range
Transducer combination
Adjusting the sensitivity of transducer A
Adjusting the sensitivity of transducer B
Measuring value integration time
Selecting the result to be indicated
Indicating the combination
Indicating the statistics
Selecting the mode of indication
Resolution of the numerical display
Unit
Language
Brightness of the display
Calibrating the dial-type indicator
Statistics
Selecting the statistical results
Number of results to be evaluated statistically
Statistical printout
Deleting the last statistical result
Deleting the statistics completely
Controlling the measuring time Tm
Delay time
Measuring time
Pause time betw. cyclical repet. of meas. runs
Input/output parameters (computer interface)
Printer parameters (printer interface)
Gauge block table
Probe correction (linearization)
Sensitivity
Transducer symmetry
Max. allowed offset correction
(measuring/reference function)
Setting speed of offset correction
Sensitivity adjustment of the analogue output 1
Sensitivity adjustment of the analogue output 2
Sensitivity adjustment of the analogue output 3
Zero point setting of the analogue outputs 1 ... 3
Selecting the value to be output via DAC 1 ... 3
Max. allowed blanking increase speed
Holding time
Max. allowed error indication delay time
Min. path for transducer checking
Time stretch for transducer checking
Sel. val. to be output via BCD output (mas./act. val.)
Indication range setting for the dial-type indicator
Input/output test
Configuration lock
Configuration printout
Standard configuration
Saving the settings
Tol. off
Sel. tol
Hystere.
Classes
MR. ± 2000
C:+A+B
Factor A
Factor B
Ti [ms]
Sel. res
DispCOMB
DispSTAT
Sel. ins
Resol.
Unit
English
Bright. 4
Cal.inst
Stat.off
Sel.stat
n max
PrntStat
Clr xn
Clr stat
STRT man
Td [s]
Tm [s]
Tp [s]
I/O para
Prntpara
G.block
ProbCorr
Sensit.
symmetry
max.corr.
corr.v
Fac.-DA 1
Fac.-DA 2
Fac.-DA 3
Adj.-DAC
Comb.DAC
Slope
SI-Hold
SI-ERROR
s (k)
Tk [s]
Nom. val.
MR. *10
IO-Test
lock off
PrntConf
s.config
Save
51
Configuration parameter
Menu
Settings
(Indication) /Indication
Explanations
Parameter settings 1 = on; 0 = off
Tolerance monitoring
Tol. off
Tol. off
Tolerance monitoring switched off. It is not possible to
adjust upper or lower tolerance limits for tolerance monitoring.
Tol –>I I<–
Tolerance monitoring switched on:
ments
Tolerance monitoring switched on:
ments
Tol I<– –>I
external
measure-
internal
measure-
With tolerance monitoring switched on, it is possible to
adjust tolerance limits. During measurement, three different results can be output:
- Reject (red pilot lamp),
- Rework (yellow pilot lamp),
- Accept (green pilot lamp).
For tolerance monitoring, it is indispensable to determine
the result to be monitored. This can be done via parameter "Selecting the result for tolerance monitoring" (Sel. tol).
Selecting the result
for tolerance monitoring
and classification
Sel. tol
Combine
MAX
MIN
(MX+M)/2
0/1
0/1
0/1
0/1
MAX-MIN
0/1
MEAN
0/1
Measuring result acc. to transducer combination
Maximum value of a dynamic measurement
Minimum value of a dynamic measurement
Mean of the maximum and minimum value of a dynamic
measurement
Difference between the maximum and minimum value of
a dynamic measurement
Mean value of all individual results assessed throughout
the measuring time Tm
Only one of the listed results can be chosen.
- Press
.
- Use
to select the desired result.
- Actuate
or
to switch the result to 1 (= on).
- Complete the selection by pressing RESULT or return
to the configuration catalogue by actuating
.
Hysteresis of
tolerance monitoring
and classification
Hystere.
0.00 ... 99.99 (µm) Adjusting the hysteresis for symmetrically
extending the class limits.
The standard setting for this parameter is 1 µm.
Number of classes
Classes
0 ... 32
Measuring range
MR.± 2000
MR. ± 200
52
Adjusting the number of classes. The range between the
upper and lower tolerance limit is divided into n classes of
equal width. On entering "0", no classification will be carried out. The classification results can be printed out by
activating the function "Prntstat".
The instrument features two measuring ranges, namely
measuring range ± 2,000 µm (resolution 0.1 µm)
measuring range ± 200 µm (resolution 0.01 µm)
Transducer combination
C: +A +B
Select the transducer with
and adjust the sign
with
. On entering "0", the transducer in question is
not taken into consideration.
Adjusting the sensitivity
Factor A
Factor B
Each probe value is multiplied with an individual factor.
Thus, sensitivity deviations can be corrected. On entering
"0.0", the probe in question is not taken into consideration.
Measuring value
integration time
Ti [ms]
Selecting the results
Sel. res
1.6
3.2
6.4
12.8
25.6
51.2
102.4
204.8
409.6
(milliseconds)
Every 1.6 milliseconds, a measuring value will be acquired. From these values, the instrument calculates a mean
value which is related to a certain interval of time, namely
the measuring value integration time Ti.
The standard setting for this parameter is 102.4 milliseconds.
A reduction of the integration time is reasonable if very
fast updating of the measuring value acquisition is the
point.
Prolonged integration times stabilize the measuring value
indication in case of vibrations influencing the measuring
set-up, for example.
Selecting the results which are to be indicated by actuating the key RESULT.
Combine
MAX
MIN
(MX+M)/2
0/1
0/1
0/1
0/1
MAX-MIN 0/1
MEAN
0/1
n
xn
x
s
Xmax
Xmin
R
0/1
0/1
0/1
0/1
0/1
0/1
0/1
Cp*
Cpk*
0/1
0/1
Measuring result acc. to transducer combination
Maximum value of a dynamic measurement
Minimum value of a dynamic measurement
Mean of the maximum and minimum value of a dynamic
measurement
Difference between the maximum and minimum value of
a dynamic measurement
Mean value of all individual results assessed throughout
the measuring time Tm
Statistical results
Number of measurements or results
Ultimate measuring result
x-bar, arithmetic mean of all meas. results
Standard deviation
Maximum value
Minimum value
Range, i.e. difference between the largest and the smallest result of all measurements
Theoretical process capability
Actual process capability
Cp* and Cpk* are calculated neglecting the normal distribution.
Any number of parameters can be selected.
Indicating the
combination
DispCOMB
0
1
The combination (e.g. +A+B) can be indicated with or
without the master value. This function only affects the
numerical indication. The dial-type indicators, the printout
of the measuring value and the output via the computer
interface are not influenced by this function.
Indication of the combination without master value
Indication of the combination with master value
53
Configuration parameter
Menu
Settings
(Indication) /Indication
Explanations
Parameter settings 1 = on; 0 = off
Indicating the statistics
DispSTAT
The statistical values can be output as follows:
Only measuring result
Measuring result - master value
Measuring result + nominal value
Measuring result - master value + nominal value
A change will affect all output media (numerical and
printer interface). As long as the function "Fading out the
master value" is active, no values have to be accepted
into the statistics.
0
1
2
3
Selecting the mode
of indication
Resolution of the
numerical display
Sel. ins
1
The numerical display and the dial-type indicator indicate
the same value (default setting).
2
The dial-type indicator always shows the current measuring value, while the numerical display shows the result selected with RESULT.
Resol.
Reducing the number of digits after the comma for indications on the numerical display.
No digit after the comma.
One digit after the comma.
Two digits after the comma (only possible with a measuring range of ± 200 µm).
0.
0.0
0.00
Unit
Unit
µm
inch
The selected setting is indicated by the µm or µinch indicator.
Language
English
English
Deutsch
FRANCAIS
Texts are given in English.
Texts are given in German.
Texts are given in French.
Brightness of the
display
Bright. 4
Bright. 4
Bright. 3
Bright. 2
Bright. 1
Brightness 100 %
Brightness 75 %
Brightness 50 %
Brightness 30 %
Calibrating the
analogue instrument
Cal. inst
I–>0<–I
I 0–>I
I<–0 I
Statistics
Stat. off
Stat. off
Stat. on
Selecting the statistical
results
Sel. stat
54
Combine
MAX
MIN
(MX+M)/2
±0
+10
-10
Use key
for subsequently calling up zero point, the
right- and the left-hand end-scale deflection.
If the pointer deflection does not agree with the scale, the
pointer position can be corrected (calibrated) electronically with the keys
and
.
This calibration setting is to be stored with "Save" (see
below).
The statistics is switched off.
The statistics is switched on. The statistics can be run for
up to 25,000 individual values.
0/1
0/1
0/1
0/1
Selection of the result for which to run the statistics:
Measuring result acc. to transducer combination
Maximum value of a dynamic measurement
Minimum value of a dynamic measurement
Mean of the maximum and minimum value of a dynamic
measurement
MAX-MIN
MEAN 0/1
0/1
Difference between the maximum and minimum value of
a dynamic measurement
Mean value of all individual results acquired during the measuring time Tm
Number of results to be
evaluated statistically
n max
Restricting the number of measurements to be evaluated
statistically. As soon as the value input for "n max" is
reached, it is no longer possible to take measurements.
Input range: 0 ... 25,000.
(0 = no restriction)
Statistical printout
PrntStat
Start the printing out of the statistics by actuating the
key. After printing out, the instrument is in its basic condition.
Deleting the last
statistical result
Clr xn
n-1?
The last statistical result can be deleted.
- Press key
.
- Answer the safety inquiry with
.
The last value will be deleted from the statistics and the
instrument will return to its basic condition.
n = 0?
The statistics can be deleted completely.
- Actuate key
.
.
- Answer the safety inquiry with
The statistics will be deleted and the instrument will return
to its basic condition.
Deleting the statistics
completely
Controlling the
measuring time Tm
Clr stat
STRT man
The measuring run is started with START and ended
whenever wanted by actuating START again.
STRT Tm
The measurement is started by pressing the key START
and ends automatically after the preset measuring time
Tm.
STRT Tp
Measurement starts when actuating the key START and
ends after a preset measuring time Tm. After a pause
time Tp, the next measurement is started automatically.
This cycle will be repeated until the key START is
pressed again or the number of measurements "n"
equals the value entered for "n max".
Tm and Tp can be adjusted to values in a range between
0.01 and 999.99 seconds.
Input/output parameters for
the serial interface (X10)
I/O para
computer
0/1
switches the computer interface on/off.
Baud 9600
4800
2400
1200
600
300
150
75
Data transfer rate (Baud rate)
Rec. XON
Rec.--
Record type X ON/X OFF
No record
55
Configuration parameter
Menu
Settings
(Indication) /Indication
Explanations
Parameter settings 1 = on; 0 = off
Data format/parity check:
8 data bits, no parity check, 1 stop bit.
7 data bits, no parity check, 2 stop bits.
7 data bits, odd parity check, 1 stop bit.
7 data bits, even parity check, 1 stop bit.
Char 8n1
Char 7n2
Char 7o1
Char 7e1
Printer parameters
(X9 interface)
Prnt Para
Printer
Sel.prnt
Num.
Combine
MAX
MIN
(MX+M)/2
0/1
0/1
0/1
0/1
0/1
0/1
MAX-MIN
0/1
MEAN
0/1
n
xn
x
s
Xmax
Xmin
R
Cp*
Cpk*
0/1
0
0/1
0/1
0/1
0/1
0/1
0/1
0/1
Switches the printer interface on/off.
Selection of the res. to be printed out from the below list:
Result number
Measuring result acc. to transducer combination
Maximum value of a dynamic measurement
Minimum value of a dynamic measurement
Mean value of the maximum and minimum value of a
dynamic measurement
Difference between the maximum and minimum value of
a dynamic measurement
Mean of all individual values assessed during the measuring time Tm
Number of measurements or results
Last measuring result (always switched off)
x-bar, arithmetic mean of all meas. results
Standard deviation
Maximum value
Minimum value
Range = Xmax - Xmin
Theoretical process capability
Actual process capability
*Cp* and Cpk* are calculated neglecting the normal distribution.
It is possible to select as many results as desired. (The
width of the paper to be used for printing, however, has to
be taken into account).
Cust. Tx.
Input!
0 ... 56 Charac.
Format 0/1
56
Customer-specific text. By means of a terminal or a computer, it is possible to enter a text via the RS 232 C interface, which then serves as record head.
The default text of the standard configuration, however, will be overwritten:
- Connect the terminal or the computer to the serial
interface X9 of the VMF 2000.
- Set the Printer parameters (Prnt para) to "Cust.Tx"
- Press key
.
- The entered text is transferred from the computer to
the VMF 2000. In the numerical display, each character of the text is counted.
- Press key
, as soon as the text was transferred
completely.
- Use the parameter setting "Save" to permanently
store the customer-specific text.
The above procedure can be aborted with RESULT.
Formatted output on the printer
0 = unformatted measuring record, without record
head and form feed
1 = measuring record with record head and form feed
(FormFeed)
Baud 9600
4800
2400
1200
600
300
150
75
Data transfer rate (Baud rate)
Rec.XON
Rec. --
Record type X ON/OFF
No record
Char 8n1
Char 7n2
Char 7o1
Char 7e1
Data format/parity check:
8 data bits, no parity check, 1 stop bit.
7 data bits, no parity check, 2 stop bits.
7 data bits, odd parity check, 1 stop bit.
7 data bits, even parity check, 1 stop bit.
Gauge block table
G.block
For adjusting the transducer sensitivity (see "Sensit"), the
heights of two gauge blocks are required. This table may
comprise up to 10 gauge block heights.
On pressing , the value for gauge block 1 is displayed.
to select one of the 10 gauge block heights.
Use
Press
,
and
to modify the numerical value.
to return to the main catalogue.
Use
Transducer Correction
ProbCorr
Corrects (linearises) the curve of transducer A and
transducer B respectively.
A-3036.4
View/edit correction table of transducer A.
The number at the right of the “A” is the uncorrected (raw)
value of the transducer. On the right large display the
correction value is displayed.
The correction value is edited by means of ,
and
B-3033.1
Correction value table for transducer B
AutoCorr
starts the automatic correction. The correction is
done separately for each transducer in + and – direction.
Corr A+
step by step linearization of the positive direction of
transducer A
Corr ACorr B+
Corr BClear
Clears the linearization tables. For each transducer
the + and – direction is cleared separately
Clear A+
Key
clears the positive direction of the linearization
table for transducer A. The prompt “Clr ?” has to be
confirmed by , otherwise the function is aborted
without clearing the table.
Clear A-
same for the negative direction
Clear B+
Clear BPrint
prints the correction tables via the RS232 “Printer”
57
Configuration parameter
Menu
Settings
(Indication) /Indication
Explanations
Parameter settings 1 = on; 0 = off
Sensitivity
Sensit.
The transducer sensitivity is corrected by comparing with two
known values and changing the factors "Factor A" and/or "Factor B".
Press key
.
G.block 1 xxx.x
Use
and
to select the first gauge block. After having
placed this gauge block into the measuring device, the first
measurement can be started with .
G.block 2 xxx.x
With
and
, a different gauge block can be chosen. Start
the second measurement with .
OK!
By means of this confirmation, the instrument returns to its basic
condition.
Erroneous inputs are signaled by the message "Stop". The instrument also returns to its basic condition and the procedure
must be repeated completely.
NOTE
In case one of the probe combinations +A, -A, +B, or -B was
selected, only the sensitivity of the transducer in question will be
corrected. For sum or differential measurements, the sensitivities of both transducers are influenced. Correct results can only
be obtained, if the two transducers are deflected to the same
extent.
Transducer symmetry
Symmetry
The sensitivity of transducer A will be adjusted to that of
transducer B. Here, "Factor A" will be changed as required, while "Factor B" remains unchanged.
.
Press key
Deflect the transducer over the range to be balanced.
First, the VMF 2000 recognizes the range limits by the reversion of the transducer ' direction of movement. During
the transducer ' deflection, measured values are assessed over this range and a correction factor is calculated for transducer A. This process is repeated until two
successive correction values differ by less than 0.0001.
Only then will "Factor A" be changed.
OK!
The symmetry function is ended successfully. The instrument returns to its basic condition.
Max. correction value
max. corr.
Maximum allowed value by which the zero point (offset) is
allowed to be changed by the measuring/reference function. On entering "0", the correction value is not transferred to the measuring instrument, but output via the
analogue output 3 of the reference instrument.
Setting speed of the zero
setting value
corr v
Speed [µm/s] with which the zero setting value is changed to the corrected value during the measuring/reference function.
Adjustable range: 0.2 ... 60 µm/s.
58
Sensitivity adjustment
of the analogue outputs
Fac.-DA 1
Fac.-DA 2
Fac.-DA 3
Adjustable range 0 ... 150 mV/µm
(analogue output 2 set to "DAC2-rel" : 0 ... 150 V/full scale
deflection of the dial-type indicator).
Zero point setting
of the analogue outputs
Adj.-DAC
DAC1->0<DAC2->0<DAC3->0<-
Use
to select the output.
Set the zero point with
and
Selecting the value to
be output via the
analogue outputs
Comb.DAC
Press
.
Set the value to be output via the analogue
output 1 with
and
.
Combination result (A+B or A-B)
Transducer A
Transducer B
0 V (switched off)
.
DAC1
DAC1
DAC1
DAC1
C
A
B
off
DAC2
C
Press
and adjust the value to be output via the analogue output 2 as well.
DAC3
C
and adjust the value to be output via the anaPress
logue output 3 as well.
...
Press
.
Use
and
to adjust the analogue output 2 to an output which is dependent on the indication range (0 ... 150
V/full-scale deflection of the dial-type indicator)
or to an output which is independent of the indication range
(0 ... 150 mV/µm).
DAC2-rel
DAC2-fix
Parameters of the interference blanking
Max. allowed signal
increase speed
Slope
0 ... 999 µm/ms
Holding time
SI-Hold
0 ... 999.9 ms
Minimum duration for blanking out disturbances.
Error indication
delay time
SI-Error
0 ... 999.9 ms. If the holding time exceeds the error indication delay time, the "IB-ERROR" signal is activated.
Parameters of the probe checking
Min. path
s (k)
0 ... 99.9 µm
Time stretch
Tk [s]
0 ... 9.999 seconds
Selecting the value to be
output via the BCD output
Nom. val.
Act. val.
Use
and
value output.
Indication range setting
for the dial-type indicator
MR. *1
The inputs "R1in" to "R7in" set the indication ranges
± 1, ± 3, ± 10, ± 30, ± 100, ± 300, ± 1,000 µm
or
± 10, ± 30, ± 100, ± 300, ± 1,000, ± 3,000, ± 10,000 µm.
MR.*10
Input/output test
to select between master and actual
IO-Test
X7-P02 O
0
Press
.
The signal of socket X7, pin 02 is being tested. Here, a signal is output, the current signal state being "0".
With
, the state of the output can be changed.
Use
/
to indicate the state of the following or preceding input or output.
59
Configuration lock
Lock off
Code
Block?↓
→0←?↓
Lock on
Lock off
Printing instrument
configuration
60
PrntConf
Any code number between 0000 and 9999 can be entered.
Safety inquiry
In case key
is pressed, the configuration setting is
blocked and "Block zero setting?" is displayed.
If the zero setting key (master) is also to be blocked,
press
again.
Actuating the keys
or
blocks only the instrument
configuration.
It is no longer possible to change parameters and settings. In order to guarantee configuration locking even after switching on again, it must be stored permanently by
means of function "Save".
The configuration locking is cancelled by entering a new
code number.
All settings of the VMF 2000 can be printed with PrntConf
(via the printer interface X10). If the printer interface is
deactivated, it is activated for the duration of the printing,
afterwards it is deactivated again.
Start printing with .
Configuration parameter
Menu
Settings
(Indication) /Indication
Explanations
Parameter settings 1 = on; 0 = off
Standard configuration
S. config
On delivery, the permanently stored standard configuration is active.
This configuration can be recalled at any time, although
measuring and configuration parameters could have
been changed and stored permanently. In order to remain active even after switching on again, the standard
configuration has to be stored by means of the function
"Save". Only on doing so, will be overwritten the customer-specific configuration.
If, however, the standard configuration is called up without being saved again, the customer-specific configuration is again valid after switching on.
Loading the standard configuration:
Press key
.
Saving the settings
Save
Yes: (↓)
If the now appearing safety inquiry is answered with
,
all currently valid settings will be overwritten.
If these settings were not stored permanently, they are
deleted irrevocably. The instrument returns to the basic
condition.
Stop !
If the safety inquiry is to be answered in the negative, either RESULT (leaving the configuration level) or one of
the keys
or
(staying in the configuration level) must
be actuated.
Save
Actuate the key
Yes:(↓)
If the safety inquiry is answered by pressing key
, all
current measuring and instrument configuration settings
will be stored permanently.
All settings valid before will be overwritten, i.e. deleted.
"OK!" will be displayed on the text indication.
OK!
.
If the safety inquiry is to be left unanswered, either actuate the key RESULT to leave the configuration level or
press one of the keys
or
to call up different configuration parameters.
61
62
6.10 Function keys
Frequently used functions or settings can be assigned to one of the function
keys, thus making them directly accessible.
The following functions can be assigned to the keys F1 and F2:
-
configuration parameter settings,
-
measuring condition settings,
-
indication of a certain measuring result, i.e. indication of the probe combination or a statistical result, for example.
Function key assignments can be stored as well by means of the function
"Save".
Assigning a function to F1 or F2:
For assigning any function to one of the function keys, the function in question
must be called up first. If, for example, the result MAX - MIN is to be assigned
to F1, select MAX - MIN and have it indicated by pressing the key RESULT.
Press Konfig. (on the rear of the instrument) and keep it depressed. Press
F1. "Prg. F1" appears on the text indication for a short time. Now, this result is
directly accessible by pressing the F1 key.
Deleting a function key assignment:
The assignment of a function key is deleted by keeping the key Konfig. on the
and F1 or F2.
rear of the VMF 2000 depressed and actuating the keys
This setting can be stored durably with "Save".
63
6.11 Serial interfaces
The VMF 2000 features two serial RS 232 C interfaces.
Interface X10 exclusively outputs measuring values and results on a printer.
The interface is adapted to the connected printer via the instrument setting
"Prntpara".
Interface X9 serves for communicating with a host computer. Measuring values and instrument parameters can be inquired and programmed by means of
the computer. The interface is adapted to the connected host computer via the
instrument setting "I/O para".
In case an interface is not connected or not used, the interface in question is
to be switched off in the instrument settings.
Adjustable parameters:
Data transfer rate (Baud rate):
75; 150; 300; 600; 1,200; 2,400; 4,800; 9,600 bits/second
Interface record:
Rec.no record
Rec.XON software handshake using the control characters XON = dec. 17
and XOFF = dec. 19
Data format:
Char 8n1 8 data bits, no parity check,
Char 7n2 7 data bits, no parity check,
Char 7o1 7 data bits, odd parity check,
Char 7e1 7 data bits, even parity check,
1 stop bit
2 stop bits
1 stop bit
1 stop bit
The pin assignment of the sockets is illustrated in section 6.11.
64
Host computer interface
Via the host computer interface, measuring values and results can be inquired, measuring conditions and configuration parameters inquired and programmed and functions activated.
Nomenclature
In the text passages of this section, commands will be marked by quotation
marks ("...") which are not part of the actual command. Those parts of the
commands given in parenthesis are optional,
e.g. P10 (,xxx.x (,yyy.y)) <Tcr>.
Brackets, however, signal ASCII control characters,
e.g. <CR> means "carriage return" = hexadecimal value "D" = dec. 13.
Command structure:
- A command sent by the host computer to the VMF 2000 usually consists
of an ASCII character string which must always be completed with the
control character <CR>. Any other control character is ignored by the VMF
2000.
-
The response of the VMF 2000 is completed with the control characters
<CR> and/or <LF>. After switching on the instrument, this end mark (designated <Tcr> here) is adjusted to the control character <CR>. It can be
changed by means of the parameter "P30,...".
-
An inquiry command starts with a letter followed by a parameter number.
Example: Inquiring measuring values (here: 896.3 µm)
Host computer: M1<CR>
VMF 2000: M1,896.3 <Tcr>
-
An adjustment command starts with a letter followed by a parameter number and the value of the parameter. The parameter number and the value
are separated by a comma.
Example: Adjusting the measuring range to ± 2,000 µm
Host computer: P1,2000<CR> VMF 2000: P1,2000<Tcr>
-
Several functions are activated by a single letter.
Example: Adjusting the indication to 0 or to the master value
Host computer: Z<CR>
VMF 2000: Z<Tcr>
-
Parameters and measuring values are always transferred as metric values
(µm), even if the instrument is adjusted to inch.
NOTE: In the provided examples, the command sequence sent by the host computer, which is
completed with <CR>, is, as a rule, given on the left-hand side, while on the right-hand
side the command sequence of the VMF 2000, which ends with <Tcr>, is provided.
65
Activating the interface software
The command "I<CR>" activates the interface software and causes it to output
an identification text, which among other data contains the version number of
the software.
Example:
I<CR>
I,VOLLMER GMBH,VMF2000,3.46<Tcr>
The interface software only has to be activated if it has been previously deactivated with "X<CR>".
Deactivating the interface software
After having deactivated the interface software with the command "X<CR>",
the VMF 2000 ignores any information sent by the host computer. The only
exception to the above statement is the command "I<CR>".
Example:
X<CR>
X<Tcr>
Control commands
Synchronous/asynchronous mode of operation:
After having activated the VMF 2000 by means of the command "I<CR>", it is
automatically switched to the synchronous mode of operation, i.e. the VMF
2000 does only send data if the host computer explicitly requests information.
In addition, it is possible to adjust the asynchronous mode of operation, during
which the instrument sends data on own initiative, e.g. the measuring value after the measuring time Tm or changes in the instrument settings (P34,...).
A<CR>
A<Tcr>
S<CR>
S<Tcr>
Sets the asynchronous mode of operation
(= switches off the synchronous mode).
Sets the synchronous mode of operation
(= switches off the asynchronous mode).
Starting/ending the measuring time:
Starting and ending the measuring time can be accomplished in three ways.
(For adjusting the measuring time, see "P10".)
F1<CR>
F1<Tcr>
F2<CR>
F2<Tcr>
F3<CR>
F3<Tcr>
Functions
R<CR>
R<Tcr>
Z<CR>
Z<Tcr>
Starts a measuring time, the end of which is
known (equivalent to the setting "STRT Tm").
Starts a measuring time of unknown end (equivalent to "STRT man" or "STRT Tp").
Ends the measuring time in case of setting
"STRT man" and cancels the measuring or
pause time when setting "STRT Tp" is active.
Resets the VMF 2000. The instrument returns to
the basic state which was active after switching
on.
Sets the indication to zero or to the entered master value, respectively.
NOTE: In the provided examples, the command sequence sent by the host computer, which is
completed with <CR>, is, as a rule, given on the left-hand side, while on the right-hand
side the command sequence of the VMF 2000, which ends with <Tcr>, is provided.
66
Outputting a value on the numerical display
T1,xxxx<CR>
T1,xxxx<Tcr>
T1,<CR>
T1, <Tcr>
Example:
T1,123.45<CR>T1,123.45<Tcr>
Outputting a text on the text indication field
T2,xxxx<CR>
T2,xxxx<Tcr>
Indicates the value on the numerical display
(only numerical values with sign and decimal point).
xxxx = decimal number with decimal point
max. 6.5 digits (1999999)
Restore previous indication.
The value 123.45 is indicated on the numerical display.
Indicates a text on the text indication field.
xxxx = max. 8 characters (ASCII text)
The entered text is shown left justified on the text indication
field.
T2,<CR>
T2,<Tcr>
Restores the previous indication.
Example:
T2,Hallo<CR>
T2,Hallo<Tcr>
The text "Hallo" appears on the text indication field.
Inquiring measuring values and results
In the measuring range ± 200 µm two digits follow the decimal point, in the measuring range ± 2,000 µm one digit.
M<CR>
Mn,xxx.x<Tcr>
default result type selected with "P32,..."; here, n is the number of
the chosen measuring value
result of the transducer combination
mean value over the measuring time Tm
minimum value during the measuring time Tm (MIN)
maximum value during the measuring time Tm (MAX)
MAX-MIN
(MAX-MIN)/2
M1<CR>
M2<CR>
M3<CR>
M4<CR>
M11<CR>
M12<CR>
M1,xxx.x<Tcr>
M2,xxx.x<Tcr>
M3,xxx.x<Tcr>
M4,xxx.x<Tcr>
M11,xxx.x<Tcr>
M12,xxx.x<Tcr>
M80<CR>
M82<CR>
M83<CR>
M84<CR>
M85<CR>
M86<CR>
M87<CR>
M88<CR>
M89<CR>
M98<CR>
M80,n <Tcr>
M82,xxx.x<Tcr>
M83,xxx.x<Tcr>
M84,xxx.x<Tcr>
M85,xxx.x<Tcr>
M86,xxx.x<Tcr>
M87,xxx.x<Tcr>
M88,xxx.x<Tcr>
M89,xxx.x<Tcr>
Maaaa,bbbb<Tcr>
n = number of values accepted into the statistics
statistical mean value
statistical minimum value (Xmin)
statistical maximum value (Xmax)
theoretical process capability Cp*
standard deviation
actual process capability Cpk*
range
ultimate measuring result xn
individual values of transducer A and B. The measuring values are
coded hexadecimally and have to be multiplied:
in measuring range ± 200 µm
by 0.01/256 µm;
in measuring range ± 2,000 µm by 0.1/256 µm.
M99<CR>
Maaaaaa,bbbbbb<Tcr>
individual values of transducer A and B. The measuring values are
coded hexadecimally and have to be multiplied:
in measuring range ± 200 µm
by 0.01/256 µm;
in measuring range ± 2,000 µm by 0.1/256 µm.
When the indicated value exceeds ± 3,276.7 µm in the measuring
range of ± 2,000 µm or ± 327.67 µm in the measuring range of ±
200 µm, the numbers "aaaa" and "bbbb" are extended to 6 hexadecimal digits for "M98" and to 8 for "M99".
67
Inquiring and adjusting parameters
Measuring range:
P1<CR>
P1,xxx.x<Tcr>
Inquires the measuring range setting.
Measuring range = xxx.x µm
Example:
P1,2000<CR>
P1,2000<Tcr>
Adjusts the measuring range to ▒ 2,000 µm.
Note: Function "Z" (set to zero) will be cancelled. Thus, a master
measurement has to be performed afterwards.
Example:
P1,1.85E+2<CR>
P1,200<Tcr>
Adjusts the measuring range to ± 200 µm.
The VMF 2000 selects the next larger measuring range.
Conversion factor, unit:
P3<CR>
P3,xxx.x,tt<Tcr>
Inquires conversion factor and unit.
Example:
P3<CR>
P3,1.0E-3,mm<Tcr>
Outputs the obtained measuring values in millimetres after conversion with factor 0.001.
Indication format:
P5<CR>
P5,6.5,x<Tcr>
Inquires the resolution of the numerical display.
6.5
number of digits (not adjustable)
x
number of digits following the decimal point
For the ± 200 µm measuring range 0 ... 2 digits can be set,
for the ± 2,000 µm measuring range 0 ... 1.
P5,<CR>
P5,6.5,x<Tcr>
Adjusts the maximum resolution.
Combination indication
P6<CR>
P6,x<Tcr>
Inquires the setting of the combination indication.
x = 0 combination without master value
x = 1 combination - master value
Example:
P6,1<CR>
P6,1<Tcr>
Sets the indication of the combination value to "combination with
master value".
Zero setting value
P7<CR>
P7,x<Tcr>
Inquires the status of the zero setting value.
x = 0 deactivates the zero setting value
x = 1 activates the zero setting value
Example:
P7,0<CR>
P7,0<Tcr>
Deactivates the zero setting value.
Master value:
P8<CR>
P8,xxx.x<CR>
P8,xxx.x<Tcr>
P8,xxx.x<Tcr>
Inquires the master value.
Adjusts the master value.
Example:
P8,530<CR>
P8,530<Tcr>
Sets the master value to 530 µm.
NOTE: In the provided examples, the command sequence sent by the host computer, which is completed with <CR>, is, as a rule, given on the
left-hand side, while on the right-hand side the command sequence of the VMF 2000, which ends with <Tcr>, is provided.
68
Measuring and pause time, start mode:
P10<CR>
P10,(xxx.x(,yyy.y))<Tcr>
Inquires measuring and pause time.
xxx.x = Tm, yyy.y = Tp
In case no argument is provided, the measuring time Tm is started
and stopped manually.
Sets the measuring time to be started and stopped manually
(equivalent to setting "STRT man").
Adjusts a measuring time Tm of 15 seconds (equivalent to setting
"STRT Tm").
Sets the measuring time Tm to 8 seconds and the pause time Tp to
1.5 seconds (equivalent to setting "STRT Tp").
P10,<CR>
P10,<Tcr>
P10,15<CR>
P10,15<Tcr>
P10,8,1.5<CR>
P10,8,1.5<Tcr>
Delay time:
P11<CR>
P11,1.2<CR>
P11,0.1<Tcr>
P11,1.2<Tcr>
Inquires the delay time, which in this case was set to 0.1 seconds.
Adjusts a delay time of 1.2 seconds.
Tolerance limits:
P21<CR>
P21,xxx.x,yyy.y<Tcr>
Inquires the tolerance limits.
The smaller of the two values is always taken to be the lower tolerance limit.
External measurement: xxx.x= lower tol. limit
yyy.y= upper tol. limit
Internal measurement: xxx.x= upper tol. limit
yyy.y= lower tol. limit
P21,xxx.x,yyy.y <CR>
P21,<CR>
P21,xxx.x,yyy.y<Tcr>
P21,<Tcr>
Adjusts the limits for tolerance monitoring (see above).
switches off tolerance monitoring.
Example:
P21,1E3,-500<CR>
P21,1000,- 500<Tcr>
Adjusts tolerance monitoring for internal measurements, the lower
tolerance limit to -500.0 µm and the upper one to 1,000.0 µm.
Classification, number of classes:
P26<CR>
P26,xx<Tcr>
Inquires the set number of classes.
xx = number of classes
Adjusts the number of classes "xx" and divides the range between
the upper and lower tolerance limit into xx classes of equal width.
Switches off the classification.
P26,xx<CR>
P26,xx<Tcr>
P26,0<CR>
P26,0<Tcr>
End mark <Tcr>:
P30<CR>
P30,xxx (,yyy)<CR>
P30,xxx(,yyy)<Tcr>
P30,xxx(,yyy)<Tcr>
Inquires the character sequence of end mark <Tcr>.
Sets the character sequence of the end mark to <Tcr>.
In place of the control character <CR>, the control character sequence "xxx,yyy" is sent. "xxx" and "yyy" are the decimal equivalents of the control characters.
Example:
P30,10,13<CR>
P30,10,13<LF><CR>
Sets the end mark sequence <Tcr> to the ASCII control characters
<LF> = dec. 10 and <CR> = dec. 13.
Default measuring value type:
P32<CR>
P32,n<Tcr>
P32,n<CR>
P32,n<Tcr>
Asks for the default measuring value type which is to be output in
the asynchronous mode or in case of measuring value inquiries accomplished with "M<CR>".
Sets the default measuring value type.
n = 1:
result of the transducer combination
n = 2:
mean value over the meas. time Tm
n = 3:
MIN value over the meas. time Tm
n = 4:
MAX value over the meas. time Tm
...
Continue as described in "Inquiring measuring values and
results" (see above).
69
Changed parameter settings:
P34<CR>
P34,n<Tcr>
Example:
P34<CR>
A<CR>
P34,83<Tcr>
Means that the range of indication was changed.
A<Tcr>
P34,19<Tcr>
Switches on the asynchronous mode.
Means that the master value was accepted.
Transducer combination:
P50<CR>
P50,n,m<Tcr>
P50,-1,2<CR>
P50,1<CR>
Inquires if parameters were changed by manual settings.
n = : number of the changed parameter
n = 0 : no parameter was changed
(In the asynchronous mode, any parameter change is reported
immediately.)
P50,-1,2<Tcr>
P50,1<Tcr>
Transducer combination, correction factors:
P51<CR>
P51,(tttt)<Tcr>
Inquires the transducer combination.
n=
1
+A
n=
-1
-A
m=
2
+B
m=
-2
-B
Sets the transducer combination to "-A+B".
Sets the transducer combination to "+A".
Note: In contrast to function "P51", the correction factors are not
influenced.
Inquires transducer combination and correction factors in the form
of an equation.
The transducer combination is presented by the symbols X1 or X2
(for transducer A or B, respectively) and is multiplied by the related
correction factors.
P51,tttt<CR>
P51,tttt<Tcr>
Adjusts transducer combination and correction factors.
Note: Function "Z" (accepting the master value) will be cancelled,
i.e. a master measurement must be taken thereafter!
Example:
P51,0.5*X1<CR>
P51,+.5*X1<Tcr>
Sets the transducer combination to "+A" and the correction factor
(Factor A) to 0.5.
Example:
P51,X1-X2<CR>
P51,+1*X1-1*X2<Tcr>
Sets the transducer combination to "+A-B" and the correction factors (Factor A and Factor B) to 1.0.
Correction factors:
P52,n<CR>
P52,n,xxx.x<Tcr>
Inquires the correction factor for transducer A (n = 1) or for transducer B (n = 2).
Example:
P52,2<CR>
P52,2,1.992<Tcr>
The correction factor for transducer B is 1.992.
P52,1,3,2,2.5<Tcr>
P52, 1,3,2,1.5<Tcr>
Sets factor A to 3.000 and factor B to 1.500.
Balancing the symmetry:
P53<CR>
P53<Tcr>
Activates the function "Symmetry". After successfully completing the
balancing process, the VMF 2000 acknowledges with "P53<Tcr>".
The balancing process can be aborted with "Q" or via the keyboard.
E53<Tcr>
Error during the balancing process or abortion.
NOTE: In the provided examples, the command sequence sent by the host computer, which is completed with <CR>, is, as a rule, given on the
left-hand side, while on the right-hand side the command sequence of the VMF 2000, which ends with <Tcr>, is provided.
70
Meas./ref function
P54<CR>
P54,x<Tcr>
Inquires the status of the meas./ref function.
x = 0 function has not yet been executed
x = 1 function is active
x = 2 function has been terminated successfully
x = 3 running error
P54,1<CR>
P54,0<CR>
P54,1<Tcr>
P54,0<Tcr>
Starts the meas./ref function.
Stops the measuring time of the meas./ref function.
Example:
P54,1<CR>
P54,0<CR>
P54<CR>
P54<CR>
P54,1<Tcr>
P54,0<Tcr>
P54,1<Tcr>
P54,2<Tcr>
Starts the meas./ref function.
Stops the measuring time.
Function is still active.
Function has been terminated successfully.
Error signal interferences blanking
P55<CR>
P55,x<Tcr>
Inquires the status of the error signal (X8/41).
x = 0 no error
x = 1 error signal is active (X8/41 output set)
P55,0<CR>
P55,0<Tcr>
Resets the error signal (X8/41 output).
Example:
P55<CR>
P55,0<Tcr>
Error signal not set.
Path (s(k)) for probe checking
P56<CR>
P56,xx.x<Tcr>
Inquires the setting of s(k).
P56,xx.x<CR>
P56,xx.x<Tcr>
Sets s(k) to xx.x µm.
P56,<CR>
P56,0<Tcr>
Sets s(k) to the standard value.
Example:
P56,10<CR>
P56,10<Tcr>
Sets s(k) to 10 µm.
Time (Tk[s]) for transducer checking
P57<CR>
P57,x.xxx<Tcr>
P57,xx.x<CR>
P57,xx.x<Tcr>
P57,<CR>
P57,.001<Tcr>
Inquires the setting of Tk.
Sets Tk to x.xxx seconds.
Sets Tk to the standard value.
Example:
P57,.01<CR>
Sets Tk to 10 ms.
P57,.01<Tcr>
Status of transducer checking
P58<CR>
P58,x<Tcr>
P58,0<CR>
P58,0<Tcr>
Inquires the status of the error signal (X5/19 output).
x = 0 no error
x = 1 error signal is active (AX5/19 output set)
Resets the error signal (X5/19 output).
Example:
P58<CR>
P58,0<Tcr>
Error signal is not set.
Balancing the symmetry:
P59<CR>
P59,x<Tcr>
P59,1<CR>
P59,1<Tcr>
Inquires the status of the symmetry function.
x = 0 function has not yet been executed
x = 1 function is still active
x = 2 function has been terminated successfully
x = 3 running error or abortion
Starts the balancing function.
71
P59,0<CR>
P59,0<Tcr>
Aborts the symmetry function.
Example:
P59,1<CR>
P59<CR>
P59<CR>
P59,1<Tcr>
P59,1<Tcr>
P59,2<Tcr>
Starts the symmetry function.
Function is still active.
Function has been terminated successfully.
Selecting the results to be indicated:
P60<CR>
P60,x,y,....,z<Tcr>
P60,1,11,88<CR>
P60,1,11,88<Tcr>
Selecting the results to be printed out:
P61<CR>
P61,x<Tcr>
Inquires the results to be indicated with RESULT.
x = 1 result of the transducer combination
x = 2 mean value over the meas. time Tm (MEAN)
x = 3 minimum value over the meas. time Tm (MIN)
x = 4 maximum value over the meas. time Tm (MAX)
x = 11 MAX-MIN
x = 12 (MAX+MIN)/2
Statistical results
x = 80 number of measurements (n)
x = 82 statistical mean value
x = 83 statistical minimum value (Xmin)
x = 84 statistical maximum value (Xmax)
x = 85 theoretical process capability Cp*
x = 86 standard deviation s
x = 87 actual process capability Cpk*
x = 88 range (Xmax - Xmin)
x = 89 last statistical result
With the key RESULT, it can be selected between indicating the
combination, MAX-MIN or R.
Asks for the result to be printed out after the end of the measuring
time or after activating "Prnt Stat"(x: see "P60,...").
Complement to the selection of the results to be printed out
P61<CR>
P61,x1,x2,...xn<Tcr>
Inquires the selection of the results which are to be printed with
PrntStat or after the measuring time has run out.
x = 0 numbers of selected results
x = 1 result of the probe combination
x = 2 mean value over the measuring time (MEAN)
x = 3 minimum value over the measuring time (MIN)
x = 4 maximum value over the measuring time (MAX)
x = 11 MAX–MIN
x = 12 (MAX+MIN)/2
Statistical results
x = 80 number of measurements (n)
x = 82 statistical mean value
x = 83 statistical minimum value (Xmin)
x = 84 statistical maximum value (Xmax)
x = 85 theoretical process capability Cp*
x = 86 standard deviation (s)
x = 87 actual process capability Cpk*
x = 88 Range (range = Xmax–Xmin)
P61,<CR>
Example:
P61,0,1,2<CR>
P61,0,1,2,80,82,83,84,85,86,87,88
Adjusts the standard selection.
P61,0,1,2<Tcr>
The measuring record includes the result number, the combination and the mean value. The statistics printout is deactivated.
NOTE: In the provided examples, the command sequence sent by the host computer, which is completed with <CR>, is, as a rule, given on the
left-hand side, while on the right-hand side the command sequence of the VMF 2000, which ends with <Tcr>, is provided.
72
Customer-specific text:
P62<CR>
P62,xxx,yyy,...,zzz<Tcr>
Inquires the customer-specific text. The ASCII characters are output as decimal numbers such that also control characters for formatting can be inserted into the text. The maximum number of
characters to be entered is 56.
P62,<CR>
P62,<Tcr>
Deletes the customer-specific text.
Example:
P62,86,79,76,76,77,69,82,32,71,109,98,72,13,10<CR>
P62,86,79,76,76,77,69,82,32,71,109,98,72,13,10<Tcr>
Enters "VOLLMER GMBH"<CR><LF> as customer-specific text.
Formatted printout
P65<CR>
P65,x<Tcr>
Inquires the settings of the measuring record.
x = 0 unformatted measuring record, without record head and
form feed
x = 1 measuring record with record head and form feed
P65,<CR>
P65,1<Tcr>
Activates the standard setting.
Example:
P65,0<CR>
P65,0<Tcr>
Sets the measuring record to "unformatted".
Analogue output sensitivity:
P70<CR>
P70,x,y,x,y,x,y,<Tcr>
Inquires the sensitivity settings of the analogue outputs.
x=
number of the analogue output (1 ... 3)
y=
sensitivity (in mV/µm or V/full scale deflection, in case output
2 is dependent on the indication range of the dial-type indicator).
P70,1,20,2,10,3,40<CR> P70,1,20,2,10,3,40<Tcr> Sets analogue output 1 to 20 mV/µm,
analogue output 2 to 10 V/full scale deflection,
analogue output 3 to 40 mV/µm.
Shifting the zero point of analogue outputs (Offset correction):
P71<CR>
P71,x,y,x,y,x,y,<Tcr>
Inquires the setting of the zero offset.
x = number of the analogue output (1 ... 3)
y = zero offset (has to be multiplied by 4.88 mV).
Example:
Analogue output 3 features a zero point error of 74 mV.
Zero offset: y = -74 mV/4.88 mV = -15.16
This value has to be added to the already adjusted zero offset:
P71,3<CR>
P71,3,-9<Tcr>
The adjusted zero offset is -9 * 4.88 mV.
The new value to be set is: -9-15 = -24.
P71,3,-24<CR>
P71,3,-24<Tcr>
Maximum inclination:
P72<CR>
P72,xxx.x<Tcr>
Inquires the setting of the maximum inclination for blanking out disturbances (in µm/ms).
P72,40<CR>
P72,40<Tcr>
Sets the max. inclination to 40 µm/ms.
73
Holding time:
P73<CR>
P73,.xxx<Tcr>
P73,.08<CR>
P73,0<CR>
P733,.08<Tcr>
P73,0<Tcr>
Error indication delay time:
P74<CR>
P74,.xxx<Tcr>
P74,.25<CR>
P74,.25<Tcr>
Selecting master value/measured value:
P75<CR>
P75,x<Tcr>
P75,1<CR>
P75,1<Tcr>
Selecting the analogue indication range *1/*10:
P76<CR>
P76,x<Tcr>
P76,1<CR>
P76,1<Tcr>
D/A-converter combination:
P77<CR>
P77,x,y,x,y,x,y<Tcr>
P77,1,3,2,2,3,1<CR>
P77,1,3,2,2,3,1<Tcr>
P77,3,0<CR>
P77,3,0<Tcr>
Inquires the adjusted holding time for blanking out disturbances
(in seconds).
Sets the holding time to 80 ms.
Holding time = 0 (blanking switched off)
Inquires the set error indication delay time for blanking out disturbances (in seconds).
Adjusts the error indication delay time to 250 ms.
Inquires the value to be output via the BCD outputs.
x = 0 master value output
x = 1 measured value output
The measured value is output via the BCD outputs.
Inquires the set analogue indication range.
x = 0 MR*1 (1 µm - 1,000 µm)
x = 1 MR*10 (10 µm - 10,000 µm)
Sets the analogue indication range to MR*10.
Inquires the values to be output via the analogue outputs.
x=
number of the analogue output (1 ... 3)
y=
identification of the value to be output
0 = no output via this output (always set to 0 V)
1 = value of transducer B
2 = value of transducer A
3 = transducer combination
Adjusts the value to be output via
analogue output 1 to transducer combination,
analogue output 2 to the value of transducer A,
analogue output 3 to the value of transducer B.
Switches off analogue output 3.
Making analogue output 2 dependent on/ independent of the indication range:
P78<CR>
P78,x<Tcr>
Inquires the setting of analogue output 2.
x = 0 dependent on the indication range
x = 1 independent of the indication range
P78,1<CR>
P78,1<Tcr>
Makes the analogue output 2 independent of the indication range.
The unit of the factor is mV/µm.
Calibration value
P79<CR>
P79,xxx.x<Tcr>
Requests the calibration value
P79,123.4
P79,123.4<Tcr>
sets the calibration value to 123.4 µm
Selecting the results for tolerance monitoring and classification:
P80<CR>
P80,n<Tcr>
Requests the selected results.
P80,n<CR>
P80,n<Tcr>
Adjusts the result to be output.
n = 1: result of the transducer combination
n = 2: mean value over the meas. time Tm
n = 3: MIN value over the meas. time Tm
n = 4: MAX value over the meas. time Tm
n = 11: MAX-MIN value over the meas. time Tm
n = 12: (MAX + MIN)/2 value over the meas. time Tm
Example:
P80,2<CR>
P80,2<Tcr>
Means that the mean value over the measuring time Tm will be
output.
NOTE: In the provided examples, the command sequence sent by the host computer, which is completed with <CR>, is, as a rule, given on the
left-hand side, while on the right-hand side the command sequence of the VMF 2000, which ends with <Tcr>, is provided.
74
Selecting the results to be evaluated statistically:
P81<CR>
P81,n<Tcr>
P81,n<CR>
P81,n<Tcr>
Example:
P81,2<CR>
P81,2<Tcr>
Printing, deleting, switching on and off the statistics:
P82<CR>
P82,s<Tcr>
P82,s<CR>
P82,s<Tcr>
Indication range of the dial-type indicator:
P83<CR>
P83,n,m<Tcr>
P83,n,m<CR>
P83,n,m<Tcr>
Example:
P83,4,2<CR>
P83,4,2<Tcr>
Inquires the result(s) to be evaluated statistically.
Adjusts the result(s) to be evaluated statistically.
n = 1: result of the transducer combination
n = 2: mean value over the meas. time Tm
n = 3: MIN value over the meas. time Tm
n = 4: MAX value over the meas. time Tm
n = 11: MAX - MIN value over the meas. time Tm
n = 12: (MAX+MIN)/2 value over the meas. time Tm
Means that the mean value is to be evaluated statistically.
Inquires the status of the statistics.
s = 0: statistics switched off
s = 1: statistics switched on
s = 2: delete last x (equivalent to "Clr xn")
s = 3: delete statistics completely (equivalent to "Clr stat")
s = 4 print statistical results
Inquires the adjusted indication range and the selected indication.
Adjusts indication range and indication.
n = 1: ± 1 µm
n = 2: ± 3 µm
n = 3: ± 10 µm
...
n = 9: ± 10,000 µm
n = 0: Rel. Tol.
m = 1: the numerical display and the dial-type indicator indicate the
same results.
m = 2: the dial-type indicator indicates the current measuring result, irrespective of the indication on the numerical display.
Sets the indication range to ± 30 µm. The dial-type indicator indicates the measuring value according to the set combination, while
the numerical display provides the result adjusted with the RESULT
key.
Maximum number of measurements:
P84<CR>
P84,x<Tcr>
P84,x<CR>
P84,x<Tcr>
Inquires "n max".
Sets "n max" to x.
Example:
P84,50<CR>
P84,50<Tcr>
Sets "n max" to 50.
Language:
P85<CR>
P85,x<Tcr>
Inquires the adjusted language.
x = 1: German
x = 2: English
x = 3: French
Example:
P85,3<CR>
P85,3<Tcr>
Sets the language to French.
NOTE: In the provided examples, the command sequence sent by the host computer, which is completed with <CR>, is, as a rule,
given on the left-hand side, while on the right-hand side the command sequence of the VMF 2000, which ends with <Tcr>, is
provided.
75
Unit:
P86<CR>
P86,x<Tcr>
Inquires the set system of units.
x = 1 : metric
x = 2 : imperial
Example:
P86,2<CR>
P86,2<Tcr>
Adjusts the imperial system of units.
Brightness:
P87<CR>
P87,x<Tcr>
Inquires the adjusted brightness of the display.
x = 1 ... 4
x = 4: brightness 100 %
P87,1<CR>
P87,1<Tcr>
Adjusts the brightness of the display to 30 %.
Indicating the statistics
P88<CR>
P88,x<Tcr>
Inquires the setting of the statistical indication
x = 0: indicating only measuring result
x = 1: indicating meas. result – master value
x = 2: indicating measuring result + nominal value
x = 3: indicating meas. result – master value + nominal value
Example:
P88,1<CR>
P88,1<Tcr>
The statistical values are indicated with master value.
Hysteresis for tolerance monitoring and classification:
P90<CR>
P90,xx.xx<Tcr>
Inquires the hysteresis value.
P90,xx.xx<CR>
P90,xx.xx<Tcr>
Sets the hysteresis value.
Example:
P90,10.55<CR>
P90,10.55<Tcr>
Adjusts a hysteresis value of 10.55 µm.
Nominal value:
P91<CR>
P91,xxx<Tcr>
Inquires the nominal value.
Example:
P91,2E3<CR>
P91,2000<Tcr>
Sets the nominal value to 2.0 mm (2,000 µm).
Measuring value integration time Ti:
P92<CR>
P92,.xxx<Tcr>
P92,.xxx<CR>
P92,.xxx<Tcr>
Inquires the meas. value integration time Ti in seconds.
Sets the meas. value integration time Ti in seconds.
Example:
P92,1.6E-3<CR>
P92,.0016<Tcr>
Sets the measuring value integration time Ti to 1.6 ms.
Note: Function "Z" (accepting the master value) will be cancelled,
i.e. a master measurement must be taken thereafter !
Gauge block:
P93,x<CR>
P93,x,yyy.y<Tcr>
Inquires the adjustment of gauge block no. x.
x = 1 ... 10, number of the gauge block
yyy.y:
adjusted height
P93,1<CR>
P93,1,1000.0<Tcr>
Inquires the adjustment of gauge block no. 1(here, 1,000 µm).
P93,5,1500,6,1600<CR> P93,5,1500,6,1600<Tcr> Adjusts gauge block no. 5 to 1,500 µm and gauge block no. 6 to
1,600 µm.
Maximum correction offset (measuring/reference function):
P95<CR>
P95,xxx.x<Tcr>
Inquires the maximum correction offset.
P95,100<CR>
P95,100<Tcr>
Sets the maximum correction offset to 100 µm.
P95,0<CR>
P95,0<Tcr>
Switches on the special measuring/reference function.
(Mean value is output via the analogue output 3.)
76
Activating dc voltage/carrier frequency:
By means of this function, the carrier frequency system can be switched off such that it is possible to measure dc voltages
for test purposes.
P97<CR>
P97,x<Tcr>
Inquires the adjusted mode of operation.
x = 0 dc voltage
x = 1 carrier frequency
P97,0<CR>
P97,0<Tcr>
Sets the operation mode to dc voltage.
I/O-test:
P98,x,y<CR>
P98,x,y,z<Tcr>
Inquires the status of an input or output.
x = socket number (5 ... 8)
y = pin number
z = logic level (0 = low, 1 = high)
P98,8,45<CR>
P98,8,45,0<Tcr>
Inquires the status of pin 45 of socket X8.
P98,5,16,1<CR>
P98,5,16,1<Tcr>
Sets the output pin 16 of socket X5 to 1 (high).
P98,0<CR>
P98,0<CR>
Switches off the I/O test. During the I/O test, the operability of the
VMF 2000 is restricted. Therefore, it is indispensable to complete
the I/O test with this command.
Lock:
P99<CR>
P99,n<Tcr>
Inquires the status of the keyboard lock.
n = 0 not locked
n = 1 all settings locked
n = 2 keys locked
n = 3 configuration and zero setting locked
Example:
P99,0<CR>
P99,0<Tcr>
Switches off the lock. All instrument settings can be changed.
P99,2<CR>
P99,2<Tcr>
Locks the keys. Now, the instrument can only be controlled via the
computer interface or the control inputs.
Save:
P100<CR>
P100<Tcr>
Permanently stores all settings in an EEPROM. The acknowledgement message is sent after storing the settings.
Error messages:
E1<Tcr>
E2<Tcr>
E3<Tcr>
E4<Tcr>
E5<Tcr>
E6<Tcr>
E7,M...<Tcr>
E8<Tcr>
E9<Tcr>
Command unknown.
Parameter not existent/adjustable.
Parameter value exceeds admissible limits.
Numerical format or syntax faulty.
Error during data transfer (faulty record type, parity, baud rate, etc.).
Received text too long.
Measuring value at probe connections exceeds admissible range.
For the time being, the command cannot be executed (since e.g. the function was not activated in
the system configuration).
For the time being, the parameter cannot be adjusted.
Examples:
P51,X1<CR>
M1<CR>
P51,+1*X1<Tcr>
E7,M1,-2850.0<Tcr>
Set the transducer combination to "+A".
The measuring value at transducer connection A exceeds the
measuring range.
77
SPI
Fig. 14 Block diagram of the VMF 2000
78
MONOFLOP
SPI
REGISTER
BUSdriver
UART
D
A
D
A
A
D
µC
(SLAVE)
D
UART
EEPROM
A
A
D
(MASTER)
µC
D
A
mains supply
6.12 Functional diagram, pin assignment of the sockets
Fig. 15 Functional diagram of the VMF 2000
X2, X3 : 6-pol. Tuchel, female
79
T
A
D
D
START
Measuring
range
A
MIN
MAX
MEAN
+B
0
-B
+A
0
-A
n
R
S
X
(MX+MN)/2
MAX-MIN
*Factor B
*Factor A
V:
Sel. stat
Master
RESULT
Sel. result
Sel. prnt
Sel. ins.
1
2
Sel. tol.
Tolerance indication
Printer connection
(RS232)
Indication range
3
2
1
4
6
5
Fig. 16
Pin assignment of the interfaces X2 and X3
(transducer sockets A and B)
1 Oscillator voltage
2 Voltage input
1 mV/µm
3 Current input
1 µA/µm
4 Earthing contact (ground)
5 Oscillator voltage
6 Voltage input
0.3 mV/µm
On the rear side of the instrument, there is a selector switch for compensating
for the cable length (see figure 2). Adjust this switch according to the used cable length by means of an appropriate screwdriver.
Cable length
0m
15 m
25 m
35 m
45 m
Switch position
Cable capacitance comp.
0
1
2
3
4
0 nF
2,2 nF
3,8 nF
5,3 nF
6,9 nF
The compensation setting is valid for both probe inputs. Therefore, identical
cable lengths are presumed.
The characteristic curve of an inductive probe is changed by the capacitance
of the connecting cable. The VMF 2000 features a circuit which largely compensates for this influence.
The compensation takes place between pin 6 (signal input) and pin 4 (ground)
of the transducer sockets X2 and X3.
80
X4 : 3-pol. Tuchel, female
2
1
Fig. 17
Pin assignment of the interface X4
1 Analogue output 1 (equivalent to X5/24)
2 Earthing contact
3 Analogue output 2 (equivalent to X5/25)
3
X5:
Sub-D 25 pol. female socket
1
2
3
4
5
6
7
8
9
10
11
12
13
14
15
16
17
18
19
20
21
22
23
24
25
1
0 Volt internal supply voltage
2
15...24 V internal supply voltage
3
Cathode: inputs pin 3, 4, 5, 6
4
Anode: outputs pin 16, 17, 18, 19
5
Input not yet assigned
6
Synchronization error
7
Input not yet assigned 2 (do not use !)
8
Synchronization successful
9
Accept calibration value
10
Symmetry error
11
Transducer checking
active
Transducer checking:
12
13
Error
N.C.
14
N.C.
15
N.C.
16
N.C.
17
N.C.
18
N.C.
19
GND
20
DAC 3: 0...150 mV/µm
21
GND
22
DAC 2: 0...150 V/indication range
23
GND
24
DAC 1: 0...150 mV/µm
25
N.C.
Fig. 18
Pin assignment of the interface X5
81
X6
1
GND (TX-)
6
2
RX+
7
3
TX+
8
4
RX9
5
9 pol. SUB-D, female
2
3
4
6
Rx+
Rx+
Tx+
Tx+
Rx-
Rx-
Tx-
Tx-
2
3
4
6
Fig. 19
Pin assignment of the interface X6 (measuring/reference) and the cable connecting two VMF 2000
82
X7: 50 pol. Sub-D female
1
34
18
2
35
19
3
36
20
4
37
N.C.
21
5
38
22
6
39
23
7
40
N.C.
24
8
41
N.C.
25
9
42
26
10
43
27
11
44
28
12
45
N.C.
29
13
46
30
14
47
31
15
48
32
16
49
33
17
50
1
2
3
4
5
6
7
8
9
10
11
12
13
14
15
16
17
18
19
20
21
22
23
24
25
26
27
28
29
30
31
32
33
34
35
36
37
38
39
40
41
42
43
44
45
46
47
48
49
50
BCD-output: A1out
BCD-output: A2out
15...24V internal voltage supply
BCD-output: B1out
BCD-output: B2out
BCD-output: Collector A1out...D1out, A2out...D2out
BCD-output: C1out
BCD-output: C2out
BCD-output: Collector A1out...D1out, A2out...D2out
BCD-output: D1out
BCD-output: D2out
BCD-output:
BCD-output:
BCD-output:
BCD-output:
BCD-output:
BCD-output:
BCD-output:
BCD-output:
A3out
A4out
Collector A3out...D3out, A4out...D4out
B3out
B4out
Collector A3out...D3out, A4out...D4out
C3out
C4out
BCD-output: D3out
BCD-output: D4out
BCD-output: A5out
BCD-output: C5out
BCD-output: Collector A5out...D5out
BCD-output: B5out
BCD-output: D5out
BCD-output: Collector sign
S1 Strobe for BCD-input (LSD)
BCD-output: sign
Collector for Strobes S1...S3
S2 Strobe for BCD input
S3 Strobe for BCD-input (LSD)
BCD-input: A1in
BCD-input: A2in
Cathode BCD-input
BCD-input: B1in
BCD-input: B2in
Cathode accept master value
BCD-input: C1in
BCD-input: C2in
Cathode BCD-Hold
BCD-input: D1in
BCD-input: D2in
0 Volt internal voltage supply
BCD-Hold
Accept master value
Fig. 20
Pin assignment of the interface X7
Note: From fall 2004 the following pins are shorted internally: 19…28 and 30…32
83
X8: 50 pol. Sub-D female
1
2
3
4
5
6
7
8
9
10
11
12
13
14
15
16
17
34
18
19
20
21
22
23
24
25
26
27
28
29
30
31
32
33
35
36
37
38
39
40
41
42
43
44
45
46
47
48
49
50
1
2
3
4
5
6
7
8
9
10
11
12
13
14
15
16
17
18
19
20
21
22
23
24
25
26
27
28
29
30
31
32
33
34
35
36
37
38
39
40
41
42
43
44
45
46
47
48
49
50
R1out, indication range 1 µm (10 µm)
R2out, indication range 3 µm (30 µm)
15...24V internal voltage supply
R3out, indication range 10 µm (100 µm)
R4out, indication range 30 µm (300 µm)
Collector: Indication range output
R5out, indication range 100 µm (1,000 µm)
R6out, indication range 300 µm (3,000 µm)
Collector: Reject, rework
R7out, indication range 1000 µm(10,000 µm)
Rework
Collector: Balancing the symmetry complete
Balancing the symmetry complete
Reject
Collector: Master value equals presetting
Master value equals presetting
Interference blanked out
Collector: Transducer A or B overloaded
Transducer A or B overloaded
System works
Collector: "Within 0 V"
Confirm zero setting
IB-Error, error signal interference blanking
Collector: interference blanked out
Cancel error signal
Accept value into statistics
Collector: IB-error and system works
Synchronization (Start meas./ref. function)
Print / Cancel statistics
Cath.: Balanc., Synchron.,Value. i. stat., Can. Err.
Balancing the symmetry
Fade out zero setting value
Cathode: Accept master value setting
Accept master value
Zero setting
Cathode: Zero setting
Fade out master value
Accept upper tolerance limit
Cathode: Accept up./low. tolerance limit
R1in, indication range 1 µm (10 µm)
Accept lower tolerance limit
Cathode: Fade out master value setting
R3in, indication range 10 µm (100 µm)
R2in, indication range 3 µm (30 µm)
Cathode: indication range input
R5in, indication range 100 µm (1,000 µm)
R4in, indication range 30 µm (300 µm)
0 Volt internal voltage supply
R7in, indication range 1,000 µm (10,000 µm)
R6in, indication range 300 µm (3,000 µm)
Fig. 21
Pin assignment of the interface X8
Note: From fall 2004 the following pins are shorted internally 19…26 and 27…32
84
X9:
5
4
9 pol. D-SUB male
GND
9
8
3
Data output (TxD)
7
2
Data input (RxD)
6
1
X10:
5
4
9 pol. D-SUB male
GND
9
8
3
Data output (TxD)
7
2
Data input (RxD)
6
1
Fig. 22
Pin assignments of the interfaces X9 (host computer) and X10 (printer)
85
6.13 Notes on maintenance
Cleaning:
The housing may be cleaned with a wetted piece of cloth. Acetone and acetone compounds are never to be used.
Exchanging fuses:
-
Switch off the instrument.
Pull the mains cable from the socket outlet X1 on the rear of the instrument.
Open the cover of the voltage selector by means of a screwdriver.
Pull out the two fuse carriers.
Replace defective fuses by fuses of the same type:
630 mA, time-lag
Opening the instrument:
For reasons of security, all modifications to and interventions in the instrument
may only be carried out by trained personnel on the express written approval
of the manufacturer.
6.14 Exchanging the software
The software of the VMF 2000 is stored in 2 EPROMs. Updates must be carried out by trained personnel by exchanging both EPROMs. Besides the relevant safety provisions, the following instructions must be complied with in particular:
-
Before opening the unit, disconnect it from the power supply by pulling the
plug from the mains socket outlet.
-
EPROMs and other components in the instrument may be destroyed or
damaged by electrostatic charges. It is also possible that the instrument is
damaged only partially such that defects manifest themselves only after a
couple of weeks or months. Therefore, when opening or repairing the unit,
always use conductive pads and grounding straps for your wrist!
After exchanging the software, the standard configuration has to be loaded
(with "S.config"), the instrument settings changed as required and stored with
"Save".
86
6.15 Error list
No.
1
Error message
Cause
Remedy
"Printer" / "Computer"
The data transmission to the printer Set a higher Baud rate on the VMF
or the computer is too slow.
2000 as well as on the
printer/computer.
Baud rate too small,
printer/computer program is too
Use a faster printer.
slow.
Set the printer "on line".
Accept less values/time ("Accept
value into statistics" input).
2
SLV-Fehl
The connection to the slave processor can not be established.
Check the voltage supply at the
No supply voltage at the printed
circuit board of the slave processor. printer circuit board of the slave
processor; if necessary, replace it.
3
Slave-processor, EPROM, RAM...
defective.
Check slave processor, EPROM,
RAM...; if necessary, replace them.
Connection cable master-slave
defective.
Check the connection cable master-slave; if necessary, replace it.
False software version of the
printed circuit board of the slave
processor.
Replace EPROM.
Rev.-Fehl
The EPROM has been replaced.
The standard configuration has to
be loaded with "s.config" and saved
with "save".
Afterwards, the desired standard
configuration can be adjusted and
– if necessary – saved with "save"
(see section 4.8)
4
IRam Fehl
RAM of the processor is defective.
Send it in to have it repaired.
5
Prom Fehl
EPROM is defective.
Replace EPROM.
6
ERam Fehl
External RAM defective.
Replace the RAM-chip.
7
EEP-Fehl
EEPROM is defective.
Send it in to have it repaired.
87
7
Technical Data
VMF 2000
Order no. 5312410
Dimensions (length x width x height)
Mass
Supply voltage
216 x 177 x 198 mm
4.6 kg
240 V ± 10 %
220 V ± 10 %
120 V ± 10 %
100 V ± 10 %
50...60 Hz
20 W
630 mA (time-lag)
± 2,000 µm
± 200 µm
5V
20 kHz
Frequency range
Power consumption
Fuse
Adjustable measuring ranges
Excitation voltage
Carrier frequency
Settling time (Ti = 1.6 ms)
of the dial-type indicator
of the numerical display
of the analogue outputs
to 70 % of final value
to 99 % of final value
of the digital outputs
RS 232
tolerances
BCD
Holding time of the numerical display
Deviation spread (related to the measuring range)
of the dial-type indicator
of the numerical display
of the analogue outputs
of the digital outputs
(RS 232)
Hysteresis of the dial-type indicator
(related to the measuring range)
Max. number of connectable probes
without exceeding the deviation spreads
Working temperature range
Operating temperature range
Storing temperature range
Analogue outputs
Voltage range
Sensitivity
Admissible load resistor
Residual voltage ripple
(related to the measuring range)
Reference voltage
Cutoff frequency (Ti = 1,6ms, 3 dB)
Digital inputs
Limit values
Ie
Ve High
Ve Low
Digital outputs
Limit values
Vce
Ic
High
Vce
88
300 ms
400 ms
10 ms
7,5 ms
10 ms
20 ms
5 ms
200 ms
200 ms
1.5 %
0.01 %
0.05 %
0.01 %
1.5 %
2
+ 10 ... + 40 °C
0 ... + 40 °C
- 10 ... + 40 °C
± 10 V
0 ... 150 mV/µm
0 ... 150 V/indication range (only output 2)
> 2 kOhm
< 10 mV
0V
50 Hz
< 50 mA
> 4.5 V (Ie = (Ve - 1,2 V) / 1 kOhm)
< 2.5 V (Ie = Ve / 1.5 kOhm)
< 35 V
< 50 mA
< 5 V at 30 mA
Indication ranges of the dial-type indicator
Scale divisions
Measuring value classification
Configuration memory
Writing cycles (Save)
Interfaces:
2 serial interfaces
Meas./ref. interface
..Digital I/Os
± 1, ± 3, ± 10, ± 30, ± 100, ± 300, ± 1,000, ± 3,000,
± 10,000 µm
0.02; 0.1; 0.2; 1; 2;
10; 20; 100; 200 µm
max. 30 classes
EEPROM
> 10,000
RS 232 C
31 control inputs
44 control outputs
89
Revision:
Aug. 2nd 2007 sem
Oct. 30th 2008 sem
90
X8 – Pin 27 and Pin 29 description was wrong
Settling time of analog outputs has been corrected