1
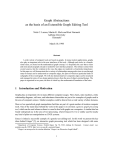
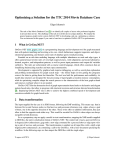
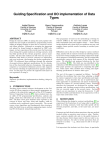
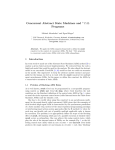
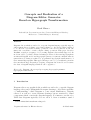
Concepts and Realization of a
Diagram Editor Generator
Based on Hypergraph Transformation
Mark Minas 1
Lehrstuhl für Programmiersprachen, Universität Erlangen-Nürnberg,
Martensstr. 3, 91058 Erlangen, Germany
Abstract
Diagram editors which are tailored to a specific diagram language typically support
either syntax-directed editing or free-hand editing, i.e., the user is either restricted
to a collection of predefined editing operations, or he is not restricted at all, but
misses the convenience of such complex editing operations. This paper describes
DiaGen, a rapid prototyping tool for creating diagram editors which support both
modes in order to get their combined advantages. Created editors use hypergraphs as
an internal diagram model and hypergraph parsers for syntactic analysis whereas
syntax-directed editing is realized by programmed hypergraph transformation of
these internal hypergraphs. This approach has proven to be powerful and general in
the sense that it supports quick prototyping of diagram editors and does not restrict
the class of diagram languages which it can be applied to.
Key words: Diagram editors, rapid prototyping, hypergraph grammar,
hypergraph transformation
1
Introduction
Diagram editors are graphical editors which are tailored to a specific diagram
language; they can be distinguished from pure drawing tools by their capability
of “understanding” edited diagrams to some extent. Furthermore, diagram
editors do not allow to create arbitrary drawings, but are restricted to visual
components which occur in the diagram language. For instance, an editor for
UML class diagrams typically does not allow to draw a transistor symbol
1
E-mail: [email protected]
Preprint submitted to Elsevier Science
27 March 2001
which would be possible in a circuit diagram editor. Current diagram editors
support either syntax-directed editing or free-hand editing.
Syntax-directed editors provide a set of editing operations. Each of these operations is geared to modify the meaning of the diagram. This editing mode
requires an internal diagram model that is primarily modified by the operations; diagrams are then updated according to their modified model. These
models are most commonly described by some kind of graph; editing operations are then represented by graph transformations (e.g. [1,2]).
Diagram editors providing free-hand editing are low-level graphics editors
which allow the user to directly manipulate the diagram. The graphics editor
becomes a diagram editor by offering only pictorial objects which are used by
the visual language and by combining it with a parser. A parser is necessary
for checking the correctness of diagrams and analyzing the syntactic structure
of the diagram. There are grammar formalisms and parsers that do not require an internal diagram model as an intermediate diagram representation,
but operate directly on the diagram (e.g., constraint multiset grammars [3]).
Other approaches use an internal model which is analyzed by the parser (e.g.,
VisPro [4]). Again, graphs are the most common means for describing such a
model.
The advantage of free-hand editing over syntax-directed editing is that a diagram language can be defined by a concise (graph) grammar only; editing
operations can be omitted. The editor does not force the user to edit diagrams
in a certain way since there is no restriction to predefined editing operations.
However, this may turn out to be a disadvantage since editors permit to create
any diagram; they do not offer explicit guidance to the user. Furthermore, freehand editing requires a parser and is thus restricted to diagrams and (graph)
grammars which offer efficient parsers.
So far, diagram editors either support syntax-directed editing or free-hand
editing. An editor that supports both editing modes at the same time would
combine the positive aspects of both editing modes and reduce their negative
ones. Despite this observation, there is only one such proposal which has not
yet been realized known to us: Rekers and Schürr propose to use two kinds of
graphs as internal representations of diagrams [5]: the spatial relationship graph
(SRG) abstracts from the physical diagram layout and represents higher level
spatial relations. Additionally, an abstract syntax graph (ASG) that represents
the logical structure of the diagram is kept up-to-date with the SRG. Contextsensitive graph grammars are used to define the syntax of both graphs. Freehand editing of diagrams is planned to modify the first graph, syntax-directed
editing is going to modify the second. In each case, the other graph is modified
accordingly. Therefore, a kind of diagram semantics is available by the ASG.
However, this approach requires almost a one-to-one relationship between SRG
2
and ASG. This is not required in the approach of this paper. We will come
back to this approach in the conclusions (cf. Section 6).
This paper describes DiaGen, a rapid-prototyping tool for creating diagram
editors that support both editing modes at the same time. DiaGen (Diagram
editor Generator) supports free-hand editing based on an internal hypergraph
model which is parsed according to some hypergraph grammar. Attribute evaluation which is directed by the syntactic structure of the diagram is then used
for creating a user-specified semantic representation of the diagram. This freehand editing mode is seamlessly extended by a syntax-directed editing mode,
which also requires an automatic layout mechanism for diagrams. Support for
automatic diagram layout which is used for both syntax-directed editing and
free-hand editing is briefly outlined, too.
The next section gives an overview of the DiaGen tool and the common architecture of editors being created with DiaGen. Section 3 then explains the
free-hand editing mode of these editors and the diagram analysis steps which
are necessary for translating freely edited diagrams into some semantic representation. The integration of additional syntax-directed editing operations
into such editors is explained in Section 4. An automatic layout mechanism,
which is required by syntax-directed editing, is outlined in Section 5. Section 6
concludes the paper.
2
DiaGen
DiaGen provides an environment for rapidly developing diagram editors. This
section first outlines this environment and how it is used for creating a diagram
editor that is tailored to a specific diagram language. Each of such DiaGen
editors is based on the same editor architecture which is adjusted to the specific
diagram language. This architecture is described afterwards.
2.1 The DiaGen environment
DiaGen is completely implemented in Java and consists of an editor framework and a program generator. DiaGen is free software and can be downloaded from the DiaGen web site [6].
Fig. 1 shows the structure of DiaGen and the process of using it as a rapidprototyping tool for developing diagram editors. The framework, as a collection of Java classes, provides the generic editor functionality which is necessary
for editing and analyzing diagrams. In order to create an editor for a specific
3
Editor developer
Specification
DIAGEN
DiaGen
editor
framework
Program
generator
Generated
program
code
Editor
specific
program
code
Diagram editor
Fig. 1. Generating diagram editors with DiaGen.
diagram language, the editor developer primarily has to supply a specification, which textually describes syntax and semantics of the diagram language.
Additional program code which is written “manually” can be supplied, too.
Manual programming is necessary for the visual representation of diagram
components on the screen and for processing specific data structures of the
problem domain, e.g., for semantic processing when using the editor as a component of another software system. The specification is then translated into
Java classes by the program generator.
The generated classes, together with the editor framework and the manually
written code, implement an editor for the specified diagram language. This
editor can run as a stand-alone program. But it can also be used as a software
component since the editor framework as well as the generated program code
is conformable with the JavaBeans standard, the software component model
for Java. Common integrated development environments (IDEs, e.g., JBuilder
by Imprise/Borland, VisualCafe by Symantec or Visual Age for Java by IBM.)
can be used to visually plug in generated editors into other software systems
without much programming effort.
Diagram editors which have been developed using DiaGen (such editors are
called “DiaGen editors” in the following) provide the following features:
• DiaGen editors always support free-hand editing. The editor framework
contains a generic drawing tool which is adjusted to the specified diagram
language by the program generator. The visual representation of diagram
components which are used by the drawing tool has to be supplied by the
editor developer. The editor framework provides an extensive class library
for that purpose. Diagrams that are drawn using the drawing tool are internally modeled by hypergraphs which are analyzed primarily by a hypergraph
parser (cf. Section 3). The hypergraph grammar which is used by the hypergraph parser is the core of the diagram language specification. The analysis
results are used to provide user feedback on diagram parts which are not
correct with respect to the diagram language.
• Diagrams which are created using a DiaGen editor are translated into a
4
semantic representation. This process is driven by the syntactic analysis and
makes use of program code and data structures which are provided as “editor specific program code” in Fig. 1. The reverse translation, i.e., creating
diagrams from external representations, is also supported by a mechanism
that is similar the one of syntax-directed editing operations.
• DiaGen editors optionally support syntax-directed editing, too, if the editor developer has specified syntax-directed editing operations. These operations are primarily hypergraph transformations which modify the internal
hypergraph model of edited diagrams (cf. Section 4).
DiaGen editors can be specified and developed in a rapid prototyping
fashion without any syntax-directed editing operation. Any diagram of the
diagram language can be created by free-hand editing only. Desirable editing
operations can be added later.
• Automatic layout is an optional DiaGen editor feature, too, but which is
obligatory when specifying syntax-directed operations. The automatic layout mechanism adjusts the diagram layout after applying syntax-directed
editing operations which have modified the internal diagram model. Automatic layout also assists free-hand editing: After each layout modification by the user, the layout mechanism changes the diagram such that the
structure of the diagram remains unchanged. DiaGen offers constraints for
specifying the layout mechanism in a declarative way (cf. Section 5), or a
programming interface for plugging in other layout mechanisms. DiaGen
comes with some general layouting mechanisms like a force-driven layout
and simple constraint propagation methods which can be parameterized by
the editor developer.
The rest of this paper presents the concepts and realization of these features
by means of a formal specification based on hypergraph transformation and
generating the editor using such a specification. Each of these editors has the
same architecture which is considered next.
2.2 The DiaGen editor architecture
Fig. 2 shows the structure which is common to all DiaGen editors and which
is described in the following paragraphs. Ovals are data structures, and rectangles represent functional components. Gray rectangles are parts of the editor
framework which have been adjusted by the DiaGen program generator based
on the specification of the specific diagram language. Flow of information is
represented by arrows. If not labeled, information flow means reading resp.
creating the corresponding data structures.
The editor supports free-hand editing by means of the included drawing tool
which is part of the editor framework, but which has been adjusted by the
5
semantic
representation
marks syntactically correct subdiagrams
gathers
modifies
Layout−
information
Layouter
Attribute
evaluation
gathers
gathers
Hypergraph
model
Modeler
Diagram
modifies
ds
co
Drawing
tool
Parser
Derivation
structure
reads
/re
m
Reduced
hypergraph
model
modifies
ad
reads
Reducer
m
po
ne
ov
es
nt
s
reads
Hypergraph
transformer
reads
selects
operations
selects
operations
Fig. 2. Architecture of a diagram editor based on DiaGen.
program generator. With this drawing tool, the editor user can create, arrange
and modify diagram components which are specific to the diagram language.
Editor specific program code which has been supplied by the editor developer
is responsible for the visual representation of these language specific components. Examples are rectangular text boxes or diamond-shaped conditions in
flowcharts. Fig. 3 shows a screenshot of such an editor whose visual appearance
is characterized by its drawing tool. When components are selected, so-called
handles – like in conventional drawing tools – show up which allow to move or
modify single or grouped diagram components like with common off-the-shelf
drawing tools (cf. Fig. 9a). The drawing tool creates the data structure of
the diagram as a set of diagram components together with their attributes
(position, size, etc.).
The sequence of processing steps which starts with the modeler and ends with
attribute evaluation (cf. Fig. 2) realizes diagram analysis which is necessary for
free-hand editing: The modeler first transforms the diagram into an internal
model, the hypergraph model. The task of analyzing this hypergraph model is
quite similar to familiar compiler techniques: The reducer – which corresponds
to the scanner of a compiler – performs some kind of lexical analysis and
creates a reduced hypergraph model which is then syntactically analyzed by the
hypergraph parser. This processing step identifies maximal parts of diagram
which are (syntactically) correct and provides visual feedback to the user by
coloring each subdiagram with a different color. A correct diagram is thus
entirely colored with just a single color, and errors are indicated by missing
colors. Driven by the syntactic structure of each subdiagram and similar to
the semantic analysis step of compilers, attribute evaluation is then used to
create a semantic representation for each of these subdiagrams.
6
Fig. 3. Screenshot of a diagram editor for flowcharts.
The layouter modifies attributes of diagram components and thus the diagram
layout by using information which has been gathered by the reducer and the
parser or by attribute evaluation (cf. Section 5). The layouter is necessary for
realizing syntax-directed editing: Syntax-directed editing operations modify
the hypergraph model by means of the hypergraph transformer and add or
remove components to resp. from the diagram. The visual representation of
the diagram and its layout is then computed by the layouter.
These processing steps, which have been outlined referring to Fig. 2, are described in more detail in the following sections.
3
Free-Hand Editing
This section describes the processing steps of a DiaGen editor which are used
for free-hand editing and which are shown in Fig. 2. DiaGen has been used for
creating editors for many diagram languages (e.g., UML diagrams, ladder diagrams, Petri nets). As a sample diagram language, this paper uses flowcharts
although it is an admittedly simple language. However, other languages are
less suited for presentation in a paper.
3.1 The hypergraph model
Each diagram consists of a finite set of diagram components, each of which is
determined by its attributes. For flowcharts, there are rectangular text boxes
and diamond-shaped conditions whose positions are defined by their x and y
coordinates and their size by a width and a height attribute. Vertical as well as
horizontal lines and arrows have x and y coordinates of their starting and end
points on the canvas. However, attributes describe an arrangement of diagram
7
components only in terms of numbers. The meaning of a diagram is determined
by the diagram components and their spatial arrangement. The specific arrangement of flowchart components is made up of boxes and diamonds which
are connected by arrows and lines in a very specific way. Arrangements can
always be described by spatial relationships between diagram components.
For that purpose, each diagram component typically has several distinct attachment areas at which it can be connected to other diagram components.
A flowchart diamond, e.g., has its top vertex as well as its left and right one
where it can be connected to lines and arrows, whereas lines and arrows have
their end points as well as their line (please note that arrows can be connected
to the middle of another arrow as shown in Fig. 3) as attachment areas. Connections can be established by spatially related (e.g., overlapping) attachment
areas as with flowcharts where an arrow has to end at an exact position in
order to be connected to a diamond.
DiaGen uses hypergraphs to describe a diagram as a set of diagram components and the relationships between attachment areas of “connected” components. Hypergraphs consist of two finite sets of nodes and hyperedges (or
simply edges for short). Each hyperedge carries a type and is connected to an
ordered sequence of nodes. The sequence has a certain length which is called
arity of the hyperedge and which is determined by the type of the edge. Each
node of this sequence is called “visited” by the hyperedge. Familiar directed
edge-labeled graphs are special hypergraphs where each hyperedge has arity 2.
Hypergraphs are an obvious means for modeling diagrams: Each diagram component is modeled by a hyperedge. The kind of diagram component is the hyperedge type, the number of attachment areas is its arity. Attachment areas
are modeled by nodes which are visited by the hyperedge. The sequence of
visited nodes determines which attachment area is modeled by which node.
The set of diagram components is thus represented by a set of nodes and a
set of hyperedges where each node is visited by exactly one hyperedge. Relationships between attachment areas are modeled by hyperedges of arity 2.
They carry a type which describes the kind of relationship between related
attachment areas.
Fig. 4 shows the hypergraph model of a subdiagram of the one shown in Fig. 3.
Nodes are depicted by black dots. Component edges which represent diagram
components are shown as gray rectangles that are connected to visited nodes
by thin lines. Line numbers represent the sequence of visited nodes. Relation
edges which represent relationships between attachment areas are depicted
as arrows between connected nodes. The arrow direction indicates the node
sequence. Fig. 4 shows the hypergraph in a similar way as the represented subdiagram. Rectangular boxes and diamond-shaped conditions are represented
by box edges resp. cond edges with arity 2 resp. 3. Vertical and horizontal
arrows resp. lines are shown as vArrow, hArrow, vLine, and hLine edges, resp.
8
1
2
vArrow
3
flowIn
1
box
2
flowOut
1
2
1
hArrow
join
3
2
vArrow
3
flowIn
2
1
hLine
3
flowOut
1
2
cond
3
flowOut
1
2
hLine
3
Fig. 4. A part of the flowchart which is shown in Fig. 3 and its corresponding
hypergraph model.
Relationship edge types are flowIn, flowOut, and join. The relationship of a
vertical arrow which ends at the upper attachment area of a box or a diamond
is represented by a flowIn relation between the “end node” of the arrow and
the “upper node” of the corresponding vArrow and box edges. A flowOut relationship is used in a similar way for leaving arrows. A join relation connects
an arrow end with lines or arrows.
Hypergraph models are created by the modeler of DiaGen editors: The modeler first creates component edges for each diagram component and nodes for
each of their attachment areas. Afterwards, the modeler checks for each pair
of attachment areas whether they are related as defined in the specification. 2
The language specification describes such relationships in terms of relations on
attribute values of corresponding attachment areas. E.g., in the flowchart example, the end attachment area of a vertical arrow and the upper attachment
area of a rectangular box are flowIn-related if both attachment areas overlap,
i.e., have close positions on the canvas. For each relationship which is detected,
the modeler adds a corresponding relation edge between corresponding nodes.
3.2 The reduced hypergraph model
Hypergraph models tend to be quite large even for small diagrams. For instance, Fig. 4 shows only a small portion of the hypergraph model of the
really small flowchart of Fig. 3. The hypergraph model represents each diagram component and each relationship between them directly. The structure
and meaning of a diagram, however, is generally represented in terms of larger
groups of components and their relationship. For flowcharts, e.g., the crucial
2
For efficiency reasons, only pairs of attachment areas with overlapping bounding
boxes are actually considered.
9
flowOut
co
ue
nn
n
nti
a
a
1
b
box
1
2
3
c
b
a
b
a
vArrow
2
a=b=c
1
2
vArrow
flowIn
a=b
t
1
2
vArrow
3
c
b
ec
co
a
3
a
a=b=c
a
conn
begin
1
statement
2
conn
b
Fig. 5. Some reduction rules for flowcharts.
information is contained by the set of boxes and conditions which are interconnected by lines and arrows. The specific path of lines and arrows between
connected boxes is irrelevant. DiaGen editors therefore do not analyze the
hypergraph model directly, but first identify such groups of components and
relationships. Similar to common compiler techniques where lexical analysis
is used to group input stream characters to tokens (e.g., identifiers and keywords) and leaving other characters unconsidered (e.g., comments), the reducer
searches for all matches of specified patterns and creates a reduced hypergraph
model which then represents the diagram structure directly.
Similar to compiler generators which require a specification of lexical analysis, the reducer has to be specified for a specific diagram language. DiaGen
provides reduction rules to this end: Each rule consists of a pair (P, R) of
hypergraphs and additional application conditions. P is the pattern whose occurrences are searched in the hypergraph model. The hypergraph R (“result”)
describes a modification to the reduced hypergraph for each match of P which
also satisfies the application conditions.
Fig. 5 shows five reduction rules for flowcharts in the form P ⇒ R. The pattern
of the rightmost rule actually consists of the vArrow edge with its three visited
nodes only. The gray, crossed out sub-hypergraphs are negative application
conditions: A match for the vArrow edge is used for rule application if and
only if none of the three crossed out sub-hypergraphs can be matched as well,
i.e., the match is valid if there is no additional flowIn, continue, or connect
edge which is connected to the start node of the vArrow edge (continue edges
are not further considered here). The hypergraph R of each rule shows the
hypergraph which is added to the reduced hypergraph model for each valid
match of the P -hypergraph. Same node labels indicate corresponding nodes of
the hypergraph model and the reduced one. Hypergraph model nodes which lie
in different pattern occurrences (not necessarily of different patterns) always
correspond to the same node of the reduced model. Three special cases have
to be mentioned here:
10
begin
conn
a
statement
conn
b
statement
conn
conn
conn
conn
conn
c
conn
conn
conn
conn
d
e
conn
conn
condition
f
g
conn
conn
condition
statement
conn
statement
statement
i
h
conn
conn
conn
end
statement
Fig. 6. The reduced hypergraph model of the flowchart of Fig. 3.
• Nodes which are matched by no P -hypergraph of any rule do not have
corresponding nodes in the reduced model.
• If there are nodes which lie in different pattern occurrences where none of
these pattern nodes has a corresponding node in its R graph, these nodes
do not have corresponding nodes in the reduced model.
• Two or more P -nodes may correspond to a single R-node (e.g., a = b = c in
the second and fourth rule). All the nodes of the hypergraph model which
match these “identified” P -nodes correspond to a single node of the reduced
hypergraph model.
Fig. 6 shows the reduced hypergraph model of the flowchart of Fig. 3 and which
is created by these reduction rules. The structure of this model is similar to
the structure of the hypergraph model. Because of the reduction rules which
identify nodes, a much cleaner hypergraph model is created. The conn edges
are grayed out since they are actually not needed for the following syntactic
analysis; the corresponding reduction rules could be omitted for pure free-hand
editing editors. Section 4 however shows why they are needed in the context
of syntax-directed editing operations.
The concept of reduction rules is similar to hypergraph transformation rules
L ::= R (or L → R) with L (left-hand side, LHS) and R (right-hand side,
RHS) being hypergraphs [7,8]. A transformation rule L ::= R is applied to a
(host) hypergraph H by finding L as a subgraph of H and replacing this match
by R obtaining hypergraph H ′ . We say, H ′ is derived from H in one (derivation) step. A derivation sequence is a sequence of derivation steps where the
resulting hypergraph of each step is immediately derived in the next step. The
following observations show that specifying the reducer and the reducing process for a specific diagram language would be rather difficult if the reducer had
been defined in terms of such derivation sequences from hypergraph models to
11
reduced ones. Instead, the reducer applies all reduction rules to all occurrences
of their left-hand sides in some kind of parallel fashion:
• Patterns frequently overlap. This is so since the meaning of a group of
diagram components and relationships — and this “meaning” is tried to be
represented by the edges of the reduced hypergraph model – often depends
on context which is part of another group. E.g., the last rule of Fig. 5 uses a
flowOut edge as (negative) context which also occurs in the pattern of the
third rule. Applying one rule would change the context of the other one if
regular hypergraph transformations were used. It would be a difficult task
to specify the desired reducing semantics.
• There are in general many different derivation sequences starting at a specific hypergraph which would produce different reduced hypergraphs because of these overlapping patterns. The editor developer had to take measures to avoid this nondeterminism. However, it is a nontrivial task to set
up such confluent sets of transformations [9].
Instead, reduction rules are applied as follows: All possible matches of all rule
patterns are searched first without changing the hypergraph. But only those
matches are selected which satisfy the corresponding application conditions. In
a second step, the corresponding result hypergraphs are instantiated in parallel
for each valid match of the corresponding pattern. All these hypergraphs are
connected by common nodes according to the correspondence between nodes
of the hypergraph model and the reduced one. 3
The reduced hypergraph model now directly represents the structure of the
diagram which is syntactically analyzed by the parser.
3.3 Parsing
The syntactic structure of a diagram is described in terms of its reduced hypergraph model, i.e., a diagram language corresponds to a class of hypergraphs.
In the literature, there exist two main approaches for specifying graph or hypergraph classes. The first one uses a graph schema which is a kind of EntityRelationship diagram that describes how edges and nodes of certain types may
interconnect (e.g., EER [11]). The other one uses some kind of graph or hyper3
In a formal treatment, each reduction rule (P, R) represents a hypergraph morphism P → P ∪R where P ∪R is the union of the pattern with the result hypergraph.
Corresponding nodes of P and R as well as identified nodes of R are identified in
P ∪R. The reduced hypergraph model is computed by first creating the colimes of all
match morphisms of the different patterns into the hypergraph model together with
all these morphisms P → P ∪ R, and then removing the edges and “unnecessary”
nodes of the hypergraph model from the colimes hypergraph [10].
12
graph grammar (e.g. [12]) which generalizes the idea of Chomsky grammars
for strings which are also used by standard compiler generators [13]. Because
of the similarity of diagram analysis with program analysis being performed by
compilers and the availability of derivation trees and directed acyclic graphs
(DAGs, see below) which easily allow to represent the syntactic structure of
a diagram, DiaGen uses a hypergraph grammar approach for specifying the
class of reduced hypergraph models of the diagram language.
As already mentioned, hypergraph grammars are similar to string grammars.
Each hypergraph grammar consists of two finite sets of terminal and nonterminal hyperedge labels and a starting hypergraph which contains nonterminally
labeled hyperedges only. Syntax is described by a set of hypergraph transformation rules which are called productions in this context. The hypergraph
class or language of the grammar is defined by the set of terminally labeled
hypergraphs which can be derived from the starting hypergraph in a finite
derivation sequence.
There are different types of hypergraph grammars which impose restrictions
on the LHS and RHS of each production as well as the allowed sequence of
derivation steps. Context-free hypergraph grammars are the simplest ones:
each LHS has to consist of a single nonterminally labeled hyperedge together
with the appropriate number of nodes. Application of such a production removes the LHS hyperedge and replaces it by the RHS. Matching node labels
of LHS and RHS determine how the RHS has to fit in after removing the
LHS hyperedge. The productions of Fig. 7 are context-free ones. Productions
L ::= R1 , L ::= R2 , . . . with the same LHS are drawn as L ::= R1 |R2 | . . .
Actually, Fig. 7 shows the productions of a hypergraph grammar whose language is just the set of all reduced hypergraph models of structured flowcharts,
i.e., flowcharts whose blocks have a single entry and a single exit only. The
types statement, condition, and conn are terminal hyperedge labels being
used in reduced hypergraph models. The set of nonterminal labels consists
of Flowchart, BlockSeq, Block, and Conn. Flowchart edges do not connect to
any node (arity 0). The starting hypergraph consists of just a single Flowchart
edge. Again, conn edges, and now Conn edges, too, are grayed out since they
are actually not required for free-hand editing, but for syntax-directed editing
(cf. Section 4).
Context-free hypergraph grammars can describe only very limited hypergraph
languages [12,14] and, therefore, are not suited for specifying the syntax of
many diagram languages. 4 Context-free hypergraph grammars with embeddings are more expressive than context-free ones. They additionally allow
4
Actually, the only diagram languages that we know about and which can be
described by context-free grammars are Nassi-Shneiderman diagrams [15], syntax
diagrams [16] and flowcharts as used in this paper.
13
begin
a
a
a
::=
Flowchart
BlockSeq
::=
BlockSeq
Block
Conn
b
b
b
Conn
a
Conn
Conn
b
a
::=
condition
Conn
a
b
a
condition
Block
conn
BlockSeq
end
a
Conn
conn
::=
Conn
Block
b
condition
statement
b
BlockSeq
BlockSeq
BlockSeq
BlockSeq
b
a
condition
a
a
b
Conn
b
Conn
condition
a
BlockSeq
BlockSeq
Conn
BlockSeq
Conn
BlockSeq
condition
condition
b
b
Fig. 7. Productions of a grammar for the reduced hypergraph models of flowcharts.
embedding productions L ::= R where the RHS R extends the LHS L ⊆ R
by some edges and nodes, which are “embedded” into the context provided
by the LHS when applying such a production. This very limited treatment of
context has been chosen since it has proven sufficient for all diagram languages
which have been treated with DiaGen, but still allows for efficient parsing;
context-free hypergraph grammars with embeddings even appear to be suitable for all possible kinds of diagram languages. 5 Parsing algorithms and a
more detailed description of both grammar types can be found in [19,17,10].
The most prominent feature of the parsing algorithms being used in DiaGen
editors is their capability of dealing with diagram errors: Erroneous diagrams
resp. their reduced hypergraph models are not just rejected. Instead, maximal
subdiagrams resp. sub-hypergraphs are identified which are correct with respect to the hypergraph grammar. Feedback about these correct subdiagrams
is provided to the user by drawing all diagram components with the same
color whose representing edges belong to the same correct sub-hypergraph.
The result of this step of diagram analysis is the derivation structure of the
reduced hypergraph which describes the syntactic structure of the diagram.
The derivation structure — similar to context-free string grammars — is a
derivation tree if a context-free hypergraph grammar is used (For context-free
hypergraph grammars with embeddings, it is a directed acyclic graph, the
derivation DAG [17,10]). The tree root represents the nonterminal edge of
the starting hypergraph, and the (terminal) edges of the reduced hypergraph
5
Plain context-free grammars with embeddings may be too restricted for some
diagram languages, e.g., UML class diagrams [17]. However, DiaGen allows to
restrict productions by application conditions. With this feature, DiaGen can be
applied to real-world languages like Statecharts and UML class diagrams [18,6].
14
Flowchart
begin(a)
BlockSeq(a,i)
end(i)
Block(a,b)
BlockSeq(b,i)
statement(a,b)
Block(b,c)
statement(b,c)
BlockSeq(c,i)
Block(c,e)
condition(c,d,e)
BlockSeq(e,i)
BlockSeq(d,c)
Block(d,h)
condition(d,f,g)
Block(e,i)
BlockSeq(h,c)
BlockSeq(f,h)
BlockSeq(g,h)
Block(h,c)
Block(f,h)
Block(g,h)
statement(h,c)
statement(f,h)
statement(g,h)
statement(e,i)
Fig. 8. Derivation tree of the reduced hypergraph model of Fig. 6 according to the
grammar of Fig. 7 when omitting any conn edge.
model are represented as leaves of the tree. Fig. 8 shows the derivation tree of
the reduced hypergraph model of Fig. 6. Any conn edge, however, has been
omitted for simplicity. Edges are written as their edge labels together with the
labels of their visited nodes in parentheses.
3.4 Attribute evaluation
The task of the final step of diagram analysis is translating the diagram into
some data structure which is specific for the application domain where the
diagram editor is used. If, e.g., the flowchart editor is used as part of a programming tool, it should probably create some textual representation of the
flowchart. For that purpose, DiaGen uses a common syntax-directed translation mechanism based on attribute evaluation similar to those of attribute
string grammars [13]: Each hyperedge carries some attributes. Number and
types of these attributes which have to be specified by the editor developer
depend on the hyperedge label. Productions of the hypergraph grammar may
be augmented by attribute evaluation rules which compute values of some attributes that are accessible through those edges which are referred to by the
production.
After parsing, attribute evaluation works as follows: Each hyperedge which
occurs in the derivation tree (or DAG in general) has a distinct number of
attributes; grammar productions which have been used for creating the tree
impose rules how attribute values are computed as soon the value of others
are known. Some (or even all) attribute values of terminal edges are already
known; they have been derived from attributes of the diagram components
during the reducing step (This feature has been omitted in Section 3.2). The
attribute evaluation mechanism of the editor then computes a valid evaluation
order. Please note that DiaGen does not require a specific form of attributed
definition like S- or L-attributed definitions [13]. At least when dealing with
15
derivation DAGs these forms would fail. The editor developer, therefore, is
allowed to define evaluation rules rather freely for each grammar production,
and the evaluation mechanism has to determine an evaluation order for each
diagram analysis run anew. Of course, the developer has to be careful in order
not to introduce inconsistencies or cyclic attribute dependencies.
Syntax-directed translation in the context of flowcharts is rather simple. An
obvious data structure representing a flowchart is textual program, e.g., in
Pascal-like notation which is possible since syntactically flowcharts are well
structured (at least when using the hypergraph grammar as shown in Fig. 7).
For that purpose, each hyperedge needs a single attribute of type String: the
terminal hyperedges contain the text of their corresponding diagram components whereas the nonterminal hyperedges contain the program text of their
sub-diagram. Attribute evaluation rules are straight-forward.
Attribute evaluation is the last step of diagram analysis when editing diagrams
by free-hand editing. The following section shows that syntax-directed editing
is seamlessly integrated into DiaGen which means that editors make use of the
diagram analysis as it has been described above even when editing diagrams
in a syntax-directed way.
4
Syntax-directed Editing
As discussed in the introduction, syntax-directed editing has several important
benefits. Other approaches for free-hand editing which do not make use of abstract internal models (e.g., the Penguins system being based on constraint
multiset grammars [3,20]) cannot extend free-hand editing by syntax-directed
editing, which requires such an abstract model. But since the DiaGen approach is based on such a model (the hypergraph model), it is quite obvious to offer syntax-directed editing, too. However, free-hand editing using a
parser requires that the hypergraph grammar remains the only syntax description of the reduced hypergraph model and thus the diagram language.
Syntax-directed editing operations must not change the syntax of the diagram language; they can only offer some additional support to the user. This
requirement has two immediate consequences:
• It is possible to specify editing rules that deliberately transform a correct
diagram into an incorrect one with respect to the hypergraph grammar. This
might appear to be an undesired feature; but consider the process of creating
a complex diagram: the intermediate “drawings” need not, and generally do
not make up a correct diagram, only the final “drawing”. In order to support
those intermediate incorrect results, syntax-directed editing operations have
to allow for such “disimprovements”, too.
16
• Editing operations are quite similar to macros in off-the-shelf text and
graphics editors; they combine several actions, which can also be performed
by free-hand editing, into one complex editing operation. However, syntaxdirected editing rules are actually much more powerful than such macros
which offer only recording of editing operations and their playback as a
complex operation: syntax-directed editing operations also take care of providing a valid diagram layout where this is possible (incorrect diagrams in
general have no valid layout.) Furthermore, editing operations can take into
account context information, and they may have rather complex application
conditions.
This makes use of graph transformation an obvious choice for adding syntaxdirected editing to the free-hand editing mode: Editing operations are specified
by hypergraph transformations on the hypergraph model as shown in Fig. 2.
In the following it is explained why hypergraph transformations may have
to use information from the reduced hypergraph model and the derivation
structure, too. Whenever the hypergraph model has been changed by some
transformation, it has to be parsed again. The results of the parser are then
used to indicate correct subdiagrams and to create a valid layout for them
(cf. Section 5). Please note that the hypergraph model is directly modified by
the transformation rules; the modeling step, which is necessary for free-hand
editing, does not take place.
In the following, two examples of editing operations for a flowchart editor
are used for describing specification and realization of syntax-directed editing operations. The first example demonstrates the use of simple hypergraph
transformation rules whereas the second one shows why additional information from the reduced hypergraph model as well as the derivation DAG may
be necessary.
4.1 Example 1: Simple hypergraph transformation rules
Fig. 9 shows an example of a syntax-directed editing operation which adds
a new statement below an existing one in a flowchart editor. The situation
just before applying the editing operation is depicted in Fig. 9a. The topmost
statement has been selected which is indicated by a thick border and gray
handles; the editing operation whose hypergraph transformation rule is shown
in Fig. 9b adds a new statement just below this selected one. The result is
shown in Fig. 9c.
The hypergraph transformation rule in Fig. 9b is depicted as before: LHS and
RHS are separated by “⇒”, corresponding edges and nodes of LHS and RHS
carry the same labels. Host nodes and edges which match the LHS without
17
a)
b)
1
1
x
box
1
2
e box
c)
a1
x
vArrow
e
2
3
flowOut
a2
a
flowIn
2
a
flowOut
b1
b
flowOut
b
1
box
2
b2
Fig. 9. A syntax-directed editing operation which inserts a new statement below a
selected one.
an identically labeled counterpart in the RHS are removed when applying
the rule. The marked box hyperedge of the LHS indicates that this edge has
to match the hypergraph model edge of the diagram component which has
been selected by the editor user. When applied, this rule removes the flowOut
relation edge which connects the selected statement box with an outgoing
line or arrow (which is not specified here); a new vertical arrow and a new
statement box together with some relation edges are added. After applying
the rule, the resulting hypergraph is reduced and parsed (cf. Fig. 2). The
layouter can then properly layout the resulting diagram which now contains
a new statement box (this box carries the default text “Action” in Fig. 9c.)
Fig. 10 shows the concrete specification of this simple editing operation together with its transformation rule. In DiaGen, syntax-directed editing operations are specified in terms of simple rules and complex operations quite
similar to rules and transformation units in GRACE [21] as shown in the
following.
A rule (add rule in Fig. 10) is specified as its LHS (as a list of edges) and how
its RHS “differs” from its LHS, i.e., which edges are removed (indicated by -)
and which ones are added (indicated by +) by the rule. Each hyperedge is again
written as its edge type together with its visited nodes in parentheses. The
node hyperedges are special: they are actually pseudo edges which allow to
refer to nodes with the same notation as edges. The LHS in Fig. 10 consists of a
box edge, a flowOut edge, some nodes and a node pseudo edge which is used to
rule add_rule:
box(_,a) f:flowOut(a,b) n:node(a)
do -f
+vArrow(a1,_,a2) { OperationSupport.createVArrow(n) }
+box(b1,b2) { OperationSupport.createBox(n) }
+flowOut(a,a1)
+flowIn(a2,b1)
+flowOut(b2,b);
operation add_stmt_after_stmt "Add statement" :
specify box b "select statement"
do add_rule(b);
Fig. 10. DiaGen specification of adding a statement below another statement.
18
refer to node a. Applying the rule removes the flowOut edge (indicated by -f
where f is the edge reference introduced in the LHS). Furthermore, a vArrow
instance etc. are added to the hypergraph model. The Java methods in curly
braces are responsible for creating the corresponding diagram components,
i.e., a vertical arrow and a statement box.
Each syntax-directed editing operation is specified by a complex operation
defined in terms of rules; a control program describes how the operation is
defined by a sequence of rules or more complex control structures. Control
programs in DiaGen have been inspired by [21] and [22], but their semantics
is much simpler because backtracking is not performed [10]. Fig. 10 shows
the operation add stmt after stmt which uses the trivial control program
that simply calls a single rule. The operation of Fig. 10 requires a statement
box as parameter b (indicated by specify box b. . . ) and which simply calls
the add rule rule that has been described above. The parameter b that is
passed to this rule simply defines a partial match when applying this rule.
The corresponding formal parameters are the first edges which are specified
in the LHS of the “invoked” rule.
An important issue of syntax-directed editing is the question how to select
those parts of the diagram that are affected by the application of an editing
operation. In DiaGen, this has been solved by adding parameters to complex
operations (indicated by specify box b. . . in Fig. 10). When the user selects
an editing operation for application, the editor requests the user to specify a
single diagram component for each of the parameters of the operation. The
hyperedges that internally represent these components specify a partial match
which is then used to select where the operation and its rules have to be applied. DiaGen simplifies this user interaction process: When a diagram component is selected, the editor offers those editing operations to the user which
require a diagram component of the selected type as a first parameter. When
the user selects one of those operations, the editor asks for the missing parameters. However, many operations, e.g., the add stmt after stmt operation,
require just a single parameter, i.e., no further user interaction is necessary
after selecting the operation.
4.2 Example 2: Utilizing additional information
The former example has been rather simple in the sense that its operation
can be described with just a single transformation rule. Furthermore, it uses
only information which is readily available in the hypergraph model. This
subsection outlines that editing operations are in general more complicated
and have to use additional information beyond the plain hypergraph model.
Fig. 11 shows such an operation in action with screenshots just before and after
19
a)
b)
Fig. 11. A syntax-directed editing operation which removes a conditional block.
applying it. 6 Its task is removing a conditional block which the user has chosen
by selecting its condition diamond. Unlike the former example, the number
of edges which have to be removed is unknown when the operation is being
specified. It is, moreover, difficult to decide whether a diagram component
and its hyperedge belong to the conditional block when solely considering the
hypergraph model. However, since this is a problem of diagram syntax, it is
quite an easy task when also using syntactic information from the last parsing
step: The operation has to remove all leaves of the Block(d, h)-subtree of the
derivation tree in Fig. 8.
The crucial task of the editing operation is thus to find the Block(d, h)-node
of the derivation tree and — from there — all terminal hyperedges which can
be reached by paths from this tree node. Finally, their corresponding component edges as well as diagram components have to be identified. Apparently,
editing operations have to take into account information which has been collected during diagram analysis, i.e., information from the reduced hypergraph
model and from the derivation structure (cf. Fig. 2). DiaGen editors make
this information available by so-called cross-model links which connect corresponding nodes and edges of hypergraph model, reduced hypergraph model,
and derivation DAG. Path expressions allow to specify how to navigate in and
between models using these cross-model links. For our sample operation, this
is shown in Fig. 12 which, because of lack of space, does neither show these
path expressions nor the hypergraph model, but only the diagram, its reduced
hypergraph model, and its (simplified) derivation tree (cf. Figures 11a, 6,
and 8). Thick arrows indicate how models are used to find, starting from the
selected condition diamond, those terminal statement hyperedges which belong to the conditional block. Dashed edges show how they correspond to the
diagram components (resp. their component hyperedges which are omitted
here) which have to be removed from the diagram.
Please note that not only statement boxes and condition diamonds have to be
removed by this operation, but also lines and arrows. In order to also match
them by path expressions, these components must have been represented in
the reduced hypergraph model as well as in the derivation tree. This was the
6
Actually, Fig. 11a shows the same diagram as Fig. 3, but with a condition selected.
20
begin
conn
a
statement
conn
b
statement
conn
conn
conn
conn
conn
c
conn
conn
conn
conn
d
e
conn
conn
condition
f
g
condition
conn
conn
statement
conn
statement
statement
i
h
conn
conn
conn
end
statement
Flowchart
begin(a)
BlockSeq(a,i)
end(i)
Block(a,b)
statement(a,b)
BlockSeq(b,i)
Block(b,c)
statement(b,c)
BlockSeq(c,i)
Block(c,e)
condition(c,d,e)
BlockSeq(e,i)
BlockSeq(d,c)
Block(d,h)
condition(d,f,g)
BlockSeq(f,h)
Block(e,i)
BlockSeq(h,c)
BlockSeq(g,h)
Block(h,c)
Block(f,h)
Block(g,h)
statement(h,c)
statement(f,h)
statement(g,h)
statement(e,i)
Fig. 12. Using cross-model information for editing operations
reason for using the conn and Conn edges which, for clarity, have been omitted
in Section 3 and also in the derivation tree of Fig. 12.
5
Automatic Layout
As it has become clear in the previous section, transformations on the hypergraph model modify the structure of the internal model, but they do not
describe their effects on the position or the size of the diagram components; an
automatic layout mechanism which considers the diagram syntax is needed.
DiaGen offers two kinds of automatic layout support:
Tailored layout modules can be programmed by hand. Such a layout is connected to diagram analysis by a generic Java interface to attribute evaluation
(cf. Fig. 2). Information about the syntactic structure of the diagram has to be
prepared by syntax-directed attribute evaluation first. The layout module then
uses this information to compute a diagram layout. Some generic layout modules have been realized already, e.g., a force-directed layout algorithm (cf. [23])
which is used in a Statechart as well a UML class diagram editor [18,6].
Programming such a layout module by hand is quite complicated. For reducing
21
this effort, DiaGen offers constraint-based specification of diagram layout and
computing diagram layout by a constraint solver as in earlier work of ours [24]:
The main idea is to describe a diagram layout in terms of values which are
assigned to the attributes of the diagram components (e.g., their position). A
valid diagram layout is specified by a set of constraints on these attributes;
the constraint set is determined by the syntactic structure of the diagram
similar to the syntax-directed translation by attribute evaluation: Hyperedges
of the hypergraph model and terminal as well as nonterminal hyperedges of the
reduced hypergraph model carry additional layout attributes, and reduction
step rules as well as grammar productions are augmented by constraints on
their accessible attributes. These constraints are added to the set of constraints
which specify a diagram layout whenever the corresponding rule or production
is instantiated during the reduction step or parsing process.
It is important to define layout constraints not only in the hypergraph grammar which is used during the parsing step, but also in the rule set which
specifies the reduction step (cf. Fig. 2). This is so because the reduction step
may “reduce away” the explicit representation of some specific diagram components (e.g., lines in our flowchart example). If we had restricted specification
of layout constraints to the hypergraph grammar, we would not be able to describe the layout of those diagram components. For flowcharts, e.g., constraints
have to require a minimum length of lines and arrows.
Automatic layout is not restricted to syntax-directed editing. The same information is also available during free-hand editing. Editors being specified
and generated by DiaGen therefore offer an intelligent diagram mode where
diagram components may be modified arbitrarily, but the other components,
especially their position, may be affected by these modifications, too. The
layouter takes care of modifying the overall appearance of the diagram such
that its syntax is preserved and the layout beautified. This work on intelligent
diagrams is similar to the approach by Chok, Marriott, and Paton [20].
6
Conclusions
This paper has presented DiaGen, a rapid-prototyping tool based on hypergraph transformation for creating diagram editors that support free-hand
editing as well as syntax-directed editing. By supporting both editing modes
in one editor, it combines the positive aspects of both modes, i.e., unrestricted
editing capabilities and convenient syntax-directed editing. The approach has
proven to be powerful and general in the sense that it supports quick prototyping of diagram editors and does not restrict the class of diagram languages which it can be applied to. This has been demonstrated by several
diagram languages for which diagram editors have already been generated,
22
e.g., flowcharts, Nassi-Shneiderman diagrams [19], syntax diagrams [16], a visual λ-calculus [25], ladder diagrams [26], MSC [17], UML class diagrams,
signal interpreted Petri nets and SFC diagrams [27].
The approach which has been presented in this paper appears to be quite similar to the approach of Rekers and Schürr [5] which has already been outlined
in Section 1. Both approaches make use of two hypergraphs resp. graphs. The
spatial relationship graph (SRG) in Reker’s and Schürr’s approach is quite
similar to the hypergraph model of DiaGen. But their abstract syntax graph
(ASG), which represents the abstract meaning of the diagram, has been introduced for a different reason than the reduced hypergraph model of DiaGen: hypergraph models (and also SRGs) are generally quite complicated such
that there is no hypergraph parser which can analyze an hypergraph model.
Therefore, DiaGen reduces the hypergraph model and parses the much simpler reduced hypergraph model instead of the hypergraph model. As we have
demonstrated, parsing of the reduced hypergraph model can be performed efficiently [10]. However in Reker’s and Schürr’s approach, SRG and ASG are
always strongly coupled since they use triple graph grammars for defining the
syntax of the SRG and the ASG with one formalism; the ASG has not been
introduced for reducing complexity. Instead, a graph grammar parser has to
analyze the SRG directly; the ASG (i.e., the abstract meaning of the diagram)
is not parsed, it is created as a “side-effect” of the parsing of the SRG during
free-hand editing. The requirement for a graph parser for the SRG imposes a
strong restriction on this approach.
The concepts of this paper have been implemented with constraint-based automatic layout based on the constraint solver QOCA by Chok and Marriott [20].
Their Penguins system also allows to generate free-hand editors, however
they do not generate an internal model, but use constraint multiset grammars
(CMGs) [3]. The hypergraph grammar approach of DiaGen appears to be
better suited to the problem since they report a performance that is about two
orders of magnitude worse than the performance of DiaGen editors on comparable computers. Furthermore, their system cannot support syntax-directed
editing since they do not use an intermediate internal model.
As the examples of syntax-directed editing operations suggest, it appears to
be unsatisfactory to some extent to specify syntax-directed editing operations
on the less abstract hypergraph model instead of the reduced one which appears to be better suited for syntax-directed editing (cf. Reker’s and Schürr’s
approach [5]). However, since the mapping from the hypergraph model to the
reduced one is non-injective, the approach which has been presented in this
paper does not leave much choice if expressiveness should not be sacrificed.
However, future work will investigate where specifying syntax-directed editing
operations on the more abstract hypergraph model is sufficient.
23
References
[1] R. Bardohl, GenGEd: A generic graphical editor for visual languages based on
algebraic graph grammars, in: VL’98 [28], pp. 48–55.
[2] H. Göttler, Graph grammars and diagram editing, in: Graph Grammars and
Their Application to Computer Science, Vol. 291 of Lecture Notes in Computer
Science, 1987, pp. 216–231.
[3] S. S. Chok, K. Marriott, Automatic construction of user interfaces from
constraint multiset grammars, in: Proc. 1995 IEEE Symp. on Visual Languages,
Darmstadt, Germany, IEEE Computer Society Press, 1995, pp. 242–249.
[4] D.-Q. Zhang, K. Zhang, VisPro: A visual language generation toolset, in: VL’98
[28], pp. 195–201.
[5] J. Rekers, A. Schürr, A graph based framework for the implementation of
visual environments, in: Proc. 1996 IEEE Symp. on Visual Languages, Boulder,
Colorado, IEEE Computer Society Press, 1996, pp. 148–155.
[6] DiaGen web site http://www2.informatik.uni-erlangen.de/DiaGen.
[7] A. Corradini, H. Ehrig, R. Heckel, M. Löwe, U. Montanari, F. Rossi, Algebraic
approaches to graph transformation - part I: Basic concepts and double pushout
approach, in: Rozenberg [29], Ch. 3, pp. 163–246.
[8] A. Corradini, H. Ehrig, R. Heckel, M. Korff, M. Löwe, L. Ribeiro, A. Wagner,
Algebraic approaches to graph transformation - part II: Single pushout
approach and comparison with double pushout approach, in: Rozenberg [29],
Ch. 4, pp. 247–312.
[9] D. Plump, Computing by graph rewriting, Habilitationsschrift, Universität
Bremen (1999).
[10] M. Minas, Specifying and generating diagram editors, Habilitationsschrift,
Universität Erlangen, Germany, [In German] (To appear 2001).
[11] J. Ebert, A. Winter, P. Dahm, A. Franzke, R. Süttenbach, Graph based
modeling and implementation with EER/GRAL, in: B. Thalheim (Ed.), Proc.
15th International Conference on Conceptual Modeling (ER’96), Vol. 1157 of
Lecture Notes in Computer Science, Springer, 1996, pp. 163–178.
[12] A. Habel, Hyperedge Replacement: Grammars and Languages, Vol. 643 of
Lecture Notes in Computer Science, Springer, 1992.
[13] A. V. Aho, R. Sethi, J. D. Ullman, Compilers – Principles, Techniques, and
Tools, Addison-Wesley, 1986.
[14] F. Drewes, A. Habel, H.-J. Kreowski, Hyperedge replacement graph grammars,
in: Rozenberg [29], Ch. 2, pp. 95–162.
[15] I. Nassi, B. Shneiderman, Flowchart techniques for structured programming,
ACM SIGPLAN Notices 8 (8) (1973) 12–26.
24
[16] K. Jensen, N. Wirth, Pascal User Manual and Report, 2nd Edition, Springer,
1975.
[17] R. Bardohl, M. Minas, A. Schürr, G. Taentzer, Application of graph
transformation to visual languages, in: H. Ehrig, G. Engels, H.-J. Kreowski,
G. Rozenberg (Eds.), Handbook of Graph Grammars and Computing by Graph
Transformation. Vol. II: Applications, Languages and Tools, World Scientific,
Singapore, 1999, pp. 105–180.
[18] M. Minas, B. Hoffmann, Specifying and implementing visual process modeling
languages with diagen, in: Satellite Workshop to ETAPS’2001, on Uniform
Approaches to Graphical Process Specification Techniques (UniGra’2001),
March 31/April 1, 2001, Genova, Italy, 2001, to appear.
[19] M. Minas, Diagram editing with hypergraph parser support, in: Proc. 1997
IEEE Symp. on Visual Languages, Capri, Italy, IEEE Computer Society Press,
1997, pp. 230–237.
[20] S. S. Chok, K. Marriott, T. Paton, Constraint-based diagram beautification, in:
Proc. 1999 IEEE Symp. on Visual Languages, Tokyo, Japan, IEEE Computer
Society Press, 1999.
[21] M. Andries, G. Engels, A. Habel, B. Hoffmann, H.-J. Kreowski, S. Kuske,
D. Plump, A. Schürr, G. Taentzer, Graph transformation for specification and
programming, Science of Computer Programming 34 (1999) 1–54.
[22] A. Schürr, Programmed graph replacement systems, in: Rozenberg [29], Ch. 7,
pp. 479–546.
[23] F. Brandenburg, M. Himsolt, C. Rohrer, An experimental comparison of forcedirected and randomized graph drawing algorithms, in: Proc. Graph Drawing
1995 (GD’95), LNCS 1027, 1995, pp. 76–87.
[24] M. Minas, G. Viehstaedt, Specification of diagram editors providing layout
adjustment with minimal change, in: Proc. 1993 IEEE Symp. on Visual
Languages, Bergen, Norway, IEEE Computer Society Press, 1993.
[25] M. Minas, Automatically generating environments for dynamic diagram
languages, in: VL’98 [28], pp. 70–71.
[26] M. Minas, Creating semantic representations of diagrams, in: M. Nagl,
A. Schürr (Eds.), Int. Workshop on Applications of Graph Transformations
with Industrial Relevance (Agtive’99), Selected Papers, Vol. 1779 of Lecture
Notes in Computer Science, Springer, 2000, pp. 209–224.
[27] International Standard 61131 A: Programmable Logic Controllers, Part 3:
Languages (1992).
[28] Proc. 1998 IEEE Symp. on Visual Languages, Halifax, Canada, IEEE Computer
Society Press, 1998.
[29] G. Rozenberg (Ed.), Handbook of Graph Grammars and Computing by Graph
Transformation, Vol. I: Foundations, World Scientific, Singapore, 1997.
25