1
SIS - Graphical Analysis Interface
User’s Manual
Version 2.3
Institute of Computer Science
Foundation for Research and Technology - Hellas
SIS-Graphical Analysis Interface, User’s Manual
TABLE OF CONTENTS
1.
INTRODUCTION
5
1.1
General information
5
1.2
Knowledge representation in the SIS system
5
1.3
The SIS User Interface
5
2.
DESIGN AND USAGE OF THE USER INTERFACE
7
2.1
Menu Bar
7
2.2
Query Info Area
8
2.3
Query Results Area
9
2.4
Output Control Area
9
3.
MOUSE BUTTON USAGE CONVENTIONS
10
4.
OUTPUT CONTROL FUNCTIONS
11
4.1
Controlling the Depth of Recursive Queries
11
4.2
Splitting Graphs
11
4.3
Find
12
5.
5.1
QUERY RESULTS DISPLAY
13
Object Card
13
6.
HISTORY
16
6.1
History
16
7.
MENU BAR FUNCTIONS
18
7.1
File
7.1.1
Save
7.1.2
Save As
7.1.3
Page Setup
7.1.4
Print
7.1.5
Exit
18
18
19
20
20
21
7.2
Edit
7.2.1
Copy
7.2.2
Select All
7.2.3
Find
22
22
22
22
November 2000/v2.3
-3-
ICS-FORTH
SIS-Graphical Analysis Interface, User’s Manual
7.3
View
7.3.1
Text Output
7.3.2
Graph Layout
7.3.3
Depth
7.3.4
Split
7.3.5
Options
7.3.5.1
Colors
7.3.5.2
Fonts
7.3.5.3
Categories Options
7.3.5.4
General Options
23
23
24
25
25
25
25
26
28
29
7.4
Tree Views
7.4.1
Star View
7.4.2
Classification Tree
30
31
35
7.5
Queries
7.5.1
General Queries
7.5.1.1
Special Kinds
7.5.1.2
General Kinds
7.5.1.3
Object/Kind
38
39
39
40
41
7.6
Retrieval
42
7.7
Tools
44
7.8
Window
7.8.1
Text
7.8.2
Graph
7.8.3
Global View
7.8.4
History Of Commands
7.8.5
Object Card
45
45
45
45
46
46
APPENDIX A - CHANGES FROM PREVIOUS VERSIONS
November 2000/v2.3
-4-
48
ICS-FORTH
SIS-Graphical Analysis Interface, User’s Manual
1. Introduction
1.1 General information
The SIS system was developed at the Institute of Computer Science, Foundation of
Research and Technology - Hellas, as a generic user interface for information
retrieval from a SIS base. Information is organized in SIS as a knowledge base
according to a specifically designed semantic model. The construction of SIS allows
extremely dense linking of information, access by unlimited chained references,
expression of specific context (e.g. historical and cultural context) as well as of
abstract properties, joint temporal and spatial assignment in absolute or relative
terms, and recording alternative, possibly conflicting information along with the
respective sources. Information is presented in graphical or textual form. An
extensible list of predefined queries is offered. A particularly important feature is the
uniform treatment of schema and data, enabling the immediate extension and
modification of the schema by the users themselves. SIS can be characterized as
"open" system, in the sense that it involves a variable system of knowledge chiefly
addressed to the museum curator or the researcher, and from which closed
information bases for the public can be generated. Finally, it offers an interface to an
administrative documentation system.
1.2 Knowledge representation in the SIS system
The formatted documentation data are structured according to a model that renders an
appropriate ontology and is expressed in a particular knowledge representation
language. The structural part of the Telos knowledge representation language is used
for representing knowledge in SIS. This offers the general mechanisms of attribution,
classification and generalization, common in all the so called semantic, conceptual or
object-oriented representation methods, and, in addition, it supports unbounded
classification hierarchies and equal treatment of relations and entities, resulting in
great expressiveness and flexibility.
Attribution is a general mechanism for representing the properties of an object as
relations between the object and the value ranges of the properties, also considered as
objects. Classification defines classes of objects on the basis of common properties.
An atomic object is declared as instance (member) of one or more classes. Classes are
themselves considered as objects (sets), instances of meta-classes (sets of sets), and
so on. Thus, levels of classification are distinguished: tokens, classes, meta-classes,
etc. Generalization defines a subclass-superclass relation between classes at the same
level of classification, characterized by the inheritance of properties: when class A is
subclass of B, it inherits all the properties of B and is differentiated from it either by
having additional properties of its own, or by restricting the value ranges of the
inherited ones. Finally, every object (entity or relation) has a unique identifier.
1.3 The SIS User Interface
The SIS User Interface cooperates with the query processor of the SIS base.
Information can be retrieved from the SIS base, by executing one of a set of built-in
queries that are offered as a menu of Choices by the interface. The query processor
November 2000/v2.3
-5-
ICS-FORTH
SIS-Graphical Analysis Interface, User’s Manual
extracts data from the SIS base and displays the result on the screen. The result can
be seen in two ways: graphically, on the window of the graphical subsystem
(explained below) or textually, on a text-window. There are many types of predefined
queries; some of them are graphical (display the result in graphical mode), while
others are textual (display the result in textual mode). The current selection of the
query type is displayed by the query type field, which is always visible. A query may
have one parameter on which it operates or may have none. This parameter,
referenced in the following as Query Target, must be an object existing in the SIS
base. The Query Target is always visible and can be changed in multiple ways by the
user.
November 2000/v2.3
-6-
ICS-FORTH
SIS-Graphical Analysis Interface, User’s Manual
2. Design and usage of the User Interface
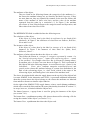
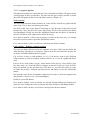
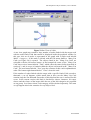
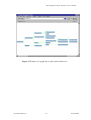
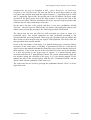
Initially, the window shown in Figure 1 is created. It is a window with frame, title
bar, minimize, maximize and menu buttons, with default behavior.
Figure 1: Initial window of the User Interface.
The window is divided in the following areas:
2.1 Menu Bar
The basic options that the SIS User Interface provides, appear in a Menu Bar,
consisting of eight menus.
File
a pulldown menu with options that are used for file and program operations
Edit
a pulldown menu with options offering text operations on the Query Result
Area
View
a pulldown menu containing options for controlling the appearance of User
Interface and also settings that affect the graph and text output
November 2000/v2.3
-7-
ICS-FORTH
SIS-Graphical Analysis Interface, User’s Manual
Tree Views
a pulldown menu with options that are used for controlling the display mode
and executing predefined recursive queries displayed in graphical mode
Queries
a pulldown menu with options that are used for executing predefined queries
shown in textual mode
Retrieval
a pulldown menu with options that are used for queries by classification facets
Tools
a pulldown menu with options for communication with external tools
Window
a pulldown menu with options that give all the available output
representations
In section 7 the above options are described in detail.
2.2 Query Info Area
The Query Info Area displays the current state of the tool. It consists of the following
subareas:
The Query Target is a single line text-editor, with common behavior, used to display
and update the query target i.e. the SIS base object or link on which a query is applied
on. To change the query target (initially empty), clear the current query target by using
the BackSpace or Delete keys, and write a new one. The first query that will use the
Query Target will check if the string is a name of an object or a link existing in the
database. If not, a warning appears and the query target has to be changed. In case of a
link-target, the full name of the link must be written: starting with the name of the
from-object, following with the “->” symbol and the link name(s) (e.g.
Object_name->link_name). The Query Target may also be changed automatically by
operations that are explained below.
The button Exec used for executing the last graphical query type selection on the
Query Target again. This is useful especially when the Query Target has just been
changed and we want to execute the last graphical query selection on the new target,
or when the SIS base contents are modified during a working session.
The button History, a popup frame is used for retrieving previous query commands
(see section 6.1).
The button Find is used to display the Pattern Search Card, which is used to search a
pattern in the textual or graphical window (see section 4.3).
The label beneath the Query Target, used for displaying the current query type (see
e.g. "StarView" in Figure 22). At startup the query type is TextView.
The label Items and a number which indicates the cardinality of the answer set of a
query. Initially there are 0 items.
November 2000/v2.3
-8-
ICS-FORTH
SIS-Graphical Analysis Interface, User’s Manual
2.3 Query Results Area
The Query Results Area is the area where the result of a query is displayed. This area
can be scrolled left-right or bottom-up, in case that the result is too big to fit in the
given window size. A query is either textual or graphical i.e. its results are displayed
in text or in graph form. In order to display the results of a textual query we use a
scrollable text window, while to display the results of a graphical query a graphical
subsystem is used to draw the graphs. The Query Results Area can be toggled
between the two windows with different display modes, without loosing the contents.
2.4 Output Control Area
The button Text switches the Query Results Area in textual mode. Whenever this
button is pressed, the display mode is switched in textual mode (if already in textual
mode nothing happens) and the result of the last executed textual query appears on
the Query Results Area.
The button Graph switches the Query Results Area in graphical mode. Whenever this
button is pressed, the display mode is switched in graphical mode (if already in
graphical mode nothing happens) and the result of the last executed graphical query
appears on the Query Results Area.
November 2000/v2.3
-9-
ICS-FORTH
SIS-Graphical Analysis Interface, User’s Manual
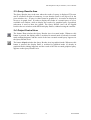
3. Mouse Button Usage Conventions
The mouse button is used uniformly. When the mouse is in a sensitive area, like the
"Object Card" or the "Query Result Area", buttons work as follows:
∗
the left-button sets the name of the selected node/link to the current query target,
∗
the middle-button1 sets the name of the selected node/link to the current query
target and the query type (reflected by the current graphical query label) is
executed on this query target,
∗
the right-button pops-up a window (the "Object Card") containing the textual
description of this node/link.
On any other case the mouse works as follows:
∗
1
the left-button triggers the command push buttons thus initiating the actions
attached to them,
With two-button mouse devices by double-clicking the left button simulates the middle-button.
November 2000/v2.3
-10-
ICS-FORTH
SIS-Graphical Analysis Interface, User’s Manual
4. Output Control Functions
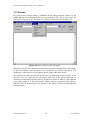
4.1 Controlling the Depth of Recursive Queries
GAIN provides a mechanism for controlling the query depth level i.e., the maximum
number of levels of a graph which are to be retrieved and displayed. This mechanism
is accessible through the Depth Control Frame, which consists of the following
elements:
• The ON/OFF toggle button, which enables or disables the depth control
mechanism.
• The Level Box, which displays the query depth level. You can set the desired
depth level by either using the Up and Down Arrow Buttons or typing a number
between 1 and 80 and pressing Enter.
• The Apply button is used to re-execute the current query and refresh the display
according to any new settings.
• The "Close" button used to close the frame.
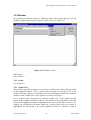
Figure 2 The Depth Control Frame.
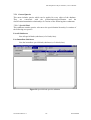
4.2 Splitting Graphs
In some cases the layout of specific graphs lacks readability due to a number of nodes
with high fun-in (number of links pointing to them). GAIN provides a graph splitting
mechanism for improving the readability of such graphs. Tuning of this mechanism
can be done using the Split Control frame, which consists of the following elements:
• The ON/OFF toggle button, which enables or disables the splitting mechanism.
• The Level Box, which displays the maximum node fun-in. You can set the desired
maximum node fun-in by either using the Up and Down Arrow Buttons or typing a
number between 2 and 10 and pressing Enter.
• The Apply button is used to re-execute the current query and refresh the display
according to any new settings.
• The "Close" button used to close the frame.
November 2000/v2.3
-11-
ICS-FORTH
SIS-Graphical Analysis Interface, User’s Manual
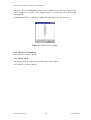
Figure 3 The Split Control frame
The query depth and graph spitting mechanisms are discussed in further detail in
Section 7.4.2 since their affection is better understood within the context of the Tree
Views provided by GAIN.
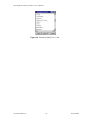
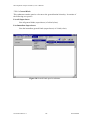
4.3 Find
The user has the possibility to search for a pattern in either the textual or the
graphical subwindow. By pushing the Find button, a card is opened which consists of
the following parts (see Figure 4):
• A single line text editor where the user can enter the string he or she wants to
search for. By pressing ENTER or the pushbutton "Find" (see below) the first
Figure 4 The Find window
occurrence of the pattern in the textual or graphical window (whichever of the two
is mapped on screen) is found, displayed and highlighted. If the pattern does not
exist in the current window, the user is appropriately warned.
• A pushbutton "Find" used to repeat the search for the pattern, as many times the
user wants. By pressing repeatedly on this button, the next occurrences of the
pattern on screen are found and highlighted. This can also be achieved by pressing
ENTER in the text editor of the card. When the last word containing the pattern is
found, the search continues from the beginning of the screen, that is, the search is
performed in circular mode.
• A pushbutton "Close" used to close the Find card.
One "Find" button with just the same functionality is also attached to every Object
Card (see section 5.1) and Many List Card (see section 7.4, Figure 24) for searching a
pattern within each of their text windows.
November 2000/v2.3
-12-
ICS-FORTH
SIS-Graphical Analysis Interface, User’s Manual
5. Query Results Display
There are two modes in which the system can be: textual and graphical. As a
consequence, there are also two kinds of queries: textual and graphical. The textual
queries are found under the menu option Queries and the graphical queries are found
under the menu option Tree Views. (See sections 7.4 and 7.5 respectively, for more
details.)
For each of the two modes there are internal variables that store the name of the last
executed query and the cardinality of the resulting answer set. These variables,
displayed on the current query type label and the item label, are updated every time a
new query is executed (either textual or graphical). (See Figure 1)
As mentioned above the user can switch between textual and graphical mode by using
the Text-Graph toggle button. When the mode changes, the current query label and
item label are also changed to be consistent with the query result currently displayed.
Apart from this explicit mechanism of changing mode, there are also implicit ones:
When the system is in textual mode and a graphical query is executed, the system
automatically switches to graphical mode and vice versa.
Another implicit mechanism for changing mode is provided by the History option
(see section 6.1).
Textual queries are displayed in a standard scrollable text window. In order to display
the result of a graphical query, the LABY graphical subsystem is used. It consists of a
window with horizontally and vertically scrolling ability. In this window the result of
a graphical query is displayed as a graph (of nodes and links).
The following selections can be made in both display modes.
1. Click the left mouse button on a node/link
The node/link becomes query target and the Query Target field in the Query Info
Area is updated to display the new selected value.
2. Click the middle mouse button on a node/link
The node/link becomes query target, the Query Target field in the Query Info
Area is updated to display the new selected value and the current query type is
executed on the new query target. Selection (2) has the same result as choosing
selection (1) and left-clicking with the mouse on the Exec button.
3. Click the right mouse button on a node/link
A textual description of this node/link, the object's Object Card appears on the
screen (see Figure 5).
In the current implementation of the system links are also selectable, so when we
refer to objects we consider nodes or links.
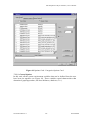
5.1 Object Card
The Object Card of an object contains the textual description for this object. The
object card shows the complete information that is immediately related to this object.
On the top of the card is declared the name of the object. The rest is divided into two
November 2000/v2.3
-13-
ICS-FORTH
SIS-Graphical Analysis Interface, User’s Manual
main fields, the DESCRIPTION field, with the description elements of this object,
and the REFERENCED field, with all the description elements of other objects,
which refer to this object. The DESCRIPTION field is subdivided into the following
areas:
The superclasses of the object.
If the object is a class, then all it's superclasses are listed by the label Has as
superclasses. In , class Place does not have any superclasses, so there exists
no such label. The ObjectCard, does not show all the applicable fields of an
object, but only those which have values.
Figure 5 "Object Card" window
The classes the object belongs to.
They are listed by the label Belongs to. For example, in Figure 5, the
Metaclasses that class Place belongs to are: RootClass, AbsoluteCoordinate,
SpatialMeasureType and Location.
November 2000/v2.3
-14-
ICS-FORTH
SIS-Graphical Analysis Interface, User’s Manual
The attributes of the object.
They are listed in the following format: the categories of the attributes (i.e.,
the classes the attribute belongs to), are listed by the label Properties. If they
are more than one, they are separated by commas. In the next line follows the
name of the attribute (if there exist one), and the value of the attribute
separated from the name by a semicolon (':'). In Figure 5, the attribute
placeName of class Place belongs to the categories name and dependent, and
takes values from class PlaceName.
The REFERENCED field is subdivided into the following areas:
The subclasses of the object.
If the object is a class, then by the label As subclasses by are listed all it's
subclasses. In Figure 5 the subclasses of class Place are Address, RelPlace,
Event and Period.
The instances of the object.
If the object is a class, then by the label As instance of by are listed all it's
instances. In Figure 5 the instances of class Place are: Sfakia, Souli,
Kallarites, Ithaca ....
The attributes of other objects that have the object as a value.
They follow the format As <category or categories separated by comma > by
the < kind of referencing object> : <name of the referencing object> : <name
of the attribute>. For example class Place has is referenced (among others),
by attribute place of class Event (not shown in Figure 5). This is presented in
the ObjectCard in the following manner: As mainCharacteristic, spatial by the
Individuals: ... Event: place. Attribute categories mainCharacteristic and
spatial are the classes the attribute belongs to, system class Individual is the
kind of the referencing object, i.e. class Event, which is the name of the
referencing object, and finally place is the name of the attribute itself.
The above description holds when the toggle button on the top-left of the ObjectCard
is at state SIMPLE. In the alternative state FULL, is presented additional information
about the system classes the object belongs to, the classes the attributes are inherited
from and the references-to that the object inherits.
On the right of the SIMPLE-FULL toggle button, exists a search bitmap pushbutton,
which offers search facilities and has the same functionality described in section 5.1,
its scope, however, is limited within the ObjectCard.
The button Instances, a popup frame is used for giving the instances of the object
(see section 7.4.1).
The button Save, a pushbutton opening a file chooser that used for selecting a file for
saving the contents of the object (see section 7.1.1).
The button Close, a pushbutton that closes the Object card.
November 2000/v2.3
-15-
ICS-FORTH
SIS-Graphical Analysis Interface, User’s Manual
For uniformity and consistency of the user interface, the three possible mouse
selections that can be made in the Query Results Area (see section 3) are valid in the
Object Card :
1. By clicking the left mouse button on a node/link, the current query target is
updated to the name of this node/link.
2. By clicking the middle mouse button on a node/link, the current query target is
updated to the name of this node/link, and the query type reflected by the current
graphical query label is executed on the new query target
3. By clicking the right mouse button on a node/link a new Object Card appears on
the screen. The maximum number of Object Cards that can be opened
simultaneously is 20.
The Object Card of a link contains the same information as in the case of a node and
additionally, the from and to – values of this link (see Figure 6):
Figure 6 "Object Card" window of a link
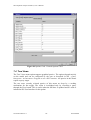
6. History
6.1 History
By pressing the History button, a window called "History List" appears on the screen
(see Figure 7).
November 2000/v2.3
-16-
ICS-FORTH
SIS-Graphical Analysis Interface, User’s Manual
Figure 7 The "History List" window
You can scroll it bottom-up. You can close the "History List" using the Close button,
placed on the bottom-right of the window, which is provided for this reason. This
button does not minimize the window to an icon, as the Close button from the frame
menu. By clicking the left mouse button on it, the history window disappears. If you
press the History button while the history window is already on the screen, then the
current window disappears and a new one appears with the same characteristics.
The History List is updated whenever you execute a graphical or textual query. The
format of a query in the list is
[State]_[Query]
[State]_[Query]_ON_[Target]
when the query does not need a target
when the query needs a target
State is T or G for textual or graphical query respectively.
Query is the type of the query (e.g. StarView, List_All_Files)
Target is the target on which the query is executed
You can re-execute a previously selected query by clicking the left mouse button on
the respective line of the History List. Then the query type is changed to [Query] and
the query target is updated to [Target] (if the currently selected query needs a target,
otherwise it is not changed). The textual queries set the display mode to text and the
graphical queries set the display mode to graph. This causes the result of the selected
query to be displayed on the screen immediately.
So, by choosing a previous query, you can change implicitly the query target, the
current query type and the current display mode.
November 2000/v2.3
-17-
ICS-FORTH
SIS-Graphical Analysis Interface, User’s Manual
7. Menu Bar Functions
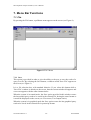
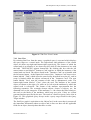
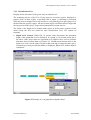
7.1 File
By pressing the File button, a pulldown menu appears on the screen (see Figure 8).
Figure 8 "File" Menu
7.1.1 Save
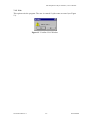
This option is provided in order to give the ability to the user to save the result of a
query in a file. By selecting the Save button, a window called "Save File" appears on
the screen (see Figure 9).
It is a file selection box, with standard behavior. If you select this button while a
"Save File" window is already on the screen, then the current window disappears and
a new one appears with the same characteristics.
When the system is in textual mode, the Save option provided in this window causes
the last textual query result to be saved in the selected file, having the same format as
it would be displayed on the screen (see View menu, Text Output choice)
When the system is in graphical mode the Save option causes the last graphical query
result to be saved in the selected file in postscript format.
November 2000/v2.3
-18-
ICS-FORTH
SIS-Graphical Analysis Interface, User’s Manual
Figure 9: The "Save" window
7.1.2 Save As
This option is provided in order to give the ability to the user to save the result of a
query in a different file than the previous one. By selecting the Save As button, the
window called "Save As" appears on the screen (see Figure 9).
November 2000/v2.3
-19-
ICS-FORTH
SIS-Graphical Analysis Interface, User’s Manual
7.1.3 Page Setup
This option is provided in order to give the ability to the user to setup the printer and
the paper layout (see Figure 10). Note : This window appears under WIN32 system).
Figure 10 “Page Setup” window
7.1.4 Print
This option is provided in order to give the ability to the user to print the result of a
query on a printer (see Figure 11). Note : This window appears under WIN32
system).
Figure 11 “Print” window
November 2000/v2.3
-20-
ICS-FORTH
SIS-Graphical Analysis Interface, User’s Manual
7.1.5 Exit
This option exits the program. The user is warned if (s)he wants to cancel (see Figure
12).
Figure 12 "Confirm Exit" Window
November 2000/v2.3
-21-
ICS-FORTH
SIS-Graphical Analysis Interface, User’s Manual
7.2 Edit
Figure 13: Edit menu
7.2.1 Copy
Copies the contents of the Query Results Area in the clipboard.
7.2.2 Select All
Selects the contents of the Query Results Area.
7.2.3 Find
See section 4.3
November 2000/v2.3
-22-
ICS-FORTH
SIS-Graphical Analysis Interface, User’s Manual
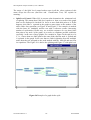
7.3 View
Figure 14 "View" menu
7.3.1 Text Output
By selecting the Text Output button a pulldown menu appears on the screen (see
Figure 15), which gives two choices, named Formatted and Unformatted. You can set
the text output to be in one of these two states.
When you select the Unformatted state, the result of textual queries are displayed in
simple form, which consists of the presentation of only the nodes existing in the
answer set. In this case, the full names of the nodes are displayed on screen.
When you select the Formatted state, additional information about these nodes is
displayed. This information is presented in form of columns. Each column
corresponds to an attribute of the nodes in the answer set. In this case, the kind of
each attribute appears as a label above the corresponding column. Long names may
be abbreviated before they are displayed on screen.
November 2000/v2.3
-23-
ICS-FORTH
SIS-Graphical Analysis Interface, User’s Manual
The default text output state is Formatted.
Figure 15 "Text Output" submenu
7.3.2 Graph Layout
By selecting the Graph Layout button a pulldown menu appears on the screen (see
Figure 16), which gives two choices, named Simple Lines and Bended Lines. You
can set the graph output to be in one of these two states.
When you select the Simple Lines state, the result of graphical queries are displayed
with straight lines. In this case, lines overlap with nodes.
When you select the Bended Lines state the result of graphical queries are displayed
with bended lines. In this case, a line becomes two or more in order to have minimum
overlapping with the nodes.
November 2000/v2.3
-24-
ICS-FORTH
SIS-Graphical Analysis Interface, User’s Manual
The default graph output state is Simple Lines.
Figure 16 "Graph Layout" submenu
7.3.3 Depth
See section 4.1.
7.3.4 Split
See section 4.2.
7.3.5 Options
This option is a new possibility that has been added in the SIS-GAIN regarding the
possibility of customization of the System User Interface. It is activated via View
menu. It is a notebook-like window with five different pages-cards. These are the
following:
•
Colors
•
Fonts
•
Categories Options
•
General Options
Their functionality is described below.
7.3.5.1 Colors
The colors of the User Interface and of Object Card can be changed through this card
(see Figure 17). The areas we can change the color are:
November 2000/v2.3
-25-
ICS-FORTH
SIS-Graphical Analysis Interface, User’s Manual
•
Working Area (Query Results or Text Input Areas)
•
Menu Area (menus – menu items)
•
Frame Area (the rest areas of SIS and Object card)
Use: Click on the corresponding button for the area its color you want to change. A
color chooser is opened and after selecting the desired color you quit by pressing the
OK button.
Figure 17 Options Card : Colors Card
7.3.5.2 Fonts
The fonts appearing on the different parts of the User Interface and of Object Card
can be changed through this card (see Figure 18). The areas we can change the font
are:
A) For SIS
•
Graphical Query Result (Tree Views Results)
•
Textual Query Result (Queries Results)
November 2000/v2.3
-26-
ICS-FORTH
SIS-Graphical Analysis Interface, User’s Manual
•
Text Input Area (area in which we can type text)
•
Labels of Text Input (The labels for the text input areas e.g. Query Target)
•
Title Labels (the font of titles: e.g. Items)
•
Buttons (text appearing on buttons e.g. Find)
•
Menus (text on menus)
B) For Object Card
•
Title (the title of the Object card)
•
Labels (the names of categories)
•
Values (the values of categories)
Use: Click on the corresponding button for the area its font you want to change. A
font chooser is opened and after selecting the desired font family, face and size you
quit by pressing the OK button.
Figure 18 Options Card : Fonts Card
November 2000/v2.3
-27-
ICS-FORTH
SIS-Graphical Analysis Interface, User’s Manual
7.3.5.3 Categories Options
Through this card the user can define the color, the nodes and links, will appear in the
various graphs of the User Interface. The user can also give priority in order to define
the order will appear at Star View and Object card (see Figure 19).
Node coloring
The user can define that all the instances of a class will be colored in a graph with the
same color. This is done as following described:
We click on the Class Name button. Following we type the name of the class beyond
the Specify Class. We chose the color and priority via the Color and Priority menus
correspondingly. Finally we press the Add/Modify button and our choice is inserted in
the list. (Current version supports four different colors).
If we want to modify a class color or priority we click on the class entry, we change
the color or priority and we press the Add/Modify button.
If we want to delete a class we click on it and press the Remove button.
Link coloring – Defining ordering priority
The user can define different colors for attributes of a class. (S)he can also define the
order that they will appear on a graph or Object card.(We can not define an order for
an object card different than that of a graph).
E.g. we have a class A with attributes a1, a2, a3, a4 and we want to give different
colors to them, as well as to appear with the order a2, a1, a3, a4 on a graph and object
card.
First of all we click on the Category Name button. In the Specify Class field we type
the class name (A). From the Select Category menu next to Specify Class field we
chose an attribute for the specified class. We chose a1, we chose the color we want,
we make the priority 1 using the up-down arrows and finally e press the Add/Modify
button.
We make the same for the a2 attribute with priority 0 (since we want it to appear first)
and priorities 2 and 3 for a3, a4 correspondingly.
Finally we press OK button.
If we want to modify a color or priority we pick the wanted attribute by clicking on it
in the list and e change the color or priority and at the end press Add/Modify button.
If we want to delete an entry we click on it and press the Remove button.
November 2000/v2.3
-28-
ICS-FORTH
SIS-Graphical Analysis Interface, User’s Manual
Figure 19 Options Card : Categories Options Card
7.3.5.4 General Options
In this card, all the system environment variables that can be defined from the user
have been put together (see Figure 20). These variables regard characteristics that
determine a graph appearance, the lines thickness, shadows, e.t.c.).
November 2000/v2.3
-29-
ICS-FORTH
SIS-Graphical Analysis Interface, User’s Manual
Figure 20 Options Card : General Options Card
7.4 Tree Views
The Tree Views menu option supports graphical queries. The options depend entirely
on the model and can be configured by the user as described in SIS - Query
Interpreter: An Interactive Program to use API Functions. All queries in this menu
require a query target.
The two more recently selected queries of this menu are kept by a caching
mechanism for fast toggle. The cache is invalidated only by executing a query
through the Exec button. This is useful when the SIS base is updated and we wish to
inform the SIS User Interface for the update.
November 2000/v2.3
-30-
ICS-FORTH
SIS-Graphical Analysis Interface, User’s Manual
Figure 21 "The Tree Views" menu
7.4.1 Star View
By selecting StarView from the menu, a graphical query is executed which displays
the query target as a central node. The superclasses and subclasses of the central
object are shown top-right and bottom-right respectively. The classes of which the
central node is an instance of, are shown top-left, while if it has instances a box with
the label ``INSTANCES'' appears bottom-left. By clicking this box with the left
mouse button a card labeled ``Instances Card'' appears, in which the instances of the
central node are listed. The objects listed in the ``Instances Card'' are selectable with
the left mouse button. At the bottom-left corner of the ``Instances Card'' there exist a
button labeled ``Find'', which offers the same facility described in section 4.3, and its
scope is limited within the objects referenced in the ``Instances Card''. The next
button labeled ``Sort'' sorts the contents of this card in alphanumeric order. The
bottom-right button labeled ``Close'' closes the card. The attribute of the central
object are shown on the right of it, while on it's left exist the attributes by which the
central node is referenced. The format of the attribute representation has the
following semantics: The rectangles denote objects, classes of objects, etc., the
diamonds refer to the categories of the attributes, i.e. the classes the links belong to,
the ovals to the labels of the attributes, which may not exist, if they are system
generated and not specified by the user. The result of a StarView query can be seen in
Figure 22. This graphical query always needs a query target found in the Query
Target window.
The StarView graph is equivalent to the ObjectCard, in the sense that it presents all
the immediate information about an object and it does not show all the applicable
fields for an object, but only those that have a value.
November 2000/v2.3
-31-
ICS-FORTH
SIS-Graphical Analysis Interface, User’s Manual
The title "StarView" is displayed in the Query type of the Query Info Area while the
"Items" label shows a "*" which is displayed only in the case of a StarView.
Figure 22 Star View
In case of a link-target a start view graph contains also the from and to-values of this
link (see Figure 23 : “Period” and “Place” are the from and to-values of link
“region”)
November 2000/v2.3
-32-
ICS-FORTH
SIS-Graphical Analysis Interface, User’s Manual
Figure 23 Star View of a link
A star view graph may contain a large number of nodes linked with the target node
with the same kind of link that cannot be displayed inside the graphical window. In
this case, this set of nodes is represented in the graph with a single node labeled
MANY <category>. If this node is clicked with the left mouse button a Many List
Card (see Figure 24) is opened. The objects listed in the ``Many List Card'' are
selectable with the left mouse button. At the bottom-left corner of the ``Many List
Card'' there exist a button labeled ``Find'', which offers the same facility described in
section 4.3, and its scope is limited within the objects referenced in the ``Many List
Card''. The next button labeled ``Sort'' sorts the contents of this card in alphanumeric
order. The bottom-right button labeled ``Close'' closes the card.
If the number of nodes linked with the target with a specific kind of link exceeds a
thousand, a cut off happens, which means that in this case the Many List Card
contains only the one thousand first nodes of this kind and the user is warned for this
event. In the current version, this limit is checked for classes, instances, IsA super
classes and sub classes of the target while the rest of the link categories are regarded
as one group. In a future release, each category will be checked separately. The same
cut off happens also in the contents of every Object Card.
November 2000/v2.3
-33-
ICS-FORTH
SIS-Graphical Analysis Interface, User’s Manual
Figure 24 "Instances/Many List" Card
November 2000/v2.3
-34-
ICS-FORTH
SIS-Graphical Analysis Interface, User’s Manual
7.4.2 Classification Tree
Display all the subclasses of the given class at schema level.
The remaining choices of the Tree Views menu are recursive queries, displayed as
graphs. Some of them require a specified kind of target. A checking is performed
when the menu is mapped on screen in order to verify that the given query target is of
the kind that the queries require. All queries that require a different kind of target that
the one present in the Query Target area automatically become inactive.
The usage of the Depth Level control makes sense in all the above options of this
menu except the first two (StarView and Classification Tree). We explain its
meaning:
•
Depth Level Control. When ON, its current value determines the maximum
depth of the graph that is to be displayed. If a graph is cut at some nodes due to
the above value, these nodes are presented to be linked with a circle to indicate
that other objects follow them (see Figure 25). Middle mouse button click on the
parent of a circle sets the Query Target to that node and executes the same query,
so that the previously not shown subtree is displayed. When OFF, infinite depth is
considered.
Figure 25 Example of a cut graph due to depth control
November 2000/v2.3
-35-
ICS-FORTH
SIS-Graphical Analysis Interface, User’s Manual
The usage of the Split Level control makes sense in all the above options of this
menu except the first two (StarView and Classification Tree). We explain its
meaning:
•
Split Level Control. When ON, its current value determines the minimum level
of splitting. This means that if this level equals to n then every node of the graph
that is to be displayed is checked if it has n or more links that point to it. If this
happens, this node is repeated at the graph so many times as the number of the
above links. One repetition (see Figure 26 and Figure 27 for example) is marked
with the letter M (multiple) and the rest with a reference counter (increasing
number of replications). In this way we avoid the existence of n (or more) links
that point to any node of the graph. As a result, we eliminate possible confusion
especially in the case of large graphs. For example in ,Figure 26 the split level is
2, i.e., if more than two links point to the same node, then the node is splited and
is repeated in the graph. In the case that are links originating from the multiple
node, then they are assigned to the node marked with the letter M and not from
its repetitions. The Figure 26 is before the splitting and Figure 27 with split level
2.
Figure 26 Example of a graph before split
November 2000/v2.3
-36-
ICS-FORTH
SIS-Graphical Analysis Interface, User’s Manual
Figure 27 Example of a graph due to split control with level 2
November 2000/v2.3
-37-
ICS-FORTH
SIS-Graphical Analysis Interface, User’s Manual
7.5 Queries
By pressing the Queries button, a pulldown menu, which depends entirely on the
model and can be configured by the user as described in SIS - Query Interpreter: An
Interactive Program to use API Functions, appears on the screen (see Figure 28).
Figure 28 Queries menu for the SIS model.
Whenever you execute a query from this menu, its result is displayed in textual mode,
on the text-window. Also an answer set is produced, as result of the query. The
cardinality of this answer set is displayed on the right of the label "Items".
The queries may either need or not an object of a certain kind as query target. In the
first case, the user must provide the system with one in the query target area. A
checking is performed when the menu is mapped on screen in order to verify that the
given query target is of the kind that the queries require. All queries that require a
different kind of target that the one present in the Query Target area automatically
become inactive.
November 2000/v2.3
-38-
ICS-FORTH
SIS-Graphical Analysis Interface, User’s Manual
7.5.1 General Queries
This menu includes queries which can be applied in every object of the database.
They are concerned with the generalization/specialization and the
classification/instantiation relationships. It consists of the following three submenus:
7.5.1.1 Special Kinds
This submenu contains queries relevant to the specialization hierarchy. It consists of
the following two queries:
List All Subclasses
Lists all special kinds (subclasses) of a kind (class).
List Immediate Subclasses
Lists the immediate special kinds (subclasses) of a kind (class).
Figure 29 Special kinds queries submenu
November 2000/v2.3
-39-
ICS-FORTH
SIS-Graphical Analysis Interface, User’s Manual
7.5.1.2 General Kinds
This submenu contains queries relevant to the generalization hierarchy. It consists of
the following two queries:
List All Superclasses
Lists all general kinds (superclasses) of a kind (class).
List Immediate Superclasses
Lists the immediate general kinds (superclasses) of a kind (class).
Figure 30 General kinds queries submenu
November 2000/v2.3
-40-
ICS-FORTH
SIS-Graphical Analysis Interface, User’s Manual
7.5.1.3 Object/Kind
This submenu contains queries relevant to the classification hierarchy. It consists of
the following two queries:
List Objects of Kind
Lists all the instances of a kind (class).
List Kind of Object
Lists all the kinds (classes) of an object
Figure 31 : Objects/kinds queries submenu
November 2000/v2.3
-41-
ICS-FORTH
SIS-Graphical Analysis Interface, User’s Manual
7.6 Retrieval
Figure 32 "Retrieval" menu
By pressing the Retrieval button, a new card labeled "Search Card", appears on the
screen. (see Figure 32).
Figure 33 The "Search Card" window
The search card consists of several single line text-editors: each of them is
accompanied by a label on the left side and a pushbutton "Fill" on the right side. The
number of the text editors and of the other widgets depends on the number of
predefined retrieval queries the user has written. There is also a label on top of the
card ("Name Search" in figure). All labels are user defined and depend on the
description of the predefined queries in the SIS base.
The labels of the text-editors indicate the type of objects the user should enter in each
one to perform the query. The queries depend entirely on the model and can be
November 2000/v2.3
-42-
ICS-FORTH
SIS-Graphical Analysis Interface, User’s Manual
configured by the user as described in SIS - Query Interpreter: An Interactive
Program to use API Functions. The user can fill one or more object names in each
text-editor and combine them with the logical operators '^' (signifying logical AND)
and 'V' (signifying logical OR). By pressing one of the fill buttons, the query target
specified in the query target area of the main window is copied at the end of the
respective text-editor. The user should then fill in the respective logical operator that
combines the new object with the previous ones.
On the lower left part of the search card there is one more pushbutton, labeled
"Execute". Once the user has filled all the text-editors with appropriate objects, this
button can be pressed. By pressing it, the following operation is performed:
The objects that the user has filled in each text-editor are given as target to a
predefined query. The logical operations are then performed according to the
operators that the user has provided. These steps are repeated for all text-editors and
their results are then merged using the logical AND operation. The final results are
then presented in the textual window.
If one of the text-editors is left empty, it is ignored during query execution. Before
execution of the actual query a checking is performed in order to verify that all
objects exist in the database and that they match the type of objects that the respective
label indicates. If one of the objects in the text-editors does not exist in the database
or it does not belong to the proper type of objects, it is ignored during query
execution and the user is appropriately warned. The system automatically maps the
text window during the execution of the query, if it is not already mapped. It also
updates the label of the executed query with the title "Conditional Search" and the
"Items" label with the cardinality of the answer set.
The search card can be closed by pressing the pushbutton labeled "Close" on lower
right of the card.
November 2000/v2.3
-43-
ICS-FORTH
SIS-Graphical Analysis Interface, User’s Manual
7.7 Tools
Options related to external tool calls are defined by the user and stored in the SIS
base. For a description of the external tool bindings refer to "SIS - Binding with
External Tools".
Figure 34 'Tools" menu
For example, selecting one of the options of the “Tools” menu calls Entry Form (EF)
which is a tool used for the interactive update of the Semantic Index System (SIS)
(see SIS - Entry Form User’s Manual).
Figure 35: Entry Form (EF)
November 2000/v2.3
-44-
ICS-FORTH
SIS-Graphical Analysis Interface, User’s Manual
7.8 Window
By pressing the Window button, a pulldown menu with options that give all the
available output representations, appears on the screen (see Figure 35).
Figure 356 "Window" menu
7.8.1 Text
See section 2.3
7.8.2 Graph
See section 2.3
7.8.3 Global View
This option is provided so that the user can have a global view of the graph presented
in the graphical window. This is useful when the graph is too large to fit in the
window and only a part of it is actually drawn. By pressing the Global View button a
window called "Global View Card" appears on screen (see Figure ).
It is a window with a drawing area where the global view of the graph currently
drawn in the graphical window is shown. The portion of the graph that is currently
present in the graphical window is highlighted, the names of the nodes, however, are
omitted. By clicking the left mouse button on a point of this card a new region is
highlighted and the graph in the main graphical window is redrawn so that it
November 2000/v2.3
-45-
ICS-FORTH
SIS-Graphical Analysis Interface, User’s Manual
represents the new highlighted portion of the Global View card. The Global View
card is updated every time a new graphical query is executed so as to present the
current graph.
A pushbutton "Close" on the lower right of the card allows the user to close it.
Figure 37 "Global View" window
7.8.4 History Of Commands
See section 6.1 for more details.
7.8.5 Object Card
This option opens the Object Card of the Query Target object.
See section 5.1 for more details.
November 2000/v2.3
-46-
ICS-FORTH
SIS-Graphical Analysis Interface, User’s Manual
November 2000/v2.3
-47-
ICS-FORTH
SIS-Graphical Analysis Interface, User’s Manual
Appendix A - Changes from previous versions
In the process of redesigning the User Interface, in order to be Windows - like, some
objects changed their placement (e.g. buttons moved into menus).
Also additional functionality was added in order to have a complete product. (Enable
mechanism for printing the query results (textual or graphical) and enable the split
mechanism for graphs).
Changes from version 1.3 to version 2.0
In this version, Win 32 platforms (Win NT and Win 95) are now supported in
client-server version.
The new card called Options was added in the program in order to have the
possibility to change parameters concerning the customization of the User
Interface (e.g. colors, fonts, nodes and links color) (See section 7.3.5)
Changes from version 2.0 to version 2.1
Changes took place for fixing malfunctions of the program.
Also user friendly functionality was added. The minimized windows go on the
taskbar, pressing the X button on the windows close the windows normally and so
on.
Changes from version 2.1 to version 2.2
Redesign of the User Interface took place. So the whole functionality inserted into
menus and the most used operations became a toolbar (See section 7)
Printing mechanism was added (See sections 7.1.3 - 7.1.4)
Splitting mechanism was enabled (See section 4.2)
Sibling order was inserted so the links of a given category will appear in the Star
View and Object Card in the way the user has sorted them via Entry Forms.
Using appropriate language configuration files the user can have the program
interface and the messages appearing in the desired language.
Client - server version is only supported on all platforms.
Help for every object can be taken from the Strings Page of the Options Card. In
the previous version the user had to press the right mouse button on the specified
object.
Changes from version 2.2 to version 2.3
Save ans SaveAs options of file are using the Windows default Save and SaveAs
cards.
Object Card and History of Commands are now available from Windows button.
In Object Card at alternative state FULL, is presented additional information
about the references-to that the object inherits.
November 2000/v2.3
-48-
ICS-FORTH
SIS-Graphical Analysis Interface, User’s Manual
In Star View graph and Object Card, link objects are also selectable.
Star View and any other graphical or textual query and Object Card are applicable
to link objects.
November 2000/v2.3
-49-
ICS-FORTH