1
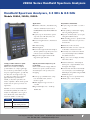
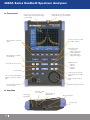
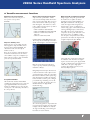
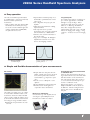
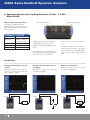
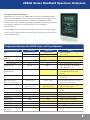
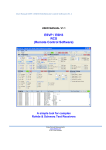
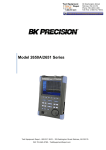
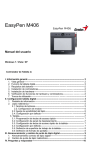
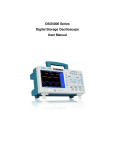
99 Washington Street
Melrose, MA 02176
Phone 781-665-1400
Toll Free 1-800-517-8431
2650A Series
Handheld Spectrum Analyzers
Visit us at www.TestEquipmentDepot.com
Portable
Quick
Precise
➲
Spectrum
Analysis
2650A Series Handheld Spectrum Analyzers
The 2650A Series spectrum
analyzers are ideal for quick,
precise and cost effective
signal investigations.
At a weight of only
4 pounds (1.8 kg), they
are by far the lightest and
most compact full-featured
spectrum analyzers
available.
2
With their ease of use, measurement
flexibility and unmatched portability, the
2650A series can handle numerous
applications ranging from the installation,
maintenance, and troubleshooting of
wireless communication systems to
frequency response measurements of
cables and electric field strength
measurements.
2650A Series Handheld Spectrum Analyzers
Handheld Spectrum Analyzers, 3.3 GHz & 8.5 GHz
Models 2650A, 2652A, 2658A
Applications
■
Installation, maintenance, and troubleshooting
Key features and benefits
■
of wireless communication systems such as
W-CDMA/CDMA, GSM, WLAN, WiMAX and
8.5 GHz
■
Frequency response measurements of passive
■
components such as RF cables, filters, and
attenuators (model 2652A)
■
A truly portable spectrum analyzer weighing
only 1.8 kg including the battery
Bluetooth
■
Frequency range from 50 kHz – 3.3 GHz or
Impressive 4 hour battery life; easy-to-replace
rechargeable Lithium-Ion battery
■
Detection of signal interference and undesired
Built-in tracking generator to rapidly determine
transmission characteristics of 2 port devices
emissions
(model 2652A)
■
TV and broadcasting
■
USB interface for PC connectivity
■
Antenna alignment
■
Intuitive PC Software for remote control and
■
Electric field strength measurement with dipole
antennas optimized for typical frequencies used
■
documentation of measurement results
■
Conveniently store measurement results and
in wireless systems (order M401-M406)
screen shots in bitmap format to USB flash
Magnetic field strength measurement with
drive (USB host interface)
magnetic field probe (PR 26m)
■
Large easy-to-read color display (TFT LCD),
640 x 480 resolution
■
Truely portable solution for quick
and precise spectrum analysis
B&K Precision’s 2650A series handheld
spectrum analyzers are compact, light weight,
and cost-effective spectrum analyzers for quick
and precise signal investigations, especially away
from the bench. At a weight of only 1.8 kg
(4 pounds), the 2650A series are by far the
lightest full-featured spectrum analyzer
available, yet they deliver performance and
features comparable to full-size bench spectrum
analyzers and can operate up to 4 hours on a
single battery.
■
Fast sweep speed, minimum 10 ms, to help
■
External trigger for zero span measurements
locate and identify elusive, transient
■
SCPI-like remote control commands
Model
2650A
2652A
2658A
channel power, occupied bandwidth, electric
and magnetic field strength
Convenient Auto Tune function automatically
sets center frequency to the maximum signal
within full span and optimum settings for RBW,
VWB and sweep time
■
interference signals
■
DANL (displayed average noise level) of
-127 dBm
■
With their ease of use, measurement flexibility,
and unmatched portability, the 2650A series
analyzers are indispensible tools for engineers
and technicians who conduct field measurements in the 50 kHz to 8.5 GHz range.
Measurement functions: channel/adjacent
Superb performance improves your
productivity
Advanced synthesizer-based design enables the
2650A series to provide you with an accurate
and detailed picture of the spectrum you are
investigating.
Single sideband phase noise – 90 dBc @
100 kHz offset
Frequency Range
50 kHz – 3.3 GHz
50 kHz – 3.3 GHz
with Tracking Generator
50 kHz – 8.5 GHz
Test Equipment Depot - 800.517.8431 - 99 Washington Street Melrose, MA 02176
FAX 781.665.0780 - TestEquipmentDepot.com
3
2650A Series Handheld Spectrum Analyzers
▲ Front panel
Large color screen (640 x 480 pixels) can be
switched to high contrast monochrome display
in extreme sunlight
RF Input (N-connector), able to withstand
27 dBm (CW average power)/25V DC max
Set reference level from +1 dBm
to -60 dBm in 1 dB steps
Simple menu-based operation via
soft keys
Measurement functions:
• Channel power
• Adjacent channel power
• Occupied bandwidth
• Electric field strength
• Magnetic field strength
Automatically tune to maximum
level with full span
Calculation functions:
• Max hold
• Min hold
• Averaging
• Overwrite
Set sweep time and detection mode
2, 5 and 10 dB/div
Save/Load trace data and setups
to/from internal memory or USB
flash drive
Store screen images in bitmap format
to flash drive or hard copy to USB
printer
Marker measurement and peak
search
Enter custom labels for filenames,
set the time and date
Rotary knob for parameter selection
▲ Interface
PC interface - USB
device (A plug)
External trigger
input (SMA)
USB host adapter for
USB flash drives
Charge status indicator
DC power input
4
2650A Series Handheld Spectrum Analyzers
▲ Versatile measurement functions
Channel power measurement
Allows you to measure the total power or
noise power in a user-specified
bandwidth.
Adjacent channel power
Measure the ratio of power leakage (from the
wanted signal) into adjacent channels. Center
frequency, adjacent channel bandwidth, and
offset between main carrier and adjacent
channels can be set.
Users can select from any of the following three
measurement methods based on the reference
carrier definition: total power (of displayed spectrum), peak power (reference level) and in-band
power (user-specified band width).
Electric field strength measurement
A dipole antenna (options M401 – M406)
connected to the RF input enables the measurement of electric field strength. Users can choose
from 6 antennas based on the frequency range
under investigation. Each antenna’s resonance
point is optimized for the frequency spectrum of
a specific wireless standard:
• M401 is suitable for GSM 850/900
• M403 for W-CDMA and GSM 1800/1900
• M404 for 2.4 GHz wireless LAN and
Bluetooth
• M406 for 5 GHz wireless LAN
Combined with the MAX HOLD function and a
10 ms sweep time, the M404 dipole antenna is
capable of measuring the electric field strength of
Bluetooth systems and systems using direct
sequence spread spectrum/frequency hopping
modulation techniques.
Occupied Bandwidth
This measurement calculates the bandwidth
containing the total integrated power occupied in
a given signal bandwidth. Two measurement
methods are available: The user can specify N%
of total power or the X dB down point relative to
the carrier peak level.
Magnetic field strength measurement
Using a magnetic field probe (option PR 26M),
the 2650A series is capable of accurately
measuring the magnetic field distribution on a
PCB (printed circuit board) or IC (integrated
circuit). The magnetic field strength detector
inside the probe consists of a shielded loop
structure using a glass ceramic multi-layer board
technology with high frequency characteristics.
This enables the detection of magnetic field
components only. The probe can measure over a
wide frequency range of 10 MHz to 3 GHz.
Since the probe’s compensation data is already
preloaded into the analyzer, the magnetic field
strength is displayed directly in dBuA/m.
Typical applications of this magnetic field probe
are evaluation of the effectiveness of a bypass
capacitor located near the power supply terminal
of an IC or evaluation of the microstrip layout on
a PCB. Due to the probe’s high spatial
resolution (approximately 0.25 mm), it is not
affected by adjacent patterns.
Using multiple dedicated dipole antennas leads
to better measurement results compared to the
conventional method of using only a single wide
band antenna in which case the frequency range
under investigation is typically located far away
form the antenna's resonance point, resulting in
poor dynamic range. Measuring at or near the
resonance point where the antenna gain is at a
maximum translates into high dynamic
measurement range.
Since the antenna gain factor compensation data
is preloaded into the analyzer, the field strength
is displayed directly in dBuV/m. The analyzers
also support downloading of user-defined gain
factor tables for custom antennas.
5
2650A Series Handheld Spectrum Analyzers
▲ Calculation and Marker functions
Max and Min Hold
Max Hold: At each displayed frequency, the
currently-measured value is compared to the
previously-measured value and the larger one is
retained and displayed. This feature is useful for
observing a bursted or intermittent signal or for
measuring the electric field strength of systems
using direct sequence spread spectrum/frequency
hopping modulation techniques.
Min hold: At each displayed frequency, the
currently-measured value is compared to the
previously-measured value and the smaller one is
retained and displayed.
In both cases, the number of sweeps can be set
to 2N, where N is from 1 to 10 or infinite.
Overwrite
The results of each consecutive sweep are
displayed and the screen is not cleared after each
sweep. This lets you observe the long term
variations of a signal.
Marker Function
Two different modes are available for marker
measurements:
Peak Function
Two different modes are available for peak
search:
■ Normal peak search mode searches for the
highest level on the screen. In this mode, you
can also use the NEXT button to locate the
marker on the next smaller peak.
■ In-zone peak search mode searches for the
peak level in the range specified by the center
value and width.
The picture shown demonstrates in-zone peak search.
■ Normal marker mode measures the
frequency and level of the marked point
■ Delta marker mode measures the frequency
and level differences between the two
markers (see image)
Averaging
The analyzer continuously sweeps, then
calculates and displays the average value over the
total number of sweeps. The number of sweeps
can be set to 2N, where N is from 1 to 10.
Averaging is useful for detecting signals buried in
the noise floor because random noise is averaged
out.
Delta marker measurement
6
Test Equipment Depot - 800.517.8431 - 99 Washington Street Melrose, MA 02176
FAX 781.665.0780 - TestEquipmentDepot.com
2650A Series Handheld Spectrum Analyzers
▲ Easy operation
The 2650 series handheld spectrum analyzers
are straightforward to operate and provide many
functions to facilitate quick and easy
measurements:
Smart one button “Auto Tune" function which
automatically scans the full frequency range,
detects and centers the maximum signal, and
configures optimum values for RBW, VBW,
sweep time and reference level
Detect the maximum
level within full span.
Input attenuator and internal preamp are set
automatically to optimal values based on the
reference level
Easy configuration of frequency, span, and
amplitude
Marker and peak search functions enabling
rapid measurements
200 setups and reference spectrum
measurements can be stored and recalled from
either internal memory or USB flash drive
Filenames can be customized and include a
date and time stamp.
Large easy-to-read display. The backlight is
adjustable and monochrome mode can be
used for extreme lighting conditions
Long battery life
The 2650A provides a battery operating time of
up to 4 hours (approximatly 3 ½ hours with
back light set to typical settings). Battery
replacement is simple and doesn’t require any
hand tools. To fully charge the lithium-ion
battery takes only approximately 4 hours
(analyzer must be turned off). A two color LED
indicates the charging status “charging”, “charge
completed”, “no battery detected” and “charging
error”.
Center the maximum signal, configure
optimum parameters
▲ Simple and flexible documentation of your measurements
PC software
■ Capture 1001 trace data points (twice the
number of display dots) and store the data in
CSV (comma separated values) format for
detailed analysis (e.g., import into a spread
sheet)
■ Save the screen to a bitmap file or to the
clipboard
■ Control all instrument settings from the PC
■ Download custom antenna gain factor
compensation data to the instrument
The 2650A series includes easy-to-use software
for documentation and further analysis of your
measurements. Connect the analyzer via USB
cable to your PC, configure the analyzer remotely, then download measurement data and instrument settings for storage and further analysis.
■ Continuously sweep and transfer trace data
to the PC.
Conveniently save measurement data
to USB flash drive
Easily save and recall measurement data and settings in CSV format directly to and from the USB
flash drive. Filenames can be customized and
have a time and date stamp. Users can choose
to store measurement data and setups in separate files or combined in one file.
Using the Copy function, a screen image in
bitmap format (BMP) can be directly stored to
the USB drive. CSV data residing in internal
memory can be stored to the USB drive in a
lump sum.
Hardcopy to USB printer
Generate a hard copy of the display by directly
connecting the optional USB printer model
PT2650A to the 2650A series analyzer.
7
2650A Series Handheld Spectrum Analyzers
▲ Spectrum Analyzer with Tracking Generator, 50 kHz – 3.3 GHz
Model 2652A
Built-in transmission measurement
The 2652A is a 2650A with a tracking
generator added. The 2652A can be used to
rapidly determine transmission characteristics of
two-port RF devices.
Input (spectrum analyzer)
Output (tracking generator)
T r a ck in g gen er a t or s p ec if ic a ti on s
Frequency range
Output Level
5 MHz to 3.3 GHz
-10 dBm ± 1 dB @ 1
GHz (output level is fixed)
Output flatness
Output impedance
50 Ω
±1.5dB
Output connectors N (J)
Tracking generators are ideal for tuning filters,
determining the usable frequency range of
amplifiers and attenuators and aligning receiver
IF stages.
The tracking generator’s output frequency is the
same as the frequency the spectrum analyzer is
tuned to. This lets you see the amplitude
response of a circuit on the spectrum analyzer
screen.
The analyzer's normalize function can be used to
remove the effects of the cable(s) connecting the
device. This allows you to differentially measure
a device's response without worrying about cable
effects.
APPLICATIONS
Characterize the frequency response
of a filter
Measure the frequency response of a passive
component, e.g a filter, over the 2652A’s full
range of 5 MHz to 3.3 GHz.
TG OUT
RF IN
Determine the gain characteristics of
an amplifier
Characterize the frequency response of an active
circuit such as an amplifier.
Return loss measurement
Measure the return loss of an electric component
or circuit with a VSWR bridge
TG OUT
TG OUT
RF IN
RF IN
VSWR bridge
BPF
OUT
AMP
8
IN
OUT
IN
DUT
2650A Series Handheld Spectrum Analyzers
Specifications
models
2650A, 2652A
F re q uen c y s e ct ion
Frequency range
Center frequency
Setting
resolution
Accuracy
50 kHz to 3.3 GHz
2658A
50 kHz to 8.5 GHz
20 kHz
Settable with rotary encoder, numeric or function key
within ± (30+20T) kHz±1 dot
@frequency span: 200 kHz to 10 MHz, RBW 3 kHz, 23±5°C
within ± (60+300T) kHz±1dot
@frequency span: 20 MHz to max. frequency (3.3 GHz or 8.5 GHz), RBW 100 kHz,
23±5 °C
RBW frequency error
Frequency span
Range
Accuracy
Display resolution
# of points per trace
Resolution bandwidth
Range
Accuracy
Shape Factor
Video bandwidth
SSB phase noise
Spurious response
Harmonics
Am p lit ude sec tio n
Reference level
Range
Accuracy
Unit
Average noise level
Frequency response
Input impedance
Input VSWR
Input attenuator
Operating range
Switching error
RBW switching error
Display resolution (vertical)
Display scale
Scale
Accuracy
Input damage level
Swe ep sec ti on
Sweep time
Range
(1-3 step)
T: sweep time (s)
within ±4 kHz @ 3 kHz, 10 kHz, 30 kHz
within 20% of RBW @ RBW: 100 kHz, 300 kHz
within 10% of RBW @ RBW: 1 MHz, 3 MHz
0 Hz (zero span),
0 Hz (zero span),
200 kHz to 2 GHz (1-2-5 step) and
200 kHz to 5 GHz (1-2-5 step) and
3.3 GHz (full span)
8.5 GHz (Full span)
within ±3% ±1dot @ sweep time of 0.3s, 23±5 °C
501dots on LCD screen, 1001dots readout via PC
(501 dots are visible on the display, 1001 dots of trace data are captured internally
and can be transferred to a PC via USB device interface.)
3 dB bandwidth (6 dB for 2651 @ 9 kHz, 120 kHz)
3 kHz to 3 MHz (1-3 sequence) and AUTO
(2651: 3 kHz, 9 kHz, 30 kHz, 120 kHz, 300 kHz, 1 MHz, 3 MHz)
±20%
1:12 (typical, 3 dB : 60 dB)
100 Hz to 1 MHz (1-3 step) and AUTO
-90 dBc/Hz (typical) @100 kHz offset, RBW : 3 kHz, VBW : 100 Hz, sweep time: 1 s
less than -60 dBc
less than -40 dBc @ ≥ 100 MHz
+10 to -60 dBm (1dB step)
within ± 0.8 dB ± 1 dot @ center frequency : 100 MHz, RBW : 3 MHz,
VBW : 1 MHz, REF : -15 dBm, 23±5 °C
dBm, dBV, dBmV, dBµV, dBµV/m, dBµA/m
(dBµV/m and dBµA/m are used for measurement functions)
-127 dBm (typical) @ CF : 1 GHz, RBW : 3 kHz, VBW : 100 Hz,
Ref. level < - 40 dBm ( preamp automatically ON)
within ±2.0 dB ± 1 dot @50 kHz to 100 MHz
within ±1.0 dB ± 1 dot @100 MHz to max. frequency (3.3 GHz or 8.5 GHz)
50 Ω
< 2.0
0 to 25 dB (1 dB step), coupled with reference level
±0.6 dB @100 MHz
±0.6 dB
381 dots/10 div
10 dB/div, 5 dB/div, 2 dB/div
±(0.2 dB+1dot)/2 dB ±(0.4 dB+1dot)/5 dB
±(0.8 dB+1dot)/10 dB ±(1.8 dB+1dot)/83 dB
+27 dBm (CW average power), 25 VDC
10 ms to 30 s and AUTO
@frequency span : 0 to 2 GHz
30 ms to 30 s and AUTO
@frequency span : full span
10 ms to 30 s and AUTO
@frequency span : 0 to 2 GHz
30 ms to 30 s and AUTO
@frequency span : 5 GHz, full span
9
2650A Series Handheld Spectrum Analyzers
Accuracy
Trigger
Trigger mode
Trigger source
External trigger
Input voltage range
Frequency range
Input coupling
Trigger level
Input RC
Input damage level
Input connector
Detection mode
F un ct ion
Marker measurement
Peak search
Calculations
Measurements
Auto tuning
Save/Load
Save
Load
Gen er al
RF Input connector
USB Communication
Protocol
Device Connector
Transfer rate
Hard copy
Host connector
Display
Display
Backlight
Number of dots
Power supply
Dedicated
AC adaptor
Lithium-ion battery
Charge function
Charge indicator
E nvir onm en ta l a nd Si ze
Operating temperature
Operating humidity
Storage temperature
Dimensions
Weight
Within ±0.1 %±1dot
@frequency span : 0 to 2GHz
within ±1.5 %±1dot @ full span
Within ±0.1 %±1dot
@frequency span : 0 to 5GHz
within ±2.5 %±1dot @ full span
AUTO (Available only for zero span)
Internal and External
1 to 10 Vp-p
DC to 5 MHz
DC coupling
approx. 0.56 V(fix)
approx. 10 kΩ / less than 15 pF
±50 V(DC+AC peak)
SMA(J)
Positive peak, Negative peak, Sample ( QP and AV for model 2651 only.)
NORM:displays frequency (8 digits max) and level (4 digits max) at marker point.
DELTA:displays frequency difference and level difference between two markers.
NORM: searches peak point within 10div (full freq. range). This mode also supports NEXT peak
( up to 10).
ZONE: searches peak point within a zone designated by center and width
NORM, MAX HOLD, MIN HOLD, AVERAGE, OVER WRITE
MAX/MIN HOLD: 2 to 1024
AVERAGE: 2 to 256
Measure Channel power, Adjacent channel leakage power, Occupied frequency bandwidth,
Electric field strength (requires antenna), Magnetic field strength (requires magnetic field probe).
Automatically scans the full bandwidth, sets center frequency to the maximum signal within full
span and centers it onscreen. Automatically adjusts reference level, RBW, VBW and sweep time
to optimum values
Saves 200 reference spectrum measurements and 200 setups
Loads one reference spectrum measurement and one setup
N(J) connector
USB version 1.1 (will also work with USB 2.0 devices)
B plug
12 Mbps
USB printer (option) connected to A plug (host) enables hard copy of screen.
A plug
5.7 inch color TFT LCD
LED backlight
640(H) x 480(V) dots
Input : 100 to 240 VAC
Output : 9 VDC/2.6 A
7.4 V/5000 mAh Li-Ion battery (MB400)
Capable of charging during power-off.
Indicates 4 conditions with two color LED
5 level indicator of remaining battery charge
0 to 50° C (guaranteed at 23±10 °C, without soft carrying case)
less than 40 °C/80 %RH (guaranteed at less than 33 °C/70 %RH, without soft carrying case)
-20 to 60 °C, less than 60 °C/70 %RH
6.38 (W) x 2.80 (H) x 10.43 (D) inch, 162(W) x 71(H) x 265(D) mm
(excluding projections, protection bumper and stand)
approx. 1.8 kg or 4 lbs (including battery)
Two Year Warranty
Accessories
Included
Optional
10
User manual, AC adaptor MA400, soft carrying case LC2650A, accessory
pouch, PC software and USB cable, Lithium-Ion battery MB400
Dipole antennas M401 – M406, magnetic field probe PR 26M, printer
PT2650A and extra roll paper PX2650A
2650A Series Handheld Spectrum Analyzers
Next generation spectrum analyzers
Expanding on the success of its “2008 Product of the Year” Award winning 2652
spectrum analyzer, B&K Precision has incorporated many customer suggestions in
developing this new, enhanced family of products. The EN-genius network
(www.en-genius.net), a popular engineering site, granted the award and recognized
the analyzer for “Best Price versus Performance Factor in Handheld
Instrumentation”.
The new 2650A series look and feel just like their predecessors, the popular 2650
series, yet offer many new features and performance enhancements in response to
customer requirements:
Comparison between the 2650A series and its predecessor
Features/Specifications
LCD
2650 series
2650A series
Benefits
monochrome, 4.7 inch
color, 5.7 inch
Improved readability,
320 x 240 dots
640 x 480 dots
better resolution
100 min, Ni-MH
4 hours, Li-Ion
Much improved battery life
charging indicator
No
Yes, 5 levels
charge status LED
No
Yes
RS-232C
USB 1.1
Battery operation
(display off)
Computer interface
Indicates amount of charge left
Informs user when battery is fully charged
Connectivity to laptops, which typically
offers a USB interface only
USB host interface
No
Yes
(for USB flash drive)
Conveniently save CSV data or screen
shots in BMP format directly to USB
flash drive
Display dynamic range
80 dB/8div
100 dB/10 div
View complete signals with a large
Display data resolution
251(H) x 201(V)
501(H) x 381(V)
+ 20 dBm
+ 27 dBm
(CW average power)
(CW average power)
2, 10 dB/div
2, 5, 10 dB/div
More flexibility displaying a great variety
Average noise level
-117 dBm
-127 dBm
Increased ability to detect small signals
Frequency setting resolution
100 kHz
20 kHz
No
Yes
Perform zero span measurements
SMA (J)
N (J)
Added convenience and robustness
No
Yes, 16 characters
More convenient file management
dynamic range
(# of onscreen data points)
Input damage level
Display scale
Better amplitude and frequency resolution,
improved measurement accuracy
Improved protection of the RF input
against excessive RF signals
of signals
External trigger
RF input connector
User configurable file names
Protection bumper
No
Yes
Battery replacement
Requires hand tool
by hand
No
Yes
PC Software and communication
Set center frequency more accurately
More rugged
Easier and quicker battery exchange
More cost effective
cable included
11
2650A Series Handheld Spectrum Analyzers
About B&K Precision
For more than 50 years, B&K Precision Corporation has been
building a reputation for excellence in the design and manufacture
of reliable and cost-effective general purpose test and measurement
instruments. The company’s products are used in a wide range of
applications including design, research and development,
production line testing, industrial maintenance, and electronic field
service. B&K Precision test and measurement instruments are
standard test equipment in a large number of universities and
technical schools which train future engineers and technicians.
B&K Precision was founded in 1951 and is headquartered in Yorba
Linda, California.
B & K P r ec i s i on C o rp .
22820 Savi Ranch Parkway
Yorba Linda CA 92887
Phone +1 714 921 9095
Fax
+1 714 921 6422
© B&K Precision Corp. 2009
Printed in USA
Product specifications and descriptions in this document subject to change without notice.
m
Test Equipment Depot - 800.517.8431 - 99 Washington Street Melrose, MA 02176
FAX 781.665.0780 - TestEquipmentDepot.com