1
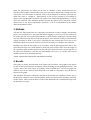
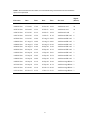
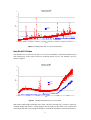
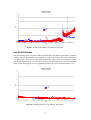
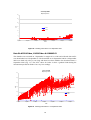
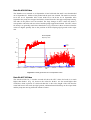
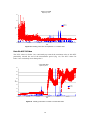
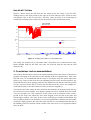
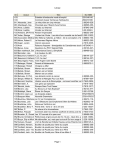
internal
report
Tank testing of Analite
turbidity probes
MJ Saynor, BL Smith & J Klein
December 2003
468
Tank testing of Analite turbidity probes
MJ Saynor, BL Smith & J Klein1
Hydrological and Ecological Processes
Environmental Research Institute of the Supervising Scientist,
GPO Box 461 Darwin NT 0801
1 Klein Electronics, PO Box 562, Humpty Doo NT 0836
December 2003
Registry File SG2004/0015
ii
Contents
1 Introduction
1
2 Equipment
1
3 Methods
4
4 Results
4
Data file A170603.dxu
6
Data file A260603.dxu
6
Data file A070703.dxu
7
Data file A220703.dxu
8
Data file A310703.dxu
8
Data file A070803.dxu
9
Data file A180803.dxu
10
Data file A290803.dxu
10
Data file A020903.dxu
11
Data file A050903.dxu
11
Data file A150903.dxu, A160903.dxu & A180903.03
12
Data file A260903.dxu
13
Data file A071003.dxu
13
Data file A051103.dxu
14
Data file A171103.dxu
15
5 Conclusions and recommendations
15
6 Calibration of the Probes
16
7 References
16
Appendix 1
17
iii
iv
Tank testing of Analite turbidity probes
MJ Saynor, BL Smith & J Klein
1 Introduction
Suspended sediment (< 63µm > 0.45µm diameter) is transported by water in rivers and
streams. It is important to know the loads of suspended sediment, as potential contaminants
can be readily transported with the sediment. Currently at eriss suspended sediment loads are
determined for 3 three gauging stations located in the Ngarradj catchment (Figure 1), by time
consuming laboratory techniques. A relationship between laboratory turbidity and suspended
sediment loads has been developed for each of the gauging station sites in Ngarradj
catchment. The turbidity probes that were used initially at the Ngarradj gauging stations
(Saynor et al 2001) have proven unsuitable as they are not able be to field calibrated and also
the output is unstable in the ranges that we were wanting to measure. It has also been
observed that algae can build up on the optical lens which may effect the data being collected
and the initial turbidity probes did not have a wipe function.
Several Analite 396 turbidity probes were purchased to replace the initial turbidity probes.
Analite turbidity probes are used by Professor Des Walling, University of Exeter, England, in
many sites around the world with good results and are highly recommended by him (Pers.
Comm. 2003). They are also used in the USA by the USDA (United States Department of
Agriculture). Closer to home they have been used by Peter Finch CSIRO (Townsville) in dry
arid areas of Western Queensland. The probes have survived very high temperature and
limited rainfall and provided very good results when the creeks do flow (Peter Fitch, Pers.
Comm. 2002). The Analite Turbidity probes have a self wipe function that can be automated
and will help to reduce build up of algae and other materials on the optical lens. These probes
can also be easily calibrated in the laboratory and even in the field if necessary.
The aim is to develop a relationship between in-situ Analite turbidity probes and suspended
sediment loads so that the time spent collecting samples in the field and filtering of the water
samples in the laboratory will be greatly reduced and thereby optimising resources.
If relationships between the Analite turbidity probes and Suspended sediment loads are
successfully developed for the three sites in the Ngarradj catchment then the method will be
used for sites in Gulungul and Magela Creeks in the future. The aim of the work presented in
this Internal Report is to assess the usefulness of the wiping function of the Analite Turbidity
probes and to also determine the frequency that the probes are wiped for optimum performance.
2 Equipment
Testing of the Analite (NEP390 series) turbidity probes was conducted at the Darwin office
and laboratory prior to the installation in the field for the 2003-04 wet season. The testing
took place in a large tank (shown in figure 2) located a covered outdoor area. Two Analite
probes were set up for this experiment, (referred to as Probe 1 and Probe 2). The Analite
probes measure turbidity values ranging from 0 to 400 nephelometric turbidity units (NTU).
Probe 1 was set to wipe at chosen intervals while Probe 2 did not wipe at all. The probes were
connected to a data logger (Data Electronics DT50 (series 3) data-taker) and are powered by
mains power through a transformer. The transformer allowed for direct mains power but was
1
also used to simulate field conditions on switching the probe on and off and putting the data
logger to sleep to save battery power.
Figure 1 The Swift Creek catchment showing the Jabiluka Mineral Lease, eriss’s gauging stations and
local creek names. SC refers to Swift Creek gauging station, TN Tributary North, ET East Tributary
gauging station, TC Tributary Central, TS Tributary South, TW Tributary West and UM upper Swift
Creek gauging station.
2
The tanks dimensions were approximately 240 cm x 120 cm x 120 cm deep and it was
manufactured from heavy duty Perspex encased in a metal frame for support. The probes
were attached to a piece of 40 mm diameter. PVC pipe with a “T” type fitting glued to one
end and notches filed into the ends of the “T” for the probes to fit in to. They were secured
with cable ties to stop any movement caused by the water current. The pipe is held in place by
a “G”clamp on the side of the tank.(figure 2). The water in the tank was circulated by an
“EHEIM” universal pump rated at 2400 litres per hour capacity to reduce algal build-up and
stagnation of the water. The outlet pipe is situated in the tank so that the flow is directed
across the face of each probe to simulate current in a stream.
Figure 2 Schematic drawing showing the set up of the testing tank for the Analite probes
3
Sand was placed into the bottom of the tank to simulate a sandy stream-bed and also
introduce some organics and turbidity to the tap water used to fill the tank. Enough sand was
collected to cover the bottom of the tank with 8–10 cm thickness of material. The tank was
filled with water to a depth of approximately 70 cm and was topped up occasionally to
replace water lost through evaporation. The probes were suspended approximately 35–40 cm
above the sand bed. The minimum distance between the optical end of the probe and the
channel bed or any objects/obstructions should be 5 cm as recommended in the manual
(McVan Instruments 2003).
3 Methods
The tank was filled with water on 10 June 2003 and allowed to settle overnight. The turbidity
probes were installed on 11 June 2003 and started logging at 16:13 hrs. Over the duration of
the testing the tank was checked intermittently to ensure that the equipment was functioning
correctly. When the wipe time was known the probes were checked visually to check that the
wiping operation of Probe 1 took place. Generally the tank cleared after a few days as the
sediments settled out and so the water was stirred occasionally to re-disperse the sediments.
Readings were taken by the probes every six minutes with the data logged on the DT50. The
times between wipes was varied and this is discussed in the results section. Over the length of
the experiment algal growths appeared on the end of the probe that wasn’t wiped and also on
the wiper arms themselves. The data was downloaded once every 1 to 2 weeks and is stored
in SSD explorer in the following directory.
\\\HEP Administration\Equipment and Methods\Turbidity
4 Results
The results are shown and discussed in the figures and text below. The graphs in the figures
are for the time period between downloads and are differing periods generally between 1 and
2 weeks. Due to the wide ranges of Turbidity values recorded the Y axis on the graphs are
different. Also in one instance when downloads were made on consecutive days, the data are
shown on one graph.
The download file names contain the date that the download was completed and the .dxu is
the DT50 file extension. These downloaded file names have been used as headings within the
results section. Table 1 lists the dates of each of the downloads, the command file being used,
the time between wipes.
4
Table 1 Start and finish times and dates, the command file being used and the time interval between
wipes of the wiper blade
Start
Finish
Probe 1
file used
Wiped
(Hours)
File name
Date
Time
Date
A170603.dxu
11-Jun-03
16:13
17-Jun-03 16:06
Analitetest.cmd
24
A260603.dxu
17-Jun-03
17:44
26-Jun-03 14:28
Analitetest.cmd
24
A070703.dxu
26-Jun-03
15:56
07-Jul-03 14:32
Analitetest.cmd
24
A220703.dxu
07-Jul-03
16:16
22-Jul-03 14:24
Analitetest2.cmd
6
A310703.dxu
22-Jul-03
15:54
31-Jul-03 11:18
Analitetest3SW.cmd
6
A070803.dxu
31-Jul-03
12:00
07-Aug-03 14:00
Analitetest4SW.cmd
3
A180803.dxu
07-Aug-03 14:00
18-Aug-03 14:00
Analitetest4SW.cmd
3
A290803.dxu
18-Aug-03 15:00
29-Aug-03 15:48
Analitetest4SW.cmd
3
A020903.dxu
29-Aug-03 16:00
02-Sep-03 13:48
Analitetest5SW.cmd
3
A050903.dxu
02-Sep-03
15:42
05-Sep-03 16:12
Analitetest5SW.cmd
3
A150903.dxu
05-Sep-03
16:30
15-Sep-03 12:06
Analitetest6SW.cmd
3
A160903.dxu
15-Sep-03
12:42
16-Sep-03 12:54
Analitetest6SW.cmd
3
A180903.dxu
16-Sep-03
14:00
18-Sep-03 15:12
Analitetest6SW.cmd
3
A260903.dxu
18-Sep-03
16:18
26-Sep-03 12:48
AnaliteaverageBshow 3
A071003.dxu
26-Sep-03
12:54
07-Sep-03 11:54
AnaliteaverageBshow 3
A051103.dxu
07-Oct-03
12:18
05-Nov-03 16:48
AnaliteaverageBshow 3
A171103.dxu
05-Nov-03 16:54
17-Nov-03 13:36
AnaliteaverageBshow 3
5
Time
Command
Data file A170603.dxu
The turbidity probes were placed in the tank and data started recording at 16:13 hrs on 11
June 2003. The probes were programmed to take and record a turbidity reading every minute
and Probe 1 was set to wipe once every 24 hours. The data were downloaded at 16:06 hrs on
17 June 03. Figure 3 shows the turbidity readings for the recorded period with the readings
from Probe 2 rising towards the end of the measurement period. For compatibility with later
figures the equivalent 6 minute data is shown on Figure 3. There was one reading on Probe 1
of 100 NTU however immediately after this reading the values returned to 3 NTU’s This
outlier data was removed from the data. Probe 1 also shows a rise toward the end of the
measurement period. This suggests that there is a build up on the lens and that for Probe 1 the
wipe time was perhaps not frequent enough.
11 Jun to 17 Jun 2003
Wiped every 24 hours
40
35
30
25
NTU's
Probe 1
Probe 2
20
15
10
5
0
11-Jun-03
12-Jun-03
13-Jun-03
14-Jun-03
15-Jun-03
16-Jun-03
17-Jun-03
Date
Figure 3 Turbidity probe data 11 to 17 June 2003
Data file A260603.dxu
The datataker was restarted at 17:44 hrs on the 17 Jun 03 with the program changed so a
turbidity reading was taken every 2 minutes. Probe 1 still wiped every 24 hours. At
approximately 16:27 hrs on the 18 Jun 03 the outlet hose from the pump was re-positioned in
the tank as it had moved around and the current was not flowing past the face of the probes.
This was repeated on the 19 Jun 03 at about 09:05 hrs as the hose had moved again. This
disturbance seems to have no effect on the readings obtained for this period (Fig. 4). The
datataker was again downloaded on 26 Jun 03 at 14:28 hrs and data checked. One high
reading 379 was removed from the data for probe 1 as an outlier When checking the data for
this period it is possible to see the Probe 2 values gradually rise more steadily than the values
for Probe 1 which also show some small rise towards the end of the measurement period. The
diagram shows that there are occasional high readings from both probes.
6
17 Jun to 26 Jun 2003
Wiped every 24 hours
60
50
NTU
40
30
Probe 1
Probe 2
20
10
0
17-Jun-03
18-Jun-03
19-Jun-03
20-Jun-03
21-Jun-03
22-Jun-03
23-Jun-03
24-Jun-03
25-Jun-03
Date
Figure 4 Turbidity probe data 17 June to 26 June 2003
Data file A070703.dxu
The datataker was re-started on 26 Jun 03 at 15:56 hrs and neither of the Probes had the optics
end cleaned prior to the restart. Data were collected until 07 Jul 03. The turbidity vales are
shown in figure 5.
26 Jun to 7 Jul 2003
Wiped every 24 hours
120
100
NTU
80
60
Probe 1
Probe 2
40
20
0
26-Jun-03
28-Jun-03
30-Jun-03
2-Jul-03
4-Jul-03
6-Jul-03
Date
Figure 5 Turbidity probe data 26 June to 7 July 2003
Both probes exhibit higher turbidity values from 4 Jul 2003 onwards (Fig. 5). Probe 2 values are
markedly higher than Probe 1 which suggests that the wiping of the probe every 24 hours has
some impact but that it is not frequent enough to maintain the cleanliness of the head of probe 1.
7
Data file A220703.dxu
Figures 3 to 5 show that towards the end of the time period there was an increase in turbidity
indicating a build up of algae on the end of the probes. This suggested that perhaps 24 hours
was not frequent enough. The Analite turbidity probes have been used in the Gulf of Mexico
and the wipe time was once every 15 minutes (McVan instruments Pers. Comm. 2003).
Therefore Probe 1 was set to wipe every 6 hours. Before the Datalogger was reset to collect
data for the next period, both probes were taken out of the water and the optical lens carefully
cleaned with a lint free cloth.
The datataker was restarted on the 7 Jul 03 at 16:16 hrs and collected data until 22 Jul 03. For
the probe 1 data there is an unexplained high value of 38 NTU at 20:06 hrs on 7 Jul 03
(Fig. 6). This might have been some floating root material that was in the tank as there was
nobody at the institute to disturb the probes or tank. Interestingly Probe 2 remains constant at
a value of around 1 for the same period. Probe 2 shows a slight rise in turbidity value from 9
Jul 03 while Probe 1 has a turbidity value of 1 or 2 for the same period.
7 Jul to 22 Jul 2003
Wiped every 6 hours
400
350
300
NTU
250
200
Probe 1
Probe 2
150
100
50
0
7-Jul-03
9-Jul-03
11-Jul-03
13-Jul-03
15-Jul-03
17-Jul-03
19-Jul-03
21-Jul-03
Date
Figure 6 Turbidity probe data 7 July 2003 to 22 July 2003
At 11:46 hrs on 17 Jul 03 the tank was topped up with water and stirred again, causing the
turbidity value from both probes to rise initially rise. The readings from probe 1 return to low
NTU values after the initial rise, but the values from probe 2 continue to steadily rise. The
data were downloaded at 14:24 hrs on the 22 Jul 03.
Data file A310703.dxu
The optical end of both probes was cleaned and the command file was altered to simulate
field conditions of switching off the DT50 when not recording data. The datataker was
restarted on 22 Jul 03 at 15:54 hrs and collected data until 31 July 03. During this period the
tank was topped up with water on 29 Jul 03 at 14:46 hrs and both probes registered a jump in
NTU values (Fig. 7). Probe 1 values gradually lowered after this jump whilst the values for
Probe 2 continued to rise. At the end the recording period Probe 1 was reading an NTU value
of 7, and Probe 2 had a NTU value of 18–20.
8
22 Jul to 31 Jul 2003
Wiped every 6 hours
40
35
30
NTU
25
20
Probe 1
Probe 2
15
10
5
0
22-Jul-03
23-Jul-03
24-Jul-03
25-Jul-03
26-Jul-03
27-Jul-03
28-Jul-03
29-Jul-03
30-Jul-03
Date
Figure 7 Turbidity probe data 22 July 2003 to 31 July 2003
Data file A070803.dxu
The end of both probes was cleaned and the command file was altered so that Probe 1 wiped at
3 hourly intervals. The datataker was restarted on 31 Jul 03 at 12:00 hrs and collected data until
7 Aug 03 Fig 8). There was no noticeable fluctuation in either probe for the duration of this
period, both remain around 2–3 NTUs for a few days, then both probes read 1 for the remainder
of the period. There appears to be no algal build up during the week this download file covers.
31 Jul to 7 Aug 2003
Wiped every 3 hours
30
25
NTU
20
15
Probe 1
Probe 2
10
5
0
31-Jul-03
1-Aug-03
2-Aug-03
3-Aug-03
4-Aug-03
5-Aug-03
Date
Figure 8 Turbidity probe data 31 July 2003 to 7 August 2003
9
6-Aug-03
7-Aug-03
Data file A180803.dxu
The datataker was restarted on 7 Aug at 14:00 hrs and collected data until 18 Aug 03 (Fig 9).
There were no changes made to the command file and Probe 1 was wiped every three hours.
The turbidity readings for the period remain low with only small fluctuations.
7 to 1 8 Au g 2 0 0 3
W iped every 3 ho urs
30
25
NTU
20
15
P rob e 1
P rob e 2
10
5
0
7 -A ug -03
9 -A ug -03
1 1-A u g-0 3
1 3-A u g-0 3
15 -A ug -03
17 -A ug -03
D a te
Figure 9 Turbidity probe data 7 to 18 August 2003
Data file A290803.dxu
The datataker was restarted on 18 August at 15:00 and collected data until it was downloaded
on 29 August 03. There were no changes made to the command file. The NTU values remain
low for both probes until towards the end of the recoding period when the values for Probe 2
slowly begin to rise (Fig. 10). The tank was stirred at 12:00 hrs on 29 Aug 03 which caused
the turbidity readings from both probes to rise quite dramatically. The readings for Probe 1
returned to much lower values just prior to the file being downloaded.
18 to 29 Aug 2003
Wiped every 3 hours
400
350
300
NTU
250
200
Probe 1
Probe 2
150
100
50
0
18-Aug-03
20-Aug-03
22-Aug-03
24-Aug-03
26-Aug-03
Date
Figure 10 Turbidity probe data 18 to 29 August 2003
10
28-Aug-03
Data file A020903.dxu
The datataker was restarted on 29 August 03 at 15:00 hrs and collected data until it was
downloaded on 2 September 03. There were no changes made to the command file, and the
end of the probes was not cleaned. This file is essentially a continuation of the previous file
and clearly shows the higher NTU vales for Probe 2 which isn’t wiped (Fig. 11). Probe 1
NTU values are all very low and shows the effect of the end of the probe being wiped. There
was a gradual build up of algae growth on the actual wiper arms of both probes as well as on
the end of Probe 2.
29 Aug to 2 Sep 2003
Wiped every 3 hours
500
450
400
350
NTU
300
250
Probe 1
Probe 2
200
150
100
50
0
29-Aug-03
30-Aug-03
30-Aug-03
31-Aug-03
31-Aug-03
1-Sep-03
1-Sep-03
2-Sep-03
Date
Figure 11 Turbidity probe data 29 August to 2 September 2003
Data file A050903.dxu
The end of both probes was cleaned and the datataker was restarted on 2 Sep 03 at 15:42 hrs
and collected data until 5 Sep 03. The readings for probe 1 remain constant for the period of
record (Fig. 12). The readings for probe 2 are begin to rise ever so slightly towards the end of
the recording period.
11
2 to 5 Sep 2003
Wiped every 3 hours
30
25
NTU
20
15
Probe 1
Probe 2
10
5
0
2-Sep-03
3-Sep-03
3-Sep-03
4-Sep-03
4-Sep-03
5-Sep-03
5-Sep-03
Date
Figure 12 Turbidity probe data 2 to 5 September 2003
Data file A150903.dxu, A160903.dxu & A180903.03
The datataker was restarted on 5 September 29 August 03 at 15:00 and collected data until it
was downloaded on 15 September 03. The downloads on 16 September 2003 & 18 September
2003 were both only a day or two long and these have been added to the download from 15
September 2003 (Fig. 13). The NTU values for Probe 2 show a gradual climb during the
measurement period but Probe 1 has very low readings.
5 to 16 Sep 2003
Wiped every 3 hours
60
50
NTU
40
30
20
Probe 1
Probe 2
10
0
5-Sep-03
7-Sep-03
9-Sep-03
11-Sep-03
13-Sep-03
15-Sep-03
Date
Figure 13 Turbidity probe data 5 to 18 September 2003
12
17-Sep-03
Data file A260903.dxu
The datataker was restarted on 16 September 29 and collected data until it was downloaded
on 26 September 03. Neither of the probes had the optic lens cleaned. The tank was stirred at
14:45 hrs on 19 September 2003. From 09:00 hrs to 09:40 hrs on 22 September 2003
September the pump was stopped and debris cleaned from the inlet pipe and pump housing.
The ends of the probes were not touched. The large changes in NTU values for Probe 2
correspond to when the tank was stirred and the pump stopped and cleaned. The NTU values
for Pump 1 are generally much lower than Probe 2 (Fig 14) however there are times when the
values are higher possibly due to the position of the developing algal growth on the wiper
arm.
18 to 26 Sep 2003
Wiped every 3 hours
300
250
Probe 1
Probe 2
NTU
200
150
100
50
0
18-Sep-03
19-Sep-03
20-Sep-03
21-Sep-03
22-Sep-03
23-Sep-03
24-Sep-03
25-Sep-03
Date
Figure 14 Turbidity probe data 18 to 26 September 2003
Data file A071003.dxu
The download files for, 7 October onwards all show the NTU values for Probe 2 as much
higher than Probe 1 (Fig. 15), however the values for Probe 1 are also much higher than
would have been expected. It is believed that this is due to the length of the time that the
water had been in the tank, the algal growth, sediment/material build up on the wiper blade
and the pump not moving sufficient amount of water .
13
26 Sep to 7 Oct 2003
Wiped every 3 hours
160
120
Probe 1
NTU
Probe 2
80
40
0
26-Sep-03
28-Sep-03
30-Sep-03
2-Oct-03
4-Oct-03
6-Oct-03
Date
Figure 15 Turbidity probe data 26 September to 7 October 2003
Data file A051103.dxu
The NTU values for Probe 2 are consistently up towards the maximum value of 400 NTU
particularly towards the end of the measurement period (Fig. 16). The NTU values for
Probe 1 are consistently lower than probe 2.
7 Oct to 5 Nov 2003
Wiped every 3 hours
400
350
300
NTU
250
200
150
Probe 1
Probe 2
100
50
0
7-Oct-03
12-Oct-03
17-Oct-03
22-Oct-03
27-Oct-03
Date
Figure 16 Turbidity probe data 7 October to 5 November 2003
14
1-Nov-03
Data file A171103.dxu
Figure 17 below shows the data from the last month of the test. Probe 1 has low NTU
readings however the algal growth on the wiper arm seems affect the NTU values at times
(The highest value is just over 50 NTU). The NTU values for Probe 2 are consistently up
towards the maximum value of 400 NTU for the majority of the measurement period.
5 to 17 Nov 2003
Wiped every 3 hours
400
350
300
NTU
250
200
Probe 1
Probe 2
150
100
50
0
5-Nov-03
7-Nov-03
9-Nov-03
11-Nov-03
13-Nov-03
15-Nov-03
Date
Figure 17 Turbidity probe data 5 to 17 November 2003
The testing was competed on 17 November 2003. The probes were cleaned and new wiper
blades installed ready for the field. The water was removed from the tank and the sand
allowed to dry.
5 Conclusions and recommendations
The results of the laboratory testing of the Analite turbidity probes show that it is important to
program self wiping of the optical end of the turbidity probe on a frequent basis. After some
trial and error it is recommended that the wiper be activated to wipe the optical ends of the
probes every 3 hours as this seems to be the optimum period to ensure accurate operation. The
command files that run the gauging stations in the field have been altered to allow the probes
to wipe every three hours and to record in the data files when this occurs. An example of a
command file used for the 2003–2004 wet season is shown in Appendix 1
Towards the end of the testing the water had some discolouration from algal growth and may
have started to become stagnant. Even though a pump was used to simulate water movement
it was not enough to be a true replication of the creeks in the environment. Probe 1 had a
growth on the wiper arm which may have been dragged across the end of the probe and
caused higher readings. The water in the creeks continually get refreshed with rainfall and
move steadily down the creek channels. It is not envisaged that the conditions will be suitable
to allow the algal growth on the end of the wiper arms but it is recommended that the ends of
the turbidity probes be checked visually whenever the water level is at a height that enables
this to be done.
15
The Analite turbidity probes can be checked and calibrated in the field using the calibration
standards however given that the wet season is 4-6 months long it is recommended that the
calibration be checked prior to installation in the field and also when they are removed from
the field. This will reduce the chances of contamination and also reduce weight given that the
gauging stations are accessed by helicopter.
6 Calibration of the Probes
The calibration of the Analite Turbidity probes uses standards (non carcinogenic) in the
laboratory prior to placing them in the field. It is possible to adjust the calibration of the
probes to ensure that the turbidity readings are correct. The calibration can be conducted in
the field however it is recommended that to avoid contamination of the standards that the
calibrations be checked prior to being positioned in the field and also at the end of the wet
season. The four eriss Analite probes were calibrated using a 3 point calibration ( 0, 40 &
400 NTU) according to the Instruction manual (McVan Instruments 2003). The Standards
were also checked on a calibrated Hach laboratory turbidity meter.
The final readings of the turbidity probes prior to installation in the field are shown in
Table 2.
Table 2 Turbidity values for the four eriss Analite probe prior to installation for the 2003/2004 Wet
season
Probe serial number
Standard
84178
84179
84796
84797
0
0
0
0.1
0.1
40
40.2
39.9
40.1
40.2
400
399.9
399.1
400.3
397.6
The calibration on the Analite turbidity probes will be checked as soon as they are removed
from the field at the end of the 2003/2004 Wet season
7 References
McVan Instruments Pty Ltd 2003 Analite 390 Series user manual V1.4. Mulgrave, Victoria,
Australia.
Saynor MJ, Dawson JC, Smith BL, Crisp E & Moliere DR 2001. Installation, maintenance
and running of gauging stations in the Swift (Ngarradj) Creek catchment, Northern
Territory. Internal Report 384, Supervising Scientist, Darwin. Unpublished paper.
16
Appendix 1
The command file to run the Swift Creek gauging station in Ngarradj Creek for the 20032004 wet season is shown below. The lines that refer directly to the turbidity probe are shown
as bold.
'MAIN03_1.CMD
'This program uses DataTaker to record the output of a
'Hawk Liquid level probe logged on Channel 1.
'which in turn drives TWO Gamet water samplers. When the first is full the second takes
over.
'Analite NEP396 Turbidity sensor is logged on Channel 2.
'A Pluviometer is also logged on Counter 1.
'This program was adapted and modified by J Klein
'This command file was used for the 2003/04 wet season
H
H
H
CPROG
CPROG
CPROG
RESET
\W5
CDATA
;H
;CLEAR
;CARDID="MAIN03_1"
;/T/D/o/u/n/c
;S2=0,2,0,100"water height in mm"
;S4=0,14,0,100"ph"
;S7=0,400,0,2500"NTU" 'Span for Analite NEP396
;P10=2000 'ADC settling time
;P15=1 'forced sleep mode
;P22=44 'comma delimiter in unload mode
;P31=1 'date format
;P32=5 '5 significant figures
;$="Sample Taken"
;21CV(W)=0.1 ' rise above last height to activate sampler
;22CV(W)=0.125 ' fall below last height to activate sampler
;30CV(W)=0.600 ' min height at which turbidity is wiped
;26CV(W)=0
' sample number for No 1 sampler
;36CV(W)=0
' sample number for No 2 sampler
;27CV(W)=0
'Reset Hour Counter
;28CV(W)=0
'Reset Wipe Counter
;98CV(W)=0
;BEGIN
;
CARDID
;
4DSO(W)=1
'turn probes on
;
3DSO(W,20000,R)=1
'delay for Hawk/Analite probes to stabilise
;
1L(120,S2,FF3,=23CV)
'reads Hawk depth
17
;
24CV(W)=23CV+21CV 'upper limit for sampler
;
25CV(W)=23CV-22CV
'lower limit for sampler
;
4DSO(W)=0
;RA6M
;
4DSO(W)=1
;
3DSO(W,20000,R)=1
'delay for Hawk/Analite probes to stabilise
;
1L(120,S2,FF3,=20CV)
'reads Hawk depth
;
2V(W,S7,FF0,=31CV)
'reads Turbidity
;
31CV(W)=31CV-(20CV<30CV)*(31CV)
'depth is less than 30cv return a 0
;
31CV(FF0)
'Turbidity
;
3L(120,S4,FF1,=32CV) 'ph value
;
1HSC(R,=35CV)
'tipping bucket
;
27CV(W)=27CV+1
'1/10th Hour Counter
;RX
;
20CV(FF3) 'water height
;
11SV 'forces a zero
;
11SV 'forces a zero
;
11SV 'forces a zero
;
11SV 'forces a zero
;
11SV 'forces a zero
;
28CV(FF0,"Wipe Counter")
;
$
;
26CV(FF2,"No 1 sample count")
;
36CV(FF2,"No 2 sample count")
;
4DSO(W)=0 'turn probes off
;RZ6M
;
IFR1(20CV(=23CV)>24CV)"[24CV(W)=24CV+21CV 25CV(W)=25CV+21CV
26CV(W)=26CV+1 1DSO(W,100,R)=1 X]"
;
IFR2(23CV<25CV)"[24CV(W)=24CV-22CV 25CV(W)=25CV-22CV
26CV(W)=26CV+1 1DSO(W,100,R)=1 X]"
;
IFR3(26CV>24)"[HZ1 HZ2 GZ4 GZ5]"
;
IFR4(20CV(=23CV)>24CV)"[24CV(W)=24CV+21CV 25CV(W)=25CV+21CV
36CV(W)=36CV+1 5DSO(W,100,R)=1 X]"
;
IFR5(23CV<25CV)"[24CV(W)=24CV-22CV 25CV(W)=25CV-22CV
36CV(W)=36CV+1 5DSO(W,100,R)=1 X]"
;
IFR6(36CV>24)"[HZ4 HZ5]"
;
IFR7(27CV>30)AND IFR8(31CV>1)"[27CV(W)=0 28CV(W)=28CV+1
2DSO(W,500,R)=1 3DSO(W,10000,R)=1 X] 'Wipe if >3hrs & report
;
IFR9(31CV>1)AND IFR10(31CV>395)"[28CV(W)=28CV+1 2DSO(W,500,R)=1
3DSO(W,10000,R)=1 X]" 'Wipe if Analite goes offscale
;
IFR15(27CV<29)"[4DSO(W)=0]" 'turn probes off
;END
;LOGON
;G
;HZ4 HZ5
RUNPROG
18