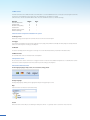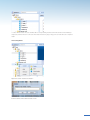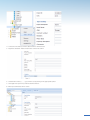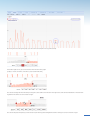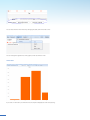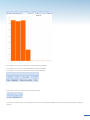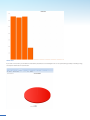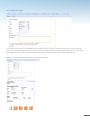
1
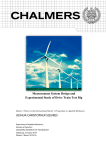
SAVE ENERGY
SAVE OUR FUTURE
USER GUIDE
El-Björn
E3 ENERGY MONITORING
within
1
CONTENTS
1 System and flow description...................................................................................... 3
1.1
Mobile meter reading................................................................................................. 3
1.2 Measurement of electricity and physical connection of distribution centres....... 3
1.3
NOTE! Implementing after delivery......................................................................... 3
1.4
Starting up the service.............................................................................................. 3
1.5 Relocation..................................................................................................................... 3
1.6
Web service.................................................................................................................. 4
2 Technical data.............................................................................................................. 4
2.1 Energy............................................................................................................................ 4
2.2 Logger............................................................................................................................ 4
2.3 Modem........................................................................................................................... 4
2.4
Web interface............................................................................................................... 4
3 Temperature sensor.................................................................................................... 4
4 Instructions E3 Professional...................................................................................... 4
4.1
Changing language, Help, Search, Tree structure............................................... 4
4.2 Identification................................................................................................................ 5
4.3
Creating users.............................................................................................................. 6
4.4
Creating folders........................................................................................................... 7
4.5
Creating virtual nodes................................................................................................ 8
4.6 Graphs.......................................................................................................................... 10
4.7
Bar chart..................................................................................................................... 12
4.8
Pie chart...................................................................................................................... 14
4.9 Presentation............................................................................................................... 15
4.10
Meter readings........................................................................................................... 16
4.11
Creating invoice support......................................................................................... 17
4.12
Comparing graphs with each other...................................................................... 18
4.13
Removing a meter..................................................................................................... 19
4.14
Information about a meter..................................................................................... 19
4.15
Changing the settings of a meter......................................................................... 20
4.16 Control......................................................................................................................... 20
4.17
Creating a time schedule........................................................................................ 21
4.18
Direct operation......................................................................................................... 22
4.19
Contact difficulties................................................................................................... 23
5 Service, hardware......................................................................................................24
6 Support, software/service........................................................................................24
2
6.1
Logger troubleshooting........................................................................................... 24
6.2
Questions and answers........................................................................................... 24
1 System and flow description
E3 is a technology for controlling and monitoring
electrical consumption. The system is built up around
mobile units that measure energy consumption and store
data so that it can be remotely read via a modem. There
is also a method for controlling the system to shut off an
electrical distribution centre or even an individual outlet.
1.1 Mobile meter reading
A logger (Multilog) must be placed at every distribution
centre that is to be metered. It reads and stores the energy consumption from the electricity meter. The
information in the logger is retrieved via a modem.
Reading/transmission is normally performed once a day,
during the night, when the GSM and electrical network
have least load. The recorded data is processed and summarised in a report that is presented via the web. The system
is described in Figure 1 - Mobile meter reading.
Pre-requisites:
Only one modem per electrical circuit is needed to allow
reading of energy consumption. The modem unit needs to
be connected to an electrical network close to or on the
power distribution centres. In order to retrieve data from
all distribution centres, they must be powered from the
same electrical circuit (max 200 metres between distribution centres).
The signals are transmitted via a frequency superimposed
on the electrical network. In certain cases a logger can be
used as a repeater (a device that retransmits a signal) to
increase accessibility on the electrical network and find
units that are further away.
When reading via GSM, you must ensure that there is
mobile coverage. Check the costs for subscriptions when
using e3 in all countries.
1.2 Measurement of electricity and physical connection
of distribution centres
The system measures electrical consumption through the
electricity meter. Depending on where the meter is located,
you can perform measurements of the entire electrical
circuit, specific areas and even down to individual outlets.
• If the electricity meter is located in the master
distribution centre, the entire consumption of the
electrical circuit will be summarised by the logger.
• If sub-centres that are fed from a master centre have
an own logger and electricity meter, a more specific
Figure 1 – Mobile meter reading
= Connection point. Describes where the mobile unit can be connected
into the system.
In order for a modem to be used by several distribution centres, it must be
powered from the same electrical circuit with max 200 meters between
each distribution centre. In case of greater distances, a logger may
sometimes be used as a repeater.
If you wish to create a total consumption figure from
several units, it can be done by creating a virtual node and/
or report in the web service that summarises the
consumption of sub-centres.
1.3 NOTE! Implementing after delivery
The E3 system has a real time clock that stores the time
for up to seven days. To prevent the clock being reset, the
distribution centre must be powered up within this time.
1.4 Starting up the service
1.Ordering of products, services and telephone
subscription for the modem (to retrieve remote
measurement data).
2.Invoicing of products and services.
3. El-Björn sends the login and products.
4. Implementation and power-up of products.
5. Note the serial numbers of the distribution centres and
the ID numbers of the loggers where the system will be used.
6.Contact El-Björn to activate the web service.
This requires the serial numbers of the distribution
centres and ID numbers of the loggers.
1.5 Relocation
If a distribution centre is to be moved to another
electrical network, it must also be moved on the web service. Contact El-Björn if you wish to relocate the distribution centres. Also remember that the distribution centres
must be powered up within seven days, otherwise the clock
will be reset. You must contact El-Björn if the clock needs
to be reset (reset at the next poll).
consumption can be registered.
3
1.6 Web service
The web service has two different levels of authorisation: user and administrator. As a user you can see reports from the
centres that the administrator has allocated. The administrator, in addition to seeing
collected data, can also determine which units the users shall have access to, and the settings.
Function
See allocated units
Create report
Rename units (alias)
Create users
Allocate units to users
Enhance settings
AdminUsers
X
X
X
X
X
X
X
X
X
-
2 Technical data: Components included in the system
2.1 Energy meter
Measures energy consumption in real time and stores the total consumption.
2.2 Logger
Logs energy consumption per unit of time (minutes, hours, days). Data, which is normally sent every night, is used by the web
service to create reports of energy consumption.
2.3 Modem
Is used for sending data from loggers to storage on a server. Retrieved data is presented in the web service.
2.4 Web interface
For overview and control of the electrical consumption.
3 Temperature sensor
An accessory that can be connected to a logger in order to measure the ambient temperature of a distribution centre.
The data is stored and presented in the same way as the energy consumption.
4 Instructions E3 Professional
4.1 Changing language, Help, Search, Tree structure, Energy meter
Change language
Change language by clicking on the appropriate flag in the upper right corner.
Help
This instruction can also be found under Help.
Search
Enter the name of the unit you are looking for and press “Enter”. To go back, refer to section on Tree structure.
4
Tree structure
Click on “Options” and “Tree”.
“Expand all” – shows all users, catalogues, measurement and control units.
“Collapse all” – shows only the user you are logged in as.
“Reload Tree” – reloads the tree if you have added something or searched for a certain meter and want to return to the
original tree.
4.1 Identification
Click on “Options”
Select how the meter should be shown in the left column.
5
4.3 Creating users
1. Right click, select “Create” and “User”.
2. Choose which type of user you wish to create. See below:
Group Admin
• Can create users, folders, virtual nodes and reports.
• Under settings, change all information.
• See all objects that are subordinate, and all that are allocated to users one has created.
Users
• Can create folders, virtual nodes and reports.
• Under settings, change Alias of a unit.
• See only the objects the group admin has allocated and those one has created oneself.
3. Enter user name and password (compulsory). Enter remaining information and click on “Save”.
6
4. Select which meters the users shall be able to see by marking the meters with the left button and holding it
depressed, and then move it to the user and release the button (drag ‘n drop). One can even allocate a complete
folder.
4.4 Creating folders
Right click, select “Create” and “Folder”.
Enter the name of the folder and click on “OK”
7
IPM Ulricehamn.
Select which meters that should to be included in the folder by marking the meters with the left button and holding it depressed, and then
move it to the user and release the button
4.5 Creating virtual nodes
1. Select which object the virtual node shall be a part of.
2. Right click, select “Create” and “Virtual node”.
3. Fill in the Input description, Unit and Alias.
8
4. Left click on the meter you wish to add so that it is marked in blue.
5. Right click and select: “Add to virtual node”. Left click to confirm.
6. Select which function (+, -, *, /) you wish to use by clicking on the appropriate symbol.
7. Start again from point 4 if you wish to add more meters.
8. When you are finished, click on “Save”.
9
9. If you wish to add more meters after you have saved, right click on the virtual node and select “Edit” and then follow the instructions
from point 4.
4.6 Graphs
If you double-click on a meter in the left column, a graph will appear on the screen.
You can also display average consumption, min. and max. and total consumption during the selected time period.
10
By moving the cursor along the graph, you can see the consumption for any particular day.
In the lower right corner, you can choose the time interval on the graph.
(7 days, 1 month, 3 months, 4 months, 1 year, Year To Date, Max)
You can also change the time interval by moving the cursor down to the interval in the right corner, left click and hold down on the red marking and then move the cursor to the left or right.
You can also displace the period you have chosen by left clicking and holding down and then moving the cursor to the left or right.
11
You can also alter the time interval by changing the date, down in the left corner.
You can change the appearance of the graph, but we recommend “Line”.
4.7 Bar chart
If you click on “Bar chart” you will have the consumption displayed as a bar chart (Yearly).
12
If you double-click on a year, you will have monthly information displayed.
If you double-click on a month, you will have daily information displayed.
If you double-click on a day, you will have hourly information displayed.
If you click on “Zoom out”, you will return to the previous view.
If you wish to see a bar chart in it’s own window, click on “Open in a new window” (NOTE! you cannot now change views by double-clicking on
the bars).
13
4.8 Pie chart
If you click on “Pie chart”, you will have the information presented as a circle diagram. This is not a particularly good way of showing energy
consumption and we don’t recommend it.
14
4.9 Presentation
If you click on "Presentation (1)" you will have a chart with four bars displayed (Monthly, Weekly, Daily and Hourly).
If you click on "Presentation (2)" you will have a chart with four bars displayed that compares with the previous year
(Monthly, Weekly, Daily and Hourly).
15
4.10 Meter readings
If you click on "Meter readings", you will have the meter reading and consumption per year displayed.
These can be exported to Excel if you wish to make your own presentation or diagram.
16
4.11 Creating Invoice support
If you click on “Invoice support”, you will be able to either create an invoice or just use it to show the cost of energy on a certain day, week,
month, year, or during the entire construction period; you choose yourself which time period will be displayed. Make sure you use the correct
cost per kW/h (must be the same cost as the energy suppliers charge, you may not charge more than the energy suppliers do).
Always choose “Preview” before printing, to make sure everything is correct.
17
4.12 Comparing graphs with each other
By clicking on a meter in the left column, you can add another meter in order to compare the values.
18
•
Add to graph 1, add to the same graph as the previous meter.
•
Add to graph 2, add as an own meter under the previous meter.
4.13 Removing a meter
If you wish to remove a meter permanently, mark the meter you wish to remove, right click and select “Remove”.
4.14 Information about a meter
Mark the meter you wish to have information about, right click and select “Detailed info”.
Certain information that you see can be changed, refer to section on changing settings of a meter.
19
4.15 Changing the settings of a meter
Mark the meter you want to change the settings on, right click and select "Settings".
Here you can change the settings. The information you can change and enter depends on your authorisation (look under Creating users).
4.16 Control
You can access control by double-clicking on "Control".
Here you can see and enter information.
• "Description": enter the name of the control.
• The "IP-address" has been pre-set in by El-Björn and must not be changed.
• "Time zone": choose the time zone the unit is located in (Standard for Sweden GMT+1).
20
From here, fill in the configuration for the various inputs on the unit. (Inputs 1–4 are used by the energy meter if there is one in the unit, input
5 is used for a PT1000 temperature sensor).
The configuration has been configured by El-Björn and must not be changed, to change contact El-Björn.
4.17 Creating a time schedule
1. Select which day you want to control.
2. Select which time.
21
3. Select condition.
4. Select method.
• Unlocked
- Direct control is possible.
• Locked
- Direct control is not possible.
5. When you have entered all controls (max 28), click on ”Save schedule”.
4.18 Direct control
1. Click on “Direct Control”
2. Click on ”Obtain” to find out the current condition.
22
3. Select which condition you want.
4. Click on ”Apply” to confirm the new condition.
5. The status is changed to to the selected. If you choose “Time Control”, the status will be according what the time control says.
4.19 Contact difficulties
You may occasionally get an error message, if you do, try the function again. If it reoccurs, check that the unit is powered.
It can also be due to a unit being in a GSM radio shadow, if this is the case try moving the unit. If this does not help,
contact El-Björn.
23
5 Service, hardware
Contact the supplier of the product.
6 Support, software/service
For web service support, first read through this User Guide. If this doesn’t help, contact El-Björn.
6.1 Logger troubleshooting
Outages can occur if there are frequency disturbances such as transients on the network. This can cause delayed updating on the web. The data is not lost, it will be saved in the logger (up to approx. eight months of hourly data) until it has
been polled (read off/sent).
6.2 Questions and answers
The most frequently asked questions are answered on our FAQ. www.elbjorn.se/e3
24
Address: El-Björn AB, Box 29, SE-334 21 Anderstorp, Sweden
Visiting address: Depågatan 6, SE-334 33 Anderstorp, Sweden
Telephone: +46 (0)371-588 100, fax: +46 (0)371-181 34
Web: www.elbjorn.se E-mail: [email protected]