1
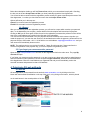
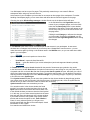
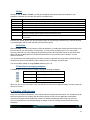
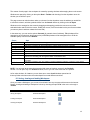
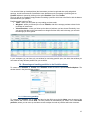
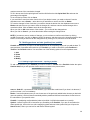
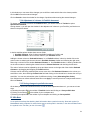
.
User Manual
QuoteStation 4.0
Belgrade, Decembar 2010.
EUROPOINT SYSTEMS DOO
Dobračina 60 11000 Belgrade
Serbia
Tel: +381 11 33 34 950
Fax: +381 11 33 40 488
[email protected]
Contact person: Marija Miladinović
EUROPOINT Makedonija DOOEL DTC Paloma Bjanka, I kat lok.6
1000 Skopje
Macedonia
Tel: +389 2 311 66 00
Fax: +389 2 311 67 00
[email protected]
Contact person: Marjan Ristov
2
Content
1. QuoteStation ……………………………………………………………………..…………… 5
2. Technical requirements ……………………………………………………………………… 5
3. Registration and renewal of subscription ………………………………………………….. 5
3.1. Registration – new users ……………………………………………………………… 5
3.1.1 Registration ……………………………………………………………………….. 5
3.1.2 Subscription………………………………………………………………………… 6
3.1.3 Confirmation ………………………………………………………………………. 6
3.1.4 Report …………………………………………………………………………....... 6
3.2 Renewal of subscription – existing users ……………………………………………. 7
3.2.1 Payment method ………………………………………………………………….
7
3.2.2 Subscription ……………………………………………………………………….
7
3.2.3 Confirmation ………………………………………………………………………. 7
3.2.4 Report ……………………………………………………………………………... 8
3.3 If you forget your username and/or password ………………………………………. 8
4. Starting QuoteStation ……………………………………………………………………….. 8
4.1 Start QS ………………………………………………………………………………….. 8
4.2 Connection to the server ……………………………………………………………….. 9
5. Using Toolbar ………………………………………………………………………………… 9
5.1 File ……………………………………………………………………………………….. 9
5.2 Window ………………………………………………………………………………….. 9
5.3 Help ………………………………………………………………………………………. 10
5.4 Search …………………………………………………………………………………….10
5.5 New ………………………………………………………………………………………. 11
5.6 Portfolio ………………………………………………………………………………….. 11
5.7 Shortcuts for managing workspace …………………………………………………… 11
6. Creation of Workspace ……………………………………………………………………… 11
6.1 Saving, clearing and loading Workspace ……………………………………………. 12
6.2 Example of a saved workspace ……………………………………………………… 13
7. Windows for tracking data …………………………………………………………………. 14
A. Title bar …………………………………………………………………………………….14
B. Toolbar ……………………………………………………………………………………. 15
7.1 MarketWatch ……………………………………………………………………………. 15
7.1.1 Adding instruments to MarketWatch window …………………………………. 16
7.1.2 Removing instruments from MarketWatch window …………………………… 16
7.1.3 Changing the order of instruments in MarketWatch window …………........... 16
7.1.4 Grouping instruments in MarketWatch window ……………………................. 16
3
7.1.5 Choice of columns and their adjustments ……………………………………… 17
7.1.6. Copying data …………………………………………………………………….. 18
7.1.7 Changeing of the field colors in MarketWatch window ………………………. 18
7.2 Level 2 (Market depth) ………………………………………………………………… 19
7.2.1 Adding symbols to Level 2 window …………………………………………….. 19
7.2.2 Adjustment of components of Level 2 window ………………………………… 19
7.2.3 Adjustment of columns in Level 2 window …………………………………….. 20
7.3 Time&Sales ……………………………………………………………………………… 21
7.3.1 Adding instruments to Time&Sales …………………………………………….. 21
7.3.2 Option History in Time&Sales …………………………………………………… 21
7.4 History ……………………………………………………………………………………. 21
7.4.1 Adding instruments to History window …………………………………………. 22
7.4.2 Option History ……………………………………………………………………. 22
7.5 Chart ………………………………………………………………………………………22
7.5.1 Adding instruments to Chart …………………………………………………….. 22
7.5.2 Types of graphs …………………………………………………………………… 23
7.5.3 Choice of the period for a graph ………………………………………………… 23
7.6 NewsList&News ………………………………………………………………………… 23
7.7 Gainers&Losers ………………………………………………………………………….24
7.7.1 Adjustment of columns in GainersLosers window ……………………………. 24
7.8 Advance Chart ………………………………………………………………………….. 25
7.8.1 Adding instruments to Advance Chart …………………………………………. 25
7.8.2 Types of graphs ………………………………………………………………….. 25
7.8.3 Choice of the period for a graph ……………………………………………….. 25
7.8.4 View ………………………………………………………………………………… 26
7.8.5 Indicators ………………………………………………………………………….. 26
7.9 Portfolio ………………………………………………………………………………….. 26
7.9.1 Renaming and handling portfolios in the Portfolio window ……………………27
7.9.2 Defining the data about broker houses you deal with ………………………… 28
7.9.3 Adding purchase and sale (positions) to a portfolio ………………………….. 29
7.9.4 Adjustment of columns in Portfolio window……………………………………. 31
7.9.5 Saving changes to portfolio window …………………………………………… 31
8. Info Box ……………………………………………………………………………………….. 31
9. Foreign exchange rate list ………………………………………………………………….. 32
10. Color scheme ………………………………………………………………………………. 32
10. Connection status …………………………………………………………………………. 33
11. Call Center …………………………………………………………………………………. 33
12. Contact information ………………………………………………………………………… 33
4
1. QuoteStation
QuoteStation is the first and only web application which provides its users with the opportunity to monitor
market movements of the South Eastern Europe stock exchanges in real time in one place. Due to a series of
functions, QuoteStation is a necessary tool for banks, brokerage houses, investment funds, local and global
companies, as well as all other participants at the financial market.
QS web aplikacija presents the following overviews of market movements of the regional stock exchanges:
•
•
•
•
•
•
•
•
•
Real time prices of financial instruments
Market depth data – Level 2
Review of closed orders
Historical data
Graphic overviews
Business and economy news
Real time values of portfolio
Foreign exchange rates list
Top instruments lists
At the moment, QS web application provides you with the data from the Belgrade Stock Exchange, Banjaluka,
Macedonia and Montenegro Stock Exchange.
QS web application is totally customized to individual needs and requirements of every user. Users can
create several workspaces as per their special needs; workspaces can then be saved and used from any
computer with access to the Internet.
2. Technical requirements
In order to run QS web application on your computer, you need to have:
•
•
Flash 9 player installed. Flash 9 player is available for Windows, Linux and Mac operating systems
and can be downloaded here.
If you use firewall, it has to be configured so as to allow connections towards port 8080.
Users who use proxy server as a connection to the Internet can follow the data in real time without
interruptions by downloading and installing QS web web application from the address:
http://www.quotestation.com/en/proxy.
3. Registration and renewal of subscription
3.1. Registration – new users
If you are to be registered as a QuoteStation user for the first time, at www.quotestation.com from the main menu (which is placed on the left side of Home Page) select option: Purchase. Registration process takes four
steps:
1. Registracija
2. Pretplata
3. Potvrda
4. Izveštaj
3.1.1 Registration
First you need to choose whether you register as a legal or physical entity. To register as a legal entity in
user types select Corporate, and to register as a physical entity select Private.
Fill in the form below with the accurate data about yourself, i.e. your company. Fields marked with red stars
are mandatory and have to be filled in. To receive a proforma invoice in the appropriate currency you have to
select the country where you reside.
5
Put in a valid e-mail address, since having completed the registration process, you will receive the proforma
invoice with payment instructions to that address.
NOTE: It is very important that e-mail address you provide is valid, because in case you forget your
username or password, you can ask for those data to be sent to your e-mail address.
Choose and write down username and password you will use to start up QS web application.
In mode of payment select the option Wire Transfer, currently the only available option.
In the required field rewrite the security code you will see in the picture at the bottom of the page, and then
select one of the offered options:
Cancel if you want to leave the registration process and go back to the home page,
Reset if you want to cancel the entered data and fill in the new ones,
Next if you want to continue with the registration process.
If you have chosen a username already used by someone, or you have entered an e-mail address which is
not valid, or made a mistake in rewriting the security code, you will be informed that you need to fill in those
data again.
3.1.2 Subscription
Selecting the option Next in the previous step, you will be further directed to subscriptions. Here you need to
define which stock exchanges you want to monitor, along with defining the subscription period.
First, choose your subscription period from a dropdown menu by clicking on – select period – and choosing
between the periods of 1, 3, 6 or 12 months. The amount shown next to the title QS web application shows a
monthly fee for the usage of the application. Once you select the period, the total amount of fee will be written
in red color next to the field for period input.
Second, check the box in front of the name of every stock exchange on offer you want to monitor the data
from. The amount shown next to the name of every stock exchange represents a monthly fee for monitoring
the data from the respective stock exchange, while the total amount of fee will be written in red color.
At the bottom of the page you will see the total amount of subscription fee for the selected period and stock
exchanges. This step offers you three options, as well:
Cancel if you want to leave the registration process and go back to the home page,
Reset if you want to cancel the entered data and fill in the new ones,
Next if you want to continue with the registration process.
3.1.3 Confirmation
In this step you will be given the overview of all the details of your subscription. Check which stock
exchanges you have chosen, duration period of the subscription, as well as the subscription price.
Below the subscription details you will find Terms of use, which you must read and comply with. Checking
the box next to the text Accept Terms of Use, you have practically signed the User Agreement.
You will not be able to continue with the registration process unless you agree to and accept the terms of the
User Agreement, i.e. unless you check the box next to the text Accept Terms of Use. Options offered to you
in this step are:
Cancel if you want to leave the registration process
Finish for a successful end to the registration process.
3.1.4 Report
After you successfully finish the registration process, you will receive a report which contains your personal
data, i.e. the data about your company, chosen details of the subscription and instructions for payment.
Clicking on the button OK you will once again confirm the end to the registration process and a proforma
invoice will be sent to the e-mail address you provided in the first step of the registration.
Your user account will be activated once your payment has been recorded, which means a day after you
made the payment. If you want the user account to be activated sooner after the payment, please send us the
payment receipt to fax number: +381 11 33 40 488 or to e-mail address: [email protected] and your
user account will immediately become active.
6
NOTE: The proforma invoice you received is valid for 7 days. Should more than 7 days pass from the
moment of registration to the payment day, you have to repeat the registration process.
3.2 Renewal of subscription – existing users
If you already have a user account – username and password for using QS web application, but your
subscription has run out or is about to run out, you need to renew your subscription and make a payment so
as to be able to continue using the application.
Open the web page www.quotestation.com and click on the Purchase. A new page My Account will open,
where you need to enter in the required fields your username and password and then click on the button Log
in.
NOTE: Check whether caps lock is on or off when entering your username and password. You have to
enter them exactly the same as you chose them in the registration process! User details – Using this option you can check the accuracy of the data entered in the registration and you
can change the data that need to be changed. This especially refers to the change of e-mail address where
you receive the notifications on the subscription renewal, as well as proforma invoices and invoices. You can
also check the duration of subscription periods.
Subsciption – Using this option you will go further to the renewal of subscription.
Logout – Going back to the first page
By choosing the option Subscriptions you will begin the process of subscription renewal. The renewal is
takes four steps:
1.
2.
3.
4.
Payment method
Subscription
Confirmation
Report
3.2.1 Payment method
By choosing option Subscription you will first be asked to opt for the mode of payment. Currently, the only
available option is Wire transfer, and having selected it you go on to select one of the two offered options:
Cancel if you want to give up the renewal of the subscription
Next to continue the renewal process of the subscription.
3.2.2 Subscription
By choosing the option Next in the previous step, you will be lead to the subscription step. Here you need to
define from which stock exchanges you want to monitor the data, as well as the duration period.
First, choose the duration period for the subscription from a dropdown menu by clicking on – select period –
and choosing the wanted period of 1, 3, 6 or 12 months. The amount shown next to the title QS web
application shows a monthly fee for the usage of the application. Once you select the period, the total fee
amount will be written in red color next to the field for period input.
Second, check the box in front of the name of every stock exchange on offer you want to monitor the data
from. The amount shown next to the name of every stock exchange represents a monthly fee for monitoring
the data from the respective stock exchange, while the total amount of fee will be written in red color.
At the bottom of the page you will see the total amount of subscription fee for the selected period and stock
exchanges. This step offers you three options, as well:
Cancel if you want to leave the registration process and go back to the home page,
Reset if you want to cancel the entered data and fill in the new ones,
Next if you want to continue with the registration process.
3.2.3 Confirmation
In this step you will be given the overview of all the details of your subscription. Check which stock exchanges
you have chosen, duration period of the subscription, as well as the subscription price.
7
Below the subscription details you will find Terms of use, which you must read and comply with. Checking
the box next to the text Accept Terms of Use, you have practically signed the User Agreement.
You will not be able to continue with the registration process unless you agree to and accept the terms of the
User Agreement, i.e. unless you check the box next to the text Accept Terms of Use.
Options offered to you in this step are:
Cancel if you want to leave the registration process
Finish for a successful end to the registration process.
3.2.4 Report
After you successfully finish the registration process, you will receive a report which contains your personal
data, i.e. the data about your company, chosen details of the subscription and instructions for payment.
Clicking on OK you will once again confirm the end to the registration process and a proforma invoice will be
sent to the e-mail address you provided in the first step of the registration.
Your user account will be activated once your payment has been recorded, which means a day after you
made the payment. If you want the user account to be activated sooner after the payment, please send us the
payment receipt to fax number: +381 11 33 40 488 or to e-mail address: [email protected] and your
user account will immediately become active.
NOTE: The proforma invoice you received is valid for 7 days. Should more than 7 days pass from the
moment of registration to the payment day, you have to repeat the registration process.
3.3 If you forget your username and/or password
Open the page www.quotestation.com and click on the Registration field in the main menu. The page My
Account will open.
If you forget your username and/or password, or you are not quite sure about using small or capital letters to
enter the username and/or password, choose the option Forgot Password?, which can be found below the
blue Log in button. Enter the e-mail address you registered with and you will immediately receive the
accurate username and password to that e-mail address.
4. Pokretanje QS web aplikacije
4.1 Start QS
QS web application can be started from the web site www.quotestation.com by clicking on the blue
button with the title Start QuoteStation on the top of the menu, or by cliking on the button , which is placed
on the main banner in the central position of the site.
8
4.2 Connection to the server
When you start and upload QS web application, the window will appear for the input of Username and
Password.
Field for input of username
Field for input of password
Option to remember password
You can remember your Username and Password on the computer you use, by activating the option
Remember password. Having filled in the required fields, click on the button Connect.
5. Using Toolbar
Once you have got connected and started QS web application, an empty workspace opens, where you
need to create your own workspace as per your requirements and preferences. For the creation of
workspace you need to get familiar with the options in Toolbar.
Toolbar in QS web application looks like this:
5.1 File
First option in Toolbar is the File which enables the management of connection to the server and of the
workspace. When you click on this tab, a dropdown menu opens where you can choose the following options:
Opcija
Disconnect
Load Workspace
Save Workspace
Clear Workspace
Save Portfolio
Akcija
If you would like to get disconnected
If you would like to load previously saved workspace
If you would like to save the created workspace
If you would like to clear the saved workspace
If you would like to save the changes in Portfolio document
5.2 Window
Option Window enables you to arrange windows in your workspace.
Windows can be arranged by dragging and dropping (position the mouse cursor on the selected window and
left-click the mouse; holding the mouse, move the window into the part of the screen where you want to place
it and then release the mouse).
In QS application there are also possibilities for automatic arrangement of windows in workspace by
using one of the options offered in Window menu.
Opcija
Cascade
Tile
Fill Tile
Clear Page
Page manager
Akcija
Enables cascade arrangement of windows one on top of the other
Arrangement of windows in your workspace to make them all the same size
Arrangement of windows in your workspace to fill in all the available workspace
Enables clearing everything which is at that moment on the active page of the workspace –
without having influenced the saved workspace
Choosing this option opens the window where you can rename all 5 pages of your
workspace
9
Your Workspace can have up to five pages. This practically means that you can create 5 different
workspaces while using only one user account.
At the bottom of your workspace you have tabs for movement to other pages of the workspace. For easier
handling of workspace pages, you can name them and define the text which will appear on the page.
Choosing the option Window/Page manager a window like the one in the picture below will open:
In the field below the title Page Name enter the
names of your workspace pages, and in the fields
below the title Description enter a more detailed
description of the pages. The text will appear on the
screen every time you move the mouse cursor over
the page name.
Clicking the tab Change you will save the changes
you have made. Clicking the tab Cancel, you can
leave the window Page Management without saving
the changes.
In the Window option there is a list of windows open at that moment in your workspace. In case some
windows have overlapped, and it seems to you that they have “disappeared” from the screen – you can
make them active again by clicking on the window name in the Window menu, so you can make them visible
again in your workspace.
5.3 Help
Option Help gives you two sub-options to choose from:
•
•
User Manual – opens the User Manual file
About… – gives the details of your current subscription (stock exchanges and duration periods).
5.4 Search
In Toolbar there is an option Search intended for the search of instruments per symbols or key words.
In the field next to the title Search enter the symbol of instrument you are looking for or a part of the name or
a keyword and click on the tab Go. After that a new window Search symbol will open, which will give a list of
all the found instruments that match the set criteria. To make the search easier, you can define the search by
selecting the stock exchange in the menu Stock exchange, or by selecting the type of symbol you would like
to find from the menu Symbol type.
From Symbol search window you can move the symbols into the chosen window by drag’n’dropp (position
your mouse cursor on the found symbol, left-click the mouse; still holding the tab, move the symbol into the
window where you want to monitor it and then release the mouse tab).
Symbol search window now remembers your last
You can also monitor in the chosen window the found
symbol if you select the symbol and then click on the tab
Open at the bottom of the window and choose which one
of the offered windows you want to show the found symbol
in. In this way, you can select several symbols at the same
time and open them simultaneously in the chosen window.
If you select more than one symbol in the Symbol search
window and choose the option Level2, Time & Sales or
Chart, for every selected symbol you will get a new
window opened with the data on the market depth, closed
transactions or with a graph. four searches and shows them in tabs.
10
5.5 New
Clicking on the tab New in Toolbar, you will get a dropdown menu which opens the windows in your
workspace. Windows you can open are shown in the table below:
Opcija
MarketWatch
Level 2
Time&Sales
History
Chart
NewsList
Gainers&Losers
Advanced Chart
Opis
“Broker table“; window for monitoring quotes for the chosen instruments
Window for monitoring market depth; enables monitoring of the market depth up to10 levels per price.
Window for monitoring all closed transactions; enables historical overview of the data.
Window for monitoring historically daily data
Window with graphs which show price movements and trading volumes for certain instruments
Window for monitoring current business and economy news
Window for monitoring instruments with the highest increase and decrease in price, volume and
turnover of trading, with the highest number of transactions done
Advance version of chart with additional options for the graphic representation and the trading volume
of securities
Choosing the offered options you open an empty window for monitoring the data which you can then arrange
in your workspace and fill in with the data you would like to follow.
5.6 Portfolio
Option Portfolio is a totally new function in QS web application. It enables the creation and monitoring in real
time the value of your own portfolio of instruments. You can track every trading you do, for every broker
house you deal with, you can create several portfolios and follow their individual values, as well as the total
value of all the created portfolios. Individual and total values of your portfolios can be shown in several
different currencies.
You can also track the closed positions (securities you have bought and then sold) and the gained earnings,
as well as the amount of transaction costs, breakeven point, percentage of portfolio gain...
You can find More details on using Portfolio window in part 7.9.
5.7 Shortcuts for managing workspace
In Toolbar there are three icons for loading, saving and clearing workspace:
Load workspace
For loading your workspace
Save workspace
For saving your created workspace
Clear workspace
For clearing the saved workspace
Save portfolio
For saving the changes to portfolio
When you click on any of the above icons, you will have to confirm once again the action you have chosen by
clicking on the icon.
6. Creation of Workspace
Every user can create a Workspace, in line with their special requirements and needs. The workspace can be
saved and used from any computer with the Internet access. In QS v3.0 web application a workspace
consists of five pages, which enables the creation of 5 different workspaces while using only one user
account. Movement from one workspace page to another is done by clicking on tabs at the bottom of the
workspace. 11
The content of each page in the workspace is created by opening windows and arranging them on the screen.
Windows are opened by clicking on the option New in Toolbar and choosing from the dropdown menu the
window you would like to open.
The page content can also be shown when you choose from the dropdown menu the window you would like
to monitor the data in, with the symbols chosen from the Search window by clicking on the tab Open.
Windows can be arranged on the screen by dragging and dropping (position the mouse cursor on the
selected window and left-click the mouse; holding the mouse, move the window into the part of screen where
you want to place it and then release the mouse tab).
In the same way, you can use the options Cascade (for cascade view of windows), Tile (windows will be
arranged so as to make them all the same size) or Fill Tile (windows will be arranged so as to fill all the
available space) from the menu Window.
Prozor
MarketWatch
Level 2
Time&Sales
History
Chart
NewsList
News
Gainers&Losers
Advanced Chart
Portfolio
Opis
“Broker table“; window for monitoring quotes for the chosen securities
Window for monitoring the market depth; enables monitoring of the market depth up to 10 levels per price
Window for monitoring all closed transactions; enables historical overview of the data
Window for monitoring historically daily data
Window with graphs which show price movements and trading volumes for certain securities
Window for monitoring current business and economy news
Space where the text of the chosen news is shown
Window for monitoring securities with the highest increase and decrease in price, volume
and turnover of trading, with the highest number of transactions done
Advance version of chart with additional options for the graphic representation and the trading volume of
securities
Window for monitoring your own portfolio or several portfolios in real time, in currency of your choice
NOTE: You can open at the same time several similar types of windows, except for the Portfolio
window. You can open only one Portfolio window, but in it you can create more than one portfolio.
As for other windows, for instance: you can have two or more Level2 windows opened and in
that way follow at the same time the market depth for several different securities.
6.1 Saving, clearing and loading Workspace
Once you create a Workspace, you can save it and load it from any computer with access to the Internet.
Saving, clearing and loading a Workspace is done by choosing the option File in the menu or through a
Toolbar.
Action
Menu option
Saving workspace
File/Save Workspace
Loading workspace
File/Load Workspace
Clearing workspace
File/Clear Workspace
Icon in Toolbar
12
NOTE: Saving a Workspace can be done either manually or automatically. Every change you would like to
save has to be confirmed by chosing the option File/Save Workspace or clicking onto the icon before closing
the application. Automatic saving is activated by chosing from File the option Autosave. This option functions
only if you leave the application by the option File/Disconnect.
6.2 Example of a saved workspace
MarketWatch, 2 Level2, Time&Sales, News and Chart
MarketWatch, Level2, History, Advance Chart and Gainers & Losers
13
MarketWatch, 5 Chart,News I Time & Sales – Regional indices
7. Windows for tracking data
All windows in QS web application can be adjusted to your requirements. Every window can be opened as
many times as you need, their appearance can be customized – starting from their content, information they
provide, to their colors, size and arrangement.
Every window consists of:
1. Title bar
2. Toolbar, and
3. Central part where the data are shown.
A. Title bar
Title bar is the name for the upper part of every window and it includes the following:
a. Graphic symbol – icon, different for each type of window
Every window for tracking the data has a graphic symbol in Title bar – an icon. When you left click the
mouse on the graphic symbol, the dropdown menu shown in the picture below will open.
Graphic symbol
- icon Move to – Enables the movement of a window in
another page of the workspace. When you select
the page, the window will be moved from the page
where it is open at that moment into the chosen page.
Close – Omogućava zatvaranje prozora, odnosno
njegovo potpuno brisanje sa radnog prostora.
14
b. Names of windows Beside graphic symbol, in Title bar of every window there is a name of that window
(MarketWatch, Level2, Time&Sales, Chart, News, Gainers&Losers, Portfolio…). In some windows, next to
the name there are also symbols which are viewed in that window (for instance in Chart window).
c. Tabs for handling a window
In the top right corner of each window in QS web application there are tabs for handling windows.
Enables hiding and unhiding Toolbar
Minimises window
Maximises window over the entire workspace
Closes window
Minimised windows are stored in te bottom left corner of your workspace and can be returned to the previous
position by clicking the window name or can be closed by clicking.
B. Toolbar
Toolbar of the windows in QS web application contains the options for the handling of content and
documents. Every window type has a different Toolbar.
7.1 MarketWatch
MarketWatch window or “broker table“ is intended for the monitoring of price movements and other values of
the chosen instruments.
You can open MarketWatch window in two ways:
a) Selecting the option New in Toolbar, and then selecting sub-option MarketWatch. In this way you
will open an empty window which can further be adjusted to your requirements and needs and
positioned into the wanted place in the workspace.
b) Entering a symbol or key word into the field Search and selecting the option Go. In the search
results you choose the instrument or instruments you would like to monitor and click on the tab Open
(at the bottom of Search window), and then sub-option MarketWatch and you will open
MarketWatch window with the data on the chosen instruments.
15
7.1.1 Adding instruments to MarketWatch window
Adding instruments you would like to track in MarketWatch window can be done in three ways:
a. Dragging and dropping to move instruments from Search window into MarketWatch window (as
explained in detail in point 5.4 Search).
b. In Toolbar of MarketWatch window choose the option Symbol, and then sub-option:
i. Add – to add instrument as the last position in the viewed list of MarketWatch window (read more on
grouping symbols in MarketWatch window in part 7.1.4).
ii. Insert – to insert symbol into a certain position in MarketWatch window. First choose the row where there
is a symbol before which you want to place the new symbol.
In both cases Search window for finding symbols will open – where you can perform search per key words or
symbols (as explained in part 5.4). Marking one or more symbols and clicking on the tab Insert at the bottom
of the window – the chosen symbols will be inserted in MarketWatch. Click on the tab Close – if you want to
close the search window without inserting the symbols in MarketWatch.
c. Direct input of instrument symbol into one of the fields in the column Symbol in MarketWach window. It is
required that there is already a symbol in the row. Left-click the mouse twice and the field will become
changeable so that you can write in any symbol you would like to monitor. Signs that you can enter directly
behind the symbol mark have a dot and extension depending on which stock exchange they are quoted at.
For instance, if you would like to follow price movements of ordinary shares of Komercijalna bank from the
Belgrade Stock Exchange, you will write down the mark kmbn.bg. Extensions are as follows: for the Belgrade
Stock Exchange – bg, for Banjaluka – bl, for Macedonia – sk and for Montenegro – mn. If you are not sure
what is the exact mark for a symbol or if you enter a wrong symbol – search window will open with the search
results after the parameters similar to the ones you have entered.
7.1.2 Removing instruments from MarketWatch window
Removing instrument symbols for which you do not want to follow prices any more can be done in the
following way:
• Select the row with the symbol you want to clear from MarketWatch window, and then
• Choose option Symbol/Remove from Toolbar in MarketWatch window.
7.1.3 Changing the order of instruments in MarketWatch window
The order of symbols can be changed by dragging and dropping rows in MarketWatch window.
7.1.4 Grouping instruments in MarketWatch window
MarketWatch gives you the opportunity to create several groups of instruments, grouped per different
criteria: per stock exchange they are traded at, the issuer branch of industry, the financial instrument type....
In QS web application there are two ways of grouping instruments in MarketWatch window:
7.1.4.1 Grouping in Tabs
Adding renaming and deleting Tabs is all done by clicking on the button Tab in Toolbar of MarketWatch
window, and then choosing one of the offered options:
•
•
•
Add – option for adding a new Tab in MarketWatch window, where you can name the tab at the
same time.
Rename – option for renaming the Tab you have previously selected
Remove – option for deleting the Tab you have previously selected.
7.1.4.2 Grouping instruments in WatchList
QS web application enables you for each Tab to group instruments per their value in WatchLists. To group
instruments in WatchList you need to:
• Position your cursor into the row with the instrument you would like to see first in a WatchList and
• Choose the option WatchList/Insert and give a name to your WatchList.
16
For a beter overview, every WatchList can be hidden and made inactive, by clicking on the arrow next to the
WatchList name. Clicking on the arrow again will return the WatchList, open it and make it visible again.
Deleting WatchLists can be done by choosing the option WatchList/Remove or clicking on the sign X at the
end of the row with the name of WatchList.
Renaming WatchList is done by choosing the option WatchList/Rename.
In the picture below we have shown an example of grouping instruments in Tabs and in WatchLists.
7.1.5 Choice of columns and their adjustments
Columns you would like to follow can be adjusted by
choosing in Toolbar of MarketWatch window the following:
Options/MarketWatch Columns. Having activated the
option, you will open Active watchlist options window – for
the choice of columns, adjustment of their order and colors.
In Active watchlist options window there are two fields:
•
•
Available Columns – a list of columns which can be inserted in MarketWatch and
Selected Columns – a list of columns already visible in your MarketWatch window.
Adding the column chosen in Selected Columns, actually adding columns to MarketWatch window, can be
done by double click on the column name in the window Available Columns or by selecting the wanted
column in the window Available Columns and choosing the right arrow.
Removing a column from the window Selected Columns, actually from your MarketWatch window, can be
done by double click on the column name for the column you would like to remove in the window Selected
Columns or by marking the chosen column in Selected Columns and choosing the left arrow.
The order of columns can be adjusted with the help of up and down arrows, on the right side of the window
Selected Columns or by dragging and dropping in MarketWatch window.
You can also activate the option for different coloring of rows (Alternating Row Colors)
Columns can be colored in the following manner: in the field Selected Columns position the cursor on the
column you would like to color, check Custom Color field, and then by clicking the colored box choose the
color you would like.
All the changes can be saved in only one Tab in MarketWach window by choosing Apply to current tab or
the changes can be applied to all the created Tabs by choosing the option Apply to all tabs.
17
Columns which are available in MarketWatch window are shown in the table below:
Kolona
Symbol
Last
TradeTime
Volume
SumBid
BidQty
Bid
Ask
AskQty
SumAsk
Open
High
Low
Close
NetCng
%Chg
%ChgM
Trend
TotVol
Turnover
VWAP
SecurityType
Exchange
Time
Phase
Range
Opis
Sign for the instrument, the same as it is registered in the respective stock exchange
Last trading price
Time of the latest closed transaction
Volume of the latest closed transaction
Total volume on demand
Volume for the order with the best demand price
The best demand price
The best offered price
Volume for the order with the best offered price
Total volume on offer
Opening price
The highest achieved price during a day
The lowest achieved price during a day
The price of the previous closed day
Absolute difference between the latest price and the closing price of the previous day
Percentual difference between the latest price and the closing price of the previous day
Graphical overview of percentage difference of the latest price and the closing price of the previous day
The difference between the last two raised prices
Total volume of trading during a day
Total turnover during a day
Average weighted price
Type of financial instrument (shares, bonds…)
Sign of the stock exchange where instrument is listed
Time of the last change of data
Trading phase
Dozvoljeni opseg u kojem cena može da se kreće u toku dana
7.1.6 Copying data
New option Copy Data allows copying data into an Excel document for the selected security, so that you can save the
data for the desired security and use later to your own needs. First, in the MarketWatch window, select the row containing
the symbol whose data you want to copy, and then from the Toolbar select Options/Copy Data. After that open the excel
document and right-click on the desired blank field from the pulldown menu select Paste. ata from the selected row will
be copied to excel. It is possible to copy more rows of data in excel, by simultaneously holding the Ctrl key and selecting
them with the left mouse button, and then the same procedure through the Copy Data option their insertion into an
Excel document.
NOTE: Besides MarketWatch window, data can be copied from the window Time & Sales, and History by the same
procedure as described above.
7.1.7 Changing of the field colors in MarketWatch window
Every change of data value in MarketWatch window is reflected in change of color of a data field. Depending
on the change tendancy (direction) fields can have one of the following colors:
Color
Meaning
Change upwards
Columns
Last, Bid, Ask, BidQty, AskQty, SumBid, SumAsk
Last, Bid, Ask, BidQty, AskQty, SumBid, SumAsk
Change downwards
No change
Last – fields in column Last are colored in blue in the moment when trade
happens, and there is no change in price. The trade is shown in Time&Sales
window with the time, price and volume
18
7.2 Level 2 (Market depth)
Level 2 window is intended for the follow up of the market depth. You have the opportunity to compare 10
(ten) levels of supply and demand. Market depth levels are shown per prices, not per individual orders.
Opening Level 2 window is done by choosing the option New/Level 2.
Another way to open the market depth window is from the search window – by selecting an instrument and
clicking the option Open/Level2 at the bottom of the Search window.
Level 2 window consists of the following components:
• Level 1 – Current balance of the chosen instrument. This component provides the same data as the ones
in MarketWatch window.
• Pressure Bar – Visual overview of the volume per the respective number of depth levels. Every
level color has a corresponding color in the Pressure Bar. Colored part of the Pressure Bar gives the
relation between the volume of orders at a certain price and the total volume in all 10 depth levels.
• Level 2 – Table with first 10 market depth levels on supply and in demand
• MarketSum Bar – Visual overview of the relation between the total sum of volume in the chosen
number of depth levels and the total volume on supply and demand. Red part of MarketSum Bar
represents the sum of columns of all the visible levels of the market depth.
Grey part of MarketSum Bar shows the difference between the total volume on supply or in demand
and the visible volume in first 10 levels of the market depth. Practically, in the grey part of MarketSum Bar you
will find the summed quantity of the orders placed at a market price and the quantity of orders which go
beyond the tenth level of the market depth.
7.2.1 Adding symbols to Level 2 window
Choosing the option New/Level 2 from the main Toolbar you will open an empty market depth window
which needs to be filled in with the data, i.e. symbols which you would like to follow up in the market depth
have to be entered. Adding instruments to Level 2 window is done in three ways:
• Drag & drop an instrument from any active window into Level 2 window
• Drag & drop an instrument from Search window into Level 2 window (as explained in detail in point
5.4 Search)
• Directly from Level 2 window by choosing the Symbol/Insert from Toolbar of Level 2 window
To remove a symbol from Level 2 window, choose the option Symbol/Remove from Toolbar of Level 2
window, and after that you will have an empty Level 2 window open.
7.2.2 Adjustment of components of Level 2 window
Adjustment of components is done by choosing the option View from Toolbar of Level 2 window.
Click on View and you will open a dropdown menu where the currently active components of Level 2 window
are marked and visible. Select the ones you would like to view or check out the ones you do not need to view
in Level 2 window.
19
7.2.3 Adjustment of columns in Level 2 window
Adjustment of columns in Level 2 window can be done for the columns in the components of Level 1 and
Level 2 of the window.
In Toolbar of Level 2 window check Options, and then from a dropdown menu select a component that you
want to adjust the columns for: Level 1 or Level 2.
a. Choosing Level 1 component from the dropdown menu you will get the window below opened
In Active watchlist options window there are two fields:
1. Available Columns: a list of columns available for inserting into component Level 1 and
2. Selected Columns: a list of already visible columns in Level 1 component.
Adding the chosen column to Selected Columns, i.e. inserting columns into component Level 1, can be
done by double click on the column name in the window Available Columns or by selecting the chosen
column or selecting the chosen column in the window Available Columns and choosing the right arrow.
Removing columns from the window Selected Columns, i.e. from the component Level 1, can be done by
double click on the name of the column you would like to remove or by selecting the chosen column in
Selected Columns and choosing the left arrow.
The order of columns can be adjusted by the up and down arrows on the right side of the window Selected
Columns or by dragging and dropping in the Level 1 component.
Columns can be colored in the following manner: in the field Selected Columns position the cursor on the
column you would like to color, then mark Custom Color field and click on the colored box to choose the
color you would like.
b. Choosing Level 2 component from the dropdown menu you will get the following windows opened:
The first window on the left enables the choice of columns which will be shown on Bid side of Level 2
window, as well as the possibility to adjust the order of columns.
The window in the middle enables the choice of columns which will be shown on Ask side of Level 2
window, as well as the possibility to adjust the order of columns.
The third window enables you to define the number of market depth levels which will be shown in Pressure
and MarketSum Bar. The assumed number of market depth levels in Level 2 window is 10. Reducing this
number in settings, you will only configure the view of Pressure and MarketSum Bar. For this window you can
also define the colors of depth levels.
20
7.3 Time&Sales
Time&Sales window enables the follow up of the closed transactions for the chosen
instrument. When you open it, the window is empty and you need to add the data on
the instrument for which you would like to follow up the transactions.
Window Time&Sales is opened by clicking on the icon New in the main Toolbar and
choosing from the dropdown menu Time&Sales.
Another way to open the window for the follow up of transactions is to open it from
the search window – by selecting an instrument and clicking on the option
Open/Time&Sales at the bottom of Search window.
7.3.1 Adding instruments to Time&Sales
Adding instruments to Time&Sales window is done in three ways:
•
•
•
•
Drag & drop an instrument from any active window into Time&Sales window
Drag & drop an instrument from Search window into Time&Sales window (as explained in detail in
point 5.4 Search).
Directly from the window Time&Sales by choosing the option Symbol/Insert from Toolbar of
Time&Sales window. You will open the search window and when you enter the key word and find
the symbol you would like to follow up, click on the tab Insert at the bottom of the window.
For the removal of symbols from Time&Sales window choose the option Symbol/Remove, after which you
will leave an empty Time&Sales window open.
7.3.2 Option History in Time&Sales
When you choose the option History in Time&Sales, you can
get an overview of the closed transactions for the required time
period. If you choose the option History/Add, you can also add a new
tab in Time&Sales window and choose a time period for which
you would like to view the closed transactions: In the left half of the window you mark the date of the beginning
of the period, while in the right part of thewindow you mark the
end date of the period for which you would like to view the data. When you click on OK, a new Tab will be created, with the data
on the closed transactions for the required time period. In that way in one Time&Sales window you can create more than one Tab for the follow up of the closed
transactions for different time periods and different instruments.
Option History/Rename enables you to rename a previously selected Tab.
Option History/Remove enables the deletion of the previously selected Tab.
7.4 History
Window History gives the overview of daily data for the chosen instrument. This window gives you the
opportunity to track closing prices, opening prices, the highest and lowest daily price and the total turnover
per day.
21
7.4.1 Adding instruments to History window
Adding instruments to History window is done in three ways:
•
•
•
•
Drag & drop an instrument from any active window into History window
Drag & drop an instrument from Search window into History window (as explained in detail in point
5.4 Search)
Directly from the window History by choosing the option Symbol/Insert from Toolbar of History
window. Thus you will open the search window and after you enter the key word for a search and find
the symbol you would like to follow up, click on the tab Insert at the bottom of the window.
For the removal of symbols from History window, please check the option Symbol/Remove.
7.4.2 Option History
When you insert the chosen instrument in History window, you will get a six month overview of the daily
data. Besides that, you have the opportunity to view historical data – for the time period of your choice.
Choose the option History/Add – to add a new tab in History window. A window for naming a new Tab will
open, and after you name the Tab, you will get the opportunity to choose the historical period for which you
would like the data shown. In the left half of the window you mark the date of the beginning of the period, while in the right part of the
window you mark the end date of the period for which you would like to view the data. When you click on
OK, a new Tab will be created, with the data for the required time period. In that way in one History window
you can create more than one Tab for the follow up of the closed transactions for different time periods and
different instruments.
Option History/Rename – enables you to rename a previously selected Tab.
Option History/Remove – enables you to remove the previously selected Tab.
In this window you can create an unlimited number of Tabs with the defined periods for which you will obtain
the data.
7.5 Chart
In this window you can track a graphic overview of the price movements and trading turnover for the chosen
instrument. The window is opened by clicking on the icon New in Toolbar and choosing the option Chart.
Another way to open the chart window is when you select an instrument in the Search window and click on
the option Open/Chart at the bottom of the Search window.
When you position the mouse cursor on any point in the graph, in the top right corner of the window you will
get the data on the opening price, the highest and lowest price, closing price and the trading turnover for the
compression unit as per the time period chosen to be presented. On the horizontal axis (x-axis) you will get
the time period marked, and on the vertical (y-axis) the period price.
7.5.1 Adding instruments to Chart
Adding instruments to Chart window is done in three ways:
• Drag & drop an instrument from any active window into Chart window
22
•
•
•
Drag & drop an instrument from Search window into Chart window (as explained in detail in point 5.4
Search)
Directly from the window Chart by choosing the option Symbol/Insert from Toolbar of Chart window.
Thus you will open the search window and after you enter the key word for a search and find the
symbol you would like to follow up, click on the tab Insert at the bottom of the window.
To remove symbols from Chart window, choose the option Symbol/Remove, and you will leave an empty
Chart window open.
7.5.2 Types of Charts
You can choose the type of graph which will present the price movements of the chosen instrument by
checking the option Chart Type in Toolbar of the Chart window.
You can choose from one of the following graph types:
1. Line – Connects the last prices in the given time period
2. Area – Connect the last prices with a line similarly to the Line graph, but also colors the lower part of
the graph
3. Candlestick – Shows the opening price, closing price, and the highest and lowest prices. The upper
line of the square presents the highest price, while the lower line represents the lowest achieved
price during a day. The square is in red color if the opening price is higher than the closing price or in
green color if the opening price is lower than the closing price. Vertical line shows the lowest and
highest price achieved during a day.
4. Bar (OHCL) - Bar shows the opening price, closing price, and the highest and lowest prices for a
certain time period. Left dash on the bar represents the opening price, while the right dash
represents the closing price. Vertical line shows the lowest and highest price achieved during a day.
7.5.3 Choice of the period for a Chart
Choosing the option Compression in Toolbar of the Chart window from the dropdown menu, you can
choose one of the following periods:
• Day – Current day (5 minutes compression)
• Week – Previous week (5 minutes compression)
• Month – Previous month (daily compression)
• 3 Months – Previous 3 months (daily compression)
• 6 Months – Previous 6 months (daily compression)
• Year – Previous year (daily compression)
• 2 Years – Previous 2 years
7.6 NewsList&News
NewsList window gives the overview of current business and economy news. Distributed news releases are
received from the leading local news agencys – B92.
The window NewsList is opened by clicking on the icon New/News in the main Toolbar.
When you double click on the row where there is a headline of the news you would like to read, a new
window is opened with the full text of the chosen news release.
23
In the News window with the entire text shown you can check the box in the top right corner – and thus
define whether you would like to see the next release in the same window or, if you do not check the box,
each subsequent news release will be shown in a new window.
7.7 Gainers&Losers
Window Gainers&Losers gives the overview of ten instruments with the highest increase and decrease in
price, with the highest volume and turnover of trading and with the highest number of closed transactions.
You can open this window by clicking on the icon New/Gainers&Losers in the main Toolbar. When you
check the option Stock Exchanges in Toolbar of the Gainers&Losers window, you can choose for which
stock exchange you would like to track the instruments with the highest increase, decrease, turnover, volume
and the number of transactions.
7.7.1 Adjustment of columns in GainersLosers window
The same as with other windows, if you choose Options/Gainers&LosersOptions in Toolbar of the
Gainers&Losers window, a new window will open for the choice of columns, the adjustment of their order
and colors.
In Active watchlist options window there are two fields:
1. Available Columns: A list of columns available for inserting in Gainers&Losers window, and
2. Selected Columns: A list of columns already visible in the Gainers&Losers window.
Adding the chosen column to Selected Columns, i.e. to the Gainers&Losers window, is done by double
click on the column name in the window Available Columns or by marking the chosen column in the window
Available Columns and choosing the right arrow.
Removing the column from the window Selected Columns, i.e. from the Gainers&Losers window, is done
by double click on the name of the column you would like to remove in the window Selected Columns or by
marking the chosen column in Selected Columns and choosing the left arrow.
The order of columns can be adjusted with the help of up and down arrows on the right side of the Selected
Columns window or by dragging and dropping columns in the Gainers&Losers window.
The columns can be colored by positioning the mouse cursor in the field Selected Columns on the column
you would like to color, then marking Custom Color field and choosing the color you would like clicking on
the color box.
24
You can also activate the option for different coloring of rows (Alternating Row Colors).
All the changes you make can be saved in only one Tab of the MarketWach window by choosing Apply to
current tab or you can apply them to all the created Tabs by choosing the option Apply to all tabs.
7.8 Advanced Chart
A new type of chart – Advanced Chart provides a detailed graphical display and analysis of price movements
and trading volume for the desired security. The graph consists of two parts. The upper main section provides
a graphic display of movement rates, while the bottom (which can also be turned off) shows the amount - the
trading volume of selected securities for the unit of compression in relation to the selected date range.
The window is opened by clicking on the icon New in Toolbar and choosing the option Chart.
Another way to open the chart window is when you select an instrument in the Search window and click on
the option Open/Chart at the bottom of the Search window.
By positioning the mouse cursor on any point of the chart in the upper left-left corner of the window you can
get information on price, quantity, date and time for the selected point.
7.8.1 Adding instruments to Advanced Chart
Adding instruments to Advanced Chart window is done in three ways:
•
•
Drag & drop an instrument from any active window into Advanced Chart window
Drag & drop an instrument from Search window into Advanced Chart window (as explained in detail
in point 5.4 Search)
• Directly from the window Advanced Chart by choosing the option Symbol/Insert from Toolbar of
Advanced Chart window. Thus you will open the search window and after you enter the key word for
a search and find the symbol you would like to follow up, click on the tab Insert at the bottom of the
window.
To remove symbols from Advance Chart window, choose the option Symbol/Remove, and you will leave an
empty Advance Chart window open.
7.8.2 Types of Advance Charts
You can choose the type of graph which will present the price movements of the chosen instrument by
checking the option Chart Type in Toolbar of the Chart window.
You can choose from one of the following graph types:
1. Line – Connects the last prices in the given time period
2. Area – Connect the last prices with a line similarly to the Line graph, but also colors the lower part of
the graph
3. Candlestick – Shows the opening price, closing price, and the highest and lowest prices. The upper
line of the square presents the highest price, while the lower line represents the lowest achieved price
during a day. The square is in red color if the opening price is higher than the closing price or in green
color if the opening price is lower than the closing price. Vertical line shows the lowest and
highest price achieved during a day.
4. Bar (OHCL) - Bar shows the opening price, closing price, and the highest and lowest prices for a
25
certain time period. Left dash on the bar represents the opening price, while the right dash
represents the closing price. Vertical line shows the lowest and highest price achieved during a day.
7.8.3 Choice of the period for a Advance chart
Choosing the option Compression in Toolbar of the Advance Chart window from the dropdown menu, you
can choose one of the following periods:
•
•
•
•
•
•
Daily – Daily compression
Intraday – Compression during day (1,2,3,5,10,15,20,30 minutes,1 hour)
Weekly – Weekly compression
Monthly – Montly compression
Yearly – Yearly compression
Tick – Compression by tick
7.8.4 View
Option View gives the ability to change the look - the data view for a selected security, to customize the
graph to your analysis needs. Click on the View from the Toolbar opens drop-down menu with the following of
sub-options:
1. - Last N - displays the last n changes in securities
- From–To - displays the values in the chosen time period
2. - Show Volume - opens/closes the bottom of the window that displays the amount/trading
volume
- Show Last – displays the last price of security on the x axis
3. - Indicators – gives the option of inserting one of 48 supported indicators - to monitor and
analyze securities trends
7.8.5 Indicators
Users now have the option of using any of the 48 indicators and make detailed analysis of trend of the
selected securities, and so more accurately and reliably plan their trading.
Selecting the option View/Indicators from the Toolbar of Advanced Chart opens next window:
Adding the indicators is done by clicking on the desired indicator listed in the top left of the window (after
which, depending on the selected indicators on the right side open options for changing colors, margins,
location, etc..), and then the Add button and clicking on OK. The indicators can be opened in the main or in a
secondary window of Advanced Chart checking/dechecking the option Same panel as symbol.
Removing indicators is done in the same window, clicking on the Remove, and then on OK.
7.9 Portfolio
A completely new function – Portfolio enables the creation and monitoring in real time of your own portfolio of
instruments. You can track any trading done, for every broker house you deal with, you can form several
profiles and track their individual values, as well as the total value of the created portfolios. Individual and total
values of your portfolios can be shown in several different currencies.
26
You can also follow up closed positions (the instruments you have bought and then sold) and gained
earnings, as well as the amount of transaction costs, breakeven point, percentage of portfolio gain etc.
Portfolio window is opened by clicking on the option Portfolio in the main Toolbar.
Thus you will get a completely empty window for tracking a portfolio which has to be filled in with the data on
instruments from your portfolio.
Portfolio window has three Tabs:
• Trade – where you can follow up every trading you have made
• Wieghted – where you follow up the sum of Portfolio, with all the average purchase values for the
purchases of instruments.
• Closed Positions – where you follow up the values of positions you have closed. Practically, here
you can see the data on the instruments once bought and then sold, and in that way you can track
the earnings you have gained.
In your workspace you can have only one window for monitoring portfolio open, but within that window you
can create as many different portfolios as you would like.
7.9.1 Renaming and handling portfolios in the Portfolio window
To create a new Portfolio, in Toolbar of the Portfolio window choose the option Portfolios/Options. The
window shown in the picture below will open:
7.9.1.1 Unos novog portfolija
To create a new Portfolio, click on Add, and then into the field next to the title Name enter the name of the
new portfolio and click on the tab Add. The new portfolio will automatically be shown in the field Active
portfolios, where you can move up and down arrows to adjust the order of portfolios within the document.
27
7.9.1.2 Promena imena portfoliju
If you would like to rename a Portfolio, you first need to select it, then click on Rename – and you will get
the window open where you will enter a new name for the chosen Portfolio.
7.9.1.3 Brisanje portfolija
To completely delete one of the added portfolios, you first need to select it, and then click on Delete – you
will fully erase it, complete with all the previously inserted instruments.
7.9.1.4 Prikaz portfolija u Portfolio prozoru
In the window Available Portfolios there are all the portfolios you have created, whilst in the window Active
Portfolios you get the portfolios as shown in the Portfolio window.
If you would like to completely remove one of the portfolios from the Portfolio window – in order not to add its
value to the Grand Total but to keep the inserted data for some later use – move it from Active Portfolios to
Available Portfolios by double clicking the mouse cursor on its name in the window Active Portfolio.
Moving your portfolios is also possible by using left and right arrows.
7.9.1.5 Izbor valute prikaza portfolija
For every portfolio you create you can define the currency to be calculated in by selecting the portfolio name
and next to the title Selected Portfolio from the dropdown menu choosing the presented currency.
Grand Total Currency – gives you the choice of currency in which to calculate and show Grand Total – the
total sum of all your portfolios together. You need to choose from the dropdown menu one of the offered
options: EUR, BAM, RSD, MKD.
7.9.1.6 Čuvanje podešavanja
When you click on Apply – you confirm all the changes done.
When you click on Cancel – the window will close, without saving the changes done.
7.9.2 Defining the data about broker houses you deal with
Before you enter the data about the done trading, you first need to define the brokers you deal with and the
brokerage fees – commission you pay on the purchase or sale. Those values will later be automatically added
to every purchase (opening of the position) and to every sale (closing of the position), and they will be
included in the calculation of the value of your portfolio. Brokerage fees will also be taken into account in the
calculation of the breakeven point.
To define your broker houses, you need to choose Brokers/Options in Toolbar of the Portfolio window,
and you will open the window like the one shown in the picture below:
To add a new broker to the list of the broker houses you deal with, you need to click on the tab Add, enter
the broker name in the field Name and then click on Add.
Choose the currency you trade in through the added broker house by selecting it from the menu Currency.
From the dropdown menu you can choose the option AND – if the fees of the respective broker house imply
both percentage and fixed rate commission, or you can choose the option OR, if the costs include only the
lower of the two commission rates. Therefore, the option AND is to be chosen if your broker has a defined
minimum amount of the commission charged, while the option OR is chosen when a broker has a defined
28
maximum amount of the commission charged.
To fill in the tax rate for the capital gain tax mark the field before the title Capital Gain Tax and enter the
percentage of tax applied.
To save all the input fees, click on: Save.
If you would like to remove a broker from the list of your broker houses, you need to choose it from the
dropdown menu next to Broker – select the one you would like to remove and click on Delete.
To enter the changes in fees of a broker, you need to choose the broker from the dropdown menu next to
Broker and select the one you want to save the changes for, and then enter the wanted changes in the
commission fields. Click on Save to store all the changes done.
When you click on OK at the bottom of the window – you confirm all the changes done.
When you click on Cancel – you close the window without saving the changes done.
NOTE: If you want to enter a number of changes, you do not have to confirm each of them by clicking
on OK. It is enough if you click on Save to confirm the amount, and then move to the changes related to other
brokers. In the end you will store all the changes done by clicking on OK, which will close the window 7.9.3 Adding purchase and sale (positions) to a portfolio
Portfolio window which you open in QS web application will be completely empty until you add the data. To
enter positions of purchase and/or sale into your Portfolio, you need to choose the option Positions in
Toolbar of the Portfolio window. You can select one of the following options from the dropdown menu:
1. Add
2. Delete
3. Close
4. Modify
7.9.3.1 Adding bought instruments – opening a position
To add a new position to your Portfolio you need to choose in Toolbar of the Portfolio window the option:
Position/Add, and you will open the window as the one shown in the picture below:
Order ID ‐ Order ID – represents the order number, if you would like to add it and if you know it in advance; if
you do not know it, it is not mandatory. Broker - from the dropdown menu you can choose one of the previously added broker houses you deal with
(open the position), which will then automatically add the predefined fees and commissions for the broker to
the calculation of your portfolio value.
Portfolio - iz padajućeg menija odaberite jedan od portfolia u koji želite da smestite novu poziciju.
Symbol – insert the symbol of an instrument you are adding to the Portfolio; if you are not sure about the
exact symbol sign, click on the icon with a magnifying glass and next to the symbol field you will open the
Search window, where you can look for and find the wanted symbol.
29
Quantity - add quantity – the number of instruments you are buying
Price - field with a purchasing price value (opening price)
Date - field with the date on which you opened the position – i.e. bought instruments. When you click on a
graphic symbol for a calendar next to the field, you open the calendar where you can choose the exact date.
Click on OK to confirm all the entered data.
Click on Cancel to close the window without saving the data entered.
7.9.3.2 Deleting positions
To completely delete a position from Portfolio, you need to select the position, and then in Toolbar of
Portfolio document choose the option: Positions/Delete.
When you delete a position, the purchase of instruments is not considered as performed and it is no longer
shown in the portfolio values.
7.9.3.3 Closing positions in Portfolio
If you would like to close a position from your portfolio, first mark the position in the portfolio, then in Toolbar
of the Portfolio document choose the option Positions/Close, and you will open the window for entering
data on the closure.
Order ID ‐ represents the order number, if you would like to add it and if you know it in advance; if you do
not know it, it is not mandatory.
Broker - from the dropdown menu you can choose one of the previously added broker houses you deal with
(open the position), which will then automatically add the predefined fees and commissions for the broker to
the calculation of your portfolio value.
Symbol – has already been predefined by the choice of order you are selling
Quantity - add quantity – the number of instruments you are selling. If your order was for 100 instruments,
you do not have to sell them all, but enter into the field Quantity only the number of instruments for which you
would like to close the position. However, you cannot sell a higher number of instruments from the number
you bought by the order which is being closed.
Price - Polje za unos prodajne cene (cene zatvaranja)
Date - Polje za unos datuma kada ste otvorili poziciju – kupili hartiju od vrednosti. Klikom na grafički simbol
kalendara pored ovog polja otvara se kalendar u kom možete odabrati tačan datum.
Klikom na OK potvrđujete unete podatke.
Klikom na Cancel zatvarate prozor bez čuvanja unetih podataka.
Nalog koji na ovaj način zatvorite automatski se prikazuje na Tab-u Closed Positions na Vašem Portfolio
prozoru.
7.9.3.4 Change of positions
All positions entered into Portfolio can be changed. Regardless of whether you want to change closed or
open positions, first select the position you would like to change.
When you choose the option Positions/Modify, you will open one of the following windows, depending on the
situation – whether you are changing an open or closed position:
30
In this window you can enter all the changes you would like to make which refer to the chosen position.
Click on OK to save the entered changes.
Click on Cancel to close the window for the change of positions without saving the entered changes.
7.9.4 Adjustment of columns in Portfolio document
To change, add or remove columns in Portfolio window, you need to choose in Toolbar the option
Options/Grid Columns.
Having chosen it, you will open the window for the adjustment of columns in your Portfolio, just like the one
shown in the picture below:
In Active watchlist options window there are two fields:
1. Available Columns: A list of columns available for adding to Portfolio and
2. Selected Columns: A list of columns visible in your Portfolio window.
Adding the chosen column to Selected Columns, i.e. to Portfolio window, is done by double click on the
column name or selecting the chosen column in Available Columns window and choosing the right arrow.
Removing a column from the window Selected Columns, i.e. from Portfolio window, is done by double click
on the column name or selecting the wanted column in Selected Columns and choosing the left arrow.
The order of columns can be adjusted by the up and down arrows on the right side of the window Selected
Columns or by dragging and dropping in Portfolio window.
Columns can be colored by positioning the mouse cursor in the field Selected Columns on the column you
would like to color, then checking Custom Color field and clicking on the colored box to choose the color you
would like. You can also activate the option for different coloring of rows (Alternating Row Colors).
Sve učinjene izmene možete sačuvati samo klikom na: Apply, ili zatvoriti prozor bez čuvanja unetih izmena –
klikom na Cancel.
7.9.5 Saving changes to portfolio document
All the data you enter into Portfolio document, as well as all the adjustments done to it, you can save in two
ways:
a) Choosing the option File in the toolbar of Portfolio window and clicking on: Save portfolio data
b) Clicking on the shortcut
in the toolbar of your workspace and
c) Choosing the option File in the toolbar of your workspace and clicking on: Save portfolio
8. Info box
A new option that allows fast obtaining basic information about a particular security. Next each symbol (in
MarketWatch and the Gainers & Losers window next to each symbol in the table, in the other windows next to
the symbols in the Title Bar,) an icon is located.
31
Positioning the mouse on the icon opens the Info box field that contains data about the name of the issuer of
securities, Isin number, the stock market and currency.
9. Foreign exchange rate list
In QS web application every moment you need it you can get foreign exchange rate lists of central
banks for the EUR currency compared to regional currencies.
When you cross with your mouse cursor over the symbol for EUR (€) at the bottom right corner of the
workspace, a second later a foreign exchange rate list will appear.
Symbol functions as a Tooltip – which means that it is enough to draw the cursor close and the data will
show up. The same principle applies if you want the data to disappear. Once you move the cursor away, the
data will disappear.
10. Color scheme
QuoteStation can have the look you choose. Four color schemes, which will satisfy
in the bottom
the most demanding users, are at you diposale. Click the button:
right corner of your Workspace and the menu for selecting the color scheme will
appear.
By chosing one of the color options your Workspace will get one of the looks shown on a
picture below:
Classic
Light
Dark
Blue
NOTE: The color scheme of your choice will automaticly be saved. Color scheme active while closing the
application will be activated upon the starting the application.
You can not save color scheme by option File/Save Workspace.
32
11. Connection status
In the bottom left corner of the Internet browser window you will find a signal lamp which serves to help you
determine the status of your connection. Signal lamp can be in red, green or yellow color.
Red signal lamp with the written text Disconnected shows that there is currently a breakdown in connection.
Yellow signal lamp with the written text Connected shows that the connection has been established.
Green signal lamp with the written text Authorized and your username means that there is an active
connection and that you can start the creation of your workspace.
12. CallCenter
Should you have any questions or issues which have to be solved immediately, you can call our HelpDesk on
the phone number:
+381 11 33 40 377
Working hours of the HelpDesk are Monday to Friday, 8:00 – 17:00. or you can e-mail us at:
[email protected]
13. Kontakt informacije
For all additional information, feel free to contact us in our offices:
EUROPOINT SYSTEMS DOO
Dobračina 60 11000 Belgrade
Serbia
Tel: +381 11 33 34 950
Fax: +381 11 33 40 488
[email protected]
Contact person: Marija Miladinović
EUROPOINT Makedonija DOOEL
DTC Paloma Bjanka, I kat lok.6
1000 Skopje
Republic of Macedonia
Tel: +389 2 311 66 00
Fax: +389 2 311 67 00
[email protected]
Contact person: Marjan Ristov
33