1
OHIO UNIVERSITY
Executive Summary Design Report
Senior Design
Team 4: OU BBQ
Colin Harris
Daniel Shapiro
Colton Shoemaker
Aaron Shelly
Shad Williams
Spring 2010
2
Abstract: Background and Statement of the Problem
This paper discusses a Senior Design Project that took place in the Department of
Mechanical Engineering at Ohio University. Team OU BBQ consisted of five engineering students
that were presented with a problem by their client, Patricia Thomas who owns a mobile food
vending service. The problem presented to the group dealt with the customer running out of product
because a large enough grill could not be transported on her truck. After researching food and road
safety standards, the group designed and analyzed a system that could incorporate a much larger
grill and still be transported on her truck with ease of use. The end product used a hydraulic lift
system that attached to the back end of the truck and lowered the grilling system to the ground so
the grill could be used wherever was convenient.
Rationale: Usefulness of Device/System
The design of the mobile grilling system proves to be very different from any other grilling
systems that were researched and benchmarked. Other benchmarked products intended for pickup
trucks featured hitch attachment rather than a hydraulic lift table that was used in this design
project. The hydraulic lift table allowed for the grill to be removed from the vehicle to allow safer
and more convenient operation. A custom ash door and removable ash tray were manufactured to
allow for quicker and easier cleaning of the grill. Along with a custom bumper design being
installed to incorporate the lift table, a custom grill and detachable legs were designed that set it
apart from any other grill found during research. Not only was the grill successfully manufactured
and delivered to the customer, but the design proved to be operable by one individual and increased
the amount of ribs that could be made. This directly correlated to higher profits and also a more
enjoyable experience considering the customer’s feedback.
Design: Solution (Overall, Cost, Ease of use and implementation, and Safety/safety features)
The materials cost of the team’s design solution is broken into seven main components,
which are summarized in Table 1.0 in Appendix A. The seven components are the grill grates,
hydraulic lift table, grill paint, materials from Logan Welding, KCK Company and McMaster Carr,
and the other estimated cost from hardware stores like Lowes. A production cost was estimated
using a recommended method presented to us in one of our lectures at Senior Design. Table 2.0 in
Appendix A shows the breakdown for the labor and purchased materials cost. The hours of labor to
manufacture the system were estimated.
The grilling system has shown to be very easy to use and implement thus far. The customer
has used the grill on several occasions over the past couple weeks at various locations and has
reported no issues with the loading/unloading process. She is able to load and unload the grill in a
timely manner (less than five minutes) and she has expressed that the process has gotten easier as
she has learned the process better.
The grill has performed well in cooking mode as well. She has reported that the temperature
is easy to moderate and that she uses less charcoal than with her old large grill. Cleaning the grill
3
has also proven easier than the other grills she has used. The grill grate seats are sized so that food
does not build up on them and there are no other crevices for food to accumulate. The removable
coal bed with handles eases leftover coal removal and the ash door makes cleaning out the ash
easier than her previous grills.
Safety was a major consideration during the design process and the safety of the operator
and others was considered in all modes of operation. The primary safety concern in transportation
mode was that the grill unit would become detached from the truck while driving and the grill
would become a hazard to other drivers. To ensure that the grill would not become detached from
the truck, redundant holding methods were used. The grill is primarily held to the vehicle with two
steel pins that are inserted by the operator as part of the loading process. The pins alone could hold
the grill to the vehicle during transportation. To complement the primary holding method, a
ratcheting tie-down strap was used to cinch the grill to the bumper. The strap also reduces
vibrations in the grill lid and lift platform that could lead to eventual fatigue-related failures if not
damped.
In loading/unloading mode our primary safety concerns dealt with pinch points, sharp
edges, and dropping the grill. The location of handle that operates the lift platform helps reduce the
likelihood of injury while operating the lift table. The operator must stand off to the side of the
table in order to raise/lower it and is therefore away from any moving parts during operation. With
regard to dropping the grill, the design of the rail system makes it very unlikely that the grill would
fall during operation even if the wheels were not placed in the rails. All the edges and corners of
the grill and rail were rounded so the operator may come in contact with to reduce the likelihood of
injury.
It was vital to make sure that there weren’t any undue or excessive dangers to the operator
while using the grill to cook. The lid and base both feature coiled metal handles that remain cool
enough for the lid to be opened and the grill to be moved—even when the grill is operating at
maximum capacity—and not cause the operator burns or discomfort. Besides being a useful
cooking tool, the thermometer on the lid also gives the operator an indication of how hot the grill is
(as long as the lid is shut) and whether or not it is safe to touch.
Development: Prototype (Construction quality and accuracy & Consistent and accurate function)
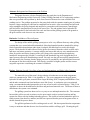
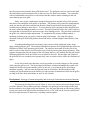
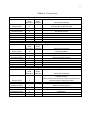
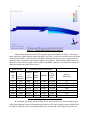
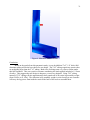
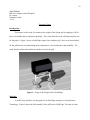
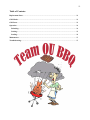
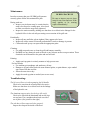
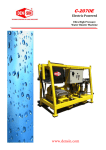
The prototype developed (as seen in Figure 1) was a very unique and custom design focused
to aid the customer. Due to money and time constraints, the prototype was developed as the final
product and had to be of high quality and function. Very few parts that make up this unique grilling
system were made with high-precision machines such as a CNC mill, but the overall system had to
be held to tight tolerances to make sure everything worked together.
4
Figure 1: Grill Prototype
The system works just as it was designed to operate. The transition from Transportation
Mode to Cooking Mode takes less than three minutes with one operator. The grill is large but has
shown in trial runs to heat and cook food evenly. The mounted thermometer makes it easy to see
what temperature the grill is at, and the four large air vents help to control the temperature.
The system was released to the customer for use and has received nothing but good
feedback. The system allows Patricia to easily transport the large grill to various locations for use. It
has eliminated the need for heavy lifting, and is simple enough that the grill can be unloaded/loaded
in less than three minutes.
Evaluation: Testing and Evaluation
The initial evaluation of the design concept was the failure modes and effects analysis
(FMEA). In this analysis, the team considered all conceivable and reasonable failure modes and
safety hazards of the current design. Alterations were then made to the design based on this
analysis and then re-evaluated. The FMEA tables are given in Appendix B.
During ME-451, several FEA stress tests were performed in Algor on different system
components including the bumper, the rails the grill rolls on, the grill base handle, the legs, and the
lid hinges. A full description of each analysis can be located in Appendix C.
Experiments were also done in our ME-488 class to validate design choices and feasibility.
These experiments included a slope lab, temperature lab, and lever force lab. A full detailed
description of these experiments and their results are shown in Appendix C.
Discussion: Conclusions
The final product was delivered to the customer for final review. The unloading and loading
procedure was demonstrated to her before the product was released. It was important that she had a
good understanding on how the system worked so that she would be able to easily operate it on her
own. At first, it was hard for her to load and unload the grill, but after a couple of times, she got the
5
hang of it. A Grill Manual was presented to her just in case she may forget a process. The Grill
Manual is shown in full detail in Appendix D. The customer also cooked ribs on the grill before we
released it to make sure all cooking-mode functions worked properly. Final feedback from Patricia
has been overwhelmingly positive. She is very pleased with the ease with which she can load and
unload the grill. She reports that she cannot hear any vibrations from the driver’s seat while
transporting the grill. With regard to cooking, she has expressed that the grill cooks very well.
Specifically, she noted that it is easy to control the temperature of the grill and she can moderate the
coal placement and airflow so that only a portion of the grill is utilized if need be. The optimized
coal bed placement has also reduced the amount of charcoal necessary to cook the ribs as compared
to her old grill which increases profits. She is now selling ribs all over Athens, Ohio with her new
grilling system. She loves the grill so much that she cleans it down after every event in an effort to
keep the appearance as nice as possible. Patricia has also purchased a grill cover to help increase
the expected life. Based on this customer feedback and our own tests, the project has been
considered to be a success.
6
Appendix A
1. The Table for capital expenses.
2. The Table of manufacturing and labor costs.
7
Table 1.0: Capital Expenses for Project
Capital Expenses
Item
Cost
Grill Grates
$56.56
Lift Table
$150.00
Grill Paint
$58.69
Logan Welding $195.69
KCK Company $50.00
Mcmaster
$60.80
Estimated Cost $300.00
Total:
$871.74
Table 2.0: Labor and Purchase Materials Cost for the Project
Operations
Labor Cost Purchased Materials Cost Total Cost
Bumper Assembly
$446.25
$119.00
$565.25
Lift Table Assembly
$337.50
$130.00
$467.50
Grill Base
$219.80
$115.00
$334.80
Grill Lid
$411.00
$75.00
$486.00
Grill Legs
$607.50
$95.00
$702.50
Final Cost:
$2,556.05
8
Appendix B
1. FMEA tables
9
Table 1.0: Transport Mode
Potential Failure Mode: Grill Security (falls off truck, extension falls down)
After
Initial
Action
Evaluation Evaluation
Actions and Comments
Calculate dynamic load during breaking and turning
Severity (SEV)
5
to ensure latch is robust enough.
Probability of
occurrence (OCC)
4
Make latches easily accessible and an essential step in
the storage process.
Detectability (DET)
5
Develop a checklist for the owners manual.
Risk Priority Number
100
Potential Failure Mode: Excessive Vibrations (annoying to customer, causes fatigue failure)
After
Initial
Action
Evaluation Evaluation
Actions and Comments
Include damping material in the contact surfaces of the
Severity (SEV)
2
conveying platform.
Probability of
occurrence (OCC)
5
Same as reducing severity.
Detectability (DET)
3
Same as reducing severity.
Risk Priority Number
30
Potential Failure Mode: Corrosion (yields grill unfunctional before designed life)
After
Initial
Action
Evaluation Evaluation
Actions and Comments
Use corrosion resistant materials and use weather
resistant coatings.
Make parts that will eventually corrode replaceable and
Severity (SEV)
4
develop a proper cleaning procedure.
Probability of
occurrence (OCC)
3
Same as reducing severity.
Detectability (DET)
1
Develop a visual inspection as part of regular
maintenance.
Risk Priority Number
12
10
Table 2.0: Unload - Load Mode
Potential Failure Mode: Lift Mechanism (seizes, joint failure, etc)
After
Initial
Action
Evaluation Evaluation
Actions and Comments
Run FE analysis to validate the strength of
Severity (SEV)
5
the four-bar mechanism under a static load.
Probability of
occurrence (OCC)
3
Specify maintenance schedule and proper use
Detectability (DET)
3
Specify proper operation, visual inspections, and regular
maintenance
Risk Priority Number
45
Potential Failure Mode: Pinch Points / Sharp Edges
After
Initial
Action
Evaluation Evaluation
Actions and Comments
Eliminate as many sharp edges and corners as possible
Severity (SEV)
4
in design
Probability of
occurrence (OCC)
4
Same as reducing severity
Detectability (DET)
1
Paint unavoidable sharp edges or corners yellow
Risk Priority Number
16
Potential Failure Mode: Control Issues (falls off truck, rolls away, leg failure)
After
Initial
Action
Evaluation Evaluation
Actions and Comments
Use of a boxed frame for the grill to increase strength.
Locking casters will be used to prevent the grill from
rolling away.
Make prototype bracket and leg assembly to make sure
Severity (SEV)
4
leg can be inserted easily.
Probability of
occurrence (OCC)
3
Include motion limiting elements in our design (tracks,
stoppers, and brakes)
Detectability (DET)
4
None
Risk Priority Number
48
11
Table 3.0: Cooking Mode
Potential Failure Mode: Falls / Tips (rolls away)
After
Action
Evaluation
Severity (SEV)
Initial
Evaluation
5
Probability of occurrence (OCC)
3
Maximize width of base, make center of gravity as low
as possible, locking casters
Detectability (DET)
5
None
Risk Priority Number
75
Actions and Comments
None
Potential Failure Mode: Burns
After
Action
Evaluation
Severity (SEV)
Initial
Evaluation
3
Probability of occurrence (OCC)
3
Include heat resistant materials for high contact areas
Detectability (DET)
1
Grill thermometer
Risk Priority Number
9
Actions and Comments
None
Potential Failure Mode: Insufficient or Excessive Airflow
After
Action
Initial
Evaluation Evaluation
Severity (SEV)
4
Actions and Comments
None
Probability of occurrence (OCC)
3
Calculate optimal air flow to design the air vents
Detectability (DET)
1
Grill thermometer
Risk Priority Number
12
Potential Failure Mode: Difficult to Maneuver / Wheels Seize
After
Initial
Action
Evaluation Evaluation
Severity (SEV)
3
Actions and Comments
None
Probability of occurrence (OCC)
3
Include four swivel casters and specify maintenance
Detectability (DET)
3
Visual inspections and general maintenace
Risk Priority Number
27
12
Appendix C
1.
2.
3.
4.
5.
6.
7.
ME-451 Verification Study on C-channels (James Harris)
ME-451 Parametric Study on C-channels (James Harris)
ME-451 Verification Study on hinges (Daniel Shapiro)
ME-451 Parametric Study on grill legs (Aaron Shelly)
ME-451 Parametric Study on the bumper (Colton Shoemaker)
ME-451 Parametric Study on grill base (Shad Williams)
ME-488 Final Report
13
James Harris
ME 451 Computer-Aided Design II
Dr. Cotton
Verification Study
3-9-10
Methods
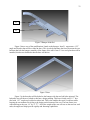
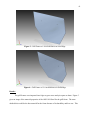
The problem chosen for this verification study includes the analysis of a channel. The C
channel pertains to the OU BBQ Senior Design project and plays a main role in the structural
integrity of the lift system. The C channel will serve as a rail for wheels to ride in, therefore bearing
some of the weight of the grill in the extended position. To imitate this real life application, a Cchannel was constructed in SolidEdge with the dimensions shown in Figure 1. The geometry and
dimensions reflect the material that will be purchased for the project. The 15.25 in length
reproduces the amount of material that will be hanging off the truck, therefore holding the load.
Figure 1 – C- Channel with dimensions
The SolidEdge model was then imported into Algor to perform the finite element analysis of
the channel with one end being completely fixed and the other end having a 100lb load in the
vertical direction as can be seen in Figure 2. ASTM 36 Steel was chosen to also mimic the material
being used in the project.
14
Figure 2- Loads and constraints placed on C-channel
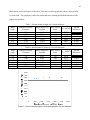
After the loads and constraints were applied, the analysis was performed using solid
elements with mesh sizes ranging from 0.125-.04 inches. The value of .04 inches was chosen
because this value is one third the size of the smallest length in the part which is one eighth of an
inch. As can be seen in Table 1, the von Mises stress maximum reached was 118kpsi. The value
also converged with a percent difference of 2% and exhibited a maximum displacement of .78
inches. To take the verification another step further, plate elements were then modeled using the
same mesh sizes and placed into Table 2. The plate elements also converged at 118kpsi and a
maximum displacement of .79 inches. Although the two methods of meshing began with variations,
the two converged at the same maximum von Mises stress.
15
Data
ASTM 36 Steel
Numbe
Degree
Mesh
r of
s of
Size
Surface
Freedo
(in)
Elemen
m
ts
Table 1
Solid Elements in Algor
Max.
Aspe
ct
Ratio
Displacement(
in)
Memb
er
0.125
4674
13908
1
0.771
fixed
0.1
10123
30192
4.3
0.771
fixed
0.075
19176
57246
1.30
0.78
fixed
0.05
52630
157380
1.36
0.778
fixed
0.04
85568
256032
1.04
0.777
fixed
ASTM 36 Steel
Numbe
Mesh
r of
Size
Surface
(in)
Elemen
ts
112,172.
00
102,783.
00
112,991.
00
115,670.
00
118,187.
00
Degree
s of
Freedo
m
Max.
Aspe
ct
Ratio
Displacement(
in)
Percent
Difference
9%
9%
2%
2%
Edge Load:100lbs
Memb
er
2091
12444
1.5
0.79
Fixed
0.1
3213
19152
1.61
0.79
fixed
0.075
5712
34104
1.82
0.79
fixed
0.05
12240
73200
2.29
0.79
fixed
114300
2.59
0.79
fixed
19100
σMAX
ALGOR
(PSI)
Table 2
Midplane Plate
Elements
0.125
0.04
Edge Load:100lbs
σMAX
ALGOR
(PSI)
106,745.
00
107,882.
00
109,705.
00
114,415.
00
118,700.
00
Percent
Difference
1%
2%
4%
4%
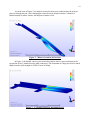
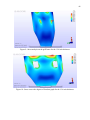
The data taken from the analysis performed can be seen in Figure 3 and Figure 4. The stress
maximum occurred at the point nearest to the fixation of the wall which is where I hypothesized the
max to occur.
16
Figure 3 – C-channel with maximum displacement
Figure 4 – C-channel with von Mises stress maximum
The last step in this verification problem can be concluded with a hand calculation of the Cchannel. After viewing the hand calculations, the stress maximum was chosen to occur near the
point of fixation giving a maximum moment of 1525 in-lb. To achieve the stress maximum, the area
moment of inertia needed to be calculated. After all calculations were completed, a stress maximum
was equated to be 104kpsi. In comparison to the Algor results, the hand calculations leave a percent
17
difference of 18%. The reason for this error may come into account when applying the constraints
in Algor because edge loads were used. All calculations can be seen below for the hand
calculations. From this verification, I was able to tell that the C-channel alone would not be strong
enough for our application and therefore needed to be optimized.
18
James Harris
ME 451 Computer-Aided Design II
Dr. Cotton
Parametric Study
3-9-10
ME 451 – Parametric Study
After dealing with issues of complexity with early designs of the fork assembly in our lifting
process, a redesign needed to be incorporated. The group decided that C-channel needed to be used
for our application. After modeling the C-channel in SolidEdge and importing the model into Algor,
I found that the C-channel wasn’t near strong enough by itself. Therefore I needed to optimize the
fork system to withstand the weight of the grill while keeping the C-channel geometry. To do so,
several designs were modeled in SolidEdge and each was imported into Algor. The models were
then tested to withstand a distributed load and if the max stress was higher than the yield point than
another design was needed. The variables that changed in the process were the height and width of a
brace that was placed under the C-channel.
To imitate the forces and constraints in real life, some analysis plates were added to the
original C-channel assembly. By adding these, I was able to constrain the first 17.25 inches of the
bracket in the Z direction because the cart’s tabletop would be in contact with this surface. The
brackets will be welded to the C-channel and then the whole assembly will then be bolted to the
table. I changed the contact between the brackets and the C-channel to welded instead of bonded.
The bolt holes were fixed in all directions to reproduce the bolts being inserted. A distributed load
of 100 pounds was then put on the other analysis plate that would overhang the table. All of these
constraints can be seen in Figure 1.
Figure 1 – Loads and constraints on C-channel
19
As can be seen in Figure 2, the analysis seemed to show poor results because the analysis
plate ran through the part. After changing the contact between the plate and the C-channel to
bonded instead of surface contact, the analysis seemed to work.
Figure 2 – Misuse of contacts in first trial
In Figure 3, the bonded contact was used and the analysis shows a stress maximum at the
top portion of the C-channel near the table connection. This maximum of 63kpsi proved to be much
higher than the yield strength of ASTM 36 steel at 36kpsi.
Figure 3 – C-channel with stress maximum shown
20
The next step in the process of optimization was to insert a sort of rib to the bottom of the Cchannel that overhung off the table cart. The thickness of this rib was chosen to be 1/8” because this
would be extra steel off of our excess used for the grill. The rib would be welded along the bottom
to add stability. The height of the rib was chosen to be ½”. As Figure 4 shows, the stress maximum
was now at the bottom of the rib where it would be in contact with the table. This means the force
has become compressive on the bottom instead of in tension on the top of the C-channel. The stress
maximum lowered to 37kpsi yet this was still not strong enough to hold the weight being placed on
the C-channel.
Figure 4 – C-channel with rib stress analysis maximum
After analyzing the table’s dimensions the maximum height of the rib could only be 1.375
inches. The length of the rib could only extend from the table to the other end of the C-channel were
a bracket was to be mounted for stopper system. In turn, I made the end closest to the table the
maximum height I could use and tapered the steel rib to the other end for aesthetic and safety
reasons. After modeling this in SolidEdge, a stress analysis was run and the results proved to work
out well. The stress maximum had moved to the connection of the C-channel and the rib which
could be reduced even more with a fillet inserted rather than a sharp corner. Figure 5 shows the
stress analysis of this design and proved to be the most optimal design.
21
Figure 5 – Tapered Rib design in stress analysis
After running the first mesh and observing the stress maximum to be 5kpsi, a convergent
study was held to assure that the design was proper. In Table 1, one can see that the stress converges
around 16kpsi which is well below the yield point. Although this may seem over engineered, one
must take into account the misuse of the system by the customer. Someone that simply leans on or
loads the system with more than 200 lbs could be a probable occurrence. Therefore this design will
make the system much safer if this occurs.
ASTM 36 Steel
Distributed load of 100 pounds
Number
Mesh
Degrees
Max.
σMAX
of
Percent
Size
of
Aspect Member ALGOR
Surface
Difference
(in)
Freedom Ratio
(PSI)
Elements
0.5
3344
9680
28.35 triangle 5,334.00
5%
0.4
3895
11251
23.67 triangle 5,080.00
37%
0.3
5505
16004
34.29 triangle 7,408.00
7%
0.2
8870
25710
10.1
triangle 7,921.00
52%
0.1
37702
110003
35.5
triangle 13,451.00
12%
0.08
72686
213146
7.1
triangle
15099
10%
0.06
126281
370495
5.92
triangle 16,766.00
Table 1 – Convergent study of chosen design
In conclusion, the design chosen will be the one that is used for our Senior Design project.
After reanalyzing the system, the manufacturing leaders will be sure to make corners rounded near
the table to reduce the stress concentration that occurs at this point. This design will also be cost
22
effective because other material will not need to be purchased. Although many variables could be
taken into account with this parametric study, the variables changed were ones that could easily be
accomplished with the resources available. A simple rib added to bottom of the C-channel solved
the problem of holding the load that was being applied.
23
Daniel Shapiro
ME 451 Computer-Aided Design II
Dr. Cotton
Verification Study
3-9-10
FE Verification
Introduction:
While finite element analysis is a powerful tool for the modern engineer, it is important to
understand what is being done by the computer so that one can ensure that the conditions that are
set up in your FE program simulate the real world scenario you desire. To this end of verifying the
results of a finite element analysis, I took the opportunity to compare the theoretical results of our
grill's hinge under loading conditions and compare them to the ALGOR results.
The Test Scenario:
The scenario is fairly basic, a simple brass pin is loaded in shear and the stresses experienced by the
pin must be less than the yield point. The hand calculations for this situation may be found bellow
in portable document format. The manufacturer of this hinge rates the system for 300 lbs, so in
order to ensure that this a valid rating the simulation was run at the rated maximum load.
Simulation Conditions:
In order to simulate the loading conditions for the finite element analysis one half of the pin was
modeled in Solid Edge. After the pin was imported into ALGOR the part was run at a 100%
automatic sized mesh so that the materials and loading conditions could be set.
The following conditions were set for the pin and can be seen in Figure 1:
•
•
•
Along the plane where the pin was cut in half Z axis symmetry conditions were set.
A surface load of 300 lbs was set on one half of the pin's top surface.
On the other side of the pin, a 'pinned' surface boundary condition was placed to emulate the
pin being held still from translation, but not rotation by one of the hinge pin holders.
Figure 1: Setup of Hinge Pin Loading Condition and Constraints
24
Results:
Table 1: Summary of FE Analysis
Table 2: Percent Error Comparison of FEA to Analytic Solution
Figure 2: Results of 50% Automatic Size Mesh
25
Figure 3: Results of 25% Automatic Size Mesh
Figure 4: Graph of Shear Stress Vs Nodes
Conclusion:
From the comparison of the finite element analysis to the results of the theoretical hand calculations
it can be seen that maximum stresses the hinge pin will be exposed to should be around 2.3-2.5 ksi.
26
Aaron Shelly
ME 451 Computer-Aided Design II
Dr. Cotton
Parametric Study
3-9-10
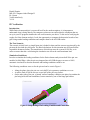
FE Parametric Study
The goal of my parametric study was to determine what size tubing for the grill leg
assembly would be adequate to withstand a worse-case load scenario (experience stresses below the
yield stress) and minimize overall weight. Taking material cost, availability, and manufacturability
into consideration, the tubing sizes were narrowed down to either 2”x3”, 1/8” thick or 2”x2”, 1/8”
thick 6061 aluminum tubing.
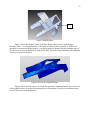
It was decided that the worse-case loading scenario we could reasonably expect our grill to
withstand is a 100 lb horizontal load (depicted in Figure 1 below and includes a 1.5 factor of
safety). This would simulate if the customer pushed the grill into an object and then leaned against
it. In all analyses, the weight of the grill (not including legs) was given a worse-case-scenario
weight of 181.5 lbs which includes a factor of safety of 1.5.
Figure 1: Grill loading Scenario
Since the leg assembly is large in scale, it was important to reduce the model size as much as
possible to maximize the models economy. There is one plane of symmetry that can be used, but
27
even this doesn’t reduce the model size sufficiently. To reduce the model size even more, the left
leg (highlighted in yellow in Figure 1) was focused on.
In order to determine the internal reaction forces in the cutting planes that would be utilized
(represented by points A and B in Figure 2), a static beam analysis was performed in ALGOR. The
constraints and deflected model are shown below in Figure 2.
Figure 2: Beam Analysis of Leg Assembly
28
The shear, axial, and moments at locations A and B were recorded and applied to a cut solidelement model in ALGOR as depicted below in Figure 3.
Figure 3: Meshed Solid Model with Applied Forces and Constraints
The analysis was performed with a 0.250, 0.125, and 0.100 inch absolute mesh size on an
assembly utilizing 2”x3” tubing as well as an assembly utilizing 2”x2” tubing. Due to the method
of attachment of the bracket and leg link, the model was under constrained when all of the surfaces
in contact were analyzed as such. In order to get the analysis to run without any warnings, several
of the surfaces in the leg link had to remain bonded. These artificially bonded surface contacts
created stress artifacts that had to be eliminated. Since the main purpose of the study was to analyze
the integrity of the tubes, the bracket and leg link parts were hidden so that the stresses in the tubes
could be observed. The results of the FE analysis are presented in Table 1 below.
The maximum von Mises stress in the 2”x3” tubing converged to approximately 32,000 psi
and the maximum von Mises stress in the 2”x2” tubing converged to approximately 33,000 psi.
Convergence plots can be seen in Figure 4 and Figure 5. The maximum stress occurred,
29
consistently, in the same location on the vertical leg tube where the leg link catch is welded for both
tube sizes and all meshes. The stress distribution and location can be viewed in Figure 6 below.
Table 1: FEA Results
2x3 inch tubing
Mesh
Size (in)
0.25
0.125
0.1
0.08
Degrees of
Freedom
50,767
116,371
248,989
397,689
Max Aspect
Ratio
21.7
5.2
8.1
9.5
Max
Stress
(Von
Mises)
PSI
16,819
24,680
30,822
31,686
Percent
Difference
--37.9
22.1
2.76
Max
Stress
(Von
Mises)
PSI
17,417
25,586
31,877
32,928
Percent
Difference
--38.0
21.9
3.24
2x2 inch tubing
Mesh
Size (in)
0.25
0.125
0.1
0.08
Degrees of
Freedom
44,218
96,794
204,546
325,975
Max Aspect
Ratio
21.9
12.5
7
7.5
30
Figure 4: 2”x3” Stress Convergence Plot
Figure 5: 2” x 3” Stress Convergence Plot
31
Figure 6: Maximum Stress Location
Conclusion:
Based on the results from this parametric study, it was decided that 2”x2”, 1/8” thick, 6061
aluminum tubing will be the best choice for our design. The 2”x2” tubing experiences stresses that
are negligibly larger than the 2”x3” tubing. Both sizes of tubing come very close to failure under
this load condition. This was a positive outcome considering the loads applied included a 1.5 factor
of safety. This suggests that our design is adequate, yet not over designed. Using 2”x2” tubing
instead of 2”x3” tubing will take approximately three pounds off of our entire leg assembly weight
(from 24.6 lbs to 21.9 lbs). The reduction in leg assembly weight is critical seeing as our customer
will carry the leg pieces from inside her truck to the back of the truck to assemble them.
32
Colton Shoemaker
ME 451 Computer-Aided Design II
Dr. Cotton
Parametric Study
3-9-10
In my group I have been working extensively on modeling all the current hardware on the
truck. I modeled the bumper and all of the brackets that help support the bumper and attach it to the
frame of the truck. As a group we got various dimensions from the bumper of the truck that I would
need to model it as accurately as possible. We assumed that most of the bumper was steel; this
being all of the brackets and members used to support the bumper and attach the bumper to the
frame of the truck. We assumed that top of the bumper was aluminum diamond plate because it did
not provide any real structural support.
My goal is to design a system to attach our hydraulic lift cart to the bumper of our
customer’s truck. I wanted the cart to be bolted to the bumper in some fashion so that it could be
removed whenever needed for repairs or anything else. I had to keep the cart as low and close to the
bumper as possible; if it was raised to high we would be wasting the effectiveness of having a
moveable cart, and creating un-need moments. So my design consists of a ‘base’ that will be
mounted to the bumper, the cart can then be bolted to the base.
This parametric study will focus on designing the ‘base’ and how it will be mounted to the
bumper. The key here is to keep the design simple and effective. I do not want to make this overly
complicated to manufacture, understand, or implement, mainly because most of our time will be
spent manufacturing the grill. I also don’t want to design something that will have a relatively high
factor of safety such as a F.O.S of 5; I don’t see how that would be beneficial either.
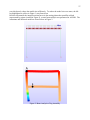
Figure 1 below shows the current bumper arrangement. It would be ideal if I could mount
the cart in the center of the bumper, however we plan to use the bumper to store an existing propane
tank as well. So the cart will have to be mounted on the driver side, while leaving room for the tail
lights to be visible.
Figure 1 Existing Bumper
33
2.1
2.2
Figure 2 Bumper Modified
Figure 2 shows two of the modifications I made to the bumper. Item 2.1 represents a 1.25’’
angle steel bracket that will be welded in place. This is to help distribute the forces between the two
brackets that bolt the bumper assembly to the frame of the truck. Item 2.2 is a steel plate that will be
installed, this has two bolt holes that the base will bolt to.
Figure 3 Base
Figure 3 is the base that will be bolted to the bumper with the two bolt holes pictured. The
hydraulic cart will then we bolted to this base, design pending. This base is built out of 1.5’’ box
steel with 1.25’’ angle steel welded on either end. This is the smallest box steel I could use while
keeping the cart mounted level due to the design on the bottom of the cart. The base frame is as
wide and long as the cart, 14’’ by 27.75’’. All of the weight of the cart will rest on the two box steel
ends, the angle steel helps provide rigidity and fastening capabilities.
34
Figure 4 Original Algor Setup
Figure 4 demonstrates how this was simulated in Algor. The entire model was meshed using
plate elements. I chose plate elements because all thicknesses were .125’’ or smaller, and it would
help increase run time. I could not find a way to cut this model down with symmetry because the
load is not symmetric on the bumper.
I applied a downward force on the box steel equaling 400lbs, this would account for the
100lb cart, 150lb grill plus the weight of our ‘fork’ system used to move the grill away from the
truck and also provide with a slight factor of safety. I then fully fixed the eight bolt holes that are
used to bolt this assembly to the frame of the truck. I also made all of the parts to be ASTM A36
structural steel, which has minimum yield strength of 36,000psi and an ultimate tensile strength
between 58,000 and 80,000psi.
Mesh
Size
(in)
0.5
0.4
0.3
0.2
Degrees
Max.
of
Aspect
Freedom Ratio
51594
76866
132366
303642
4.63
3.97
8.05
14.01
σMAX
Percent
ALGOR
Difference
(PSI)
29,778
36,881
44,045
53,265
21.31%
17.70%
18.95%
Table 1 Bumper One Results
Table 1 shows the results from applying a 400lb load to the base while attached to the
bumper. I ran four different mesh sizes in hopes of showing convergence. However this design
proved to be a little bit unstable with the stress starting out at about 30ksi and increasing to over
50ksi. The stress was mostly concentrated in the bracket that bolts the bumper to the truck. So I
decided to change my design and try to help distribute those stresses to other parts of the bumper.
35
5.1
Figure 5 Modified Base
Figure 5 shows the changes I made to the base being effectively used in the bumper
assembly. Item 5.1 is a triangular bracket I designed to bolt to the base assembly. It will have an
interference interaction with the bumper; it can push against the bumper helping distribute some of
the stresses seen from the 400lb force acting on the base. The same exact constraints and conditions
were used as seen from Figure 4.
Figure 6 Stresses on Original Bumper
Figure 6 shows how the stress is no longer focused on the mounting bracket, but can be seen
in the triangle brackets as well as the bottom portion of the bumper. However the maximum stress
was still seen on the mounting bracket.
36
Mesh
Size
(in)
Degrees
Max.
of
Aspect
Freedom Ratio
0.5
0.4
0.3
0.2
62202
61.04
Error Out
151974
25.15
338742
14.04
σMAX
Percent
ALGOR
Difference
(PSI)
20,314
20,314
33,429
28,482
0.00%
48.81%
15.98%
Table 2 Bumper Two Results
We can see that from Table 2, the triangular brackets helped significantly in spreading and
reducing the stress seen in the bumper assembly. However the results increase and decrease over the
course of the four meshes, with the 0.4 inch mesh not completing due to an error. The triangular
brackets seemed to be the solution to the problem, but this would decrease from the simplicity I was
hoping to achieve. The bumper in real life has two curves not pictured, so the triangle brackets
would need to be manufactured with the same curvature.
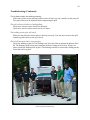
The plan was to move forward with the design in Figure 5, by coming up with some sort of
bracket to help distribute the stress. On March 3, 2010 Aaron, Colin, and myself went out to
Patricia’s to do some repairs to her existing bumper and so I could get more accurate measurements
to construct the brackets I needed. We discovered that the entire bumper assembly seen in Figure 1
is actually aluminum. This was a huge red flag for us because my design required us to weld a new
bracket to the bumper; we also needed to fix many existing welds that had been broken. Her
existing bumper was in such bad shape, and it is very hard to weld and repair aluminum that we
decided to scrap her bumper and design a new one.
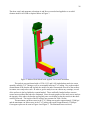
Figure 7 New Bumper
Figure 7 is the current design we are thinking of using for her bumper. By designing a new
bumper I am able to mount the cart in a better spot. Here I can mount the cart between the two cchannel supports that will bolt to the frame of the vehicle. I can also do away with the base
assembly that I had to create to affix the cart to the bumper.
37
Figure 8 New Algor Setup
As seen in Figure 8, the weight of the cart will now be resting directly above one c-channel
bracket and on a piece of angle steel. All of the members in Figure 8 will be made out of steel, and
there will now be sixteen bolts holding this to the frame of the truck instead of eight.
Figure 9 Stresses on New Bumper
38
Figure 9 shows how the new bumper reacts under the same 400lb load. The stresses are
distributed between the two mounting brackets which is good. The maximum stress is still over the
yield strength of steel, reaching as high as 49ksi as seen in Table 3 below. The maximum stress is
focused on the inside corner of the angle steel, seen in Figure 9, which is acting as a stress
concentration factor. This particular corner is the result of cutting part of the angle steel so that it
will fit together correctly to be welded in place.
Mesh
Size
(in)
0.5
0.4
0.3
0.2
Degrees
Max.
of
Aspect
Freedom Ratio
18216
25008
36834
96786
7.6
9.9
7.80
5.3
σMAX
Percent
ALGOR
Difference
(PSI)
36,423
32,999
42,944
49,108
9.86%
26.19%
13.39%
Table 3 New Bumper Results
This study has shown me the importance of being able to spread the stress out among other
members so as to not concentrate it all in one place. An effective way to do this is with various
types of brackets. Since the discovery of her current bumper I have not had much time to redesign
the cart attachment, which will look very similar to Figure 9. I also plan on putting a rounded
surface in the cut corner of the angle steel to help reduce the stress concentration factor.
39
Shad Williams
ME 451 Computer-Aided Design II
Dr. Cotton
Parametric Study
3-9-10
Parametric Study
Introduction:
The purpose of the study is to minimize the weight of the design grill by applying a 100 lb
force to its handle and to confirm its durability. The results from the study will help minimize cost
for the project. Figure 1 shows a Solid Edge image of the complete grill. Steel is the best material
for the grill because its withstanding of hot temperatures, easy maintenance, and durability. The
study should confirm what thickness would be best for the grill.
Figure 1: Image of the Design Grill in Solid Edge
Methods:
A model of the grill base was designed first in Solid Edge using the new Synchronous
Technology. Figure 2 shows the full assembly of the grill base in Solid Edge. The only side that
40
would need to be analyzed is the side with the handle, therefore other material on the grill base can
be negated out. There will not be any stress in any location of the grill base except for the side with
the handle. To cut time with the FEA, the rest of the material can be removed as shown in Figure 3
and 4. Figure 3 shows the grill frame at a thickness of 1/8 inch, which is going to be used for the
first analysis study. Figure 4 shows the grill frame at a thickness of 1/16 inch, which is going to be
the second analysis study. After the two FEA’s are completed, the thickness that is best for the
project can be determined. An engineering draft was done for each frame to see the dimensions
located at the end of the report. It was easy to modify the part in Solid Edge when needed.
Symmetry could have been applied to the grill frame, however it would be better to see where the
stress was acting on the whole frame, due to the customer pushing or pulling on that side. The grill
frame was then imported into Algor to get a stress analysis. A mesh of 0.5 inch was the starting
mesh for the grill frame. It was meshed down until the stress started converging.
Figure 2: Grill Base in Solid Edge
41
Figure 3: Grill Frame at 1/8 inch thickness in Solid Edge
Figure 4: Grill Frame at 1/16 inch thickness in Solid Edge
Results:
The grill frames were imported into Algor to get a stress analysis report on them. Figure 5
gives an image of the material properties of the AISI 1018 Steel for the grill frame. The team
decided this would be the best material for the frame because of its durability and low cost. This
42
decision was made after looking over the NSF standards for cooking equipment. Table 1 and 2
show more properties for the grill frame at 1/8 and 1/16 inch thickness including the weight,
volume, center of gravity, and mass moment of inertia.
Table 1: Material properties for AISI 1005 Steel found in Algor
Material Properties
Material Specified
AISI 1018 Steel, cold drawn
Modulus of Elasticity (lbf/in2)
29,733,000
Poisson's Ratio
0.29
Table 2: Weight Properties found in Algor for 1/8 and 1/16 inch thickness for Grill Frame
Weight
1/8 Thickness
7.06 lbf
1/16 Thickness
3.39 lbf
Figures 5 and 6 show where the constraints were placed on the grill frame. The top, sides,
and bottom of the grill frame were fully constrained due to the angle iron that will be welded to the
sides. The grill frame will not be able to move in any direction. The 100 lb force was distributed
equally between the two holes where the handle will be bolted by selecting vertices around the
holes.
43
Figure 5: Grill Frame of 1/8 inch constrained in Algor
Figure 6: Grill Frame of 1/16 inch constrained in Algor
The frame was analyzed until the von Mises stress converged in the test for both
thicknesses. The results for each mesh of 1/8 and 1/16 inch thickness are shown in Table 3 and 4.
You can see it starts to converge at the 0.2 inch mesh because the percent difference was 0.15 % for
1/8 inch thickness and 0.23 % for 1/16 inch thickness. Figure 7 and 8 show a graph of the von
44
Mises Stress verses the degrees of freedom. You can see on the graph that it does converge at the
0.2 inch mesh. The graph just verifies the results and tests, meaning that both thicknesses would
support the grill base.
Table 3: Results found in Algor for 1/8 inch thickness
Mesh
(inch)
Number of Surface
Elements
Model Degrees of
Freedom
Max. Aspect
Ratio
σmax (lbf/in2)
0.5
0.4
0.35
0.3
0.25
0.2
754
1108
1498
1963
2782
4365
4302
6360
8646
11358
16164
25428
1.55
1.44
1.45
1.49
1.39
1.36
3825
3907
3985
4008
4025
4031
Percent
Difference
2.12%
1.98%
0.58%
0.42%
0.15%
Table 4: Results found in Algor for 1/16 inch thickness
Mesh
(inch)
Number of Surface
Elements
Model Degrees of
Freedom
Max. Aspect
Ratio
σmax (lbf/in2)
0.5
0.4
0.35
0.3
0.25
0.2
754
1108
1498
1963
2782
4365
4302
6360
8646
11358
16164
25428
1.50
1.44
1.45
1.49
1.41
1.36
16620
16957
17285
17382
17456
17496
Figure 7: Stress verses the degrees of freedom graph for 1/8 inch thickness
Percent
Difference
2.01%
1.92%
0.56%
0.42%
0.23%
45
Figure 8: Stress verses the degrees of freedom graph for 1/16 inch thickness
Figure 9 shows the stresses that were acting on the grill frame. As seen in the figure, the
maximum stresses were presented around the holes. Those forces were not correct at all so the
elements around the holes were hidden to get more precise results. Figure 10 shows the stresses
presented at the top of the frame, which was the assumption. Figure 11 shows bracket at a
displacement of 50 %.
46
Figure 9: Stress analysis on the grill frame for the 1/16 inch thickness
Figure 10: Stress verses the degrees of freedom graph for the 1/16 inch thickness
47
Figure 11: Displaced at 50 % in Algor for the 1/16 inch thickness
Conclusion:
After viewing the results, it was determined that either thickness would work for the grill
base. Shown in Table 3 and 4, the grill frames for 1/8 and 1/16 inch did not exceed expectation of
351,283 psi, which is the yield strength for AISI 1018 Steel. The maximum stress for my bracket
was 17496 psi. From these results, it can be concluded that the team can order and use a 1/16 inch
thick grill base. By using the 1/16 inch thick grill base instead of the 1/8 inch, will cut much cost
for the project.
TEAM 4 - OU BBQ
ME 488 Experimental
Procedures & Results
Winter Quarter 2010
Colin Harris, Daniel Shapiro, Aaron Shelly, Colton Shoemaker, and Shad Williams
3/17/2010
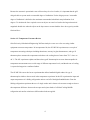
Three experiments were conducted to assist in the design of a portable grill system for Patricia Thomas.
An experiment to observe the rate of cooling of a grill under operating conditions was used to determine
the amount of time required to lower a charcoal grill’s temperature from operating temperatures to a level
low enough for safe handling without the use of protective gloves. The experiment was performed using a
similar charcoal grill, type k thermocouples, and a digital handheld reader. Another experiment was
conducted to determine the optimal lever arm length for use on a hydraulic lift cart under load. A total of
21 different scenarios were tested to observe the performance of the lift cart under different loads with
three different lever arm lengths using a force transducer and an automated data collection system. The
final experiment for the grill design was a test to determine the force required for a four caster system of
the design's intended weight to be moved up various inclinations. From the temperature experiment it was
determined that under the conditions tested it would require at least 143 minutes for a charcoal grill to
reach a temperature less than 120 F. Based upon the observations in the lever arm experiment an optimal
length was determined to be in the 18 24 inch range, providing a compromise between required force and
stroke length, while requiring a maximum of only 26.61 pounds force to operate the lift. Finally, the slope
experiment verified that grill's user should be able to move the grill at an incline of 8.63 with a pushing
force of only 25.76 pounds.
Contents
Section 1: Introduction .................................................................................................................................. 2 Section 1.1 Overview .................................................................................................................................... 2 Section 1.2: Temperature Literature Review ................................................................................................ 4 Section 1.3: Lever and Slope Force Literature Review ................................................................................ 5 Section 2: Experimental Apparatus and Procedure ....................................................................................... 5 Section 2.1 Grill Temperature Apparatus and Procedure ......................................................................... 5 Section 2.2 Lever Force Experimental Apparatus and Procedure: ........................................................... 8 Section 2.3 Slope Lab Experimental Procedure and Apparatus: ............................................................ 12 Section 3: Experimental Results and Discussion ........................................................................................ 14 Section 3.1: Temperature Experimental Results and Discussion ............................................................ 14 Section 3.3: Slope Force Experimental Results and Discussion ............................................................. 16 Section 4: Conclusions ................................................................................................................................ 17 Section 4.1: Temperature Experiment Conclusion ................................................................................. 17 Section 4.2: Lever Force Experiment Conclusion .................................................................................. 18 Section 4.3: Slope Force Experiment Conclusion................................................................................... 18 Appendix A: Hand Calculations ................................................................................................................. 20
Appendix B: Contributions ......................................................................................................................... 21
Appendix C: Matlab Programs ................................................................................................................... 23
Appendix D: References ............................................................................................................................. 25
1
Section 1: Introduction
Section 1.1 Overview
The experiments discussed in this report all relate to the Ohio University Russ College of Engineering
and Technology's mechanical engineering senior design project for Team OU BBQ. Team OU BBQ is
working to design and manufacture a truck mounted, mobile grill system for one Patricia Thomas. The
grill system will need to be easily unloaded and moveable on and off the customer's mobile vending truck
and be safe to handle in a timeframe typical to the customer's normal operations.
The experiments discussed herein were designed and performed to ensure that the customer's needs were
satisfied. The customer's situation required that the grill system be operable by a single individual, have a
larger cooking capacity than the user's current setup, and that the system would not require an undue
amount of force to run during any of its operation modes.
All three of the experiments performed were designed to verify that individual components of the
proposed design will be able to operate in the desired ranges. The first experiment will provide a
representative range for the time required to lower a charcoal grill’s temperature from operating
temperatures to a level low enough for safe handling without the use of protective gloves. The second
experiment will allow for the optimization of the lever arm length to be used on the proposed lift
mechanism and show if the force required is in an acceptable range for an individual to exert. The final
experiment will be used to determine if the system will be able to be moved around by a single individual
under different inclinations.
In an ideal system, the behavior of the rate of cooling could be predicted exactly using Newton's law of
cooling. Newton's Law of Cooling states that the rate of change of the temperature of an object is
proportional to the difference between its own temperature and the ambient temperature. [4] Based on the
assertion made by Newton's law, Equation 1 can be derived.
2
ௗ்
ௗ௧
Where
ௗ்
ௗ௧
ൌ െ݇ሺܶ െ ܶ ሻ
(1.)
is the first order differential of the temperature with respect to time, which represents the time
rate of change of the temperature. K is a cooling constant, T is the temperature at the given time, and T0 is
the initial temperature.
Using this equation, one could accurately predict the rate at which an object would lose its thermal energy
to the environment, assuming no other variables like wind or changing ambient temperatures came in to
play.
One of the largest features of the grill lift system is the manually actuated hydraulic lift table that raises
the grill on and off customer's vehicle. Since the large portion of the hydraulic lift system was sourced
from off the shelf components one of the few remaining variables left to design is the length of the lever
arm used to operate the hydraulic cylinder.
A lever is one of the most basic simple machines. The operation of a lever arm is generally defined with
the relationship shown in Equation 2.
ܨଵ ܦଵ ൌ ܨଶ ܦଶ
(2.)
Where is F1 the force on one side of the fulcrum, D1 is the distance of the load from the fulcrum, and F2,
and D2 are the same respective quantities for the other side lever.
Since there is no machine that can increase both the magnitude and the distance of a force, when a
machine produces an increase in output force, there is always a proportional decrease in the distance
moved. In the case of the desired system's lever arm, the distance the arm must travel will increase as the
required user input force decreases.
3
Because the customer's operational venue will not always be a level surface, it is important that the grill
design be able to operate under a reasonable degree of inclination. For the design process a 'reasonable
degree of inclination' is defined as the maximum recommended wheelchair ramp inclination of six
degrees. To calculate the force required to move an object on a non-level surface the largest theoretical
magnitude should arise when the object on the slope must overcome both the force due to gravity and the
frictional force.
Section 1.2: Temperature Literature Review
Ohio University's Mechanical Engineering 388 Data Analysis course uses a few tests using similar
equipment to measure temperature. In its temperature lab, the OU ME 388 experiment uses a couple of
temperature measuring techniques including thermistors, mercury-in-glass thermometers, and type K
thermocouples to measure the temperature and observe the cooling down of water from 75°C down to
40 °C. The OU experiment explains and shows that type K thermocouples are more than acceptable for
temperature measurement across a wide range of different temperature levels, and that the rate of cooling
is expected to happen in a nonlinear fashion.
The OU ME 388 course also has an experiment that utilizes handheld digital readers for type k
thermocouples similar to the one used in the temperature experiment. In the OU experiment the input and
output temperatures of a Stirling refrigeration unit are read off of the digital handheld units. From the
Stirling refrigeration experiment the use of a single reader unit is shown to be accurate enough to observe
the temperature difference between the acceptor and rejector heads of a Global Cooling M100B
refrigeration unit and its variations as different heat loads are applied.
4
Section 1.3: Lever and Slope Force Literature Review
As both the lever and slope experiments deal primarily with the recording of forces required to move or
operate an object under different loads, their testing is done in a similar fashion. Ohio University's
Mechanical Engineering 388 Data Analysis course runs a wind tunnel experiment where the amount of
lift and drag force generated from a NACA airfoil is measured versus the angle of attack in an airstream.
In the experiment a similar, although smaller, force transducer is used to read the airfoil force as the angle
of attack is varied. The procedure calls for the calibration of the load cell before testing to ensure precise
results.
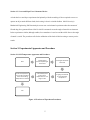
Section 2: Experimental Apparatus and Procedure
Section 2.1 Grill Temperature Apparatus and Procedure
Start
1. Attach type K thermocouples to grill base and lid
2. Load grill with 10 lbs of charcoal
5. Record temperature in 5 minute increments until a safe handling temperature is reached
4. Periodically check grill to ensure temperature has not begun to fall
3. Light grill and allow to reach operating temperature
End
Figure 1: Flowchart of Experiment Procedures
5
For the measurement of the cooling rate of a charcoal grill under real world conditions a basic
measurement and testing setup was used. The equipment used in the experiment was a large steel
construction charcoal grill of similar size range to the proposed grill design, two type k thermocouples, a
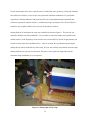
handheld Fluke digital thermocouple reading unit, ten pounds charcoal, and high temperature duct tape.
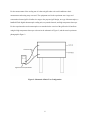
For the experiment the two thermocouples were attached to the exterior of the grill on the lid and base
using the high temperature duct tape as shown in the schematic of Figure 2, and the actual experiment
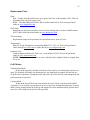
photograph in Figure 3.
Figure 2: Schematic of Basic Test Configuration
6
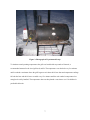
Figure 3: Photograph of Experimental Setup
To simulate actual operating temperatures the grill was loaded with ten pounds of charcoal, a
recommended amount for the sized grill used, and lit. The temperature was checked every few minutes
until it reached a maximum. Once the grill began to cool down the lid was shut and temperature readings
for both the base and the lid were recorded every five minutes until the unit reached a temperature low
enough to be safely handled. The temperature data was then plotted versus time to see if it exhibited a
predictable behavior.
7
Section 2.2 Lever Force Experimental Apparatus and Procedure:
Start
1. Calibrate froce loadcell
2. From the lowered position load the cart to desired weight 5. Pump cart to maximum height
4. Start data aquisition system
3. Attach load cell to 30" lever arm position
6. Repeat steps 2‐6 for 24" and 12" levers 7. Run raw data through MATLAB
Finish
Figure 4: Flowchart of Experiment Procedures
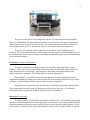
For the measurement of the force required to operate the intended lift mechanism, a series of tests were
conducted using different lever arm lengths and loads. To perform this experiment, a Northern Industries
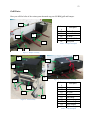
500 pound rated lift cart as seen in Figure 5, a National Instruments automated data collection system and
computer software, different lever arms at lengths of 18, 24, and 36 inches, an Omega LC101-25 load
cell/force transducer, and a container that can hold at least 27 gallons of water are required. An image of
the test setup can be seen in Figure 6. For this experiment, the loads tested were zero, 50, 100, 150, 200,
and 250 pounds. The weights used were various volumes of water held in an empty beverage cooler.
8
Figuree 5: Northern
n Industries 500lb
5
Lift Caart
F
Figure
6: Exxperiment Caart Setup
In order too verify that the
t data colleccted from thee load cell was precise, a caalibration wass performed. Data
was first collected
c
from
m the load celll with no loadd applied. Thhis data was averaged
a
in orrder to producce the
zero offseet voltage. A precisely-knoown weight of
o 6.85 pounds was then appplied to the load cell. Thee zero
offset volttage was subttracted from every
e
value inn the calibratiion weight daata set and theen averaged too
determinee the voltage response
r
of thhe load cell foor a given weight. The zeroo offset voltagge was foundd to be
9
4.117 mV. The load cell’s output of zero mV at zero load and 4.117 mV at 6.85 pounds gave a more
precise load curve than the one supplied with the load cell (Note: due to time and resource restrictions, a
third calibration curve point was not recorded. Ideally, a third point would have been recorded in order to
obtain a more precise load curve).
Using the data collection system and the force transducer, the force required to operate the lift cart at each
of the weights and different lever arm lengths was recorded. In each test the cart was started from a
completely lowered state and raised to the maximum operating height. The number of pumps required to
operate the lift was counted and compared to the number of peeks in the force transducer data.
In order to obtain any useful results from the collected data, a MATLAB program was written to perform
a running average of the data. The load cell voltage output was exported from the data acquisition
software as a text file and then given a .dat file extension. The MATLAB .m file, readData (included in
the appendix, courtesy of John Willis), extracts the numerical data from the .dat file and puts it into a
matrix that can then be used in other MATLAB operations.
After calibrating the load cell, experimental data was recorded and saved as .dat files. The MATLAB
program, forceCalc (included in the appendix), takes the matrix output from the readData program and
performs a running average of the data via a “for” loop. The loop takes a certain number of values, k,
from the data matrix, averages them, and stores the averaged value in a new matrix. The k value can be
varied to average more or fewer values. The more values averaged the smoother the data becomes, but it
also begins to reduce the peak values as seen in Figure 7. If too few values are averaged, noise remains in
the output matrix as seen in Figure 8. The k value was varied to find a point where the data noise was just
eliminated in order to find the closest approximation of the true value (presented in Figure 9). The
averaged output voltages were input to the load correlation curve and a graph of the applied forces was
plotted. In the case of the lever force experiment, this process yielded plots that clearly depict the peak
forces associate with each lever push.
10
Figure 7: Averaged Lever Force Data, k=100
Figure 8: Averaged Lever Force Data, k=10
11
Figure 9: Averaged Lever Force Data, k=25
Section 2.3 Slope Lab Experimental Procedure and Apparatus:
Start
1. Set testing table by placing cart on top with zero degree incline
2. Load cart to 152 pounds
3. Attach load cell to cart
7. Lower cart to end of ramp
6. Stop data aquisition system
5. Pull cart to end of ramp
4. Begin data aquisition system
8. Repeat steps 3 through 7 for next seven ramp height levels
9. Run data through MATLAB
End
Figure 10: Flowchart of Experiment Procedures
12
For the measurement of the force required to move a loaded four caster system up a slope and determine
the coefficient of friction, a series of tests were performed at different inclinations. To perform this
experiment, a Northern Industries 500 pound rated lift cart, a National Instruments automated data
collection system and computer software, a variable slope ramp, an Omega LC101-25 load cell/force
transducer, and weight to load the cart to at least 150 pounds are required.
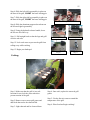
Starting from the 0° inclination, the setup was assembled as shown in Figure 11. The load cell was
attached to both the cart and a pull handle. Care was taken to ensure the handle stayed parallel to the
inclined surface. At the beginning of each trial, the cart was held still for a period of approximately ten
seconds to observe the static equilibrium force. After ten seconds, the experimental operator began
pulling the cart until it reached the top of the ramp. The cart was carefully lowered back down the ramp
and the platform was raised up one increment. The process was repeated for eight trials until the
maximum design inclination (6°) was surpassed.
Figure 11: Photograph of Test Setup
13
The MATLAB code used for the lever force lab was used to refine the data collected during the
experiment. After refining the data, the maximum amount of force required during each test was plotted
versus the angle of inclination. The angle of inclination for the test platform was determined using the
hand calculations found in Appendix A.
Section 3: Experimental Results and Discussion
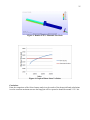
Section 3.1: Temperature Experimental Results and Discussion
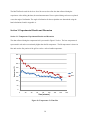
The data collected during the temperature lab is presented in Figure 12 below. The base temperature is
represented in red and was consistently higher than the lid temperature. The lid temperature is shown in
blue and was the first portion of the grill to cool to a safe-to-handle temperature.
400
350
Temperature (°F) 300
250
200
Lid
Base
150
100
50
0
0
20
40
60
80
100
120
Time (minutes)
Figure 12: Temperature Vs Time Plot
14
140
160
Section 3.2: Lever Force Experimental Results and Discussion
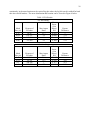
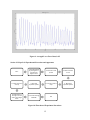
The maximum force required to depress the lever in each of the trials is presented in Table 1 below.
From Equation 2, it was expected that the force required would be greater the shorter the lever arm is and
the data showed this consistently. The linear nature of the force values can be seen in Figure 13. Also in
Figure 13, it can also be observed that the maximum force required for each trial increased in a fairly
linear manner as the load was increased.
Table 1: Summary of Max Force Required to Operate Lift Cart
Weight
0
50
100
150
200
225
18"
24"
36"
Lever
Lever
Lever
Force
Force
Force
8.55
6.13
4.78
11.21
9.18
9.69
15.61
13.75
10.36
18.49
17.81
15.95
21.53
19.5
16.29
26.61
25.78
16.97
30
Max Lever Force (lbs)
25
20
15
18"
Handle
24"
Handle
30"
Handle
10
5
0
0
50
100
150
Cart Load (lbs)
200
Figure 13: Maximum Lever Force Vs Cart Load
15
250
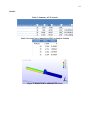
Section 3.3: Slope Force Experimental Results and Discussion
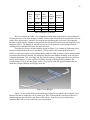
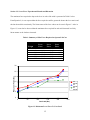
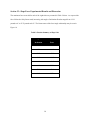
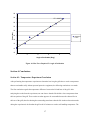
The maximum force recorded for each of the eight trials are presented in Table 2 below. As expected the
force followed a fairly linear trend, increasing with angle of inclination. Results ranged from 12.39
pounds at 0° to 25.76 pounds at 8.63°. The linear nature of the force/angle relationship may be seen in
Figure 14.
Table 2: Results Summary of Slope Lab
Angle of
Maximum
Inclination
Force
0
12.39
1.58
14.43
2.45
17.3
3.95
18.15
4.9
19.5
6.3
22.21
7.33
23.4
8.63
25.76
16
28
26
R² = 0.9874
24
22
Force (lbs)
20
18
Maximum
Force
16
14
12
10
0
2
4
6
Angle of Inclination (Deg.)
8
10
Figure 14: Max Force Required Vs Angle of Inclination
Section 4: Conclusions
Section 4.1: Temperature Experiment Conclusion
After performing the temperature experiment to determine how long the grill takes to reach a temperature
that one can handle safely without personal protective equipment, the following conclusions were made.
The first conclusion regards the temperature difference between the lid and base of the grill. After
analyzing the results from the experiment, one can observe that the lid exhibits a lower temperature than
the base portion of the grill. These results are what appear to be reasonable because the charcoal lies in
the base of the grill, therefore heating the surrounding metal more than the lid. Another observation made
during the experiment is the fact that the grill took 143 minutes to reach a safe handling temperature. The
17
first portion of the grill to reach a safe handling temperature was the lid. An item of concern with this
experiment is that the grill lid was left closed during the cooling process. The experiment was also
performed in an ambient temperature of 33 degrees Fahrenheit. Because this is cooler than the typical
ambient operating temperature (grilling will mostly occur during the summer months), it was decided that
better results could be obtained from this experiment if it were to be conducted in ambient conditions
more representative of the actual operating environment.
Section 4.2: Lever Force Experiment Conclusion
This experiment yielded results which have been used to decide which lever arm is optimal for use in the
intended application. Although the 18 inch lever exhibited the highest force needed to move the table, the
24 inch arm was only a pound less and added an extra four inches of travel. The 30 inch arm showed the
lowest force needed to pump the table cart but required an additional eight inches of travel over the 18
inch handle. Therefore, it has been concluded that the 18 inch lever arm is the proper choice for our
application. At the cart’s highest load the 18 inch handle required a force of approximately 26 pounds to
operate. A study done by NASA in 2008 determined various human performance capabilities. This study
showed that a female can provide a pushing force anywhere from 43 pounds to 94 pounds. This validates
the 18 inch handle as a feasible option for the intended application.
Section 4.3: Slope Force Experiment Conclusion
The purpose of the slope lab was to measure the force required to move our grill at various slopes. The
grill has not been completed, so it was decided to load the lift cart to the projected grill weight, 152
pounds, and then measure the force to pull that cart up various slopes. The slope of the ramp was varied
from 0-8°, recording the force required to hold the cart in place, then the force required to move the cart.
The force required to move the cart is also known as the force required to overcome static friction, and is
the peak force on all of the data. The maximum force required to move the grill is 26 pounds and occurred
at a slope of about 8°. Comparing this to the NASA human performance study, the 26 pounds required to
18
move our cart is well under the maximum pushing force threshold for females of 43 pounds, making the
design acceptable.
19
Appendix A: Hand Calculations
20
Appendix B: Contributions
Colin Harris:
Typed conclusion for Lever Force Lab
Typed conclusion for Temperature Lab
Contacted company to obtain a working cart so the experiment could be performed
Assisted in conducting slope lab experiment and temperature lab experiment
Devoted several hours to figuring out how new load cell worked
Took pictures of labs conducted to use in experiments
Daniel Shapiro:
Wrote abstracts and introduction sections
Assembled, edited, and formatted final report
Assisted in running of temperature and slope labs
Generated schematics for procedure sections
Gave group presentation on experiments to class
Aaron Shelly:
Contacted customer about using her grill for temperature experiment
Acquired type K thermocouples and digital reader for temperature experiment
Acquired material and fabricated the handle for the lever force experiment
Load Cell related work
Learned how to use and setup data acquisition software
Wrote MATLAB programs to refine noisy load cell output signal
Used said MATLAB program to analyze all data for the lever force and incline force experiments
Created all plots for the lever force and incline force experiments
Colton Shoemaker:
Built adjustable platform for slope test
Participated in all three tests
Gathered raw data for lever force and slope test on my laptop
Wrote the original lever force procedure
Wrote the original slope lab conclusion
Used personal truck to pick up customer's grill used for the temperature lab
Took pictures for documentation of all three labs
Performed hand calculation for slope lab
21
Shad Williams:
Wrote the procedure for Incline Force experiment.
Collect results for Temperature experiment.
Produced graphs and tables for Temperature experiment.
Help with Temperature experiment, Force experiment, and Incline Force experiment.
22
Appendix C: MATLAB Programs
readData.m
function [ dataSet, numSamples ] = readData( filename )
%readData This function will take data collected by --- and it will convert
%the string data into a set of doubles that can be used in matlab. The
%input to readData is the string file name. The outputs are an array
%containing the numerical values of the voltages measured and a count of
%the number of samples. Example
%
%
filename = 'TestVoltages.dat';
%
[dataSet, numSamples] = readData(filename);
%
fid = fopen(filename);
%Remove header data
for i = 1:7
fgetl(fid);
end
numSamples = 0;
while ~feof(fid)
val = 0;
temp = double(fgetl(fid)); %Fetch next line in the file
%Determine the power to be using in converting the string to a double
%value
powerof = -(temp(length(temp)) - 48);
%Converting the string retrieved from the file into a double value
val = (temp(length(temp)-3) - 48) * 10^(powerof-7);
val = val + (temp(length(temp)-4) - 48) * 10^(powerof-5);
val = val + (temp(length(temp)-5) - 48) * 10^(powerof-4);
val = val + (temp(length(temp)-6) - 48) * 10^(powerof-3);
val = val + (temp(length(temp)-7) - 48) * 10^(powerof-2);
val = val + (temp(length(temp)-8) - 48) * 10^(powerof-1);
val = val + (temp(length(temp)-10) - 48) * 10^(powerof);
if temp(1) == 45
val = val * -1;
end
dataSet(numSamples + 1) = val;
numSamples = numSamples + 1;
end
fclose(fid);
end
23
forceCalc.m
clear all
format long
filename = '18_225.dat';
[dataSet,numSamples] = readData(filename);
k = 100;
j=1;
%Compensating for offset voltage, averaging, and converting to force (lbs)
B = dataSet - 4.650286302814812; %NOTE: MUST COPY-PASTE Avg value from
zeroFinder
for i = 1:k:numSamples;
G(j) = mean(B(i:i+(k-1)));
j = j+1;
end
R = (6.85/4.117)*(B*1000); %Unaveraged force transformation
F = (6.85/4.117)*(G*1000); %Averaged force transformation
%Plots of raw and averaged force data
% figure(1)
% plot(R)
% title('Raw Force vs. Time')
% xlabel('Time')
% ylabel('Force (lbs)')
figure(1)
plot(F)
title('Averaged Force vs. Time')
xlabel('Time')
ylabel('Force (lbs)')
%
%
%
%
%
figure(3)
plot(B)
title('Raw Voltage vs. Time')
xlabel('Time')
ylabel('Voltage (V)')
24
Appendix D: References
Bayless, David. "Senior Laboratory." Senior Laboratory Temperature Lab. Russ College of
Engineering and Technology at Ohio University. Web. 16 Mar. 2010.
<http://www.ent.ohiou.edu/~bayless/seniorlab/>.
Bayless, David. "Senior Laboratory Wind Tunnel Lab." Wind Tunnel Lab. Russ College of
Engineering and Technology at Ohio University. Web. 17 Mar. 2010.
<http://www.ent.ohiou.edu/~bayless/seniorlab/>.
Bayless, David. "Stirling Refrigeration Lab." Senior Laboratory Stirling Refrigeration Lab. Russ
College of Engineering and Technology at Ohio University. Web. 17 Mar. 2010.
<http://www.ent.ohiou.edu/~bayless/seniorlab/stirling.html>.
"Burns: First Degree." Penn State Hershey. Penn State Milton S. Hershey Medical Center. Web.
15 Mar. 2010. <http://www.hmc.psu.edu/healthinfo/b/burns1.htm>.
"Friction." HyperPhysics. Ed. Carl R. Nave. Georgia State University. Web. 15 Mar. 2010.
<http://hyperphysics.phy-astr.gsu.edu/hbase/frict2.html>.
"HUMAN PERFORMANCE CAPABILITIES." Man-Systems Integration Standards (MSIS).
Web. 15 Mar. 2010. <http://msis.jsc.nasa.gov/sections/section04.htm#Figure%204.9.35>.
25
"Newton's Law of Cooling." Undergrad Mathematics. The University of British Columbia. Web.
15 Mar. 2010.
<http://www.ugrad.math.ubc.ca/coursedoc/math100/notes/diffeqs/cool.html>.
"Simple Machines." Home | University of Arkansas. Web. 15 Mar. 2010.
<http://www.uark.edu/depts/aeedhp/agscience/simpmach.htm>.
26
49
Appendix D
1. OU BBQ Grill Manual
50
OU BBQ
Grill Manual
51
Table of Contents:
Replacement Parts:................................................................................................................................... 52
Grill Modes: .............................................................................................................................................. 52
Grill Parts: ................................................................................................................................................ 53
Operation................................................................................................................................................... 54
Unloading: ............................................................................................................................................. 54
Cooking: ................................................................................................................................................ 55
Loading:................................................................................................................................................. 56
Maintenance:............................................................................................................................................. 57
Troubleshooting:....................................................................................................................................... 57
52
Replacement Parts:
Paint:
Red – Valspar Satin Interior/Exterior spray paint, Wine Red, model number 65012. This can
be purchased at your local Lowes store.
Black – Char Broil Black Grill Paint, Black, model number 4654. This can be purchased
online at www.thepartsbiz.com.
Grill Grates:
Brinkman gas grill grate porcelain coated cast iron cooking grid set of three. Model number
68553, these can be purchased online at www.thepartsbiz.com.
Tie Down Strap:
Replacement straps can be purchased at any hardware store, such as Lowes.
Thermometer:
BBQ Pro Temp Thermometer item number BBQ-P-T-1-2.25-2.5. This can be purchased
online through www.kck.com or online directly at www.bbqprotemp.com.
Hydraulic Cart:
Northern Industrial Hydraulic Table Cart – item number 143654. This can be purchased
online at www.northerntool.com.
NOTE: The hydraulic cart installed on your vehicle has been modified from its original form
for its use.
Grill Modes:
Transportation Mode:
In this mode the grill is attached to the back of the truck by two locking pins and one tow
strap. The hydraulic lift handle, the aluminum legs, the aluminum leg support, and the rake are
all in their stored positions. During this mode the truck can be driven freely, thus transporting the
grill from point A to point B.
Cooking Mode:
In this mode the grill has been removed from the truck. Please read the section labeled
“Operation” to see step by step instructions on how to get from Transportation Mode to Cooking
Mode. During cooking mode the grill legs and support have been attached and the grill has been
moved to a safe distance from the truck for operation.
53
Grill Parts:
Here you will find a list of the various parts that make up your OU-BBQ grill and bumper.
B3
Reference
#
B1
B2
B3
B4
B5
B5
B4
B3
Description
Lift Handle
Release Pedal
Eye Bolts
Hydraulic Lift Cart
Rail System
Table 1 – Bumper Description
B1
B2
Figure 1 – Bumper Assembly
G9
G1
G3
G2
G5
G2
G4
Figure 3 – Grill and Bumper Assembly
G8
G6
G7
G8
Figure 2 – Grill Assembly
Reference
#
G1
G2
G3
G4
G5
G6
G7
G8
G9
Description
Thermometer
Handle
Air Vents
Ash Door
Grill Wheels
Aluminum Support
Aluminum Legs
Caster Wheels
Tie Down Strap
Table 2 – Grill Description
54
Operation
Unloading:
This section will cover the steps required to unload your OU BBQ grilling system. This is the
transition between Transportation Mode and Cooking Mode. Figure below illustrates the OU
BBQ grilling system in the Transportation Mode.
WARNING
This system was not designed to be operated (cooking) while still on the back of the truck.
You must follow the procedure to transition from Transportation Mode to Cooking Mode.
Figure 4 – Transportation Mode
Step 1: Loosen and remove the tie down strap.
Step 2: Retrieve the hydraulic lift handle from the
stored position, insert handle into cart and pump
cart all of the way up.
Step 3: Remove both locking pins from grill.
Step 4: Using the hydraulic release handle, lower
the lift cart until the grill base is just below the top
of storage box on the left of the grill unit.
Step 1
Step 2
Step 5: Retrieve the aluminum legs and aluminum
support from stored positions. (Not pictured)
Step 3
Step 4
55
Step 6: Slide the left side leg assembly in place on
the base of the grill, INSERT the brass locking pin.
Step 7: Slide the right side leg assembly in place on
the base of the grill, INSERT the brass locking pin.
Step 6 / 7
Step 8: Slide the aluminum support down between
the left and right leg assembly.
Step 9: Using the hydraulic release handle, lower
the lift cart all of the way.
Step 11: Pull straight back so that the legs and grill
clear the red rails.
Step 8
Step 9
Step 10
Step 11
Step 12: Lock each caster to prevent the grill from
rolling away while cooking.
Step 13: Begin your barbeque!
Cooking:
Figure 5 – Cooking Mode
Step 1: Make sure that the grill is in a safe
location for use; lock the caster wheels to
prevent motion of the grill.
Step 2: Remove one or more grill grates and
add fresh charcoal to the charcoal bed.
Step 4: Once safe, replace the removed grill
grates.
Step 5: Use the four air vents to control the
temperature of the grill.
Step 6: Place food and begin cooking!
Step 3: Light charcoal and let charcoal burn.
56
Loading:
This section will cover the steps required to load your OU BBQ grilling system. This is the
transition from Cooking Mode to Transportation Mode.
CAUTION
Be sure the grill is
cool to the touch
before handling.
Figure 6 – Loading the Grill
Step 1: MAKE SURE the grill is
extinguished and cool to the touch for safe
handling of the grill.
Step 2: Unlock the caster wheel, move the
grill toward the rear of the truck.
Step 3: Rotate the grill so that the front of
the grill is facing out away from the rear of
the truck.
Step 4: Make sure that the hydraulic lift cart
is in the down position, and that the red rails
are free and clear of all debris.
Step 5: Position the grill, and then move the
grill so that it is over top of the lift cart. Be
sure that the red rails are below the red
wheels on the grill as seen in
Figure 6 – Loading the Grill.
CAUTION
Step 6: SLOWLY raise the
table top by pumping the lift
handle.
Step 7: Continue to raise the lift cart just
until the grill legs are no longer touching the
ground. Be careful not to raise the grill too
high with the legs attached, they will crash
into the bumper unit.
Step 8: Remove the aluminum support
between the legs and then remove the legs.
Step 9: Push the grill back as far as it will
go. Replace the security/locking pins that
were removed in Step 3 of the Unloading
Procedure.
Step 10: Slowly lower the hydraulic cart by
depressing the release handle. Make sure
that the cart is in the complete lowered
position before proceeding.
Be sure that the tie
down strap rests on
the stainless steel
plates.
Step 11: Replace the tie down strap
and tighten the strap to secure the
grill in place. Do not over tighten the
tie down strap.
Step 12: Clean up and drive safe!
57
Maintenance:
DURING EACH USE
In order to ensure that your OU BBQ grill operates
correctly please follow this maintenance plan.
Be sure to inspect your tie down
strap for any wear and tear. If the
strap appears to be wearing
replace immediately!
During each use:
• Inspect your tie down strap, be certain that the
strap is not frayed or coming apart. Also check
to make sure that the strap stays tightened.
• Inspect the entire assembly, making sure that there is no debris in the linkage for the
hydraulic lift or in the red rails preventing correct motion of the grill unit.
Periodically:
• Inspect all nuts and bolts; please tighten if they appear to be loose.
• Inspect all welds; contact a licensed professional if cracks or damage is present.
• Clean and touch up any rust spots with the appropriate paint.
Cleaning:
• Use mild soap and water to clean the grill and bumper assembly.
• Do NOT use any chemicals such as bleach or any solvents such as rust prevention. These
chemicals can be harmful to the paint and not food safe.
Painting:
• Apply touch up paint in a timely manner to help prevent rust.
For best results• Use medium grit sandpaper and sand away all rust.
• Dampen a dry and clean cloth with some mineral spirits, or paint thinner, wipe sanded
spot clean of all dust and dirt.
• Allow the area time to dry.
• Apply the touch up paint as needed (one to two coats).
Troubleshooting:
The lift cart will not rise when pumping the lift handle.
Check to be sure that the release pedal is not active.
Make sure that there is no debris stuck in the linkage
of the hydraulic cart.
The aluminum support piece for the legs will not fit.
Check to be sure that the aluminum tabs on the legs
are not bent. If so, straighten them back out with a
set of pliers. (See picture to the right)
The ash door will not open and close properly.
Inspect the clasp on the inside of the door.
58
Troubleshooting (Continued):
The tie down strap is not working correctly.
If the strap is stuck on the grill and will not come off, then you can carefully cut the strap off.
The strap will need to be replaced before transporting the grill.
The grill will not roll when in Cooking Mode.
Check to be sure the caster wheels are unlocked.
Check to be sure the caster wheels are free of debris.
The locking/security pins will not fit.
Make sure that the holes for the pins are lined up correctly. You may need to move the grill
around to get the holes to line up correctly.
The lid will not open and or close properly.
Check the flashing on the lid. The flashing is the sheet steel that overhangs the bottom of the
lid. The flashing could be bent preventing the lid from closing all of the way. If bent, use
pliers to bend the flashing back in place. The flashing can also be removed by drilling out the
rivets that hold it in place.
May 8, 2010
Senior Design Demonstration Day