1
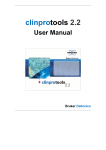
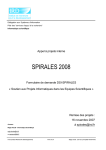
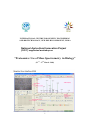
INTERNATIONAL CENTRE FOR GENETIC ENGINEERING AND BIOTECHNOLOGY, NEW DELHI COMPONENT, INDIA National Agricultural Innovation Project (NAIP) supported workshop on “Proteomics: Use of Mass Spectrometry in Biology” (23rd – 27th March 2009) 1 PROTEIN SAMPLE PREPARATION USING 2-D CLEAN-UP KIT (Source: G E Healthcare) 1. Transfer the protein samples into tubes that can be centrifuged at 8000 _ g. Each tube must have a capacity at least 12-fold greater than the volume of the sample. Use only polypropylene, polyallomer, or glass tubes. The wash buffer used later in the procedure is not compatible with many plastics. This limits the choice of centrifuge tube materials. 2. For each volume of sample, add three volumes of precipitant. Mix well by vortexing or inversion. Incubate on ice (4–5 °C) for 15 min. 3. For each original volume of sample, add three volumes of co-precipitant to the mixture of protein and precipitant. Mix by vortexing briefly. 4. Position the tubes in a microcentrifuge with the cap-hinges facing outward. Centrifuge at 8000 _ g for 10 min. Remove the tubes from the microcentrifuge as soon as centrifugation has finished. A pellet should be visible. Proceed rapidly to the next step to avoid resuspension or diffusion of the pellet. 5. Remove as much of the supernatant as possible by decanting or careful pipetting. Do not disturb the pellet. 6. Carefully position the tubes in the microcentrifuge with the cap-hinges and pellets facing outward. Centrifuge the tubes for at least 1 min to bring any remaining liquid to the bottom of the tubes. Use a pipette to remove the remaining supernatant. There should be no visible liquid remaining in the tubes. 7. To each tube, add three-fold to four-fold more co-precipitant than the size of the pellet. 8. Carefully reposition the tubes in the microcentrifuge with the cap-hinges facing outward. Centrifuge for 5 min. Use a pipette to remove the supernatant. 9. Pipette enough distilled or deionized water on top of each pellet to cover the pellet. Vortex each tube for several seconds. The pellets should disperse, but not dissolve in the water. 10. Add 1 ml of wash buffer, pre-chilled for at least 1 h at -20 ºC to each tube. (For an initial sample volume of 0.1–0.3 ml, add 1 ml of wash buffer. However, the volume of wash buffer must be at least 10-fold greater than the distilled/deionized water added in step 9.) Add 5 _l wash additive (use only 5 _l wash additive, regardless of the original sample volume). Vortex until the pellet is fully dispersed. Note: The protein pellet will not dissolve in the wash buffer. 2 11. Incubate the tubes at -20 °C for at least 30 min. Vortex for 20–30 s once every 10 min. At this stage, the tubes can be stored at -20 ºC for up to one week with minimal protein degradation or modification. 12. Centrifuge the tubes at 8000 _ g for 10 min. 13. Carefully remove and discard the supernatant. A white pellet should be visible. Allow the pellet to air dry briefly (no more than 5 min). Note: Do not over-dry the pellet. If it becomes too dry, it will be difficult to resuspend. 14. Resuspend each pellet in rehydration solution for first-dimension IEF. The volume of rehydration solution used can be as little as 1/20 of the volume of the original sample. See next section for examples of rehydration solutions and volumes appropriate for different applications. Vortex the tube for 30 s. Incubate at room temperature. Vortex or aspirate and dispense using a pipette to fully dissolve. Note: If the pellet is large or too dry, it may be difficult to resuspend fully. Sonication can speed resuspension. 15. Centrifuge the tubes at 8000 _ g for 10 min to remove any insoluble material and to reduce any foam. The supernatant may be loaded directly onto first-dimension IEF or transferred to another tube and stored at -80 ºC for later analysis 3 TWO DIMENSIONAL GEL ELECTROPHORESIS: (Source: G E Healthcare) SAMPLE PREPARATION: The Protein sample was incubated with Rehydration buffer at room temperature for four hours (minimum). A pinch of Bromophenol blue was added to the rehydrated protein sample and the sample was transferred to the rehydration tray. The IPG linear (or NL) strips were then placed over the protein sample with the gel side facing downwards .The set up was left undisturbed for 20 minutes and then mineral oil was poured over the strip. The strip was left for rehydration for 12- 16 hrs (overnight) at room temperature. The excess oil in the strip was blotted and it was transferred on to a focusing tray (manifold or strip holder). The strip containing the protein was positioned with low pH at the +ve side and high pH at the –ve side and then mineral oil was added. FIRST DIMENSIONAL SEPARATION: For the first-dimensional separation, the IEF (Iso Electric Focussing) was performed according to the manufacturer’s manual with slight modifications. EQUILIBRATION OF THE SAMPLE: Strips were then equilibrated in a buffer containing 50mM Tris-HCl, pH 8.8, 7 M urea, 2M thiourea, 20% glycerol, 2% SDS, 65mM DTT for 15-20 mins with constant shaking on a shaker, followed by an additional 15-20 mins incubation using a fresh equilibration buffer supplemented with 135mM iodoacetamide instead of DTT. SECOND DIMENSIONAL SEPARATION: The second-dimensional separations were carried out on 12% SDS polyacrylamide gels according to the procedure previously reported by Laemmli .The gel was then stained with Coomassie Brilliant Blue R-250 for two hours (minimum) and destained with destaining solution(Methanol :acetic acid :water) Rehydration buffer (RB): Urea Thiourea CHAPS Ampholytes Or Pharmolytes - 7M 2M (if required) 4% 0.2- 0.5% Aliquotes of RB without adding DTT can be stored at -20°C 4 Methodology for InGel Digestion (Coomassie Stained) with Trypsin or Chymotrypsin 1. Excision of protein bands from Polyacrylamide gels: i. The detained gel was washed with MQ H2O for 2X 10 mins. ii. The protein bands of interest were cut using sterile scalpel or 100 µl pipette tip and was transferred into a fresh eppendorf (pre rinsed with 100% ACN and air dried). 2. Washing and Equilibration: i. The gel pieces were washed with 100 -500 µl MQ H2O (depending upon the size of gel pieces) for 3 X 5 mins at RT with gentle agitation on vortex mixer (low speed). ii. They were then equilibrated with 100 µl of 100 mM Ammonium bicarbonate (NH4HCO3) buffer for 20 mins at RT with gentle agitation. iii. The NH4HCO3 buffer was then discarded and gel pieces were washed with 1:1 100 mM NH4HCO3 buffer and 100% Acetonitrile (ACN) solution. IV. They were briefly rinsed with 100% ACN solution and were dehydrated with 100% ACN for 20 mins at RT with gentle agitation. The solution was then discarded and the gel pieces were air dried or dried in a SpeedVac. 3. Reduction and Alkylation: (The following step is required for 1D SDS PAGE gel piece and not for 2D SDS PAGE) i. The gel pieces were incubated with Dithiotrietol (DTT). (10 mM DTT prepared in100 mM NH4HCO3 solution) at 56 o C for 45 mins for reduction. The sample was then cooled to room temperature and the DTT solution was removed. ii. The sample was then alkylated by treating with Iodoacetamide (IAA) (50 mM IAA in 100 mM NH4HCO3 solution) in the dark at RT for 30 mins. iii. They were washed with 100µl of 1:1 100 mM NH4HCO3 buffer and 100% Acetonitrile (ACN) solution for 15 mins. iv. They were then rinsed briefly with 100µl of 100% Acetonitrile and were dehydrated for 20 mins at RT with 100% ACN and the solution was discarded and the gel pieces were air dried or dried in a SpeedVac 4. In gel Digestion: Trypsin or Chymotrypsin enzyme solution prepared in 50 mM NH4HCO3 was added to the gel pieces and they were rehydrated for 60 mins at 4 o C and following rehydration 30-50 µl of 25 mM NH4HCO3 buffer was added (if required) and incubated for 16 to 18 hrs at 37 o C. NOTE: The gel pieces should completely remain immersed in the buffer during incubation period. Enzyme concentration and activity depends upon the specification of the enzyme. Enzyme specification can be obtained from the manufacturer’ manual. Enzyme specifications: a. Source of enzyme, b. Optimum temp, pH for enzyme activity, 5 c. d. e. f. Conc of CaCl2 in buffer (if required), TPCK treated, Enzyme specificity (low or high) Enzyme grade (Sequencing grade) etc. Trypsin (SIGMA) – 20ng/ µl 6 7 Nano-LC-MALDI-TOF/ TOF Setup 8 9 Sample Preparation for MALDI-TOF Samples for MALDI-TOF analysis need to meet certain requirements for obtaining good spectra. The more careful you prepare samples (including early steps of isolation and preparation) the more likely a successful analysis will be. Here are some guidelines of which kind of treatment is advantageous for mass spectrometric analysis and which is not: Avoid the use of non-volatile agents like salts (NaCl, CaCl2, KH2PO4), detergents (Tween, Triton, SDS), chaotropic agents (Urea, Guanidinium salts) and non-volatile solvents like DMSO, DMF, or Glycerol. If you can’t avoid these agents, purify. Dialysis, ZipTips, and RP-HPLC are good purification methods if you use volatile solvents and buffers (e.g. 0.1% v/v trifluoracetic acid, 10 mM NH4HCO3). After purification, lyophilize if possible. Ion exchange beads may work well for salt removal. Suitable solvents are ones that are volatile. For sample work up and purification: water, ammonium hydrocarbonate, ammonium acetate, ammonium formiate, acetonitrile, trifluoroacetic acid. Quantitate the sample you are going to provide for analysis by methods like: photometry (e.g. OD, Bradford assay), and ELISA. HPLC is useful since it allows for purification and quantitation in a single procedure. The range for many samples/preparations is not very large, therefore it is necessary to have a good estimate of the sample amount because the sample amount may need to be varied on the target. The total amount of sample needed for MALDI analysis depends on the sample type. For small mw peptides (1,000 or less) the minimum amount needed for analysis is 16 picomoles/microliter. The minimum for mw 20,000 or less is 60 picomoles/microliter. For 66,000 mw, the minimum amount needed for analysis is 160 picomoles/microliter. Therefore, the larger the molecular weight the more sample is needed. Give information like: structure, sequence, molecular weight, type of compound, biological activity, chemical reactivity, pH, sample amount/concentration, describe purification/isolation with focus on relative agents/solvents, known or suspected impurities, suitable solvents, hazardous properties: radioactivity, carcinogenicity, poison, or explosive. 10 Sample Preparation Aims of the sample preparation The ideal sample preparation in MALDI would be a homogenous layer of small matrix crystals containing a solid solution of the analyte. To obtain the best result, there is a choice of different matrices as well as preparation techniques. Both choices depend on the nature of the analyte. One aim is to obtain as homogenous preparation of the matrix, both in terms of sample distribution and in term of the sample geometry. The following picture illustrates the effects of a matrix preparation with small homogenous crystals compared to a preparation containing crystals of different sizes: In the first case two ions are compared which are formed at the positions A and B in the preparation. The electrical field that is seen by the ions decreases from the target to the extraction lens. A Ion that is formed at an position above the target surface experiences a smaller field than in ion formed directly at the surface. A shift of the apparent mass in the mass spectrum is observed between the two ions. If the matrix preparation gets more inhomogeneous, as shown in the second picture, these mass shift increase, the resolution decreases and the assignment of the true mass becomes more difficult (and requires to sum up a lot more spectra to compensate for that statistical error). Selection of the Matrix For proteins and peptides, the most commonly used matrices are α-Cyano-4hydroxycinnamic acid (“α-Cyano; HCCA, CCA”), Sinapinic acid and Dihydroxy-benzoic acid (DHB). All Matrices have different pros and cons. The matrix substances should be of highest purity. Please note that the matrix substances that are obtainable from common suppliers are usually not pure enough to give the best possible result in MALDI-MS. HCCA should be pale yellow crystals, Sinapinic acid should be almost white and DHB white crystals. Matrix substances especially purified for MALDI are obtainable from BRUKER. 11 α-Cyano-4-Hydroxycinnamic acid: This Matrix is commonly used for peptides in the lower mass range. This matrix is not soluble in water and well soluble in organic solvents. It is considered a “hard” matrix, which means the analyte molecules get a lot of internal energy during desorption and ionisation. This leads to a considerable amount of ion fragmentation in the drift tube (post source decay). If peptides of small molecular weight are measured and the laser power is chosen only slightly above the threshold, this is not a problem. If the analyte molecules become bigger, however, the probability of the fragmentation increases until almost all of the analyte ions undergo fragmentation. Therefore α-Cyano is the matrix of choice for PSD-analysis. The main advantage of α-Cyano in the measurement of peptides is the ability of this matrix to form small homogenous crystals. Since geometric inhomogeniety relates directly to decreased resolution in the MALDI-analysis, α-Cyano preparations usually yield good resolution. Since HCCA is insoluble in Water, the samples can be washed on the target. Sinapinic Acid: Sinapinic Acid is most commonly used in the analysis of high mass proteins. It is also not soluble in water but well soluble in organic solvents. Compared to α-Cyano it is a “softer” matrix. The analyte Ions get less internal energy and the amount of fragmentation is smaller, making this matrix more suitable for measurement of proteins. Sinapinic Acid also can form small crystals. However, Sinapinic Acid tends to form adducts with the analyte ions. These adducts can be resolved in the mass spectrum for proteins up to 40 kD. DHB: This is the Matrix of choice for the preparation of glycoproteins and glycans. It is also often times used for Peptides. Unlike α-Cyano and Sinapinic Acid it is soluble in water as well as organic solvents. The main disadvantage of DHB ist the fact that it forms big crystal needles. This means that the geometry of the sample changes from spot to spot on a preparation. If spectra are summed up from different spots on the sample preparation, the resolution is considerably lower than spectra obtained from an α-Cyano preparation. On a steel target, DHB preparations will form a crystalline ring. Good peptide spectra are usually only obtainable from the rim of that preparation. The main advantage of DHB for MALDI of peptides is the fact that this matrix is more tolerant towards contaminations such as salts and/or detergents than other matrices. Typical preparation of DHB. A rim of large crystals is formed. best peptide spectra are usually obtained at the rim 12 Preparing the sample on the target Like the choice of the matrix substance, there is also a choice of how to actually prepare the sample. The advantages and disadvantages are discussed in the following section. The methods discussed here apply for conventional targets. Anchor-targets have to be prepared using specialized anchor-chip protocols. Please refer to the anchor chip manual for those protocols. General remarks: The chemicals should be of highest available purity. Saturated matrix solutions should be prepared freshly by sonication. It is important to spin down the remaining undissolved matrix in a centrifuge. The supernatant should be aspirated carefully to avoid aspiration of crystals. Dried droplet method: Typically, a saturated matrix solution is prepared. Unless otherwise noted, the solvent used is TA ( 33% Acetonitrile, 0.1% TFA) . This matrix solution is mixed in equal volumes with the sample solution. The sample solution should be acidic, since basic conditions will dissolve the matrix. The mixture is pipeted on the target ( 0.5 to 1 µl) and dried at ambient temperature. The preparation will yield relatively large crystals on the target surface a well as regions without matrix or analyte. The advantages of the dried droplet method are: The method is suitable if the sample contains organic solvents. If a “sweet spot” is found on the preparation, a large number of laser shots can be applied to that spot. If the sample contains contaminants, there is a chance, that analyte and contaminants will crystallize at spatially different regions on the target. The sample can be washed after the crystallization to remove salts. The sample can also be recrystallized after washing. Disadvantages include the need to search for sweet spots and the limited resolution due to the large crystals. Dried droplet preparation of HCCA Thin layer methods: This method is applicable only for HCCA. The matrix is prepared on the target to form a thin layer of very small and homogenous crystals. This is achieved by dissolving the matrix in Acetone. After spotting this solution on the target the acetone spreads on the target and evaporates very fast. The thin matrix layer remains on the surface of the target. The sample is applied on top of this thin layer. After the sample is dried, the analyte molecules remain on top of the matrix. Advantages of the thin layer method are the very homogenous size of the crystals. The methods yields high resolution spectra and the detection limit is increased 13 compared to the dried droplet method. Thin Layer preparations can be washed to remove salts, but compared to the dried droplet method there is a higher possibility to remove also analyte molecules. If the sample is too basic there is also a possibility, that the thin layer is dissolved. Thin layer preparations can be recrystallized, but then all specific advantages of this preparations are lost. One significant disadvantage of thin layer preparations are the very limited number of laser shots that can be applied at one sample position. Usually after 10 to 20 laser shots no spectra can be acquired anymore. This limits especially the usability of thin layer preparation for PSD-Experiments. The Thin –Layer Method can be enhanced by preparing a thin layer containing nitrocellulose. This retains peptides more efficiently in the washing step. The nitrocellulose may yield interfering signals in the lower mass range of a peptide spectrum, especially if a high laser power is used. steel surface thin layer thin layer preparation of HCCA steel surface Double layer method: One way to combine the advantages of dried droplet and thin layer preparation is the double layer method. Here, a thin layer of matrix is prepared as described above, and on top of that thin layer a normal dried droplet. The small crystals in the thin layer act as crystallisation nuclei for the dried droplet. The result is a homogenous preparation, that is well suited for automatic measurements. The number of spectra that can be acquired from one specific spot is higher than in the thin layer method (but not as high as in dried droplet). The preparations can be washed, but recrystallization would convert the preparation into a normal dried droplet thin layer preparation. steel surface thin layer double layer double layer preparation of HCCA 14 Preparation Improvement: Washing and Recrystallisation Washing the preparation During the preparation of the target, it is possible that contaminants and sample crystallise at different positions (spatial separation). Especially salts have usually a higher solubility than analyte molecules and crystallize closer to the surface of the preparation. Preparations of water insoluble matrices can therefore be washed with e.g. 0.1 %TFA. Salts will more readlily dissolve, and improved signal/noise ratios can be obtained. Washing is usually performed by applying 1-5 µl of washing solution (0.1% TFA, Water) on top of the preparation, waiting for a few seconds and removing the droplet (by pipetting, or by filter paper). One should carefully avoid to touch the crystalline surface of the preparation. If loss of sample during washing is a concern (typically with thin layer preparations) the use of chilled washing solution is recommended. Recrystallisation If the sample contains a high amount of salt, the spectra qualitiy can be further improved by recrystallisation of the spot after washing. Recrystallisation is performed by applying a small volume of organic solvent (TA-mixture in most cases). Thin layer and double layer preparations will lose their specific advantages. Also it may be possible to reduce the quality of the spectra (especially in the case of low amount of sample). For that reason it is recommended to first measure the washed sample and perform the recrystallisation only after no satisfying spectra could be obtained. „salty“ sample: direct preparation (green) and after on-target wash (blue) sodium adducts are marked with ““. Signal to Noise ratio is improved after washing while sodium adduct formation is decreased 15 16 17 18 FLEXCONTROL 19 FLEXANALYSIS 20 21 Bruker Daltonik GmbH 6 Sequence Database Searches from MALDI Peptide Mass Fingerprints (PMFs) 6.1 Introduction.................................................................................................... 6-1 6.2 Sequence Database Search using a MALDI Peptide Mass Fingerprint........ 6-2 6.3 Define the Search.......................................................................................... 6-3 6.3.1. MASCOT Search Results ...................................................................... 6-6 6.3.2. Introduction to the MASCOT 2.0 Query Results Interface ..................... 6-7 6.3.3. Work with Search Results in BioTools ................................................. 6-11 6.1 Introduction The most frequent task in proteomics projects is the identification of a protein sample based on an endoprotease digest, such as trypsin, and a sequence database search using the m/z values of the digested peptides. Such data are called "peptide map" or "peptide mass fingerprint" (PMF). BioTools allows such searches to be performed on all available search engines, Internet access provides, and particularly operates in a seamless way with the MASCOT search program (Matrix Science Ltd., London) up to the latest version. A prerequisite is a spectrum with annotated monoisotopic masses either from FlexAnalysis (FLEX) or DataAnalysis(Trap, oTOF, FTICR). In FlexAnalysis the method PMF.FAMSMethod performs a peak finding process (algorithm: SNAP) in the mass range of 800-4000 m/z. In order to eliminate background peaks just click on “MassList/Filter Background Peaks”, and then choose a suitable “MassControlList” containing the most common background masses (for trypsin autoproteolysis or contaminants like keratins). Tutorials for BioTools, Version 3.2 (October 2008) 6-1 Bruker Daltonik GmbH Sequence Database Searches from MALDI Peptide Mass Fingerprints (PMFs) 6.2 Sequence Database Search using a MALDI Peptide Mass Fingerprint Sequence Database Search using a MALDI Mass Fingerprint. An example PMF dataset is in the tutorial data directory. Please follow the described steps: Open the tutorial data set: ..\Tutorial Data\Biotools\Flex\BSA_digest\0_G11\1\ 1SRef\pdata\1\1r). The red histogram-like peaks indicate the mass-intensity values from the mass labeled spectrum, if "View/Picked Peaks" is selected. Figure 6-1 BSA tryptic digest Lys-C from ultraflex II The fully annotated spectrum appears resulting from a previous MASCOT search. The following description allows you to generate this information yourself. 6-2 Tutorials for BioTools, Version 3.2 Bruker Daltonik GmbH Define the Search 6.3 Push the Define the Search button to open the MS data search dialog. Note: If a connection to a MASCOT Inter- or Intranet-server cannot be established, an empty search dialog pops up after a few seconds. The local address is of the type http://<servername or IP-address>/mascot/cgi/nph-mascot.exe?1. It must be added to the URL list to do local searches. In addition, the perl scripts from the BioTools installation CD should be installed on local Mascot server older than version 2.1. If the Internet address could not be reached, you need to setup the Internet connection. Figure 6-2 MS search dialog for the internet search Tutorials for BioTools, Version 3.2 6-3 Bruker Daltonik GmbH Sequence Database Searches from MALDI Peptide Mass Fingerprints (PMFs) Specify the information as in Figure 6-2. Push the Start button for a MASCOT search. Tutorial: library searching and the BioTools search interface Typically, Fixed modifications include the known chemistry, such as reductive disulfide cleavage and carbamidomethylation, i.e., reaction with iodoacetamide. Unknown chemistry, such as the artifact Methionine oxidation or phosphorylation can be specified as variable modifications. Allowing for optional modifications may reduce search specificity, but some, like Protein N-term Acetylation/ Formylation/ Pyroglutamylation may help identification of small proteins. Also labeling chemistry such as ICPL_light and ICPL_heavy or ICAT_light/heavy are specified as variable modifications for quantitative proteomics experiments. Mass tolerance MS (the peptide mass error) is important as it can be a major source of frustration due to failed identifications, if the error estimation was a bit too optimistic! So: be sure about your data quality and evaluate the quality with a simple rule. Rule of thumb: for every 200 Da monoisotopic integer molecular weight add 0.1 Da. So at MW 1000 expect as average 1000.5 as exact mass, at MW 2000 exact mass is 2000.0. Using this rule it is easy to estimate the correctness of your calibration. The exact rule is: Δm = 1.00048 * INT(m), (Matthias Mann, 43rd ASMS Conference, 639) Providing you with the expected first decimal for any peptide ion mass: 200.1 – 400.2 – 600.3 – 800.4 - 1000.5, etc Typically, the precursor Protein mass does not need to be specified. However, the largest possible mass can be specified here (e.g. known from gel analysis) to restrict the retrieval of unspecific matches from extremely large proteins. For each database entry, Mascot looks for the matching peptides, which are within a contiguous stretch of sequence less than or equal to the specified protein molecular weight. This will often be less than the mass of the entire sequence entry (unless the data set happens to include both the N-terminal and C-terminal peptides). The number of missed cleavages (or partials) accounts for tolerated internal missed cleavage sites in matching peptides. This number should be set to 0 or 1, since higher values reduce the specificity of the search as extensive use of variable modification 6-4 Tutorials for BioTools, Version 3.2 Bruker Daltonik GmbH Define the Search does. If higher values seem to be required on a routine basis, you need to optimize your digest for more complete proteolysis. (In silver gels, destaining might help!). After you set up the search parameters for a type of application you need to process frequently, push the Save as default button to store conditions. Every spectrum is searched with this set of default conditions initially. If you then modify the conditions for a particular spectrum, the next time you open the spectrum these previous parameters will appear, allowing you to reproduce the last accepted result. Push Copy mass list to paste the mass list into the clipboard. Note: From the clipboard you can paste them into any browser-based search engine on the web, such as PeptideSearch, PepSea, Profound or MS-Fit. The search results from these programs, however, cannot be imported back into BioTools, in contrast to MASCOT. Push Copy Peaklist to paste the list of masses and intensities into the clipboard. If a search result is already imported into BioTools, and a significant number of unaccounted peaks suggest the presence of another protein in the digest mixture, check the Search unmatched peaks only option. Now, only those peptides of the tree view category “unmatched” are used for this 2nd round of searching. Note: this approach simplifies the setup of a secondary search but may cause problems: elimination of some masses, which are shared by isobaric peptides from the different proteins, may prevent the search engine from identifying the 2nd protein. Tutorials for BioTools, Version 3.2 6-5 Bruker Daltonik GmbH Sequence Database Searches from MALDI Peptide Mass Fingerprints (PMFs) 6.3.1. MASCOT Search Results The basic information in the result header is the top score, its access number in the database and the entry name, followed by a histogram representation of the 50 top scores (Protein Summary Report). Within the green rectangle, the likelihood of a false positive match is 5% or more. Usually, only scores significantly outside this region (Scores > 70) are significant. Good values are > 100. Attention: The absolute score for the 5 % false positive likelihood is a function of the database and the search conditions. It may vary. To continue with importing the top hit into BioTools, press the Get Hit(s) button and continue reading in section 6.3.3 Work with Search Results in BioTools. Figure 6-3 MASCOT search results overview To get a short introduction of the MASCOT Query results interface continue with section 6.3.2 Introduction to the MASCOT 2.0 Query Results . 6-6 Tutorials for BioTools, Version 3.2 Bruker Daltonik GmbH Define the Search 6.3.2. Introduction to the MASCOT 2.0 Query Results Interface Since there frequently is more than one homologue or near identical sequence, splice variants, etc., even in nonredundant databases the search result may be obscured. MASCOT offers for this case the Concise Protein Summary Report. Here, the sequences and scores of the highest scoring sequence for each cluster of homologue sequences are shown. This is the preferred mode to view the results. Figure 6-4 Concise Protein Summary Report If you format the report as Protein Summary you may select to add a peptide match overview (Figure 6-5), which allows to check the identity of matching peptides across the candidate sequences. Red circles indicate identical sequences, if one of them is under the mouse cursor. This is very useful to get a feeling for the relationship among the retrieved sequences. Tutorials for BioTools, Version 3.2 6-7 Bruker Daltonik GmbH Sequence Database Searches from MALDI Peptide Mass Fingerprints (PMFs) Figure 6-5 Overview table of matching peptides Further down the page under Index there is a summary of the result with scores and sequences. The molecular weight of the proteins is often useful to tell false positives due to either excessively high (> 300 kDa) or very low (< 5 kDa) molecular weights. On this level you may select the entries you would like to visualize within BioTools. 6-8 Tutorials for BioTools, Version 3.2 Bruker Daltonik GmbH Define the Search Figure 6-6 Protein Summary Report: index and matching peptides Under Results List for each entry there is a detailed list of all matching peptides and the actual mass error in Da (Delta, irrespective of error dimension in the search). Through the hyperlinked access number you open the Mascot Protein View, which contains a peptide coverage map of the full protein and all available information about the database entry (Figure 6-7). Also an error plot is provided, which allows a simple mass error evaluation (Figure 6-8). A gross mass accuracy value provided here (as well as in BioTools 3.2, see Figure 6-12) is the RMS error that is well suited to give the average mass error of that dataset. Tutorials for BioTools, Version 3.2 6-9 Bruker Daltonik GmbH Sequence Database Searches from MALDI Peptide Mass Fingerprints (PMFs) Figure 6-7 6-10 Protein view to visualize sequence coverage of matching peptides Tutorials for BioTools, Version 3.2 Bruker Daltonik GmbH Define the Search Figure 6-8 Error view 6.3.3. Work with Search Results in BioTools If you decided to import candidate sequence # 1 from the MASCOT Query results window for further work in BioTools, push the Get Hit(s) button in the Query results window with 1 in the entry field below. If you would like to import, e.g., entries 1-4 and 8, specify "1-4,8". If you like to import all entries, push the Get All button, but it is recommended not to do this, since the download of all sequences may cause long waiting times. In particular, if a database is accessed via the web and the total number of hits was selected to be >10. To avoid importing too many redundant protein sequences, Mascot 2.0 query results are best viewed after Concise View formatting. Older versions of Mascot only provide the Protein view. Tutorials for BioTools, Version 3.2 6-11 Bruker Daltonik GmbH Sequence Database Searches from MALDI Peptide Mass Fingerprints (PMFs) Figure 6-9 MASCOT search results Mowse score To clear the BioTools treeview from previously imported search results, press the Clear button before you import the new data. For further searches, which do not include the peptides matching the first protein sequence, press New to return to the Search dialogue window and check Search unmatched peaks only in the Mascot search dialog (Figure 6-2). To exit the Query result page to continue working with the spectrum in BioTools, press Exit. 6-12 Tutorials for BioTools, Version 3.2 Bruker Daltonik GmbH Define the Search The Treeview The treeview on the left side contains the data file information with up to two info lines – these contain the comments 1 and 2 provided by the operator during spectra acquisition. The unmatched peaks as well as the peaks matching the identified sequences are listed. Information from the imported MASCOT search: the list of sequence names, which were retrieved, with a sublevel called Digest matches, which contains the MASCOT score. This is followed by the basic information about the search parameters and the chemical modifications specified. Figure 6-10 Imported Search Result in BioTools – tree view The most important information in the tree view is the list of peptides in the particular sequence, which match the experimental masses at the specified conditions of the search. Each peak entry may consist of measured m/z, calculated MH+, intensity, deviation (mass error in Da / ppm), sequence range of the peptide, partials (P, number of missed internal cleavage sites) and the sequence. The actual parameters that are displayed can be customized as described in the BioTools User Manual in chapter Useful Hints - Treeview Window - Context Menu. Selection of the tree view entries at any level can be visualized in the spectrum as well as in the sequence view underneath the spectrum. Either single peaks or a set of peptides matching a protein, i.e., Digest matches can be selected. The black numbers with additional sequence position information indicate matched peptides. Peptides, which contain an optional modification are color-coded in blue. Tutorials for BioTools, Version 3.2 6-13 Bruker Daltonik GmbH Sequence Database Searches from MALDI Peptide Mass Fingerprints (PMFs) The Sequence Viewer Simultaneous to the treeview information, the sequence is also loaded into the BioTools Sequence Viewer following the Get Result(s) operation in the MASCOT results window. The viewer is directly linked to the tree view as well as the spectrum, which means they all together display information about the same set of peptides within the same downloaded sequence. The matching peptides are represented here as bars underneath the covered sequence range, which allows you to visualize the information extracted from the spectrum on the sequence level. The view can be configured using the pull down menu opened by right mouse button click in context with the sequence viewer. Figure 6-11 Imported Search Result in BioTools – sequence viewer Important information about the global match between spectrum and sequence is displayed in the header of the sequence viewer: 6-14 Tutorials for BioTools, Version 3.2 Bruker Daltonik GmbH Define the Search Protein shows the database entry information. The values for isoelectric point pI and molecular weight MW [kDa] are based on the protein sequence solely, no modifications, etc, are considered in these calculations. The Intensity coverage provides an idea about the fraction of the intensity of all matched peaks vs. the total picked peak intensities, which are related to the selected protein. A coverage of larger than 80 % means that you achieved a fairly complete extraction of information from the spectrum, while a coverage of 20 % means, you probably missed the point in analyzing the spectrum so far or contaminations are significant. Sequence coverage MS is the fraction of the annotated sequence in a mass fingerprint vs. the total sequence length. In MALDI fingerprints, this value typically varies between 10 and 90% depending on protein size and data quality - good quality spectra of small proteins may yield 90 % while larger proteins like BSA will yield only 15-30 %. In the Match Errors tab, the error plot is shown (Da or ppm scale can be selected), which allows a simple mass error evaluation (Figure 6-12). The average RMS error (always ppm) and the regression function of the errors along the mass axis are provided additionally. This interface enables you to interactively judge the data from a mass spec point of view (mass errors, signal shape/intensity/ isotopic distribution) and from a protein chemical view (Distribution of cleavage sites in the protein, hot spots in the sequence indicated by several peptides sharing the same cleavage site, etc.). It is basically a result editing board from which you can initiate various further investigations and to which the respective results are reported to for your further judgment. Tutorials for BioTools, Version 3.2 6-15 Bruker Daltonik GmbH Sequence Database Searches from MALDI Peptide Mass Fingerprints (PMFs) Figure 6-12 6-16 Imported Search Result in BioTools – match errors, the y-axis may be switched to ppm scale by right mouse button click on the y-scale Tutorials for BioTools, Version 3.2 Bruker Daltonik GmbH Define the Search The basic observations, assumptions to explaining them and the possible procedures to check them are: Problem 1: Many peaks remain unaccounted for after import of a search result (Intensity coverage poor) Assumption 1: There are more proteins in the mixture and I didn’t find them all, yet: repeat the MASCOT search and select the Search unmatched peaks only option in the search dialog. Assumption 2: Several peaks may match actually to the protein, but not in the simple way assumed for database searching. I want to check for higher mass deviations, tolerate more incomplete digestion or even unspecific cleavages (typically trypsin gives raise to further peptides resulting from cleavage after H, Y, W, F, L and I. You may even want to check for the presence of various suspected modifications or sequence errors or point mutations. For further work on the identification of the unmatched peaks at this stage of analysis, please refer to the SequenceEditor Tutorial – Protein Digests, chapter P.5.1 Search for Unexplained Masses after MASCOT search. Problem 2: Sequence coverage is too poor after import of a search result Assumption 1: I (or a script) may have missed picking the weak peaks in the spectrum so far and need to find out: do a theoretical digest of the identified protein and send the predicted masses to the spectrum. Then add the missed peaks to the peaklist; please refer to the SequenceEditor Tutorial – Protein Digests, chapter P.2 Perform Enzymatic Digest, chapter P.3 Format the Digest Results and chapter P.4 Export Digest Results to Spectrum. Assumption 2: I need to do an LC-ESI-MS/MS run for better coverage and want to set up a preferred or exclusion mass list. Do a theoretical digest of the identified protein and export the predicted m/z values to esquireControl; please refer to the SequenceEditor Tutorial – Protein Digests, chapter P.2 Perform Enzymatic Digest, chapter P.3 Format the Digest Results and chapter P.4 Export Digest Results to Spectrum. Tutorials for BioTools, Version 3.2 6-17 Bruker Daltonik GmbH Sequence Database Searches from MALDI Peptide Mass Fingerprints (PMFs) Problem 3: A particular peak remains unaccounted for in the mass fingerprint after all my efforts and I really want to know what it is! Run an MS/MS spectrum (LIFT, CID, etc.) first and try a library search in any case with that spectrum, even without enzyme specification. If it fails: Assumption 1: The peak is related to an interesting, since unknown structural detail of my identified protein. Search for those masses in protein sequence and allow all thinkable modifications to occur and even allow tolerating single position sequence variations. Use the MS/MS spectrum to judge the calculated suggestions; please refer to the SequenceEditor Tutorial – Protein Digests, chapter P.2 Perform Enzymatic Digest, chapter P.3 Format the Digest Results and chapter P.4 Export Digest Results to Spectrum. Alternatively RapiDeNovo and MS-BLAST may help, either as a local BLAST search or via the internet. Assumption 2: The peak is related to another protein, which hasn’t been identified in the mass fingerprint and it is not in the protein database. Try searching the ESTdb at the matrix science homepage first and DeNovo sequencing second. 6-18 Tutorials for BioTools, Version 3.2 22