1
TALREN 4 Manual
B - User manual
TALREN 4 – V 1.x
B. User Manual
1. INTRODUCTION ................................................................................................................7
2. GENERAL PREVIEW ........................................................................................................8
2.1. MAIN FEATURES OF TALREN 4................................................................................................... 8
2.1.1. The interactive graphical interface ............................................................................... 8
2.1.2. Handling the staged construction ................................................................................. 8
2.1.3. The automatic search for circular surfaces .................................................................. 9
2.1.4. Yield design calculation (logarithmic spirals).............................................................. 13
2.1.5. Compatibility with previous versions of TALREN, and with PLAXIS.......................... 13
2.2. GENERAL STEPS WHEN CREATING A NEW PROJECT WITH TALREN 4 ............................................. 13
3. THE VARIOUS OPTIONS TO USE THE INTERFACE....................................................15
3.1. THE DIFFERENT ZONES ON THE SCREEN ..................................................................................... 15
3.2. MENUS, TOOLBARS AND STAGES EXPLORER ............................................................................... 16
3.2.1. Main menu.................................................................................................................. 16
3.2.2. Pop up menu .............................................................................................................. 18
3.2.3. Main toolbar................................................................................................................ 18
3.2.4. Contextual toolbars..................................................................................................... 19
3.2.5. Explorer for stages and conditions ............................................................................. 20
3.3. GRAPHICAL VIEW AND RULERS .................................................................................................. 20
3.3.1. Conventions about the graphical drawing .................................................................. 20
3.3.2. Display settings for the graphical view ....................................................................... 21
3.4. STATUS BAR ............................................................................................................................. 27
3.5. STANDARD FUNCTIONNALITIES OF THE WINDOWS® ENVIRONMENT ............................................... 27
3.5.1. File: New / Open / Save (as) / Working directory / Close / Recent files / Exit............ 27
3.5.2. Printing........................................................................................................................ 28
3.5.3. Copy/Paste and copy to clipboard.............................................................................. 28
3.5.4. Help ............................................................................................................................ 30
3.5.5. About .......................................................................................................................... 30
4. "PROJECT DATA" MODE ..............................................................................................31
4.1. PRINCIPLES .............................................................................................................................. 31
4.2. GENERAL SETTINGS .................................................................................................................. 31
4.3. GEOMETRY .............................................................................................................................. 33
4.3.1. Drawing the geometry with the mouse ....................................................................... 33
4.3.2. "Geometry" dialogue box............................................................................................ 35
4.4. LOADS ..................................................................................................................................... 37
4.4.1. Defining loads with the mouse ................................................................................... 38
4.4.2. "Loads" dialogue box.................................................................................................. 39
4.5. REINFORCEMENTS .................................................................................................................... 42
4.5.1. Introduction to reinforcements.................................................................................... 42
4.5.2. Definition of the reinforcements with the mouse ........................................................ 43
Copyright TALREN 4 - TERRASOL – February 2005
Page 1
TALREN 4 Manual
B - User manual
4.5.3. "Reinforcements" dialogue box .................................................................................. 44
4.6. SOIL CHARACTERISTICS ............................................................................................................ 55
4.7. WIZARDS AND DATABASES................................................................................................ 61
4.7.1. Coefficient qs for nails ................................................................................................ 61
4.7.2. Database for partial safety factors.............................................................................. 62
4.7.3. Soils database ............................................................................................................ 66
4.7.4. Reinforcements database........................................................................................... 67
5. "STAGES/CALCULATIONS" MODE ..............................................................................69
5.1. STAGES ................................................................................................................................... 69
5.1.1. Principles .................................................................................................................... 69
5.1.2. Adding a new stage .................................................................................................... 70
5.1.3. Inserting a new stage ................................................................................................. 71
5.1.4. Definition or modification of the stage properties ....................................................... 72
5.1.5. Deleting a stage.......................................................................................................... 85
5.2. SITUATIONS (I.E. CONDITIONS)................................................................................................... 87
5.2.1. Principles .................................................................................................................... 88
5.2.2. Adding a new set of conditions................................................................................... 88
5.2.3. Duplicating a set of conditions.................................................................................... 88
5.2.4. Copy/paste a situation ................................................................................................ 89
5.2.5. Definition or modification of the conditions settings ................................................... 89
5.2.6. Removing a situation .................................................................................................. 96
5.3. CALCULATION AND RESULTS DISPLAY ........................................................................................ 97
5.3.1. Calculation.................................................................................................................. 97
5.3.2. Default output display ................................................................................................. 98
5.3.3. Settings for the graphical output display .................................................................... 99
5.3.4. Detailed results for failure surfaces .......................................................................... 101
5.3.5. Forces in reinforcements .......................................................................................... 103
5.3.6. Detailed results for slices.......................................................................................... 105
6. PRINTING ......................................................................................................................107
6.1.
6.2.
6.3.
6.4.
PROJECT DATA ....................................................................................................................... 107
GRAPHICAL SUMMARY ............................................................................................................ 107
DATA FOR STAGES AND SITUATIONS......................................................................................... 108
DETAILED RESULTS................................................................................................................. 108
6.4.1. Detailed results for failure surfaces .......................................................................... 108
6.4.2. Results relative to reinforcements ............................................................................ 108
6.4.3. Results detailed by slices ......................................................................................... 108
6.5. PRINTER SETTINGS ................................................................................................................. 109
7. FILES HANDLED BY TALREN 4 ..................................................................................110
7.1. FILES THAT CAN BE OPENED/SAVED WITH TALREN 4 ............................................................... 110
7.1.1. Loading .tal files saved with Talren 97 ..................................................................... 110
7.1.2. Reading .plx files saved with Plaxis v8..................................................................... 115
7.2. OTHER FILES HANDLED BY TALREN 4..................................................................................... 117
7.2.1. Files provided during installation .............................................................................. 117
7.2.2. Result files ................................................................................................................ 117
7.2.3. Temporary files......................................................................................................... 118
Copyright TALREN 4 - TERRASOL – February 2005
Page 2
TALREN 4 Manual
B - User manual
LIST OF FIGURES
Figure 1: stages and situations ................................................................................................9
Figure 2: scan principle for the automatic search of the critical circle, with imposed
passage point for the first circle: First scan .......................................................10
Figure 3: scan principle for the automatic search of the critical circle, with imposed
passage point for the first circle: Second scan ("zoom") ...................................11
Figure 4: example of an automatic search with imposed passage point (display of all
calculated circles) ..............................................................................................12
Figure 5: principle of the automatic search for yield design calculation (logarithmic
spirals) ...............................................................................................................12
Figure 6: example of an automatic search for logarithmic spirals (display of all
calculated spirals)..............................................................................................13
Figure 7: identification of the zones on the screen (in Stages/Calculations mode)................15
Figure 8: main menu ..............................................................................................................17
Figure 9: project Data menu...................................................................................................18
Figure 10: pop up menu (stages mode, after a right click on a soil layer)..............................18
Figure 11: main toolbar ..........................................................................................................18
Figure 12: "Project data" toolbar ............................................................................................19
Figure 13: "Stages/calculations" toolbar.................................................................................19
Figure 14: explorer for stages and conditions ........................................................................20
Figure 15: example of a model reversal .................................................................................21
Figure 16: grid settings...........................................................................................................22
Figure 17: selecting a background picture .............................................................................23
Figure 18: example of a background picture imported into a new project..............................23
Figure 19: adjusting background picture to scale...................................................................24
Figure 20: general comments dialogue box ...........................................................................24
Figure 21: defining a scale .....................................................................................................25
Figure 22: table of soil characteristics ....................................................................................26
Figure 23: table of loads.........................................................................................................26
Figure 24: table of reinforcements..........................................................................................27
Figure 25: status bar ..............................................................................................................27
Figure 26: "save" dialogue box...............................................................................................28
Figure 27: changing the working directory .............................................................................28
Figure 28: table copy options .................................................................................................29
Figure 29: graphics copy options ...........................................................................................30
Figure 30: general settings dialogue box ...............................................................................32
Figure 31: properties dialogue box for a point or segment.....................................................35
Figure 32: geometry dialogue box (3 tabs).............................................................................36
Figure 33: case of loads covering several segments .............................................................37
Figure 34: graphical display of a distributed load ...................................................................38
Figure 35: graphical display of a linear load and moment......................................................38
Figure 36: properties of a distributed load..............................................................................39
Figure 37: loads dialogue box: Tab 1 (distributed loads) .......................................................40
Copyright TALREN 4 - TERRASOL – February 2005
Page 3
TALREN 4 Manual
B - User manual
Figure 38: loads dialogue box: Tab 2 (linear loads/moments) ...............................................41
Figure 39: graphical display of reinforcements.......................................................................43
Figure 40: properties of a nail.................................................................................................44
Figure 41: reinforcements dialogue box: tab 1 (nails) ............................................................45
Figure 42: reinforcements dialogue box: tab 1 (nails) when checkbox "Input value of
tensile strength" is deactivated..........................................................................46
Figure 43: reinforcement dialogue box: tab 1(nails) when checkbox "Rsc calculated
from qs" is deactivated ......................................................................................46
Figure 44: reinforcement dialogue box: tab 1 (nails) when checkbox "Shear force
varying…" is activated .......................................................................................47
Figure 45: reinforcement dialogue box: tab 1 (nails) with calculation mode (Tnul, Ccal) ..........47
Figure 46:reinforcement dialogue box: tab 1(nails) with calculation mode (Tcal, Ccal)............48
Figure 47: reinforcement dialogue box: tab 1 (nails), definition of variable shear
force ..................................................................................................................49
Figure 48: reinforcements dialogue box: tab 2 (anchors).......................................................50
Figure 49: reinforcements dialogue box: tab 2 (anchors): calculation options .......................51
Figure 50: reinforcements dialogue box: tab 3 (strips): strip 1 ...............................................52
Figure 51: traction calculation ................................................................................................53
Figure 52: soil/strip interaction ...............................................................................................53
Figure 53: reinforcements dialogue box: tab 3 (strips): strip 2 and more ...............................54
Figure 54: reinforcements dialogue box: tab 4 (struts)...........................................................55
Figure 55: soil characteristics dialogue box ...........................................................................56
Figure 56: ∆c (cohesion variation with depth) ........................................................................57
Figure 57: soil characteristics dialogue box: pl and KsB ........................................................57
Figure 58: soil characteristic dialogue box: specific partial safety factors ..............................58
Figure 59: properties of a soil cluster: choice of a soil characteristics set..............................58
Figure 60: soil characteristics dialogue box: cohesion anisotropy .........................................59
Figure 61: cohesion anisotropy ..............................................................................................60
Figure 62: soil characteristics dialogue box: choice of a non-linear shear strength
curve..................................................................................................................60
Figure 63: non-linear shear strength curve ............................................................................61
Figure 64: qs depending on pl (extract from Clouterre recommendations 1991) ...................62
Figure 65: predefined sets of partial safety factors ................................................................63
Figure 66: partial safety factors wizard...................................................................................64
Figure 67: soil characteristics dialogue box: general soils database .....................................66
Figure 68: soils database .......................................................................................................67
Figure 69: reinforcements dialogue box: general reinforcements database ..........................68
Figure 70: reinforcements database.......................................................................................68
Figure 71: stages and conditions (situations).........................................................................69
Figure 72: definition of successive stages..............................................................................71
Figure 73: insertion of a stage at position n ...........................................................................72
Figure 74: modification of the soil properties for a soil cluster, with the pop up menu ..........73
Figure 75: hydraulic conditions dialogue box .........................................................................74
Figure 76: definition of the groundwater level ........................................................................74
Copyright TALREN 4 - TERRASOL – February 2005
Page 4
TALREN 4 Manual
B - User manual
Figure 77: graphical display for phreatic line..........................................................................75
Figure 78: adding a point to an existing groundwater level ....................................................75
Figure 79: activation of a water table base and an external phreatic line ..............................76
Figure 80: definition of the water table base ..........................................................................76
Figure 81: definition of an external phreatic line.....................................................................77
Figure 82: definition of hydraulic conditions: data along polygonal failure surfaces..............78
Figure 83: definition of hydraulic pressures along polygonal failure surfaces ........................78
Figure 84: definition of a triangular pore pressures mesh ......................................................79
Figure 85: definition of the pore pressures mesh (points and triangles) ................................80
Figure 86: example of the graphical display for a hydraulic mesh .........................................81
Figure 87: choice of the Plaxis file for pore pressures importation.........................................81
Figure 88: choice of the calculation step for pore pressures importation ...............................82
Figure 89: definition of ru coefficients for soil layers ..............................................................83
Figure 90: ru coefficients for soil layers..................................................................................84
Figure 91: dialogue box for stage comments .........................................................................85
Figure 92: example of a stage removal ..................................................................................86
Figure 93: deleting stage n.....................................................................................................87
Figure 94: definition of several situations for a same stage ...................................................88
Figure 95: conditions dialogue box.........................................................................................89
Figure 96: failure surfaces dialogue box: circular failure surfaces, manual search................90
Figure 97: manual search for circular failure surfaces ...........................................................91
Figure 98: failure surfaces dialogue box: circular failure surfaces, automatic search ............92
Figure 99: failure surfaces dialogue box: circular failure surfaces, automatic search ............92
Figure 100: failure surfaces dialogue box: polygonal failure surfaces....................................93
Figure 101: failure surfaces dialogue box: polygonal failure surfaces....................................93
Figure 102: example of graphical display for polygonal failure surfaces................................93
Figure 103: addition of a point to an existing polygonal failure surface..................................94
Figure 104: conditions dialogue box: impose passage conditions .........................................95
Figure 105: dialogue box for situation comments...................................................................95
Figure 106: calculations progress ..........................................................................................97
Figure 107: default output display after the calculation of a situation (example in the
case of circular failure surfaces)........................................................................98
Figure 108: graphical output display settings .........................................................................99
Figure 109: display of all calculated circles ..........................................................................100
Figure 110: display of circles corresponding to a given range of safety factor values .........100
Figure 111: display of colour shadings and reinforcements design criteria..........................101
Figure 112: detailed results for failure surfaces (example for circular failure
surfaces, Bishop calculation method)..............................................................102
Figure 113: detailed results for failure surfaces (example for circular failure
surfaces, Bishop calculation method)..............................................................102
Figure 114: detailed results for failure surfaces (example for circular failure
surfaces, perturbations calculation method)....................................................103
Figure 115: legend for F values............................................................................................103
Figure 116: detailed results: forces in reinforcements.........................................................104
Copyright TALREN 4 - TERRASOL – February 2005
Page 5
TALREN 4 Manual
B - User manual
Figure 117: legend for the reinforcements results................................................................104
Figure 118: slices results (case of detailed results saved for critical failure surface
only).................................................................................................................106
Figure 119: printing settings .................................................................................................107
Figure 120: printer settings...................................................................................................109
Figure 121: "open" dialogue box ..........................................................................................110
Figure 122: partial factor set "Coefficients TAL"...................................................................111
Figure 123: definition of the slope boundary ........................................................................112
Figure 124: specific case of Talren 97 file reading...............................................................112
Figure 125: soil characteristics and specific partial safety factors........................................114
Figure 126: warning displayed when reading a Plaxis v8 file..............................................116
LIST OF TABLES
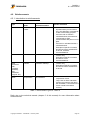
Table 1: reinforcement types in Talren 4...............................................................................42
Table 2: example of construction stages................................................................................70
Copyright TALREN 4 - TERRASOL – February 2005
Page 6
TALREN 4 Manual
B - User manual
1. INTRODUCTION
TALREN 4 is a major evolution compared to previous versions of TALREN, and notably
compared to TALREN 97.
TALREN 4 is a new user-friendly software running under Windows®, and TALREN 97 users
as well as new users of TALREN will find it very easy to use.
The main characteristics of TALREN 4 are presented in chapter 2.
The detail of available functionalities is then presented in the following chapters.
We draw the attention of the reader particularly to the paragraphs designated by
"IMPORTANT": they include important indications for a good use of the software.
Copyright TALREN 4 - TERRASOL – February 2005
Page 7
TALREN 4 Manual
B - User manual
2. GENERAL PREVIEW
2.1.
Main features of TALREN 4
2.1.1. The interactive graphical interface
The TALREN 4 user interface is an interactive graphical interface, developed according to
the following principles:
• Most operations, in particular the drawing of the profile, can be performed with the
mouse. It is also possible to view and modify properties of the various objects (data
and results) with the right mouse button.
• TALREN 4 proposes a graphical view whenever possible: curves for cohesion
anisotropy, or stresses along the failure surface are 2 examples of graphical display.
• The non-necessary data are not displayed: for example, if no nail is defined, the value
of qsnails is not necessary: this datum is therefore “hidden” in this case.
• Each datum is defined only once, to guarantee a better liability and to save time when
the user wants to change a value (only one change required).
• Many wizards (partial safety factors) and databases (soils, reinforcements) are
available.
The different ways of using this graphical interface are detailed in the following chapters.
2.1.2. Handling the staged construction
TALREN 4 enables to analyse geotechnical projects, and not only individual cross-sections,
which means that the management of construction stages is integrated in the program: from
initial conditions, it is possible to define in the same file many successive construction stages
(each stage corresponding to a cross-section of the project):
• Activation/deactivation of soil elements, loads, or reinforcements,
• Modification of soil properties,
• Modification of hydraulic conditions.
It is therefore not necessary to create several files to analyse the successive construction
stages of a project.
Moreover, it is possible to define many calculation conditions (also called situations here) for
a same stage (i.e. physical cross-section). The conditions properties include:
• Different calculation methods,
• Different partial safety factors,
• Different seismic conditions,
• Different failure surfaces.
It is therefore possible, for a given calculation stage, to check the stability of different types of
failure surfaces (different passage points for circular failure surfaces for example), or to
compare the fundamental situation with an accidental situation.
Copyright TALREN 4 - TERRASOL – February 2005
Page 8
TALREN 4 Manual
B - User manual
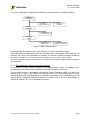
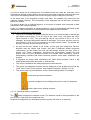
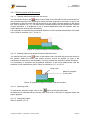
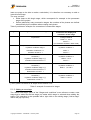
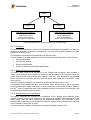
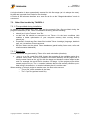
The "tree" organisation of stages and situations is illustrated with an example in Figure 1.
Stage n° 1
1st excavation
Conditions n° 1
Clouterre/temporary
Conditions n° 2
Traditional
Stage n° i
excavation
Conditions n° 1
Clouterre/temporary
Permanent
stage
Conditions n° 1
Clouterre fund.
Conditions n° 2
Clouterre acc./seismic
Figure 1: stages and situations
Each calculation is performed for a given situation of a given construction stage.
Each calculation is independent from the calculations for other stages and situations. For
example, the result of the calculation for situation m of phase n does not depend neither on
the results of phase n-1 nor on the results of situation m-1 nor on any other results.
One must perform as many calculations for a project file as situations defined for all stages of
this project file.
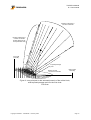
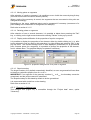
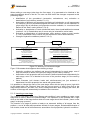
2.1.3. The automatic search for circular surfaces
In the case of circular failure surfaces, an automatic search option is available as a
complement to the manual search (definition of a mesh for centres of circles).
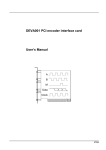
This automatic search is compatible with options "imposed passage point" and "first circle
tangent to a soil layer", and enables an automatic scan of all the possible space for the
centres of the circles. The following figures illustrate the principle of the automatic scan. The
settings for the automatic search are detailed in section 5.2.5.4, and the scan method is
detailed in section C.3.2.1.2 of the technical manual.
Copyright TALREN 4 - TERRASOL – February 2005
Page 9
TALREN 4 Manual
B - User manual
Number of directions =
number of intervals
L
Number of distances =
number of intervals
(further distances are
not represented here)
L
L/2
Left model
boundary
L/2
Imposed passage
point
Number of radii
= number of intervalss
L
Right model
boundary
Figure 2: scan principle for the automatic search of the critical circle,
with imposed passage point for the first circle:
First scan
Copyright TALREN 4 - TERRASOL – February 2005
Page 10
TALREN 4 Manual
B - User manual
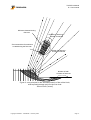
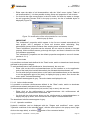
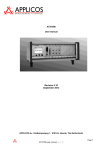
Minimum detected during
first scan
Number of directions =
number of intervals
Zoom around the first minimum
located during the first scan
Number of distances =
number of intervals
Number of radii
= number of intervals
Figure 3: scan principle for the automatic search of the critical circle,
with imposed passage point for the first circle:
Second scan ("zoom")
Copyright TALREN 4 - TERRASOL – February 2005
Page 11
TALREN 4 Manual
B - User manual
Figure 4: example of an automatic search with imposed passage point
(display of all calculated circles)
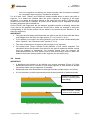
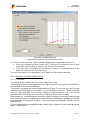
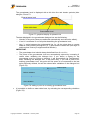
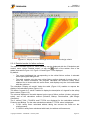
Moreover, in the case of a calculation with yield design method associated to logarithmic
spirals, the user defines entry and exit intervals for the spirals, and a few additional
parameters (indicated in section 5.2.5.4). TALREN 4 performs an automatic search of all the
spirals corresponding to these entry/exit intervals, as illustrated in Figure 5 and Figure 6.
Entry interval,
with search steps
Exit interval,
with search steps
TALREN 4 scans the spirals corresponding to all
possible combinations of entry and exit points
Figure 5: principle of the automatic search
for yield design calculation (logarithmic spirals)
Copyright TALREN 4 - TERRASOL – February 2005
Page 12
TALREN 4 Manual
B - User manual
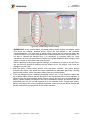
Figure 6: example of an automatic search for logarithmic spirals
(display of all calculated spirals)
2.1.4. Yield design calculation (logarithmic spirals)
TALREN 4 proposes, in addition to the 3 calculation methods with limit equilibrium (Fellenius,
Bishop, perturbations), the yield design calculation method (with logarithmic spiral failure
surfaces, Figure 6). For more information concerning this new calculation method, please
refer to the technical manual (chapter C of this manual).
2.1.5. Compatibility with previous versions of TALREN, and with PLAXIS
The ascendant compatibility of Talren 4 is ensured with Talren 97, except for a few
exceptions (section 7.1.1).
Moreover, Talren 4 can load Plaxis v8 files.
For more details, please refer to section 7.1.
2.2.
General steps when creating a new project with Talren 4
TALREN 4 is composed of two modes: the "Data" mode on the one hand, and the
"Stages/calculations" mode on the other hand.
The classical steps to follow when creating a new project are the following:
• Run Talren 4: the default active mode is the "Data" mode;
• Create a new project file (or open an existing project file);
• Define or modify the general settings (not compulsory if opening an existing file);
• Shift to the "Stages/Calculations" mode with the button of the contextual toolbar;
• The first stage is generated automatically: define or modify its properties if necessary;
• The first situation is generated automatically: define or modify its properties if
necessary;
• If necessary, create additional conditions (situations) for the first stage, with the pop
up menu or with the "Stages and conditions" menu;
Copyright TALREN 4 - TERRASOL – February 2005
Page 13
TALREN 4 Manual
B - User manual
•
•
•
If necessary, create additional stages, with the pop up menu or with the "Stages and
conditions" menu;
Perform the calculations, either for the selected situation, or for all situations of the
selected stage, or for all situations of all stages: the calculation can be run either with
one of the 3 calculation options of the “Calculations and results” menu, or with one of
the 3 calculation buttons of the contextual toolbar.
View the different output types (either on the graphical display, or in the detailed
tables).
Please refer to chapter D to learn more about the practical use of Talren 4 (detailed
application examples).
Copyright TALREN 4 - TERRASOL – February 2005
Page 14
TALREN 4 Manual
B - User manual
3. THE VARIOUS OPTIONS TO USE THE INTERFACE
3.1.
The different zones on the screen
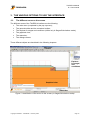
The different zones of the TALREN 4 interface are the following:
• The main menu (completed by the pop up menu);
• The general toolbar and the contextual toolbar;
• The explorer for stages and conditions (visible only in Stages/Calculations mode);
• The graphical view;
• The status bar;
• The dialogue boxes.
These different objects are described in the following chapters.
Main menu
Toolbars
Explorer
for stages
and
conditions
Graphical view
Status bar
Figure 7: identification of the zones on the screen (in Stages/Calculations mode)
Copyright TALREN 4 - TERRASOL – February 2005
Page 15
TALREN 4 Manual
B - User manual
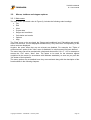
3.2.
Menus, toolbars and stages explorer
3.2.1. Main menu
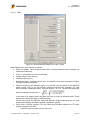
The main menu (schematic view in Figure 8), includes the following main headings:
• File
• Edit
• View
• Project data
• Stages and conditions
• Calculation and results
• Options
• Help
The “Data” menu on the one hand, the "Stages and conditions" and "Calculation and results"
menus on the other, are not displayed simultaneously. Only the menus corresponding to the
active mode are displayed.
Anytime, the menu items that are not relevant are disabled. For example, the “Table of
reinforcements” option of the “View” menu is disabled if no reinforcement has been defined.
The menu items can all be reached with a keyboard shortcut like "Alt + F + N" for example to
access the “File” menu, “New” item. The letters to be used for the shortcuts appear
underlined in the menus (in accordance with Windows standards), as soon as you push the
“Alt” button of the keyboard.
The menu options are not detailed here: they are mentioned along with the description of the
functionalities in the following chapters.
Copyright TALREN 4 - TERRASOL – February 2005
Page 16
TALREN 4 Manual
B - User manual
File
New
Open
Save
Save as
Edit
View
Cut
Copy
Paste
Delete
Close
Project data
Calculation and results
General settings
Calculate the selected set of cond.
Geometry
Calculate all conditions of the
selected stage
Loads
Distributed loads
Reinforcements
Linear loads and
moments
Soil characteristics
Print
Stages and conditions
Stages/calculation
Working directory
Rulers
Grid
Last file opened 3
Soil layers painting
Patterns
Last file opened 4
Point numbers
None
Exit
Segment numbers
Nails
Detailed output
Anchors
Forces in reinforcements
Partial safety factors
Reinforcements database
Soils database
Reverse model
Loading picture
Background drawing
Adjusting to scale
General comments
Deleting picture
Hydraulic conditions for selected stage
Comments for selected stage
Zoom
Zoom in
View all stages
Zoom out
Insert a new stage
Add a new stage
Table of soil characteristics
Table of loads
Table of reinforcements
Define scale
Remove selected stage
Define a zoom with mouse
View whole model
Define selected set of conditions
Comments about selected set of conditions
Add a new set of conditions
Remove the selected set of conditions
Duplicate the seletec set of conditions
Project data
Figure 8: main menu
Copyright TALREN 4 - TERRASOL – February 2005
About
Slices results
Loads identification
Reinforcements identification
Help topics
Graphical display settings for
output
Struts
Colors
Help
Calculate all
Strips
Last file opened 1
Last file opened 2
Options
Page 17
TALREN 4
B - User manual
Figure 9: project Data menu
3.2.2. Pop up menu
It can be reached by a right click of the mouse.
It enables to reach at any time:
• The most common display options (some zoom options: for example, “View whole
model” is very useful);
• The operations available for the object selected before right-clicking: for example
properties, deletion, edition, activation, deactivation. The available options depend on
the active mode (Project Data or Stages/Calculation);
• All other relevant options depending on the position of the mouse and on the selected
element. For example on Figure 10, it is possible to edit graphical display settings,
since the Stages/Calculations mode is active, and the calculation has already been
performed.
Figure 10: pop up menu (stages mode, after a right click on a soil layer)
3.2.3. Main toolbar
Figure 11: main toolbar
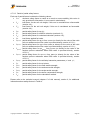
The buttons hereabove correspond respectively to the following functions:
•
New file;
•
Open an existing file;
•
Save a file;
•
Print;
•
Zoom in a user-defined window;
•
Zoom in;
•
Zoom out;
•
Copy to clipboard the selected element;
•
Screenshot;
Copyright TALREN 4 - TERRASOL – February 2005
Page 18
TALREN 4
B - User manual
•
General comments;
The buttons all have a legend, which is displayed when the mouse is placed on each of
them.
3.2.4. Contextual toolbars
The "project data" toolbar on the one hand, and the "Stages/Calculations" toolbar on the
other hand, are not displayed simultaneously. The one displayed is the one corresponding to
the active mode.
The buttons all have a legend, which is displayed when the mouse is placed on each of
them.
3.2.4.1.
"Project data" contextual toolbar
This one is equivalent to the "Project data" menu:
Figure 12: "Project data" toolbar
The buttons hereabove correspond respectively to the following functions:
• Selection tool;
• General settings for the project;
• Drawing of geometrical lines;
• Drawing of loads (distributed loads and linear loads/moments);
• Drawing of reinforcements (nails, anchors, strips and struts);
• Definition of soil properties (dialogue box);
• Shifting to "Stages/calculations" mode.
3.2.4.2.
"Stages/calculations" contextual toolbar
This one corresponds to the items of the "Stages and conditions" and "Calculations and
results" menus:
Figure 13: "Stages/calculations" toolbar
The buttons hereabove correspond respectively to the following functions:
• Shifting to "Project data" mode;
• Definition of the hydraulic conditions (dialogue box);
• Properties of the selected situation (dialogue box);
• Calculation of the selected situation;
• Calculation of all situations of the selected stage;
• Calculation of all situations of all stages;
• Settings for the graphical output display (dialogue box, available if results are
available for the selected situation).
• Detailed output for failure surfaces (dialogue box, available if results are available for
the selected situation);
• Detailed ouput for reinforcements (dialogue box, available if results are available for
the selected situation);
• Detailed output for slices (dialogue box, available if results are available for the
selected situation).
Copyright TALREN 4 - TERRASOL – February 2005
Page 19
TALREN 4
B - User manual
3.2.5. Explorer for stages and conditions
In the "Stages/calculations" mode, an explorer is displayed in the right part of the screen
(Figure 14). It enables to change from a stage or situation to another, and also to insert, add,
delete or rename stages and situations (either with the “Stages and conditions” menu, or with
the pop up menu that appears when right-clicking on a stage or situation).
Figure 14: explorer for stages and conditions
3.3.
Graphical view and rulers
The graphical view includes different objects:
• A horizontal ruler, placed at the top of the graphical window. Its settings (scale, origin,
graduation step, etc) are determined automatically as a function of the project width,
or of the current zoom level.
•
•
•
•
The same type of ruler, with the same characteristics, but vertical on the left of the
graphical window;
Vertical and horizontal scrollbars depending on the zoom level;
The graphical view itself, for the drawing of the cross-section. At the bottom of this
part, a white bar is displayed with the name of the company owning the program
(information included in the hardlock), the user mode (local, network or demo), the
title of the project and the drawing scale.
A pop up menu, accessible by a right mouse click (section 3.2.2).
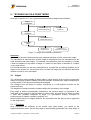
3.3.1. Conventions about the graphical drawing
3.3.1.1.
Scale
It is automatically defined as a function of the zoom level, or it can be decided by the user
(section 3.3.2.7).
In all cases, the scale in x and y directions is the same.
3.3.1.2.
Directions
IMPORTANT: the cross-section must always be defined with the "uphill on the left" (example
on Figure 15b), because the calculation is correct only if "the failure direction goes from the
left to the right”.
However, you may not want to reverse all coordinates manually if the cross-section you want
to work from is defined in the other direction (uphill on the right).
Moreover, in the case of dams, you wish to define the whole cross-section (both sides of the
dam), and then analyse each side of the dam.
Therefore the "Reverse model" item is available in the "Options" menu.
Copyright TALREN 4 - TERRASOL – February 2005
Page 20
TALREN 4
B - User manual
Uphill
Uphill
Figure a
Definition of the
cross-section
with uphill on the
right: calculation
is impossible
Figure b
After reversal:
calculation is
possible
Figure 15: example of a model reversal
This item opens a dialogue box, which proposes:
• either to reverse the model in the current file. In this case, all the x values and the
angles (load inclinations, reinforcements angles, etc) will have their sign changed
(from positive values to negative values and vice versa). The project file will keep the
same name. This case is relevant when defining a cross-section based on a
document with the uphill on the right: you have to reverse the model to be able to
perform the calculation “in the right direction” (case of Figure 15).
• or to reverse the model in a new project file. In this case too, all the x values and the
angles will have their sign changed (from positive values to negative values and vice
versa). The user will be asked for a new filename (the original file will not be altered).
This case is relevant when defining a dam with both sides: 2 projects file should be
created to analyse the stability of each side of the dam.
In all cases, when running the calculations, the sliding must happen "towards the right".
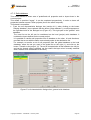
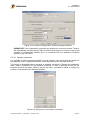
3.3.2. Display settings for the graphical view
These general options can be reached with the "View" menu (either in the "Project Data"
mode or in the "Stages/calculations" mode).
3.3.2.1.
Rulers
This option activates or deactivates both rulers (horizontal and vertical).
The rulers settings (scale and position) are calculated automatically depending on the current
zoom level.
3.3.2.2.
Grid
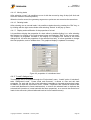
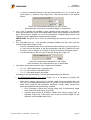
This option opens the dialogue box of Figure 16.
Copyright TALREN 4 - TERRASOL – February 2005
Page 21
TALREN 4
B - User manual
Figure 16: grid settings
•
•
If "display the grid" is checked, the grid will be displayed on the drawing, with the
indicated spacing;
If "activate grid attraction" is checked, the “magnetism” is activated, and the mouse
will move with the indicated spacing. When drawing an element, this element
(geometry point, load, reinforcements, etc) will be automatically connected to the
closest grid point. If this option is not activated, however, the elements will be drawn
at the exact coordinates of each mouse click.
3.3.2.3.
Soil layers painting
3 options are available:
• Painting with colours (default choice);
• Painting with patterns;
• No painting.
The last option is useful for printings that will be copied or faxed.
In the case of colours or patterns: the choice of the colour or of the pattern associated to
each layer is proposed in the dialogue box for soil properties (section 4.6).
With the "Colours" option: the user has to choose a colour (with a Windows® standard
colour choice).
• With the "Patterns" option: the user has to choose a pattern, from a predefined list.
If the user changes the painting option in an existing project, he should open the soil
properties dialogue box to define the new patterns or colours (the old ones are not erased,
because the user might come back later to the previous choice).
•
3.3.2.4.
Numbers of points and segments, labels of loads and reinforcements
Each one of these 4 options is available in the "View" menu, and can be
activated/deactivated independently from the others.
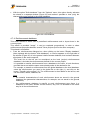
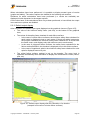
3.3.2.5.
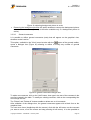
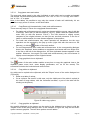
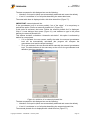
Background picture
This option is usually used before starting to define the project geometry, but it is also
possible to import a background picture for an existing file.
• Loading a picture: this option opens a standard dialogue box to select the picture file.
The supported files are the gif and jpeg formats.
Copyright TALREN 4 - TERRASOL – February 2005
Page 22
TALREN 4
B - User manual
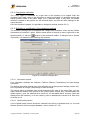
Figure 17: selecting a background picture
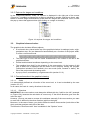
After validation, the background picture is displayed in the graphical view (Figure 18).
Figure 18: example of a background picture imported into a new project
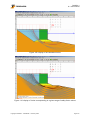
•
The user can then move the background (drag & drop with the mouse): left click on the
background (where no other element is displayed), then move the mouse keeping the
left button pressed. The background can be moved partially “outside” the graphical view.
In the same way, the user can change the size of the background picture: when clicking
on the background with the left mouse button (where no other element is displayed),
"handles" appear on the picture contour. The user can move these handles to change
the picture size.
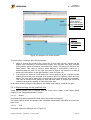
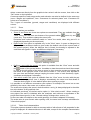
Adjusting the picture to scale: this option enables to adjust the scale of the background
picture to the one of the graphical view (it is available only if a background picture is
active). After selecting this option, you are requested to draw a reference segment on
the picture (horizontal, vertical or any direction). A dialogue box then opens (Figure 19)
and requests the "real" length of this segment. The size of the picture is then adjusted,
and it can be placed wherever wanted.
Copyright TALREN 4 - TERRASOL – February 2005
Page 23
TALREN 4
B - User manual
Figure 19: adjusting background picture to scale
•
Removing the background picture: this option enables to remove the background picture
when it is not needed anymore (it is therefore available only if a background picture is
active).
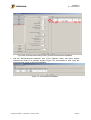
3.3.2.6.
General comments
It is possible to define general comments (texts) that will appear on the graphical view,
whatever mode is active.
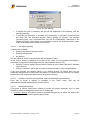
This option, available in the "View" menu but also with the
button of the general toolbar,
opens a dialogue box (Figure 20) allowing to define or modify any number of general
comments.
Figure 20: general comments dialogue box
To add a new comment, click on the "Add" button, then type in the text of the comment in the
new line created in the table. To modify an existing comment, click on the corresponding line
and change the text.
The "Delete" and "Delete all" buttons enable to delete one or all comments.
After validation of the dialogue box, the general comments appear with a black font on the
graphical view.
You can move them (drag&drop with the mouse): click with the left button on the comment
you want to move, move the mouse and stop pressing th left button). It is also possible to
Copyright TALREN 4 - TERRASOL – February 2005
Page 24
TALREN 4
B - User manual
delete a comment directly from the graphical view: select it with the mouse, then click on the
“Del” button on the keyboard.
Comments specific to each stage and/or each situation can also be defined in the same way
(menu “Stages and conditions”, item “Comments for selected phase” and “Comments for
select set of conditions”).
The 3 types of comments (general, stages and conditions) are displayed with different
colours.
3.3.2.7.
Zoom
Five zoom options are available:
• Zoom in and Zoom out: these two options are associated. They are available from the
•
(zoom in) and
“View” menu, but also from two buttons of the general toolbar
(zoom out). They enable to change the zoom level.
Horizontal and vertical scrollbars enable to "move" the model, when only part of it is
displayed (depending on the zoom level).
Define scale: this option is available only in the "View" menu. It opens a dialogue box
(Figure 21) that enables to define a given scale (the default value is the current scale of
the opened project). When the dialogue box is closed, the drawing is adjusted to the
scale that was typed in. Again, scrollbars are displayed if necessary.
Figure 21: defining a scale
•
Defining a zone with the mouse: this option is available from the “View” menu and with
button of the general toolbar. It enables to draw the zone that should be zoomed
the
in: click on the left corner of the zone to zoom in, then move the mouse and release the
left button in the opposite corner of the zone to zoom in. The scale is then adjusted to
the zone that was defined (always keeping the same scale in both directions). Again,
scrollbars are displayed if necessary.
• View whole model: this option is available from the “View” menu, but also with the pop
up menu in the graphical view. It displays automatically the zoom level that allows to
view the whole project. It is the default option when opening a project.
It is possible to use different successive zoom options: for example, first zoom into a zone
defined by the mouse, then zoom out or define a scale.
The scale value (always the same in both directions x and y) is always displayed in the white
bar at the bottom of the graphical view.
As indicated previously, the default active option is “View whole model”. When creating a
new project, the scale is initialised after the maximum and minimum x-coordinates of the
project have been typed in (in the “General settings” dialogue box, section 4.2).
As the user adds new objects to the model geometry, the scale is adapted if necessary.
The scale value is never saved: when opening a file, the zoom level is always reinitialised to
"View whole project".
3.3.2.8.
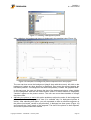
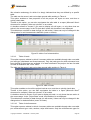
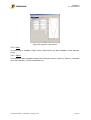
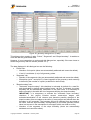
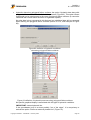
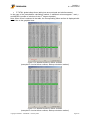
Table of soil characteristics
This option opens a window in which a summary table of with all sets of soil properties for the
project is displayed. All characteristics are in the table, except for the complex characteristics
Copyright TALREN 4 - TERRASOL – February 2005
Page 25
TALREN 4
B - User manual
like cohesion anisotropy, for which it is simply indicated that they are defined by a specific
table.
The table can be moved, and can be kept opened while working in Talren 4.
This option enables to view properties of all the project soil layers at once, and thus to
quickly check data.
Thanks to this option, you can also copy/paste the soils table in a report (Microsoft Word®
document for example), either as a picture, or as a table.
A checkbox allows to choose if you want to display all soil layers, or only those that are
active in the current stage. In the “Project data” mode, this checkbox is not displayed.
This table does not allow for data change (no edit mode). Values can only be changed in the
dialogue box for soil characteristics definition (menu or button).
Figure 22: table of soil characteristics
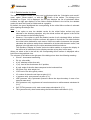
3.3.2.9.
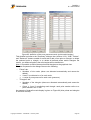
Table of loads
This option opens a window in which 2 summary tables are available through tabs: one table
per load type (distributed and linear/moments). Only the load types for which elements have
been defined in the project are available. If no load is defined in the project, the item for table
of loads is disabled in the “View” menu.
The table can be moved, and can be kept opened while working in Talren 4.
Figure 23: table of loads
This option enables to view all the project loads at once, and thus to quickly check data.
Thanks to this option, you can also copy/paste the table in a report (Microsoft Word®
document for example), either as a picture, or as a table.
A checkbox allows to choose if you want to display all loads, or only those that are active in
the current stage. In the “Project data” mode, this checkbox is not displayed.
This table does not allow for data change (no edit mode). Values can only be changed in the
dialogue box for loads definition (menu or button).
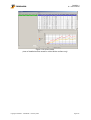
3.3.2.10.
Table of reinforcements
This option opens a window in which 4 summary tables are available through tabs: one table
per reinforcement type: nails, anchors, strips and braces. Only the reinforcement types for
Copyright TALREN 4 - TERRASOL – February 2005
Page 26
TALREN 4
B - User manual
which elements have been defined in the project are available. If no reinforcement is defined
in the project, the item for table of reinforcements is disabled in the “View” menu.
The table can be moved, and can be kept opened while working in Talren 4.
This option enables to view all the project reinforcements at once, and thus to quickly check
data.
Figure 24: table of reinforcements
Thanks to this option, you can also copy/paste the table in a report (Microsoft Word®
document for example), either as a picture, or as a table.
A checkbox allows to choose if you want to display all reinforcements, or only those that are
active in the current stage. In the “Project data” mode, this checkbox is not displayed.
This table does not allow for data change (no edit mode). Values can only be changed in the
dialogue box for reinforcements definition (menu or button).
3.4.
Status bar
It displays the following information:
• Coordinates (true scale) of the mouse on the graphical view;
• Gauge indicating the calculation progress (during calculation only);
Figure 25: status bar
3.5.
Standard functionnalities of the Windows® environment
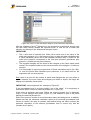
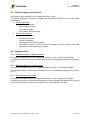
3.5.1. File: New / Open / Save (as) / Working directory / Close / Recent files / Exit
These functionalities are standard.
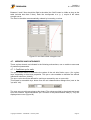
They display usual screens of Windows® applications. For example, the "open" or "save"
dialogue boxes propose an explorer allowing to choose a directory (and if necessary to
create it), etc.
Copyright TALREN 4 - TERRASOL – February 2005
Page 27
TALREN 4
B - User manual
Figure 26: "save" dialogue box
The menu options and corresponding buttons are activated/deactivated with respect to
relevant options (for example, the "Save" option will be active if data changes have been
made since the last save, if not, the “save as” option alone is available).
The 4 most recent files are accessible directly from the "File" menu.
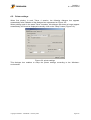
When opening or saving files, the default directory is the working directory. After installing
Talren 4, the default working directory is the examples directory. It can be changed at any
time using the option “Working directory” of the “File” menu (Figure 27).
Figure 27: changing the working directory
3.5.2. Printing
It is managed by the Windows® version of each computer.
Printer settings can be changed before printing: choice of the printer and printer settings
available when validating printing choices. Refer to section 6.5.
3.5.3. Copy/Paste and copy to clipboard
The usual Copy/Paste Windows® functionality is available in many forms, depending on the
element to which it applies.
Copyright TALREN 4 - TERRASOL – February 2005
Page 28
TALREN 4
B - User manual
3.5.3.1.
Copy/paste texts and values
The texts and values typed in the cells (individual or table cells) can be copied and pasted
into another cell with usual keyboard shortcuts: "Ctrl + Ins" or "Ctrl + C" to Copy, then "Shift +
Ins" or "Ctrl + V" to paste.
Note: in the tables, it's possible to copy only the content of each cell individually. It's not
possible to copy a line or column, or the whole table.
3.5.3.2.
Copy/Paste soil characteristics, loads, and reinforcements
There are many ways in Talren 4 to copy/paste these elements:
• For loads and reinforcements only: select an element with the mouse, copy it with the
“Edit/Copy” menu item (or with the shortcut “Ctrl+C"), paste it with the “Edition/Paste”
menu item (or with the shortcut "Ctrl+V"). The new element is slightly moved
compared to the original element, so that you can see both elements. In the list of
loads or reinforcements, the new element appears in last position.
• For loads and reinforcements only: same operation as hereabove, but the copy
operation can be reached by the pop up menu (right click with the mouse on the
•
element), or with the
button of the main toolbar.
For soil characteristic sets, loads and reinforcements: in the corresponding dialogue
boxes, the “Duplicate” button enables to copy/paste an element with one single click.
In the list on the left of the dialogue box, the new duplicated element appears in last
position. Moreover, here again (for loads and reinforcements), the new element is
slightly moved compared to the original element.
3.5.3.3.
Copy graphical view to clipboard
The
button of the main toolbar enables at any time to copy the graphical view to the
clipboard (same zoom level, same display parameters, etc. as on the screen) The
screenshot includes the horizontal and vertical rulers.
3.5.3.4.
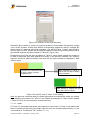
Copy tables to clipboard
Any table can be copied to the clipboard, with the "Export" menu of the active dialogue box
(Figure 28):
• Either as a table of values;
• Or as a picture. Be careful, in this case, only the visible part of the table is copied (in
the case of large tables, with the horizontal scrollbar, a part of the table will be
missing on the picture).
Figure 28: table copy options
3.5.3.5.
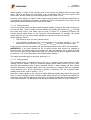
Copy graphics to clipboard
Any graphic displayed on the screen can be copied to the clipboard (as a picture), with the
"Export" menu of the active dialogue box. In the example of Figure 29, only the first menu
option concerns graphics. The two other options concern tables.
Copyright TALREN 4 - TERRASOL – February 2005
Page 29
TALREN 4
B - User manual
Figure 29: graphics copy options
3.5.4. Help
An online help is available ("Help" menu). Help buttons are also available in most dialogue
boxes.
3.5.5. About
This standard option enables to display an information screen: version of Talren 4, username
(from the hardlock), Terrasol coordinates, etc.
Copyright TALREN 4 - TERRASOL – February 2005
Page 30
TALREN 4
B - User manual
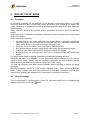
4. "PROJECT DATA" MODE
4.1. Principles
All elements necessary for the definition of the different construction stages of a project
should be defined in the "Project data" mode: geometrical lines delimiting the layers, soil
profile, excavation or embankment levels, all soil layer properties that will be used, loads and
reinforcements.
These elements will then be activated and/or deactivated in the successive construction
stages.
In the Data mode, it is therefore necessary to define all the data necessary for the description
of the whole project.
Those data are the following:
• General settings: title, units (and water unit weight, which is changed automatically
depending on the units, but can also be changed manually), calculation method and
partial safety factors to be used by default in the project, etc;
• Geometry: slope boundaries, limit of soil layers, earthwork levels;
• Soil layer properties: all layers which will be used during the construction stages;
• Loads: all loads that will be activated during the construction stages;
• Reinforcements: all reinforcements that will be activated during the construction
stages.
The way to define stage properties is detailed in the different following sections.
Generally, definition or modification of most geometrical data is possible with the mouse
(buttons of the “Data” toolbar), but the equivalent operations are also available through
dialogue boxes (accessible by the various items of the “Data” menu).
The user can therefore most often choose between various solutions to perform the same
operation.
Elements properties should be input through dialogue boxes. When validating dialogue
boxes, Talren 4 checks data and may produce error messages (corrections must be then
made before validating the dialogue box) or warnings (it is possible to continue).
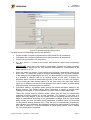
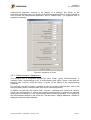
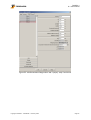
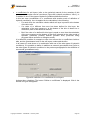
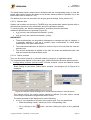
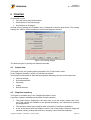
4.2. General settings
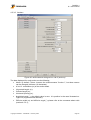
They are displayed in a dialogue box (Figure 30), accessible either from the Data/General
settings menu item, or from the
button.
Copyright TALREN 4 - TERRASOL – February 2005
Page 31
TALREN 4
B - User manual
Figure 30: general settings dialogue box
The data to input in this dialogue box are the following:
• Project number: compulsory alphanumeric field (maximum 20 characters);
• Calculation title: compulsory alphanumeric field (maximum 40 characters);
• Location and comments: not compulsory;
• Xmin, Xmax and Ymax: X limits for the model, and maximum project level (compulsory
values);
IMPORTANT: these values are used to automatically calculate the slope boundary.
They should be defined as the real minimum and maximum x-coordinates of the
model (section 4.3.1.6).
• Units and water unit weight: 3 unit systems are proposed, respectively linked to kN,
MN or tons. The water unit weight is changed automatically (but only after validation
of the dialogue box) depending on the units. It is also possible to change it manually.
It is possible to change units for an existing project. In this case, 2 options are
proposed: either convert all data already typed in (in the case of a "true" unit change),
or not convert the data already typed in (in the case where the data were already
typed in in a different unit than the one displayed, this option enables to make values
and units display consistent with one another).
• Calculation method and default safety factors: the default calculation method is the
Bishop method. The "Default safety factor" parameter is empty by default when
creating a new project: it is not compulsory to chose a set of safety factors here.
These two options allow to initialise default values that will then be automatically
proposed as default values for all new situations. For example, in the case of a
project with many stages, if the user knows from the beginning that he will have to
make all calculations according to the perturbations method, with the same partial
safety factors, the user can define these parameters as default values for his project
(in the general settings dialogue box). They will then be automatically proposed for
each situation (but can always be punctually modified for each situation if necessary).
Also refer to section 4.7.2 for the definition of partial safety factors, and to section
5.2.5 for the situations properties.
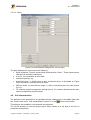
Copyright TALREN 4 - TERRASOL – February 2005
Page 32
TALREN 4
B - User manual
Four calculation methods are available: Fellenius, Bishop, Perturbations, and yield
design calculation. If the user chooses perturbations method, an additional parameter
appears: the exponent for tan(α), that can be equal either to 1 (default value) or 2
(refer to technical manual for additional information about this parameter).
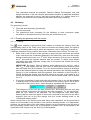
4.3. Geometry
The geometry includes:
• The initial slope boundary (groundlevel);
• The soil layer limits;
• The geometrical limits necessary for the definition of each contruction stage:
excavation or embankment levels, limits for a soil reinforcement, etc.
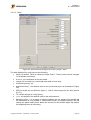
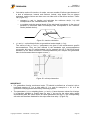
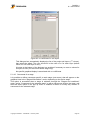
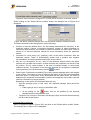
4.3.1. Drawing the geometry with the mouse
4.3.1.1. Drawing
button (drawing of geometrical lines) enables to activate the drawing mode (the
The
corresponding option of the "Data" menu does not activate the drawing mode, but opens a
dialogue box containing tables with all points and segments: refer to beginning of section 4).
2 different methods are then possible (and can be combined at any moment). The user can:
• Either click on the first point of the geometry to draw (using the horizontal and vertical
rulers, and the mouse coordinates displayed in the status bar), then move the mouse,
without releasing the button, to a 2nd point. When the button of the mouse is released,
the 2nd point and the segment between both are created. To define points without
connecting them with segments, simply click on the points and release the mouse
button after each click.
IMPORTANT: By default, Talren 4 adopts a scale adapted to Xmin and Xmax, and to
view Ymax. It may happen that the user needs to draw geometrical elements lower
than the visible zone on the screen. To do so, the best solution consists in drawing a
point at the lowest model level, using the method described in the following paragraph
(typing in of the coordinates with the keyboard). After validation of this low point, a
vertical scrollbar will appear, and will allow access to any part of the model (it is of
course also possible to modify the zoom level to see the whole model, refer to section
3.3.2.7).
• Or type the coordinates of each point with the keyboard: click in the cell that appears
in drawing mode (in the status bar at the bottom of the screen): type in the X and Y
coordinates of the point (X and Y values should be separated with a blank space).
The background of the cell will then become blue: this means that the next point
typed in will be connected to the previous one with a segment. To “pull up the pen”,
press the “Esc” button of the keyboard. The cell background turns white again,
meaning that the next point typed in will not be connected to the previous one with a
segment. One can at any time change from the "mouse drawing mode" to the
"coordinates drawing mode".
When coming back to the drawing mode after doing other operations, the first point that is
drawn is not connected to the last point of the previous drawing session. It is independent.
However, the second point of the new drawing session will be connected to the first point of
the new drawing session and so on: a new polyline is created until it is interrupted by the
right button of the mouse or by the “Esc” key of the keyboard.
Copyright TALREN 4 - TERRASOL – February 2005
Page 33
TALREN 4
B - User manual
If a point is drawn on an existing point, the software does not create the new point, but it
connects the already existing point to the previous point with a segment (except if this point
is the first of the drawing session) and to the next point (except if this point is the last).
In the same way, if two segments overlap each other, the software only saves the first
segment created. However, if the extremities of the segments are not the same, all distinct
points are created.
If a point is drawn on an existing segment, a new point is created, and connected to both
extremities of the existing segment.
Finally, if a segment intersects an existing segment, a point is automatically generated at the
intersection, and connected to the extremities of both segments that intersect.
Advices and complementary drawing tips:
•
First of all, to facilitate the drawing with the mouse, it is recommended to activate the
grid display and hooking. To do so, click on the "View" menu, and select the "Grid"
option (section 3.3.2.2). The grid spacing can be set (choose 0.25 or 0.5 m for
example), and both check-boxes should be activated. The mouse will then move on
the screen by a 0.25 or 0.5 m increment (or any other chosen value). The smaller the
spacing, the more precise the layout will be.
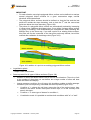
•
As soon as the user "closes" a soil cluster, it turns grey: this means that Talren 4
identifies that the cluster was closed, and that it attributed default properties
(“substratum”) to this cluster (the user will later assign another soil layer (refer to
section 4.6). These "substratum" properties are automatically created for each
project, and if they are attributed to some soil clusters when calculating, Talren 4
automatically considers that failure surfaces shouldn't enter these substratum soil
clusters.
If segments are drawn while maintaining the “Shift” button pressed, Talren 4 will
automatically draw either horizontal, or vertical lines.
The mouse coordinates are always displayed in the status bar.
The points and segments numbers can be displayed on the graphical view with the
“View” menu: items “Point numbers” and “Segment numbers” (section 3.3.2.4).
The mouse shape gives indications on the current drawing status, for example:
•
•
•
•
o
to add a new geometrical element,
o
to connect a segment to an existing point (start or end of a segment)
o
to add a point on an existing segment.
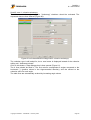
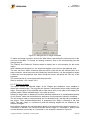
4.3.1.2. Selecting points or segments
button activates the selection mode. The selection mode is also accessible by the
The
pop up menu: right click in the graphical view.
All points and segments can be selected with the mouse (left click on an element).
Copyright TALREN 4 - TERRASOL – February 2005
Page 34
TALREN 4
B - User manual
4.3.1.3. Moving points or segments
After selection of a point or segment, it is possible to move it with the mouse by drag & drop
(left click and move the mouse to another position).
When a point of the geometry is moved, the segments that are connected to this point are
changed accordingly.
Depending on the move, additional points can be generated if necessary (movement of a
point leading to the intersection of 2 segments for example).
Refer also to section 4.3.1.5.
4.3.1.4. Deleting points or segments
After selection of one or several elements, it is possible to delete them pressing the "Del"
key, or clicking on the right mouse button and selecting "Delete" in the pop up menu.
4.3.1.5. Display and modification of the properties of a point or segment
It is possible to display the properties of an element: either by double-clicking on it, or, after
having selected it (one at a time for this operation), by right-clicking and selecting “Edit” in the
pop up menu. The relevant dialogue box is then displayed (coordinates for a geometrical
point, extreme points for a segment). It is possible to change the properties of the element,
and to validate them. The graphical display is updated if necessary.
Figure 31: properties dialogue box for a point or segment
4.3.1.6. Slope boundary
The slope boundary is by default automatically identified, as soon as geometrical lines allow
to identify a continuous polyline from Xmin to Xmax.
IMPORTANT: If no segment of the geometry reaches Xmin or Xmax, the boundary cannot be
recognised, and the project cannot be calculated.
The slope boundary is calculated by default to be the groundlevel.
It is represented with a bold line on the drawing.
Refer also to section 4.3.2.
4.3.2. "Geometry" dialogue box
This dialogue box (Figure 32) is accessible through the "Project data" menu, option
"Geometry".
Copyright TALREN 4 - TERRASOL – February 2005
Page 35
TALREN 4
B - User manual
Figure 32: geometry dialogue box (3 tabs)
This dialogue box contains 3 tabs: “Points”, “Segments” and “Slope boundary”. It enables to
view and edit the geometrical data.
However, it is not compulsory to go through this dialogue box, especially if the user chose to
define the geometry with the mouse (section 4.3.1).
The data displayed in this dialogue box are the following:
• "Points" tab:
o Numbers of the points (those are automatically attributed and cannot be edited).
o X and Y coordinates (in m) of all geometry points.
• "Segments" tab:
o Number of the segments (they are automatically attributed and cannot be edited).
o Extremities (point 1 and point 2) of each segment of the geometry: each extremity
is defined by the number of a point (as defined in the first tab).
• "Slope boundary" tab:
o "Automatic slope boundary": this checkbox is activated by default for a new file,
and deactivated by default when loading former .tal files. If activated, the slope
boundary will be automatically calculated. In the other case, it is necessary to
define manually in the table the list of segments defining the slope boundary.
IMPORTANT: it is compulsory to activate the "automatic slope boundary"
checkbox if the project includes several construction stages, with
activation/deactivation of soil clusters (and therefore possibly changes of the
slope boundary from one stage to the other): if many stages are defined when the
boundary is not “automatic”, the boundary will not be changed from one stage to
the other, and the slope boundary corresponding to the initial geometry will be
taken into account in the calculations for all stages (which can lead to errors).
o Numbers of the segments of the slope boundary (those are automatically
attributed and cannot be edited).
Copyright TALREN 4 - TERRASOL – February 2005
Page 36
TALREN 4
B - User manual
List of the segments constituting the slope boundary: this list cannot be edited if
the “Automatic slope boundary” checkbox is activated.
For all 3 tabs, "Add", "Delete" and "Delete all" buttons enable either to add a new point or
segment, or to delete the selected table line (point, segment or segment of the slope
boundary), or to delete all elements defined in the active tab. Be careful, if [Delete all] is
clicked in the Point tab for example, all points will be deleted, but all segments and slope
boundary segments will be deleted too.
On the "Points" and "Segments" tab, the mention "possible selection on drawing" means that
if you click on the graphical view while the "Points" tab is visible, for example, a new point
corresponding to the mouse position will be added in the points list (the behaviour is the
same for segments).
IMPORTANT:
• The projet should always be defined with the uphill on the left of the model (the failure
must happen from the left to the right (section 3.3.1.2), from Xmin to Xmax.
• If you defined your model in the wrong direction, you can reverse it automatically with
menu "Options", item "Reverse model" (section 3.3.1.2).
• The order of the points of a segment (left and right) is not important.
• For vertical lines: Talren 4 allows for the definition of true vertical segments. The
calculation follows the direction from the left to the right to determine whether vertical
lines are upwards or downwards. For upwards vertical lines, the program will
automatically define (the user doesn't have to care about that) a shift in X with 2 cm
between the bottom and top points of the segment (for calculation only).
o
4.4. Loads
IMPORTANT:
• A distributed load should not be defined over several segments (Figure 33). Each
distributed load must be included in one single segment. A load should be divided
into several loads (one per segment) if necessary.
• Distributed loads must be defined on the slope boundary (neither above, nor below).
• It is not necessary to define geometrical points at the extremities of distributed loads.
Load over 2 segments:
incorrect (warning when
calculating)
After correction: 2 loads
(one on each segment)
Figure 33: case of loads covering several segments
Copyright TALREN 4 - TERRASOL – February 2005
Page 37
TALREN 4
B - User manual
4.4.1. Defining loads with the mouse
4.4.1.1. Drawing distributed loads with the mouse
You should first click on the
button of the toolbar, then click with the left mouse button on
two successive points of the drawing (to define the base segment for the load), or type in the
coordinates of the two points with the keyboard (in the edition cell that appears in the status
bar, refer to section 4.3.1.1). The load is then created between the two points with a default
vertical inclination. It is displayed in red (if several distributed loads are defined, they are
scaled taking into account their intensities).
It is necessary to complete the geometrical definition of the load with the definition of the load
value. Refer to sections 4.4.1.7 or 4.4.2.1.
Figure 34: graphical display of a distributed load
4.4.1.2. Drawing linear loads and/or moments with the mouse
button of the toolbar, then click with the left mouse button at
You should first click on the
the position where the linear load and/or moment should be applied (or type in the
coordinates of the point on the keyboard). It is then created with a default vertical inclination.
It is necessary to complete the geometrical definition of the linear load/moment with the
definition of the load/moment values. Refer to sections 4.4.1.7 or 4.4.2.2.
Linear load
Moment (negative
in this case)
Figure 35: graphical display of a linear load and moment
4.4.1.3. Selecting loads
button of the general toolbar.
To activate the selection mode, click on the
All loads can be selected with the mouse (with a left click on the point or segment where the
load is applied).
4.4.1.4. Copy/paste loads
Refer to section 3.5.3.2.
Copyright TALREN 4 - TERRASOL – February 2005
Page 38
TALREN 4
B - User manual
4.4.1.5. Moving loads
After selecting a load, it is possible to move it with the mouse by drag & drop (left click and
move the mouse to another position).
When the load is moved, the geometry segments or points are not moved at the same time.
4.4.1.6. Deleting loads
After selecting one or several loads, it is possible to delete them by pressing the "Del" key, or
by clicking with the right mouse button and selecting "Delete" in the pop up menu.
4.4.1.7. Display and modification of the properties of a load
It is possible to display the properties of a load: either by double-clicking it, or, after selecting
the element, by clicking on the right mouse button and selecting "Edit" in the pop up menu.
The display of properties consists in the display of a dialogue box similar to the loads
dialogue box, but with the properties of the selected load only. It is then possible to change
the load properties, and to validate them. The graphical display is updated if necessary.
Figure 36: properties of a distributed load
4.4.2. "Loads" dialogue box
This dialogue box is accessible through the “Project data” menu, “Loads” option. It includes 2
tabs: “Distributed Loads”, “Linear loads and moments”. It allows to view and edit load
properties. For each tab, the list on the left makes it possible to view and select project loads.
In addition, for each tab, the buttons "Add", "Delete", "Duplicate" and "Delete all" allow to add
a new load (distributed or linear load/moment), to remove the selected load, to duplicate the
selected load (creation of a new load with the same properties), or to remove the whole list of
loads in the active tab (either distributed loads or linear loads/moments).
Copyright TALREN 4 - TERRASOL – February 2005
Page 39
TALREN 4
B - User manual
4.4.2.1. Distributed Loads
Figure 37: loads dialogue box: Tab 1 (distributed loads)
The data displayed for each distributed load are as follows:
• Name: by default, Talren 4 names distributed loads "Sd i", but these names can be
changed (10 characters maximum);
• Xleft and Yleft: coordinates X and Y (m) of the left point of the load;
• Qleft: value of the load in this point (pressure);
• Xright and Yright: coordinates X and Y (m) of the right point of the load;
• Qright: value of the load in this point (pressure);
• Ang/horizontal: inclination of the load (compared to the horizontal line) in degrees: by
default, the distributed loads are vertical and directed downwards (90°). It is possible
change this angle only in the case of calculations using the yield design calculation
method.
If the left and right points are not in the right order, they are automatically reversed during the
validation of the dialogue box (a warning is displayed about that).
In the case of loads applied onto vertical lines (in the case of the yield design calculation
method), the order of both end points is indifferent.
Copyright TALREN 4 - TERRASOL – February 2005
Page 40
TALREN 4
B - User manual
4.4.2.2. Linear loads / moments
Figure 38: loads dialogue box: Tab 2 (linear loads/moments)
The data displayed for linear loads and/or moments are as follows:
• Name: by default, Talren 4 names these loads "Sl i", but these names can be
changed ( 10 characters maximum);
• X and Y: coordinates (m) of the point of application of the load;
• Q: value of the load in this point (force/ml);
• Ang/horizontal: inclination of the load in degrees (compared to the horizontal line,
positive in the trigonometrical direction): by default, linear loads are vertical and
directed downwards (90°);
• Width of the base of diffusion (m) and diffusion angle (°): these 2 parameters
possibly enable to take the load into account as a fictitious anchor (refer to technical
manual).
• M: value of the additional moment (positive in the trigonometrical direction).
Each element can include either a load value, or a moment value, or both. An empty
value for Q or M is equivalent to a zero value.
Copyright TALREN 4 - TERRASOL – February 2005
Page 41
TALREN 4
B - User manual
4.5. Reinforcements
4.5.1. Introduction to reinforcements
Type
Nails
Anchors
Sollicitation
mode
Interaction
soil/reinforcement
Specific comments
Traction
+shear
Interaction soil/nail
•
Can work in calculated traction +
imposed shear (can be traction
only); this behaviour corresponds
to 80% of the nailing projects.
•
Can work with no traction +
calculated shear; this behaviour
corresponds to slope
reinforcements with piles or micro
piles.
•
Can work in calculated traction +
calculated shear.
•
Examples of specific normative
documents: french standard XP
P 94-240, Clouterre
recommendations.
•
Traction only.
•
Examples of specific normative
document: TA 95
recommendations.
•
Traction only.
•
Examples of specific normative
documents: french standard XP
P 94-220
•
Struts are considered as external
compression forces.
•
They have no direct interaction
(friction type) with the soil (but in
the calculation, a strut acts on the
forces normal to the failure
surface).
Traction
Interaction soil/anchor
Strips
(reinforced
earth,
Freyssisol
(paraweb),
VSol,
geotextiles,
geogrids, etc)
Traction
Interaction soil/strip
Struts
Compression
No interaction
Table 1: reinforcement types in Talren 4
Refer also to the technical manual (chapter C of this manual) for more information about
reinforcements.
Copyright TALREN 4 - TERRASOL – February 2005
Page 42
TALREN 4
B - User manual
4.5.2. Definition of the reinforcements with the mouse
4.5.2.1. Drawing reinforcements with the mouse
You should first click on one of the buttons of the toolbar (
for a nail,
for an anchor,
for a strip or
for a strut), then click with the left mouse button at the position of the
reinforcement head (or type in its coordinates in the edition cell of the status bar). It is
necessary to complete the definition of the reinforcement with its material and calculation
characteristics. Refer also to chapters 4.5.2.6 or 4.5.3.
Anchors
Nails
Struts
Strips
Figure 39: graphical display of reinforcements
4.5.2.2. Selecting reinforcements
of the general
To activate the selection mode, it is necessary to click on the button
toolbar.
All reinforcements can be selected with the mouse (left click on the reinforcement head).
4.5.2.3. Copy/paste reinforcements
Refer to chapter 3.5.3.2.
4.5.2.4. Moving reinforcements
After selecting a reinforcement, it is possible to move it by drag & drop with the mouse (left
click and move the mouse to another position).
When a reinforcement is moved, the points and segments of the geometry are not moved at
the same time (geometrical independence).
4.5.2.5. Deleting reinforcements
After selecting one or more reinforcements, it is possible to delete them by pressing the "Del"
key, or by right-clicking and choosing the “delete” option of the menu.
4.5.2.6. Display and modification of the properties of a reinforcement.
It is possible to display the properties of a reinforcement: either by double-clicking it, or, after
selecting it, by right-clicking and selecting “Edit” in the pop up menu. The display of the
Copyright TALREN 4 - TERRASOL – February 2005
Page 43
TALREN 4
B - User manual
reinforcement properties consists in the display of a dialogue box similar to the
reinforcements dialogue box, but specific to the selected reinforcement. It is then possible to
view and edit the reinforcement properties, and to validate them. The graphical view is
updated if necessary.
Figure 40: properties of a nail
4.5.3. "Reinforcements" dialogue box
This dialogue box is accessible through the menu "Data", option "Reinforcements". It
includes 4 tabs, corresponding to the 4 reinforcement types which Talren 4 can take into
account: nails, anchors, strips and struts. It allows for the edition of the reinforcements
properties.
For each tab, the left list makes it possible to view the project reinforcements, and to edit
their properties (select a reinforcement in the list to view its properties).
In addition, for each tab, the buttons "add", "remove", "duplicate" and "remove all" allow to
add a new reinforcement, to remove the selected reinforcement, to duplicate the selected
reinforcement (creation of a new reinforcement with the same properties), or to remove all
the reinforcements defined in the active tab. The last button, "Display database", enables to
display the reinforcements database.
Copyright TALREN 4 - TERRASOL – February 2005
Page 44
TALREN 4
B - User manual
4.5.3.1. Nails
Figure 41: reinforcements dialogue box: tab 1 (nails)
Data displayed for each nail are as follows:
• Name: by default, Talren 4 names nails "Nail i", but these names can be changed (10
characters maximum)
• X and Y coordinates (m) for the nail head;
• Length: length of the nail (m);
• Horizontal spacing (m);
• Angle/horizontal (°): default value is zero. It is positive in the case illustrated on Figure
39 (trigonometrical direction);
• Diffusion width (m) and diffusion angle (°): in general, one can define for the diffusion
width a value of 0,5 m for thin facings (reinforced concrete for example). For rigid
walls (example: diaphragm walls), one can choose 1 or 2 m. The diffusion width can
also be evaluated directly with l 0 = 4
•
4 × facing stiffness
4 EI
.
=4
ks B
soil reaction
In the case of a support plate, the plate size can be used as diffusion width. These
advices are valid for all types of reinforcements.
On the other hand, the diffusion width and diffusion angle parameters are not used
with the yield design calculation method (logarithmic spirals).
Input value of tensile strength (TR): this check box indicates whether the TR value
(tensile strength of the nail)
o Is directly input as a data (force): Figure 41,
Copyright TALREN 4 - TERRASOL – February 2005
Page 45
TALREN 4
B - User manual
o
or must be calculated based on the steel bar diameter (∅bar in m) and on the
yield stress (σe, pressure unit) (Figure 42). This second choice is the default
choice.
Figure 42: reinforcements dialogue box: tab 1 (nails)
when checkbox "Input value of tensile strength" is deactivated
•
•
qsnails from: 2 options are available: curves (default choice) and tests. The selected
option will decide which value of the partial safety factor will be applied to the value of
qsnails. Refer also to chapter 4.7.2.3 for the description of partial safety factors, and
chapter 4.6 for the application of specific safety factors;
IMPORTANT: the option "qsnails from" is automatically the same for all the nails of a
project.
Rsc calculated from qs: this checkbox indicates whether the Rsc value (pull-out
resistance per meter length of nail)
o must be calculated based on the equivalent radius (drilling or grouting radius in
m, used for the calculation of the grout perimeter) and qsnails (defined for each
soil layer, refer to chapter 4.6): Figure 41 (this first choice is the default option),
o or is directly input by the user (unit of force/m along nail): Figure 43.
Figure 43: reinforcement dialogue box: tab 1(nails)
when checkbox "Rsc calculated from qs" is deactivated
•
Calculation mode (traction/shear rule): 3 options are available
o Tcal, Cimp: calculated traction, imposed shear;
o Tnul, Ccal: zero traction, calculated shear;
o Tcal, Ccal: calculated traction and shear.
According to the selected option, the requested parameters are different.
⇒ If reinforcement mode is (Tcal, Cimp) (Figure 41), it is necessary to provide the
following data:
o Shear force varying (along nail): by default, shear force is imposed with only
one value (checkbox deactivated). But it is possible to define several values of
shear force along the nail (checkbox activated): usually, these values have
been calculated first with a pile design software.
Rcis (if checkbox "Shear force varying (along nail)" is deactivated): single
value of the nail shear force (force unit);
Variable shear wizard (if checkbox "Shear force varying (along nail)" is
activated, Figure 44). In this case, refer to the end of this chapter for the
definition of the variable shear force;
Copyright TALREN 4 - TERRASOL – February 2005
Page 46
TALREN 4
B - User manual
Figure 44: reinforcement dialogue box: tab 1 (nails)
when checkbox "Shear force varying…" is activated
Traction calculation: 2 options are available:
"external":
pull-out resistance is calculated on the part of the
reinforcement which is outside the failure surface;
"internal/external": pull-out resistance is calculated as the minimal traction
between the external and internal parts of the reinforcement with respect
to the failure surface;
⇒ If reinforcement mode is (Tnul, Ccal) (Figure 45), it is necessary to provide the
following data:
o
Figure 45: reinforcement dialogue box: tab 1 (nails)
with calculation mode (Tnul, Ccal)
o
Plastification moment: plastification moment for the reinforcement (pure
bending), calculated from the usual equation M = σ e . I
v
(at the limit of the
elastic domain, which is a simplification);
EI (unit consistent with kN.m2): reinforcement rigidity. It is possible to take into
account the addition of the steel rigidity (bars, tube, etc) and of the grout or
concrete rigidity;
o Shear calculation: 2 options are available:
"external":
shear force is calculated on the external part of the
reinforcement with respect to the failure surface;
"internal/external": shear force is calculated as the minimal shear force
between the external and internal parts of the reinforcement with respect
to the failure surface;
Note: in the case (Tnul, Ccal), TR and Rsc are not requested (corresponding cells
are hidden). But the equivalent radius should be defined.
o
Copyright TALREN 4 - TERRASOL – February 2005
Page 47
TALREN 4
B - User manual
⇒ If reinforcement mode is (Tcal, Ccal) (Figure 46), it is necessary to provide the
following data:
Figure 46:reinforcement dialogue box: tab 1(nails)
with calculation mode (Tcal, Ccal)
o
Critical angle (for soil/nail interaction): it is advised to take for example 5°. This
angle makes it possible to determine the couple traction/shear force that will be
taken into account in the principle of maximum work (please refer to the
technical manual to learn more about reinforcements);
o Plastification moment: plastification moment for the reinforcement (pure
bending), calculated from the usual equation M = σ e . I
v
(at the limit of the
elastic domain, which is a simplification);
o EI (unit consistent with kN.m2): reinforcement rigidity. It is possible to take into
account the addition of the steel rigidity (bars, tube, etc) and of the grout or
concrete rigidity;
o Traction calculation: this choice can take 2 values:
"external":
pull-out resistance is calculated on the part of the
reinforcement which is outside the failure surface;
"internal/external": pull-out resistance is calculated as the minimal traction
between the external and internal parts of the reinforcement with respect
to the failure surface;
o Shear calculation: 2 options are available:
"external":
shear force is calculated on the external part of the
reinforcement with respect to the failure surface;
"internal/external": shear force is calculated as the minimal shear force
between the external and internal parts of the reinforcement with respect
to the failure surface;
Specific option: definition of varying shear force (along nail)
If calculation mode is (Tcal, Cimp), and the checkbox "Shear force varying (along nail)" is
activated, the button" Variable shear wizard" is displayed (Figure 44). When selecting it, a
new dialogue box is opened (Figure 47):
Copyright TALREN 4 - TERRASOL – February 2005
Page 48
TALREN 4
B - User manual
Figure 47: reinforcement dialogue box: tab 1 (nails),
definition of variable shear force
A table with 11 lines should then be filled in. The first column corresponds to the linear
coordinate along the nail (starting at the reinforcement head), and the second to the value of
the shear strength for each of these coordinates. The table lines are automatically ordered by
increasing coordinate.
Copyright TALREN 4 - TERRASOL – February 2005
Page 49
TALREN 4
B - User manual
4.5.3.2. Anchors
Figure 48: reinforcements dialogue box: tab 2 (anchors)
The data displayed for each anchor are the following:
• Name: by default, Talren 4 names the reinforcements "Anchor i", but these names
can be changed (minimum 10 characters).
• X and Y: coordinates (m) of the anchor head;
• Ungrouted length (m);
• Grouted length (m);
• Horizontal spacing (m);
• Angle/horizontal (°): the default value is zero. It is positive in the case illustrated on
Figure 39 (trigonometrical direction);
• Diffusion width (m) and diffusion angle (°): please refer to the comments about nails
(section 4.5.3.1);
Copyright TALREN 4 - TERRASOL – February 2005
Page 50
TALREN 4
B - User manual
•
Tension/shear rule: 2 options are possible (illustrated on Figure 49):
o Proportional (prorata length/grout): the pull-out resistance is calculated using the
ratio of the grouted length outside the failure surface compared to the total
grouted length;
o Non proportional: the total pull-out resistance is taken into account if the failure
surface intersects the anchor before the fictive anchoring point. On the contrary,
the anchor is not taken into account at all if the failure surface intersects the
anchor after the fictive anchoring point. The fictive anchoring point is at mid-grout
length.
Prorata length/grout (proportional)
l
⎛ T
RQS × l ⎞⎟
Tcal = min⎜ R ,
⎜Γ
⎟
⎝ aanc Γqsanc × L ⎠
l
L
Non proportional
Tcal = 0
⎛ T
RQS ⎞⎟
Tcal = min⎜ R ,
⎜Γ
⎟
⎝ aanc Γqsanc ⎠
Fictive anchoring point
Figure 49: reinforcements dialogue box: tab 2 (anchors): calculation options
•
qsanchors from: 2 possible options: curves (default choice) and tests. This choice
decides the value of the safety factor applied to the anchor pull-out resistance. Also
refer to section 4.7.2.3 for the description of the partial safety factors, and section 4.6
for the application of specific partial factors;
IMPORTANT: the choice of “qsanchors from” is automatically the same for all the
anchors of a project.
•
RQS calculated with qs and α: this option is not available in this version of TALREN
4. The checkbox is always deactivated. One must therefore input the RQS value
(force): total pull-out resistance of an anchor (equal to the unit skin friction
(soil/anchor) by meter multiplied by the total grout length; be careful if the grout goes
through several soil layers with different unit skin friction values; the α factor should
also be taken into account, please refer TA 95 recommendations);
TR: tensile strength of the anchor (force), generally calculated as the steel section
multiplied by the steel yield stress.
•
Copyright TALREN 4 - TERRASOL – February 2005
Page 51
TALREN 4
B - User manual
4.5.3.3. Strips
Figure 50: reinforcements dialogue box: tab 3 (strips): strip 1
The data displayed for each strip are the following:
• Name: by default, Talren 4 names the strips "Strip i". These names can be changed
(10 characters maximum);
• X and Y: (m) coordinates of the strip head;
• Length (m) and width (m): total length and width of each strip.
• Horizontal spacing (m);
• Angle/horizontal (°): the default value is zero (horizontal strips, as illustrated on Figure
39);
• Diffusion width (m) and diffusion angle (°): refer to comments given for nails (section
4.5.3.1).
• TR: tensile strength of a strip (force);
• γbackfill: unit weight of the backfill used for the reinforcement;
•
Weighting factor : it is a matter of defining whether the unit weight of the backfill will
be considered as a favourable or unfavourable action (2 possible choices): this will
change the partial safety factor taken into account for the backfill weight. By default,
the weighting factor is minorating.
Copyright TALREN 4 - TERRASOL – February 2005
Page 52
TALREN 4
B - User manual
•
Calculation method for traction: for strips, one can consider 2 failure types because of
a lack of adherence: internal and external. Indeed, strip heads are not always
anchored, and the failure can then occur on either side of the failure surface: Talren
can (Figure 51):
o compare lint and lext lengths and calculate the minimum min(lint, lext): this
corresponds to the “internal/external” choice,
o or consider only the external length (if the strip head is anchored, in the case of
paraweb or reinforced earth for example): this corresponds to the “external”
choice (default choice).
lint
lext
Figure 51: traction calculation
•
µ0* and µ1*: unit soil/strip friction at groundlevel and at depth (> 6 m);
The values of the µ0* and µ1* parameters are given in the reinforcement specific
documentations. They are also defined in the standards and recommendations
concerning this type of reinforcements (as for example the XP P 94-220-0 french
standard, or the french document “Recommandations pour l'emploi des géotextiles
dans le renforcement des ouvrages en terre”).
Figure 52: soil/strip interaction
IMPORTANT:
• For geotextiles forming continuous levels, TR should be defined as a force/ml, with a
horizontal spacing of 1 m, a strip width of 1 m, and for example LB = 0.1 m if the
geotextile is simply placed without any anchoring system;
•
The parameters (γbackfill, weighting factor, µ0* and µ1*) have the same values for all strips.
It is therefore possible to modify them for strip 1, but not for the other strips (which
automatically take the same values for these parameters as strip 1): the corresponding
edit cells are therefore disabled for the strips other than strip 1 (Figure 53).
Copyright TALREN 4 - TERRASOL – February 2005
Page 53
TALREN 4
B - User manual
Figure 53: reinforcements dialogue box: tab 3 (strips): strip 2 and more
Copyright TALREN 4 - TERRASOL – February 2005
Page 54
TALREN 4
B - User manual
4.5.3.4. Struts
Figure 54: reinforcements dialogue box: tab 4 (struts)
The data displayed for each strut are the following:
• Name by default, Talren 4 names these reinforcements "Strut i". These names can be
changed (10 characters maximum);
• X and Y: (m) coordinates of strut head;
• Horizontal spacing (m);
• Angle/horizontal (°): default value is zero (horizontal struts, as illustrated on Figure
39); it is positive in trigonometrical direction;
• Diffusion width (m) and diffusion angle (°): refer to comments given for nails (section
4.5.3.1);
• TR: ultimate intrinsic compression strength (force). It is usually calculated as the strut
section multiplied by the yield stress.
4.6. Soil characteristics
The definition of soil properties is only possible through a dialogue box, accessible either with
the “Project data” menu, “Soil characteristics” option, or by the
button of the toolbar.
This dialogue box enables to view and edit soil properties.
The left list enables to view the project layers. When cliking on a soil layer in the list, its
properties are displayed.
Copyright TALREN 4 - TERRASOL – February 2005
Page 55
TALREN 4
B - User manual
The "Add", "Delete", "Duplicate" and "Delete all" buttons enable to add a new soil layer, to
delete the selected layer, to duplicate the selected layer (creation of a new layer with the
same properties), or to delete all project layers. Finally, the last button, "Display database",
enables to display the soils database.
Figure 55: soil characteristics dialogue box
The data displayed for each soil layer are the following:
• Name: by default, Talren 4 names each layer "Layer i", but these names can be
changed (20 characters maximum);
• Colour or pattern: it can be selected in the colour palette or in the patterns list,
depending on the display option chosen for the soil layers painting (section 3.3.2.3).
To access the colour palette, click on the coloured zone next to the “Colour” label.
•
•
•
Unit weight γ and favourable checkbox: it is the unit weight of the soil layer. The
“favourable” checkbox determines, depending on whether it is activated or not, the
partial load factor that will be applied to the unit weight (also refer to section 4.7.2.3
for a description of the partial safety factors);
Anisotropy checkbox: it is deactivated by default (no anisotropy). To take into account
a cohesion anisotropy, this checkbox should be activated, and additional data should
be defined (case 1 at the end of this section);
c, ∆c and cohesion type: respectively, cohesion at the top of the layer, cohesion
variation with depth (per meter), and choice between effective or undrained cohesion.
This last choice determines the partial safety factor that will be applied to the
cohesion value (also refer to chapter 4.7.2.3 for a description of the partial safety
factors).
Cohesion variation with depth (∆c) is taken into account according to Figure 56: the
layer thickness in each vertical slice (and not the depth compared to a horizontal
level) is used for the calculation of the cohesion at a given depth.
If ∆c is zero, cohesion is constant for the whole soil layer.
Copyright TALREN 4 - TERRASOL – February 2005
Page 56
TALREN 4
B - User manual
cslice i = c + hi x ∆c
hi
cslice j = c + hj x ∆c
hj
Layer defined by c and ∆c
Figure 56: ∆c (cohesion variation with depth)
•
"Non-linear curve" choice: the default option is "Linear", which corresponds to the
standard case. To define a non-linear shear strength curve, please refer to case 2 at
the end of this section;
•
•
ϕ (friction angle) in °;
•
qsnails and qs wizard: this line is visible only if at least one nail crosses the selected
layer. qsnails is the unit skin friction (soil/nails) for the layer. The qs wizard can help
you to define the qsnails value (also refer to section 4.7.1);
pl and KsB (pressure unit for the both parameters). These lines are only visible if at
least one nail with the (Tnul, Ccal) or (Tcal, Ccal) calculation mode crosses the selected
layer.
KsB can be calculated as a function of pressuremeter data Em and α.
4(2,65)α +3α
1
1
o For B ≤ B0 = 0,6 m:
=
K s B EM
18
α
o
For B ≥ B0 = 0,6 m:
1 = 2 B0 ⎛⎜ B 2,65 ⎞⎟ + α
K s B 9EM B ⎝ B0
⎠ 6EM
Figure 57: soil characteristics dialogue box: pl and KsB
•
Specific partial safety factors: these specific factors that can be activated with the
corresponding checkbox and defined for each layer (Figure 58). They replace, for
each layer where they are defined and activated, the corresponding values of the
partial safety factors chosen in the situations.
Copyright TALREN 4 - TERRASOL – February 2005
Page 57
TALREN 4
B - User manual
Figure 58: soil characteristic dialogue box: specific partial safety factors
This option should be used to apply different partial safety factors for various soil
layers.
Particularly, this option is activated by default when loading Talren 97 files (.tal).
Indeed, it was possible with Talren 97 to define different safety factors for each soil
layer, and the activation of the option "specific partial safety factors" for each layer
guarantees therefore that .tal files will be loaded with the correct values (section
7.1.1.5).
IMPORTANT: if specific partial safety factors are activated for a given layer:
•
The specific load factor on the unit weight (Γγ ) will be applied for the layer
whether the weight action is indicated as favourable or unfavourable;
•
In the same way, the specific partial safety factor on the cohesion (Γc) will be
applied for the layer whether the cohesion is effective or undrained.
•
Finally, the specific safety factors Γqsnails and Γqsanchors will be applied if relevant
to the pull-out resistance of the nails (Rsc) or of the anchors (RQS), whether
those are indicated as determined from curves or tests (sections 4.5.3.1 and
4.5.3.2).
When one or several layers have been created in the dialogue box and appear in the left list,
they can be assigned to soil clusters by drag & drop: click on a soil layer in the list with the
left mouse button; then without releasing the button, move the mouse onto a soil cluster;
finally release the left mouse button: the selected layer is assigned to the soil cluster and
appears in the same colour (or pattern).
It is also possible to assign soil layers to soil clusters after having closed the soil
characteristics dialogue box: in the Selection mode, click with the right mouse button on a
soil cluster, then choose “Edit” in the pop up menu. The window of Figure 59 is displayed,
and it is possible to select which layer you want to assign to the soil cluster. Talren 4
proposes the list of available soil layers for the current project.
Figure 59: properties of a soil cluster: choice of a soil characteristics set
IMPORTANT
The "Substratum" set in the list is created automatically for each project, and if it is assigned
to some soil clusters when running the calculation, Talren 4 will automatically consider that
failure surfaces shouldn't enter these substratum soil clusters.
This "Substratum" set can be selected for one or several soil cluster(s), but its properties
cannot be changed (anyway, failure surfaces cannot go through substratum clusters, and
therefore there is no need for substratum properties). "Substratum" is the default set
assigned to all new clusters (section 4.3.1.1)
Copyright TALREN 4 - TERRASOL – February 2005
Page 58
TALREN 4
B - User manual
Specific case 1: cohesion anisotropy
To define a cohesion anisotropy, the "Anisotropy" checkbox should be activated. The
requested data are then different (Figure 60).
Figure 60: soil characteristics dialogue box: cohesion anisotropy
The cohesion type is still asked for, but a new button is displayed instead of the cohesion
editing cell: “Anisotropy wizard”.
Click on this button: a new dialogue box is then opened (Figure 61).
The 8 lines should be filled in. The first column corresponds to angles compared to the
horizontal (°) (positive values in the trigonometrical direction), and the second to the
cohesion value for each angle.
The table lines are automatically ordered by increasing angle values.
Copyright TALREN 4 - TERRASOL – February 2005
Page 59
TALREN 4
B - User manual
Figure 61: cohesion anisotropy
Specific case 2: non-linear shear strength curve
To define a non-linear shear strength curve, it is necessary to activate the "Non-linear"
choice for the shear strength curve. The requested data are then modified (Figure 62).
Figure 62: soil characteristics dialogue box: choice of a non-linear shear strength curve
A new button appears to replace instead of the editing cell for the friction angle: "nonlinear
curve wizard". Click on this button: a new specific dialogue box is opened (Figure 63).
Copyright TALREN 4 - TERRASOL – February 2005
Page 60
TALREN 4
B - User manual
Between 2 and 5 lines should be filled in the table (the "Add" button is visible as long as the
table includes less than 5 lines). Each line corresponds to a (σ, τ) couple of the shear
strength curve.
The lines in the table are automatically ordered by increasing σ values.
Figure 63: non-linear shear strength curve
4.7. WIZARDS AND DATABASES
These various wizards, as indicated in the following sub-sections, use or enable to save sets
of predefined parameters.
4.7.1. Coefficient qs for nails
The qsnails wizard allows to determine the values of the unit skin friction (qsnails ) for a given
layer, depending on this layer properties. This qsnails value enables to describe the soil/nail
interaction behaviour (friction).
The qsnails value should be defined for each layer crossed by one or more nails.
This wizard is accessible by a button from the soil characteristics dialogue box (next to the
"qs nails" cell).
The user can not add new values to this wizard. The values provided in the wizard are issued
from the Clouterre recommendations (as a function of the pressuremeter data pl). They are
displayed as curves (Figure 64)
Copyright TALREN 4 - TERRASOL – February 2005
Page 61
TALREN 4
B - User manual
Figure 64: qs depending on pl
(extract from Clouterre recommendations 1991)
The user can click on a curve, and the software displays the corresponding value of qs .
• If the user validates the value (button "OK"), this value is converted into the current
unit system, and is copied to the qsnails cell of the current soil layer;
• If the user does not validate the value (button "Cancel"), the selected value is not
taken into account in the current soil layer.
The use of the wizard is not compulsory: qsnails values can also be input manually.
4.7.2. Database for partial safety factors
4.7.2.1. Principles
This wizard allows to define and save partial safety factors sets.
These partial factors are to be applied on some Talren data, and are imposed or proposed by
some standards and recommendations.
This wizard is provided with several predefined sets (Figure 76), and the user can fill it with
additional sets depending on his needs or on the standards evolutions. These predefined
sets are those proposed in the French Clouterre recommendations, and in the french
standards (XP P 94-240 and XP P 94-220-0). Traditional sets are also included.
Each standard or recommendations document usuallly provides several sets of partial safety
factors corresponding to: fundamental or accidental load combinations, standard or sensitive
sites, temporary or permanent situations. These distinctions are indicated in the title of each
predefined set.
For more details about the predefined sets, please refer to chapter 6 of the technical manual
(part C of this manual).
Copyright TALREN 4 - TERRASOL – February 2005
Page 62
TALREN 4
B - User manual
Figure 65: predefined sets of partial safety factors
4.7.2.2. Handling of the sets of partial safety factors
This database is accessible from several moments in the project analysis. In a general way,
in the Data mode, it is possible to select/view/edit/add sets of partial factors, whereas in the
Stages/calculations mode, it is only possible to select and view them (no edition allowed):
• From the General settings dialogue box (section 4.2.), the user selects which safety
factors set will be used as a default choice for calculations; among the list of sets in the
local database (this local list is empty at first when creating a new Talren file).
A button enables to display the wizard (in a separate window, Figure 66).
The list displayed on the right corresponds to the "general" database, that is shared
between all Talren projects on a computer. The list on the left corresponds to the "local"
(project) database, and includes the sets that are used for the current project. It is
possible to transfer sets from a database to the other, in both 2 directions (provided no
other set with the same name already exists in the destination list).
For example, on Figure 77, to transfer a set of safety factors from the global database to
the local database, select the set of factors in the global list on the right (1) and click on
the button "Transfer to current project" (2). The set that was last transferred is selected
by default (framed in red in the left list. Fill in the missing values for the selected set if
necessary (3). Then validate with "OK" (4).
In addition, the [Add], [Remove], and [Duplicate] buttons allow to add new sets of partial
factors, to remove the selected set, to duplicate the selected set (creation of a new set
with the same values), all these operations concerning the local database only. Finally, a
last button, [Hide database], makes it possible to hide the right part of the screen (the
global database).
Copyright TALREN 4 - TERRASOL – February 2005
Page 63
TALREN 4
B - User manual
2
1
3
4
Figure 66: partial safety factors wizard
•
•
IMPORTANT: in the screen above, the partial safety factors relating to anchors, strips
and struts are missing, because these values are not defined in the Clouterre
recommendations. The other sets of partial safety factors are not complete either (the
values defined in the various standards and recommendations alone are provided). To
be able to validate the dialogue box, it is necessary to complete each set. Once
completed, the sets can be transferred again to the global database (after changing their
name), in order to share them with other projects.
Before returning to the project general settings, it is necessary to click in the left list on
the set that that should be selected as the default set for the project, then close the
dialogue box with "OK".
With the option “Partial safety factors” from the menu “Options”: this option directly
activates the wizard, and allows the same operations as described previously (viewing
partial safety factors, and if necessary adding new sets in Data mode).
From the dialogue box for conditions properties (section 5.2.5.). It is possible to select the
set of partial safety factors that will be used for the calculation of the current situation (if
different from the project default safety factors) among the list in the local database. As
above, a button makes it possible for the user to activate the wizard: he can then view the
predefined sets, but can not add new sets (it is only possible in the “Project data” mode).
Before returning to the current conditions properties, select a set in the left list: this set will
be then selected for the properties of the current situation.
Copyright TALREN 4 - TERRASOL – February 2005
Page 64
TALREN 4
B - User manual
4.7.2.3. Detail of partial safety factors
Each set of partial factors includes the following values:
•
Γmin:
minimum safety factor to reach as a result to ensure stability (this value is
only provided for information, it is not used in calculations);
•
Γs1:
load factor for the soil unit weight, if this one is considered as unfavourable
(section 4.6.);
•
Γ's1:
•
Γphi:
load factor for the soil unit weight, if this one is considered as favourable
(section 4.6.);
partial safety factor for tan (φ);
•
Γc':
partial safety factor for effective cohesion (section 4.6.);
•
•
Γcu:
ΓQ:
partial safety factor for undrained cohesion (section 4.6.);
load factor applied for loads;
•
Γqsna ab: partial safety factor for qsnails from curves (or directly for the value of the nails
pull-out resistance when Rsc value is provided directly, section 4.5.3.1.);
•
Γqsna es: partial safety factor for qsnails from tests (or directly for the value of the nails
pull-out resistance when Rsc value is provided directly, section 4.5.3.1.);
•
Γqsan ab: partial safety factor for qsanchors from curves (or directly for the value of the
anchors pull-out resistance when RQS value is provided directly, section
4.5.3.2.);
•
Γqsan es: partial safety factor for qsanchors from tests (or directly for the value of the
anchors pull-out resistance when RQS value is provided directly, section
4.5.3.2.);
•
Γqsstrip:
partial safety factor for the soil/strip interaction parameters µ0* and µ1*;
•
•
Γpl:
Γanail:
partial safety factor for the pl values;
partial safety factor for the nails tensile strength;
•
Γaanc:
partial safety factor for the anchors tensile strength;
•
•
Γastrip:
Γbu:
partial safety factor for the strips tensile strength;
partial safety factor for the struts compression strength;
•
Γs3:
partial safety factor for the calculation method.
Please refer to the technical manual (chapter C of this manual), section 6, for additional
information about safety factors in Talren 4.
Copyright TALREN 4 - TERRASOL – February 2005
Page 65
TALREN 4
B - User manual
4.7.3. Soils database
This wizard allows to select sets of predefined soil properties and to import them in the
current project.
This wizard is provided "empty". It can be completed progressively, in order to share soil
properties between several Talren projects (but on the same computer).
This wizard is accessible:
• From the soil characteristics dialogue box (section 4.6.), when clicking on the button
“Display database” (then replaced with the button “Hide database”): a new list appears on
the right-hand side of the dialogue box (Figure 67). This right part is the "general" soils
database.
The usual list on the left can be considered as the local (project) soils database. It
includes the layers defined for the current project.
It is possible to transfer soil properties from a database to the other, in both directions,
provided that no set with the same name already exists in the destination list.
For example, to transfer a set of soil properties from the global database to the local
database: select the set you want in the global list on the right (1), and click on the
button "Transfer to the project" (2). The set of characteristics is then added to the left list,
and can be viewed, edited, validated, etc (be careful: the layer colour is usually modified
after a transfer from a database to the other).
1
2
Figure 67: soil characteristics dialogue box: general soils database
Copyright TALREN 4 - TERRASOL – February 2005
Page 66
TALREN 4
B - User manual
•
With the option "Soils database” from the "Options" menu: this option directly activates
the wizard in a separate window (Figure 68), and makes it possible to view (only) the
characteristics sets defined in the global database.
Figure 68: soils database
4.7.4. Reinforcements database
This wizard allows to select sets of predefined reinforcements and to import them in the
current project.
This wizard is provided "empty". It can be completed progressively, in order to share
reinforcements properties between several Talren projects (but on the same computer).
This wizard is accessible:
• From the reinforcements dialogue box, when clicking on the button "Display database"
(then replaced with the button "Hide database"): a new list appears on the right side of
the window (Figure 80). It is the general reinforcements database, that is shared between
all projects on the same computer.
The usual list on the left can be considered as the local (project) reinforcements
database. It includes the reinforcements defined for the current project.
It is possible to transfer reinforcements from a database to the other, in both directions,
provided that no set with the same name already exists in the destination list.
For example, to transfer a reinforcement from the global database to the local database:
select the reinforcement you want in the global list on the right (1), and click on the
button "Transfer to the project" (2). The reinforcement is then added to the left list, and
can be viewed, edited, validated, etc.
Note:
o the material characteristics of each reinforcement alone are stored in the general
database (the geometrical characteristics, for example, are not stored in the general
database).
o the reinforcements database is specific to each reinforcement type (there is a
database for the nails, another for the anchors, etc), but it is activated in the same
way for all the reinforcements.
Copyright TALREN 4 - TERRASOL – February 2005
Page 67
TALREN 4
B - User manual
2
1
Figure 69: reinforcements dialogue box: general reinforcements database
•
with the "Reinforcements database" item of the "Options" menu: this option directly
activates the wizard in a separate window (Figure 70), and enables to view (only) the
reinforcements stored in the global database.
Figure 70: reinforcements database
Copyright TALREN 4 - TERRASOL – February 2005
Page 68
TALREN 4
B - User manual
5. "STAGES/CALCULATIONS" MODE
Also refer to section 2.1.2. for a general introduction about stages and conditions.
Stage n° 1
1st excavation
Conditions n° 1
Clouterre/temporary
Conditions n° 2
Traditional
Stage n° i
excavation
Conditions n° 1
Clouterre/temporary
Permanent
stage
Conditions n° 1
Clouterre fund.
Conditions n° 2
Clouterre acc./seismic
Figure 71: stages and conditions (situations)
Important
A calculation should be performed for each individual situation of each construction stage.
The calculation for each situation of each stage is independent from the calculations for the
other situations and other stages. For example, the calculation result for situation m of stage
n does not depend on the results of stage n-1 neither on the results of situation m-1 neither
on any other result.
One should therefore run as many calculations for a project file as existing situations for all
stages of the project file. On the other hand, at least one stage and one situation should be
defined in order to run a calculation.
5.1. Stages
The construction stages enable to define within a single project file the various construction
stages of a project for which stability should be checked. A construction stage corresponds to
a cross-section of the project that should be analysed.
The changes from one stage to another correspond to a real physical evolution on the
construction site.
The stages are numbered and the numbers define the succession of the stages.
Each stage is defined incrementally compared to the previous stage (or compared to the
initial state of the project for the first stage). In other words, you only have to define for stage
n what was modified compared to stage n-1: groundlevel change, activation of
reinforcements or loadss, hydraulic conditions, etc.
Most possible actions for stages definition are accessible with the pop up menu (right-click
on the stage label).
5.1.1. Principles
After completing the definition of the project data (data mode), you switch to the
stages/calculation mode, and the first stage is automatically generated (one must define at
Copyright TALREN 4 - TERRASOL – February 2005
Page 69
TALREN 4
B - User manual
least one stage to be able to make a calculation). It is therefore not necessary to add or
insert this first stage.
The user can then:
• Either keep to this single stage, which corresponds for example to the permanent
stage of the project.
• Define (add/insert) many successive stages: the numbers of the phases are defined
automatically by the software when creating each phase.
Table 2 provides an example of a succession of construction stages.
Stage n°
Settings associated to each stage
Summary of the elements taken into
account for the display and
calculation of this stage
Project data
Initial groundlevel
Nails n° 1, 2 et 3
Load n° 1
(no calculation allowed in data mode)
1
GL 1 (deactivation of soil clusters = excavation)
Hydraulic conditions stage 1
Activation of nail level n° 1
Activation of load n° 1
GL 1
Hydraulic conditions 1
Nail n° 1
Load n° 1
2
GL 2 (deactivation of additional soil clusters =
excavation)
Hydraulic conditions stage 2 (*)
Activation of the nail level n° 2
GL 2
Hydraulic conditions 2
Nails n° 1 et 2
Load n° 1
3
GL 3 (deactivation of additional soil clusters =
excavation)
Hydraulic conditions stage 3 (*)
Activation of the nail level n° 3
Deactivation of load n° 1
GL 3
Hydraulic conditions 3
Nails n° 1, 2 and 3
4
GL 4 (deactivation of additional soil clusters =
excavation)
Hydraulic conditions stage 4 (*)
Deactivation of nail n° 1
GL 4
Hydraulic conditions 4
Nails n° 2 and 3
(*) The hydraulic conditions for all stages can be identical or not.
Table 2: example of construction stages
5.1.2. Adding a new stage
The "Add a new stage" option of the "Stages and conditions" menu allows to create a new
stage that is added as the last stage (no matter which stage is selected when adding the
stage). This operation is also possible with a right click on an existing stage (“Add a stage”
item in the pop up menu).
Copyright TALREN 4 - TERRASOL – February 2005
Page 70
TALREN 4
B - User manual
When adding a new stage (other than the first stage), it is generated to be identical to the
stage immediately above in the list. The user can then define the changes compared to this
preceding stage:
• Modification of the groundlevel (excavation, embankment, etc): activation or
deactivation of soil clusters (section 5.1.4.1);
• Association of different soil properties (simulating soil substitution or soil improvement
for example): the soil properties assigned with each soil cluster can be modified in a
given stage. But all necessary soil properties must be available, i.e. must have been
defined in the “Data” mode (section 5.1.4.2);
• Activation or deactivation of loads: distributed loads, linear loads/additional moments
(section 5.1.4.3). Deactivation can of course only be selected for active loads;
• Activation or deactivation of reinforcements: nails, anchors, strips or struts (section
5.1.4.4). Deactivation can of course only be selected for active reinforcements;
• Change of hydraulic conditions (section 5.1.4.5);
Stage 1
Data automatically generated when creating stage 1
All soil clusters are active
Same soil properties as in data mode
No load activated
No reinforcement activated
No hydraulic conditions
Stage n
Data automatically generated when creating stage n
Active soil clusters (n) = Active soil clusters (n-1)
Associated soil properties (n) = Associated soil properties (n-1)
Active loads (n) = Active loads (n-1)
Active reinforcements (n) = Active reinforcements (n-1)
Hydraulic conditions (n) = Hydraulic conditions (n-1)
Changes defined by user
Changes defined by user for stage n
Data used for display and calculations in stage 1
Active soil clusters after potential activ./deactiv. for stage n
Associated soil properties after potential user-defined changes for stage n
Reinforcements activated in stage 1
Loads activated in stage 1
Hydraulic conditions defined for stage 1
Data used for display and calculations in stage n
Active soil clusters after potential activ./deactiv. for stage n
Associated soil properties after potential user-defined changes for stage n
Active reinforcements after potential activ./deactiv. for stage n
Active loads after potential activ./deactiv. for stage n
Hydraulic conditions after potential user-defined changes for stage n
Figure 72: definition of successive stages
Figure 72 illustrates what happens when defining a stage:
• Hydraulic conditions are defined and stored independently for each stage, even if
they are identical to those of the previous stage (it is the case by default);
• Association of soil properties with soil clusters is defined and stored independently for
each stage, even if it is identical to the one of the previous stage (it is the case by
default);
• Other elements (soil clusters, loads and reinforcements) are just activated or
deactivated, but their properties are stored with general data.
It is possible to change the name of the new stage, either with the pop up menu (right click
on the stage label, and “Rename” item from the pop up menu), or with a first click on the
stage label to select it, and then a 2nd click to change this label. After changing the name, the
number of the stage will automatically be added to the new name.
5.1.3. Inserting a new stage
The "Insert a new stage" item of the "Stages and conditions" menu enables to create a new
stage and to insert it before the selected stage. This operation is also possible with a right
click on the label of the stage before which the new stage should be inserted (“Insert a new
stage” in the pop up menu).
The insertion of a stage at position n leads to an automatic shifting of all stages from the
potition n, and of all data and operations defined for these stages: activation/deactivation of
soil clusters, loads and of reinforcements, association of soil properties, hydraulic conditions.
Copyright TALREN 4 - TERRASOL – February 2005
Page 71
TALREN 4
B - User manual
The phase inserted at position n is generated to be identical to the stage before which it is
inserted (the one which becomes number n+1).
The shift of the numbers of the stages following the inserted stage and the numbering of the
new stage are made automatically.
Data automatically generated for inserting stage n
(based on data of stage n+1)
Active soil clusters (n) = Zones de sol actives (n+1) (*)
Asscoiated soil properties (n) = Associated soil properties (n+1)
Active loads (n) = Active loads (n+1) (*)
Active reinforcements (n) = Active reinforcements (n+1) (*)
Hydraulic conditions (n) = Hydraulic conditions (n+1)
Before insertion
of stage n
After insertion
User-defined changes for stage n
Stage n
(*) : no activation/deactivation generated by default
Stage n-1
Stage n-1
Stage n
Stage n+1
Data in stage n+1
= data shifted from stage n
Data defined in stage n-1
Active soil clusters (n-1)
Associated soil properties (n-1)
Active loads (n-1)
Active reinforcements (n-1)
Hydraulic conditions (n-1)
Same behviour for
following stages
Active soil clusters (n+1) = Active soil clusters (n)
Associated soil properties (n+1) = Associated soil properties (n)
Active loads (n+1) = Active loads (n)
Active reinforcements (n+1) = Active reinforcements (n)
Hydraulic conditions (n+1) = Hydraulic conditions (n)
Figure 73: insertion of a stage at position n
The user can then define changes for the new stage n (section 5.1.4).
It is possible to change the name of the new stage, either with the pop up menu (right click
on the stage label, and “Rename” item from the pop up menu), or with a first click on the
stage label to select it, and then a 2nd click to change this label. After changing the name, the
number of the stage will automatically be added to the new name.
5.1.4. Definition or modification of the stage properties
The stage properties and the way to define them are presented hereafter:
5.1.4.1. The slope geometry and boundary
It is possible, in each stage, to activate and/or deactivate soil clusters in the model. The
geometrical limits of all soil clusters to be used have to be defined in the “Data” mode.
To activate/deactivate a soil cluster, the user can:
o Either click on the soil cluster to activate/deactivate: this soil cluster will be
alternatively activated then deactivated, etc.
o Or click with the right mouse button in the soil zone to activate/deactivate, to display
the pop up menu, and then choose the option “Activate/Deactivate”.
The deactivated soil clusters are displayed with a white background.
5.1.4.2. Association of soil properties with soil clusters
It is possible, for each stage, to modify the soil characteristic sets attributed to soil clusters (to
simulate a substitution or a soil improvement for example). All the characteristic sets to be
used must have been previously defined in the “Data” mode.
To change the soil properties assigned to a cluster, the user can:
Copyright TALREN 4 - TERRASOL – February 2005
Page 72
TALREN 4
B - User manual
o
o
Either open the table of soil characteristics, with the “View” menu (option “Table of
soil characteristics”). It is then possible to drag & drop soil properties to soil clusters.
Or click with the right mouse button in the soil cluster for which he wants to change
the soil properties (choose "Edit" in the pop up menu): the list of available layers is
displayed (Figure 74).
Figure 74: modification of the soil properties for a soil cluster,
with the pop up menu
IMPORTANT
The "substratum" properties which appear in the list are created automatically for
each project, and if assigned to some soil clusters when calculating, they
automatically prevent failure surfaces from entering these substratum clusters.
These "substratum" properties can be selected, but can never be viewed or changed
(anyway, failure surfaces cannot go through this layer, and there is therefore no need
for substratum properties).
The "substratum" properties are the default properties assigned to new soil clusters
(section 4.3.1.1)
5.1.4.3. Active loads
It is possible to activate loads defined in the "Data" mode, and/or to deactivate loads already
activated in the previous stages.
To activate/deactivate a load (distributed or linear/moment), the user can:
o Either click on the load to activate/deactivate (on the baseline or on the application
point of the load): this load will alternatively be activated then deactivated, etc.
o Or click with the right mouse button on the load to activate/deactivate (on the baseline
or on the application point of the load), to display the pop up menu, then choose the
menu option "Activate/Deactivate".
The deactivated loads appear in grey. The active loads are displayed in red.
5.1.4.4. Active reinforcements
It is possible to activate reinforcements defined in the "Data" mode, and/or to deactivate
reinforcements already activated in the previous stages.
To activate/deactivate a reinforcement (nail, anchor, strip or strut), the user can:
o Either click on the reinforcement to activate/deactivate: this reinforcement will
alternatively be activated then deactivated, etc.
o Or click with the right mouse button on the reinforcement to activate/deactivate, to
display the pop up menu, then choose the menu option “Activate/Deactivate”.
The deactivated reinforcements appear in grey.
5.1.4.5. Hydraulic conditions
Hydraulic conditions can be displayed with the "Stages and conditions" menu, option
"Hydraulic conditions for the selected stage", with the same option in the pop up menu (right
click on the stage label), or with the
Copyright TALREN 4 - TERRASOL – February 2005
button of the contextual toolbar.
Page 73
TALREN 4
B - User manual
A dialogue box is opened (Figure 75), and several options are available.
Figure 75: hydraulic conditions dialogue box
•
Phreatic line (i.e. groundwater level): select the “Phreatic level” option (Figure 75),
and click on the “Define phreatic level” button. A new dialogue box opens (Figure 76),
and enables to type in the points defining the groundwater level.
Figure 76: definition of the groundwater level
This dialogue box behaves in the same way as the "Geometry" dialogue box, "Points"
tab (section 4.3.2): "Add", "Delete" and "Delete all" buttons enable to add a new point,
to delete the selected point, or to delete all points defined for the groundwater level.
The "Possible selection on drawing" comment means that if you click on the graphical
view, a new point corresponding to the mouse position will be added to the points list
(the Ang column should be filled in for these new points).
Copyright TALREN 4 - TERRASOL – February 2005
Page 74
TALREN 4
B - User manual
The groundwater level is displayed with a thin blue line and classic symbols (blue
triangles, Figure 77).
External water level
Water table base
Groundwater level
Figure 77: graphical display for phreatic line
The data displayed in the groundwater dialogue box are the following:
o Number of the points (those are attributed automatically and cannot be edited);
o X and Y coordinates in m of all points describing the groundwater level;
o Ang (°): angle between the equipotential line (i.e. all the points have a constat
head on a line) passing through the (X, Y) point and the vertical line (the angle is
positive when contrary to trigonometrical direction).
IMPORTANT:
o The groundwater level should always be defined from Xmin to Xmax.
o The points of the groundwater level are automatically ordered by increasing X
values when validating the dialogue box: if you define a zigzag for the
groundwater level (by typing or drawing), it will automatically be “straightened”
when validating the dialogue box. In the same way, if you add a point to an
existing groundwater level, this point will first seem to be connected to the last
point previously defined, but will be ordered after validation of the dialogue box
(Figure 78).
Inserted point
Before validation
After validation
Figure 78: adding a point to an existing groundwater level
•
It is possible to define a water table base, by activating the corresponding checkbox
(Figure 79).
Copyright TALREN 4 - TERRASOL – February 2005
Page 75
TALREN 4
B - User manual
Figure 79: activation of a water table base and an external phreatic line
If water table base is defined, the groundwater is supposed to extend to infinity
downwards.
If the checkbox is activated, the button "Define base of water table" is displayed. Click
it. A new dialogue box opens (Figure 80), and enables to type in the points defining
the water table base.
This window behaves in the same way as the dialogue box for the groundweter level
definition (previous section).
Figure 80: definition of the water table base
Copyright TALREN 4 - TERRASOL – February 2005
Page 76
TALREN 4
B - User manual
The data requested in this dialogue box are the following:
o Numbers of the points (those are automatically attributed and cannot be edited);
o X and Y coordinates in m of all points describing the water table base;
The water table base is displayed with a thin blue dotted line (Figure 77).
IMPORTANT: external phreatic line
If the groundwater level is at least partially "out of the slope", it is compulsory to
activate the option "Define an external phreatic line" (Figure 79).
If this option is activated, the button “Define the external phreatic line” is displayed.
Click it. A new dialogue box opens (Figure 81), and enables to type in the points
defining the external phreatic line.
This window includes a checkbox “Automatic calculation”: this option is activated by
default for new projects.
o If it is activated, the user cannot modify the table: the external groundwater
level will be automatically calculated (the program will compare the
groundwater level and the slope boundary).
o If it is not activated, the user should define manually the external groundwater
level. The table behaves in the same way as the one for the groundwater level
definition (previous sections).
Figure 81: definition of an external phreatic line
The data requested in this dialogue box are the following:
o Numbers of the points (those are automatically attributed and cannot be edited);
o X and Y coordinates in m of all points describing the external phreatic line;
The external phreatic line is displayed with a bold blue line (Figure 77).
Copyright TALREN 4 - TERRASOL – February 2005
Page 77
TALREN 4
B - User manual
•
Hydraulic data along polygonal failure surfaces: the option “Hydraulic data along with
polygonal failure surface definition” should be selected (Figure 82). This option cannot
and should not be used except in the case of polygonal failure surfaces (it cannot be
combined with circular failure surfaces or logarithmic spirals).
No other data is then requested in this dialogue box: additional data will be requested
when defining the polygonal failure surfaces (section 5.2.5.4, and example of Figure
83).
Figure 82: definition of hydraulic conditions:
data along polygonal failure surfaces
Figure 83: definition of hydraulic pressures along polygonal failure surfaces
No specific graphical display is associated with this type of hydraulic conditions.
IMPORTANT: external phreatic line
If the groundwater level is at least partially "out of the slope", it is compulsory to
activate the option "Define an external phreatic line" (Figure 79).
Copyright TALREN 4 - TERRASOL – February 2005
Page 78
TALREN 4
B - User manual
•
If this option is activated, the button “Define the external phreatic line” is displayed.
Click it. A new dialogue box opens (Figure 81), and enables to type in the points
defining the external phreatic line.
Refer to the previous section for more information about this dialogue box. In addition,
please note that the automatic calculation option for the external groundwater level
cannot be used in the case of hydraulic data defined along the failure surface (the
automatic calculation of the external groundwater level is correct only with the
"phreatic level" option).
Triangular mesh of pore pressures: select the relevant option in the top list (Figure
84).
The additional parameter “Subdivisions for calculation” is requested, its default value
being equal to 5: it enables a “pre-classification” of the triangles in a number of zones
(the parameter corresponds to the number of these zones), which accelerates the
calculations in the case of hydraulic meshes of pore pressures (please refer to the
technical manual for more information about this parameter)
The triangular mesh can be defined manually.
To do so, click on the button “Define nodes and triangles”.
Figure 84: definition of a triangular pore pressures mesh
The dialogue box of Figure 85 then appears, with 2 tabs: "Nodes" and "Triangles".
Copyright TALREN 4 - TERRASOL – February 2005
Page 79
TALREN 4
B - User manual
Figure 85: definition of the pore pressures mesh (points and triangles)
This window is similar to the "Geometry" dialogue box (section 4.3.2): "Add", "Delete",
and "Delete all" buttons enable for each tab to add a new point or triangle, to delete
the selected point or triangle, or to delete all defined points and/or triangles. Be
careful, you delete all points, then all triangles will be deleted too.
Note: it is possible to define these points and triangles on the graphical view.
The data requested in the dialogue box are the following:
o "Points" tab:
Numbers of the nodes (those are allocated automatically and cannot be
edited).
X and Y coordinates in m for each node.
u: value of pore pressure for each node (pressure).
o "Triangles" tab:
Numbers of the triangles (those are allocated automatically and cannot be
edited).
Points 1, 2 and 3 constituting each triangle: each point number refers to a
point defined in the 1st tab.
An example of hydraulic mesh display is given on Figure 86 (blue points and triangles
in thin blue dot line).
Copyright TALREN 4 - TERRASOL – February 2005
Page 80
TALREN 4
B - User manual
Figure 86: example of the graphical display for a hydraulic mesh
In the case of dams for example, it is sometimes necessary to first calculate the pore
pressure mesh with a specific program (finite element type). The results of this
hydraulic calculation can be imported into Talren 4 as a triangular mesh. Talren 4
enables to easily import pore pressure meshes resulting from a 2D finite element
calculation made with Plaxis v8 software.
To use this option, click on the “Import Plaxis mesh” (Figure 84).
2 dialogue boxes appear successively and request:
o The Plaxis file which includes the calculated pore pressures (Figure 87). Be
careful: the Plaxis files generated for a given Plaxis project include a
project.plx file, and a project.DTA directory, that itself contains a copy of the
project.plx file. The project.plx file that should be selected is the one "outside"
the project.DTA directory (and not the one inside this directory);
o The calculation step from which the pore pressures should be imported
(Figure 88). Talren 4 automatically proposes the list of Plaxis v8 calculation
steps available for the selected plx file (this may take a few seconds): you
should select one of these available calculation steps.
Figure 87: choice of the Plaxis file for pore pressures importation
Copyright TALREN 4 - TERRASOL – February 2005
Page 81
TALREN 4
B - User manual
Figure 88: choice of the calculation step for pore pressures importation
After the validation of this 2nd dialogue box, the importation is performed, and the user
can then either directly validate the imported mesh, or view the list of nodes and
triangles, by clicking on the “Nodes and triangles” button.
IMPORTANT
• The u value that is imported from Plaxis v8 for each node is the value of the
active pore pressure pactive (with change of sign, to make this data compatible with
a Talren calculation) at the end of the selected calculation step. In Plaxis v8, the
active pore pressure corresponds to the total pore pressure (permanent pore
pressure + possible excess pore pressure).
• The imported triangles are the same as the triangles of the Plaxis mesh (same
number).The imported nodes are the extreme nodes of the triangles (3 nodes per
triangle).
• It is not possible to import pore pressures of Plaxis calculation step 0 (file .000),
i.e. from the Plaxis initial conditions pore pressures. If you select this file, the
importation will not work properly.
Note: there is no limit for the number of points and triangles that you can define or
import. However, the more nodes and triangles you define or import, the longer the
display and calculation times will be.
IMPORTANT: external phreatic line, example of Figure 86:
If the groundwater level is at least partially "out of the slope", it is compulsory to
activate the option "Define an external phreatic line" (Figure 79).
If this option is activated, the button “Define the external phreatic line” is displayed.
Click it. A new dialogue box opens (Figure 81), and enables to type in the points
defining the external phreatic line.
Refer to the previous section for more information about this dialogue box. In addition,
please note that the automatic calculation option for the external groundwater level
cannot be used in the case of hydraulic data defined along the failure surface (the
automatic calculation of the external groundwater level is correct only with the
"phreatic level" option).
Copyright TALREN 4 - TERRASOL – February 2005
Page 82
TALREN 4
B - User manual
•
ru coefficients for soil layers (refer to the technical manual for the meaning of this
parameter): this option can be used alone (Figure 89, hydraulic conditions: “none”), or
in addition to one of the types of hydraulic conditions described before.
In this last case (combination of ru coefficients with another mode of definition of
hydraulic conditions), the rule applied for the calculation is the following:
o For each slice, the calculation checks which soil layer is present at the bottom
of the slice axis.
o If a value of ru different from zero has been defined for this layer, the
calculation of the pore pressure u at the bottom of the slice is based on ru
coefficient (refer to the technical manual).
o But if the value of ru defined for this layer is equal to zero, then the calculation
of the pore pressure at the bottom of the slice is based on the other mode of
hydraulic conditions possibly defined (phreatic level, pressures along
polygonal failure surfaces or triangular mesh).
It is therefore possible for example to take into account the ru coefficients inside a
dike, and the groundwater level for the soil layers underneath the dike.
In all cases (ru used alone or in combination with one of the other types of hydraulic
conditions), it is possible to define in addition an external groundwater level (refer to
the other types of hydraulic conditions in the previous paragraphs for the definition of
an external groundwater level).
Figure 89: definition of ru coefficients for soil layers
Activate the ru checkbox. The button “Define ru coefficients” is displayed. Click it: the
window of Figure 90 appears.
Copyright TALREN 4 - TERRASOL – February 2005
Page 83
TALREN 4
B - User manual
Figure 90: ru coefficients for soil layers
This dialogue box automatically displays the list of the project soil layers (1st column),
that cannot be edited. The user should fill in the value of ru for each layer (default
value of ru for each layer is zero).
A button at the bottom of the dialogue box enables if necessary to reset ru values for
all layers to zero (for the current active stage only).
No specific graphical display is associated with ru coefficients.
5.1.4.6. Comments for a stage
It is possible to define comments specific to each stage (text zones), that will appear on the
graphical view in the "Stages/Calculations” mode, depending on the active stage.
This option is accessible when a stage is selected, through the "Stages and conditions"
menu, option “Comments for the selected stage” or with a right mouse click on the stage, and
then the same option in the pop up menu. It enables to define or modify any number of
comments for the selected stage.
Copyright TALREN 4 - TERRASOL – February 2005
Page 84
TALREN 4
B - User manual
Figure 91: dialogue box for stage comments
To add a new stage comment, click on the "Add" button, then define the comment text on the
new line in the table. To change an existing comment, click on the corresponding line and
change the text.
The "Delete" and "Delete all" buttons enable to delete one or all comments (for the active
stage).
After validating the dialogue box, the comments appear in blue font on the graphical view.
The user can move these comments with the mouse (click with the left mouse button on a
stage comment, move the mouse and release the mouse button). It is also possible to delete
a comment from the graphical view: select it with the mouse, and press the “Del” key of the
keyboard.
The comments are of course saved with the project file.
Refer to sections 3.3.2.6 and 5.2.5.5.
5.1.5. Deleting a stage
The option "Delete the selected stage" of the "Stages and conditions” menu enables to
delete the selected stage. The program will request a confirmation before really deleting the
stage. This operation is also possible with a right mouse click on the label of the stage to be
deleted (option “Delete selected stage” in the pop up menu).
Deleting a stage leads to deleting the actions and data attached to it: activation/deactivation
of soil clusters, loads and reinforcements, attribution of soil properties, hydraulic conditions.
The soil clusters, loads or reinforcements are not deleted though, and will still be available in
the project. Their activation/deactivation is postponed from stage n (deleted) to the next
stage. This way, stage n+1 (renamed n) and the following stages are not affected by the
removal of stage n.
Let's take the example of a nail activated in phase n (and therefore also active in phase n+1).
This stage n is deleted. The nail should still be active in stage n+1 (renamed n), and so must
now be activated in this stage n+1 (renamed n). An example is shown on Figure 92.
Copyright TALREN 4 - TERRASOL – February 2005
Page 85
TALREN 4
B - User manual
However, hydraulic conditions and association of soil properties with soil clusters previously
defined in the deleted stage are really deleted, because they are stored independently for
each stage (and therefore in particular for stage n+1 renamed n).
The shifting of the stages numbers following the removed stage is made automatically.
After deletion of stage n
Stage n-1
Stage n-1
Nail activated in stage n-1
Nail activated in stage n-1
Stage n
Nail activated in stage n-1
Nail activated in stage n
Stage n (previously n+1)
Nail activated in stage n-1
Soil cluster deactivated
in stage n
Nail activated in stage n
Nail activated in stage n
Soil cluster deactivated
in stage n
Soil cluster deactivated
in stage n
Stage n+1
Nail activated in stage n-1
Nail activated in stage n
Nail activated in stage n+1
Soil cluster deactivated
in stage n
Soil cluster deactivated
in stage n+1
Figure 92: example of a stage removal
Copyright TALREN 4 - TERRASOL – February 2005
Page 86
TALREN 4
B - User manual
Data removed when deleting stage n
Activations/deactivations of soil clusters (n)
Association of soil properties (n)
Activations/deactivations of loads (n)
Activations/deactivations of reinforcements (n)
Hydraulic conditions (n)
Before deleting
stage n
After deleting
Stage n
Stage n-1
Stage n-1
Stage n+1
Stage n
Data defined for stage n-1
Active soil clusters (n-1)
Associated soil properties (n-1)
Active loads (n-1)
Active reinforcements (n-1)
Hydraulic conditions (n-1)
Same thing for the
following stages
Data for stage n
= data shifted from stage n+1
Active soil clusters (n) = Active soil clusters (n+1) (*)
Associated soil properties (n) = Associated soil properties (n+1)
Active reinforcements (n) = Active reinforcements (n+1) (*)
Active loads (n) = Active loads (n+1) (*)
Hydraulic conditions (n) = Hydraulic conditions (n+1)
(*) : including objects activated/deactivated on previous stage n
Activated objects (n) = Activated objects (n+1) + activated objects (n)
For example, on figure 92, the nail n is still there after deleting stage n,
although it was previously activated in stage n that is deleted.
Figure 93: deleting stage n
5.2. Situations (i.e. conditions)
Calculation situations (or conditions) enable to perform several different calculations for a
same construction stage (i.e. a same cross-section): different types of failure surfaces,
different partial safety factors, calculation with and without seismic accelerations for example,
etc.
As opposed to stages, the situations are not defined incrementally: they are defined
independently from one another, and are simply numbered to enable the user to refer to
them.
Situations do not correspond to a true physical evolution of the construction site, but to
different calculation assumptions (or conditions).
Most possible actions relative to situations are accessible through the corresponding pop up
menu (right click on a situation label).
Copyright TALREN 4 - TERRASOL – February 2005
Page 87
TALREN 4
B - User manual
Stage n
Conditions 1
Data defined for conditions 1
Calculation method
Partial safety factors
Seismic accelerations
Failure surfaces exploration
Conditions i
Data defined for conditions i
Calculation method
Partial safety factors
Seismic accelerations
Failure surfaces exploration
Figure 94: definition of several situations for a same stage
5.2.1. Principles
For each construction stage, a first set of conditions is generated automatically (at least one
situation is necessary to perform calculations). The user then decides whether to create
additional situations or not.
The situations are numbered automatically one after the other.
Once a situation is created (added), the user can define the following data for each of them:
• Calculation method;
• Partial safety factors;
• Seismic accelerations;
• Failure surfaces and associated parameters;
5.2.2. Adding a new set of conditions
The option "Add a new set of conditions" of the “Stages and conditions” menu enables to
create a new situation which is added at the end of the situations list for the active stage (no
matter which situation was selected when adding a new one). This operation is also possible
with a right click on an existing situation, and the option “Add a new set of conditions” in the
pop up menu.
Once the situation is created, it is possible to change its settings (section 5.2.5).
It is possible to the change the name of a situation, either with the pop up menu (right click
on the situation label, option "Rename"), or with a first click on the situation label to select it,
and a 2nd click to change this label. After changing the name, the number of the situation will
be added automatically to the new name.
5.2.3. Duplicating a set of conditions
The option "Duplicate the selected set of conditions" of the “Stages and conditions” menu
enables to create a new set of conditions in the same stage (added in the last position for the
active stage), with the same settings as the duplicated situation. This operation is also
possible with a right click on the situation to duplicate, and the choice “Duplicate the selected
set of conditions“ in the pop up menu.
Once the situation created, it is possible to change its settings (section 5.2.5).
Copyright TALREN 4 - TERRASOL – February 2005
Page 88
TALREN 4
B - User manual
5.2.4. Copy/paste a situation
The "Copy" option is accessible by a right click on the situation to be copied. After this
operation, the “Paste” option in the same pop up menu is activated: it is possible to paste the
copied situation either in the same stage, or in a different stage: in any case, the pasted
situation is added in last position for the selected stage, and has the same settings as the
copied situation.
Once the situation is pasted, it is possible to change its settings (section 5.2.5).
5.2.5. Definition or modification of the conditions settings
The conditions settings can be displayed with “Stages and conditions” menu and the “Define
selected set of conditions” option, with the same option in the pop up menu (right click on the
button of the contextual toolbar. A dialogue box is opened
situation label), or with the
(Figure 95). It is detailed in the following sub-sections.
Figure 95: conditions dialogue box
5.2.5.1. Calculation options
Four calculation methods are available: Fellenius, Bishop, Perturbations and yield design
calculation.
The default calculation method is the one defined in the project general settings (section 4.2),
but it is possible to change it individually for each situation.
The saving option for detailed slice results determines the size of the results files: you can
either save the detailed slice results for the critical failure surface only (recommended and
default option), save the detailed slice results for all calculated failure surfaces (load and
display times will increase), or on the contrary, save no detailed slice results at all. Also refer
to section 6.4.3.
5.2.5.2. Partial safety factors
A set of partial safety factors should be selected from the list of available sets (i.e. the sets
that are stored in the local project database, refer to section 4.7.2.2).
Copyright TALREN 4 - TERRASOL – February 2005
Page 89
TALREN 4
B - User manual
The partial safety factors wizard can be activated with the corresponding button to view the
partial safety factors values (but edition is not allowed, because edition is possible only in the
Data mode, refer to section 4.7.2.2).
The default set is the one selected in the project general settings, if any (section 4.2).
5.2.5.3. Seismic data
Seisms can be taken into account in TALREN 4 by the pseudo-static method (please refer to
the technical manual for more information about the calculation method).
To use this option, the “Seismic characteristics” checkbox should be activated.
Additional data will then be requested (Figure 95):
• ah/g (no unit): ratio horizontal acceleration / gravity;
• av/g (no unit): ratio vertical acceleration / gravity;
IMPORTANT:
• These accelerations can be positive (downwards or towards the right) or negative. It
is generally advised to test the 4 possible signs combinations to check which
combination is the most unfavourable.
• The horizontal acceleration is taken into account only for the soils and the "internal"
phreatic level.
• The vertical acceleration is applied to the soils, the linear and distributed loads, and
both the external and internal water levels.
5.2.5.4. Failure surfaces
They can be circular (manual or automatic search), polygonal, or logarithmic spirals.
The requested data depend on the search type, and are described for each case hereunder.
• Circular failure surfaces (manual mode): “Circular surfaces” choice and “Manual” search
type (Figure 95).
When clicking on the button “Define failure surfaces”, the dialogue box of Figure 96 is
displayed.
Figure 96: failure surfaces dialogue box: circular failure surfaces, manual search
The manual grid for the circles centres should be defined. For each centre, several
circles may be calculated using different radius values.
The data requested in this dialogue box are the following:
• X and Y: (m) coordinate of a corner of the centres grid. They can be defined:
o Either by defining X and Y values (m) in the corresponding cells;
o
Or by clicking on the
view.
Copyright TALREN 4 - TERRASOL – February 2005
button, and then clicking the point on the graphical
Page 90
TALREN 4
B - User manual
•
X and Y increments: distance (m) between 2 adjacent centres following the X and Y
axis;
X increment
Y increment
X, Y
Figure 97: manual search for circular failure surfaces
•
•
•
•
•
•
Angle/horizontal and angle/vertical: "Inclinations" of the grid axis compared to the
horizontal and to vertical lines (trigonometrical direction);
Number of centres to explore in X and Y directions;
Increment for circle radius (m): value (positive or negative) of the radius increment;
Number of increments for circle radius: maximum number of circles (with different
radii) calculated for each centre;
Min Abs. for emergence XL (m): value of the abscissa beyond which the failure
surfaces are not taken into account, if these surfaces are completely on the left of the
XL position. The XL value enables, in the case of complex slopes, to avoid some
undesired circles. The position of the minimum abscissa for emergence is displayed
on the graphical view (at the bottom) with the
symbol.
Search type: 3 choices are available (Figure 96): imposed passage point, first circle
intercepting slope, and tangent to top of layer. This choice is used to calculate the
radius of the first circle associated with each centre. For the other circles associated
with the same centre, the radius is determined by incrementation (positive or
negative) of the radius (and the criterion is therefore no longer applied).
Depending on this option, the requested data will vary:
o Imposed passage point: in this case, this imposed passage point should be
defined:
Either typing X and Y values in the edition cells;
o
o
•
Or by clicking on the
button, then on the position for the imposed
passage point on the graphical view.
First circle intercepting slope: in this case, no additional parameter is requested.
Tangent to top of layer: in this case, the tangency layer should be selected among
the list of the project layers.
Circular failure surfaces (automatic search): “Circular surfaces” choice and “Automatic”
search type (Figure 98).
Copyright TALREN 4 - TERRASOL – February 2005
Page 91
TALREN 4
B - User manual
Figure 98: failure surfaces dialogue box: circular failure surfaces, automatic search
When clicking on the “Define failure surfaces” button, the dialogue box of Figure 99 is
displayed.
Figure 99: failure surfaces dialogue box: circular failure surfaces, automatic search
The data requested in this dialogue box are the following:
• Number of intervals (default value: 10): this setting determines the “accuracy” of the
automatic search: number of explored directions, number of tested distances for
centres on each direction, and number of radius increments for each centre. Refer to
section 2.1.3 and the technical manual for more information about the automatic
search;
• Increment for circle radius (m): (positive) value of the radius increment. With the
automatic search, Talren 4 automatically makes both a positive and negative
incrementation (increasing and decreasing the circles radius);
• Min abs. for emergence XL (m): value of the abscissa beyond which the failure
surfaces are not taken into account, if these surfaces are completely on the left of the
XL position. The XL value enables, in the case of complex slopes, to avoid some
undesired circles. The position of the minimum abscissa for emergence is displayed
•
on the graphical view (at the bottom) with the
symbol.
Search type: 2 choices are available (Figure 99): imposed passage point, and tangent
to top of layer. This option is used to calculate the radius of the first circle associated
with each centre. For the other circles associated with the same centre, the radius is
determined by automatic incrementation (positive and negative) of the radius (and the
criterion is therefore no longer applied).
Depending on this option, the requested data will vary:
o Imposed passage point: in this case, this imposed passage point should be
defined:
Either typing X and Y values in the edition cells;
o
•
Or by clicking on the
button, then on the position for the imposed
passage point on the graphical view.
Tangent to top of layer: in this case, the tangency layer should be selected among
the list of the project layers.
Polygonal failure surfaces:
Select "Polygonal surfaces" (Figure 102), and click on the “Define failure surface” button.
The dialogue box of Figure 101 is displayed.
Copyright TALREN 4 - TERRASOL – February 2005
Page 92
TALREN 4
B - User manual
Figure 100: failure surfaces dialogue box: polygonal failure surfaces
Figure 101: failure surfaces dialogue box: polygonal failure surfaces
This window behaves like the "Geometry" dialogue box, "Points" tab (section 4.3.2):
"Add", "Delete" and "Delete all" buttons enable to add a new point, to delete the
selected point or to delete all points defining the polygonal failure surface.
The "Possible selection on drawing” mention means that you can add points to the
failure surface by clicking them on the graphical view (the u column should be filled
after the points have been created).
The polygonal failure surface is represented by a thin black line, with black points
(Figure 102).
Polygonal failure
surface
Figure 102: example of graphical display for polygonal failure surfaces
The data requested in the dialogue box are the following:
o Numbers of the points (those are automatically allocated and cannot be edited);
o X and Y coordinates in m of each point of the polygonal failure surface;
o u (pressure): pore pressure at (X,Y) point. This information is taken into account
in the calculations only if the hydraulic conditions are set on “Hydraulic conditions
along polygonal failure surfaces” for the active stage. If this type of hydraulic
conditions is not active in the stage, the data in the u column will be ignored.
Copyright TALREN 4 - TERRASOL – February 2005
Page 93
TALREN 4
B - User manual
IMPORTANT:
o For each situation one single polygonal failure surface can be defined: to analyse
several polygonal failure surfaces for a given construction stage, several
situations should be defined.
o The polygonal failure surfaces should be defined so that the first and the last
points are outside the slope boundary, and so that the 2nd and the next-to-last
points are below the slope boundary (Figure 102).
o The points of a polygonal failure surface are automatically ordered by increasing
X values when validating the dialogue box: if you define a zigzag failure surface
(by typing or drawing), it will automatically be “straightened” when validating the
dialogue box. In the same way, if you add a point to an existing failure surface,
this point will first be connected to the last point previously defined, but will be
ordered after validation of the dialogue box (Figure 103).
Before validation
Inserted point
After validation
Figure 103: addition of a point to an existing polygonal failure surface
•
Logarithmic spirals
Chapter under construction
•
Data requested for all types of failure surfaces (Figure 104)
o Number of slices: the default value is set to 100 for new situations. There is no limit
to the number of slices that you can define, but a large number of slices will slow
down calculation and display .
o Impose passage conditions for soil layers: this checkbox enables to define passage
conditions (it is not compulsory). New data are then requested (Figure 104):
Condition n° 1: choose the soil layer among the list of the project layers, then
choose if the failure surface must pass out this layer, or on the contrary must
pass in this layer;
Condition n° 2: same type of data as for condition 1;
Combination mode: it is possible to combine both conditions with "or" or "and".
Copyright TALREN 4 - TERRASOL – February 2005
Page 94
TALREN 4
B - User manual
Figure 104: conditions dialogue box: impose passage conditions
IMPORTANT: if the "substratum" properties are assigned to some soil clusters, Talren 4
will automatically consider that the failure surfaces must pass out of these clusters (this
condition is automatically defined and it is combined with the additional conditions
defined by the user here).
5.2.5.5. Situation comments
It is possible to define comments specific to each situation (text zones) that will appear on
the graphical view in “Stages/calculations” mode depending on the selected situation.
This option is accessible when a situation is selected, through the "Stages and conditions"
menu, option “Comments for the selected conditions” or with a right mouse click on the
situation, and then the same option in the pop up menu. It enables to define or modify any
number of comments for the selected situation.
Figure 105: dialogue box for situation comments
Copyright TALREN 4 - TERRASOL – February 2005
Page 95
TALREN 4
B - User manual
To add a new situation comment, click on the "Add" button, then define the comment text on
the new line in the table. To change an existing comment, click on the corresponding line and
change the text.
The "Delete" and "Delete all" buttons enable to delete one or all comments (for the active
situation).
After validating the dialogue box, the comments appear in green font on the graphical view.
The user can move these comments with the mouse (click with the left mouse button on a
situation comment, move the mouse and release the mouse button). It is also possible to
delete a comment from the graphical view: select it with the mouse, and press the “Del” key
of the keyboard.
The comments are of course saved with the project file.
Refer to sections 3.3.2.6 and 5.1.4.6
5.2.6. Removing a situation
The option "Remove the selected set of conditions" of the "Stages and conditions" menu
enables to delete the active situation. The software will request a confirmation before actually
deleting the situation. This operation is also possible with a right click on the situation label,
(option “Remove the selected set of conditions” in the pop up menu).
The removal of a situation leads to the removal of all data directly attached to it.
But situations are independent from each other, and deleting a situation has no influence on
the other situations. The numbers of the situations following the one that was just deleted are
automatically shifted.
Copyright TALREN 4 - TERRASOL – February 2005
Page 96
TALREN 4
B - User manual
5.3. Calculation and results display
5.3.1. Calculation
3 options are available to perform calculations:
•
Calculate the selected set of conditions: “Calculation and results” menu or
•
Calculate all conditions of the selected stage: "Calculation and results" menu or
button;
button;
button.
• Calculation all: “Calculations and result” menu or
During the calculations, a window (Figure 106) indicates the progression of the requested
operations. A gauge in the status bar
displays the progress of the calculation
itself for each situation.
Figure 106: calculations progress
The button "Interrupt" enables to interrupt the calculation.
Talren 4 makes data checking before running the calculation, and if it detects errors or
forbidden values, it displays red warnings or errors in the calculation window.
In case of warnings, the calculation is performed (it's up to the user to decide whether they
are valid or not considering the warnings). But in case of errors, the calculation is not
performed: data should be corrected as indicated before running the calculation again.
At the end of the calculations, the calculation window closes automatically, except if errors or
warnings are displayed: it is then up to the user to close this window after reading the
messages (the “Interrupt” button of Figure 106 is then replaced with the “Close” button).
Copyright TALREN 4 - TERRASOL – February 2005
Page 97
TALREN 4
B - User manual
When calculations have been performed, it is possible to display several types of results
(graphs and tables). The various options are detailed in the following sub-sections.
Situations for which calculations have been performed (i.e. results are available) are
displayed in bold characters in the stages explorer.
On the other hand, if the calculations have not yet been performed, or have failed, the output
icons and menu options are disabled.
5.3.2. Default output display
After calculation, the default ouput types displayed on the graphical view are (Figure 107):
• The value of the minimum safety factor (red font), at the bottom of the graphical
view;
• The values of the safety factor obtained for each failure surface:
o In the case of circular failure surfaces: the minimum safety factor obtained for
each centre is displayed close to each centre (if there are radius increments,
the program calculates the minimum safety factor obtained for all circles with
the same centre, and displays only this minimum next to each centre);
o In the case of polygonal failure surfaces: the safety factor calculated for the
failure surface defined in the situation is displayed next to this failure surface;
o In the case of logarithmic spirals: the minimum safety factor obtained for each
spiral is displayed next to its pole.
• The critical failure surface: painted in red on the drawing. The zoom level is
optimised automatically after calculation to display the critical failure surface (centre,
pole, etc).
Figure 107: default output display after the calculation of a situation
(example in the case of circular failure surfaces)
Copyright TALREN 4 - TERRASOL – February 2005
Page 98
TALREN 4
B - User manual
5.3.3. Settings for the graphical output display
The settings for the graphical ouput display can be edited with the “Calculation and results”
button of the toolbar, or by
menu, option “Graphical display settings for output”, by the
the pop up menu on the graphical view (click on the right mouse button on the graphical
view). The dialogue box illustrated on Figure 108 is displayed. It enables to request the
display of (in addition to the default display, section 5.3.2):
o All calculated circles (Figure 109);
o All circles corresponding to a certain range of safety factor values (Figure 110);
o Isovalues (colour shadings, Figure 111): here also, a range of safety factor
values can be defined;
o Indications on the design criterion for the reinforcements (Figure 111): this
display, if requested, consists in texts "ITR = xxx; ICIS = xxx". These codes and
their legends (usual reinforcements codes in Talren) can be viewed from the
dialogue box for detailed reinforcements results, refer to section 5.3.5).
Figure 108: graphical output display settings
Copyright TALREN 4 - TERRASOL – February 2005
Page 99
TALREN 4
B - User manual
Figure 109: display of all calculated circles
Figure 110: display of circles corresponding to a given range of safety factor values
Copyright TALREN 4 - TERRASOL – February 2005
Page 100
TALREN 4
B - User manual
Figure 111: display of colour shadings and reinforcements design criteria
5.3.4. Detailed results for failure surfaces
The table of detailed results for failure surfaces can be displayed with the "Calculation and
results" menu, option "Detailed output", or with the
button of the toolbar. One of the
tables illustrated in Figure 112, Figure 113 and Figure 114 is displayed.
By default:
o The green highlighted line corresponding to the critical failure surface is selected
when opening the dialogue box.
o The table contains only the most critical failure surface obtained for each centre: if
there are radius increments, the program calculates the minimum safety factor
obtained for all circles with the same centre, and displays only the circle associated
with this minimum.
The checkbox "Display all results" below the table (Figure 112) enables to request the
display of all calculated circles (Figure 113).
The button “Legend for F values” enables to display the description of a legend for the safety
factor values (Figure 115).
The columns displayed in the table depend on the type of failure surface (circular, polygonal,
spiral), and on the calculation method (Fellenius, Bishop, Perturbations, yield design
calculation).
The 3 values F-SOL, F-SURCH and F-TOTAL are displayed for the calculation methods
Fellenius and Bishop. For the other calculation methods, F-TOTAL alone is displayed:
• F-SOL: safety factor calculated without taking into account the loads nor the
reinforcements;
• F-SURCH: safety factor calculated with loads, but without reinforcements;
Copyright TALREN 4 - TERRASOL – February 2005
Page 101
TALREN 4
B - User manual
• F-TOTAL: global safety factor (taking into account loads and reinforcements).
In the case of the perturbations calculation method, 3 additional columns appear: λ and µ ,
and NSPEQ (number of solutions for the 3rd degree equation).
Note: When a line is selected in the table, the corresponding failure surface is displayed with
a bold line on the graphical view.
Figure 112: detailed results for failure surfaces
(example for circular failure surfaces, Bishop calculation method)
Figure 113: detailed results for failure surfaces
(example for circular failure surfaces, Bishop calculation method)
Copyright TALREN 4 - TERRASOL – February 2005
Page 102
TALREN 4
B - User manual
Figure 114: detailed results for failure surfaces
(example for circular failure surfaces, perturbations calculation method)
Figure 115: legend for F values
5.3.5. Forces in reinforcements
The table of detailed results for reinforcements can be displayed with the "Calculations and
results" menu, option "Forces in reinforcements", or with the
button of the contextual
toolbar. The dialogue box illustrated on Figure 116 is displayed: the left part displays the list
of calculated failure surfaces, the right part displays, for the failure surface selected in the left
list, the forces and results for all active reinforcements. In the example of the figure
hereunder, the project contains nails and anchors, thus these 2 tabs are displayed.
Copyright TALREN 4 - TERRASOL – February 2005
Page 103
TALREN 4
B - User manual
By default, the green highlighted line corresponding to the critical failure surface is selected
in the left list.
Note: When a line is selected in the left list, the corresponding failure surface is displayed
with a bold line on the graphical view.
The columns contents depend on the reinforcements type (active tab). The button “Legend
for reinforcements” on this screen enables to view the legend for the different columns of the
table (Figure 117).
Figure 116: detailed results: forces in reinforcements
Figure 117: legend for the reinforcements results
Copyright TALREN 4 - TERRASOL – February 2005
Page 104
TALREN 4
B - User manual
5.3.6. Detailed results for slices
The table of detailed results for slices can be displayed with the “Calculation and results”
menu, option “Slices results”, or with the
button of the toolbar. The dialogue box
illustrated on Figure 118 is displayed: the left part displays the list of calculated failure
surfaces, the right part displays, for the failure surface selected in the left list, the detailed
results for each slice (both as a table and as a graphic).
By default, the green highlighted line corresponding to the critical failure surface is selected
when opening the dialogue box.
Note:
• If the option to save the detailed results for the critical failure surface only was
selected in the situation properties, only the critical surface will appear in the left list
(as is the case on the following figure).
• However, if the option to save the detailed results for all calculated failure surfaces
was selected instead, all failure surfaces will appear in the left list. The table includes
the critical circle obtained for each centre: if there are radius increments, the program
calculates the minimum safety factor obtained for all circles with the same centre, and
displays in the left table only the circle associated with this minimum.
The checkbox "Display all results" below the table enables to request the display in
the left list of all calculated circles (display can take a long time in this case).
When you select a line in the left list, the corresponding failure surface is displayed with a
bold line on the graphical view.
The columns of the table on the right part of the dialogue box have the following meaning:
• Slice N°: incremental numbering;
• DL (m): slice width;
• X (m): abscissa of the slice axis;
• Y (m): level of the slice bottom for X position;
• A (rad): angle of the slice base compared to the horizontal line;
• GH (force unit): slice weight / ml;
• YGS: level of the slice gravity centre;
• IS: number of the active soil layer at point (X,Y);
• u (pressure unit): pore pressure at point (X,Y);
• UNE (pressure unit): hydrostatic pressure above the slope boundary in case of an
external water level;
• RDS (pressure unit): supplement of normal stress due to reinforcements calculated in
(X,Y);
• SIG-TOTAL (pressure unit): total normal stress calculated in (X,Y);
• TAU (pressure unit): shear stress along the failure surface calculated in (X,Y).
Copyright TALREN 4 - TERRASOL – February 2005
Page 105
TALREN 4
B - User manual
Figure 118: slices results
(case of detailed results saved for critical failure surface only)
Copyright TALREN 4 - TERRASOL – February 2005
Page 106
TALREN 4
B - User manual
6. PRINTING
It's possible to print:
• Only the active stage and situation;
• All situations of the active stage;
• All situations of all stages.
Several printing settings are available: they correspond to various detail levels. The printing
settings are valid for all the situations of all selected stages if relevant.
Figure 119: printing settings
The different types of printing are detailed hereunder.
6.1. Project data
This option is the only printing option proposed in the "Project data" mode.
In the "Stages/Calculation" mode, it is activated by default.
This printing summarises all data and assumptions defined by the user in the data mode.
• General settings;
• Soil characteristics;
• Geometry;
• Loads;
• Reinforcements.
6.2. Graphical summary
This option is available only in the "Stages/Calculation" mode.
It provides a page in landscape format with for each situation:
• The project layout, displayed in the same way as on the screen (same zoom level,
etc); if the results are available for the printed situation(s), the critical failure surfaces
are displayed too;
• The minimum safety factor obtained after calculation (if results are available);
• A bar at the bottom with the software version, title of the project, filename, stage and
situation names, printing date and time, company name (from the hardlock).
Copyright TALREN 4 - TERRASOL – February 2005
Page 107
TALREN 4
B - User manual
6.3. Data for stages and situations
This option is only available in the “Stages/Calculation” mode.
The printed document summarises all data and assumptions defined for the printed stage
and situation:
• Data for the stage:
o Hydraulic conditions;
o Active slope boundary;
o List of active loads;
o List of active reinforcements;
• Data for the situation:
o Calculation method;
o Partial safety factors;
o Seismic conditions;
o Description of the failure surfaces;
o Summarised results are also printed if available: minimum safety factor and
description of the critical failure surface.
6.4. Detailed results
6.4.1. Detailed results for failure surfaces
This option is available only in the "Stages/Calculations" mode, if results are available.
The printed document includes the same table as in the corresponding dialogue box (section
5.3.4).
6.4.2. Results relative to reinforcements
This option is available only in the "Stages/Calculations" mode, if results are available.
The printed document includes the same table as in the corresponding dialogue box (section
5.3.5).
6.4.3. Results detailed by slices
This option is available only in the "Stages/Calculations" mode, if results are available.
The printed document includes the same table as in the corresponding dialogue box (section
5.3.6): the printed table is the one corresponding to the critical failure surface.
Copyright TALREN 4 - TERRASOL – February 2005
Page 108
TALREN 4
B - User manual
6.5. Printer settings
When first printing in each Talren 4 session, the following dialogue box appears
automatically after validation of the dialogue box represented on Figure 119.
When printing again in the same Talren 4 session, this dialogue box does no longer appear
automatically, but it can be displayed manually: click on the “Setup” button (Figure 119).
Figure 120: printer settings
This dialogue box enables to setup the printer settings, according to the Windows®
environment.
Copyright TALREN 4 - TERRASOL – February 2005
Page 109
TALREN 4
B - User manual
7. FILES HANDLED BY TALREN 4
7.1. Files that can be opened/saved with TALREN 4
The file format associated with Talren 4 is .prj. With Talren 4, it is therefore possible to save
and open .prj files.
It is also possible to open (load):
• .tal files saved with Talren 97 (previous version of the Talren software);
• .plx files saved with Plaxis v8.
Select the relevant file extension type in the "open" dialogue box (example Figure 121).
Figure 121: "open" dialogue box
Some specific aspects about loading .tal files and .plx files are underlined in the following
sections.
However, TALREN 4 only allows to save one file type: it is the .prj format.
7.1.1. Loading .tal files saved with Talren 97
Talren 4 enables to open (load) data files created with previous versions of Talren 97, but not
with the DOS versions (older than Talren 97).
Except for a couple of exceptions (for instance refer to sections 7.1.1.2 and 7.1.1.3), it is
possible to load a Talren 97 file, to switch to the "Stages/Calculation" mode, to perform the
calculation for the single situation: the result provided by Talren 4 will be identical to the one
provided previously by Talren 97.
However, some new options in Talren 4 lead to default choices when loading .tal files saved
with Talren 97.
It is therefore strongly recommended for Talren 97 users to read the following subsections, in order to know and use the possibilities of the Talren 4 software when
reading Talren 97 files.
One can also refer to chapter D of the manual: tutorial 2 describes in a detailed manner how
to work with .tal files.
IMPORTANT: The .tal files opened with Talren 4 (menu File/Open, selection of the file
extension .tal) can only be saved in the .prj format.
Copyright TALREN 4 - TERRASOL – February 2005
Page 110
TALREN 4
B - User manual
7.1.1.1. General settings
The titles, comments and units are those defined in the .tal file.
The dimensions of the model (Xmin, Xmax and Ymax) are automatically initialised when reading
the geometry of the .tal file. Default calculation method and partial factor sets are also
initialised based on the .tal data.
For each .tal file, a special set of partial safety factors called "Coefficients TAL" is
automatically created in the local project database: it is filled with the partial factors defined in
the .tal file (example on Figure 122).
Also refer to sections 7.1.1.3, 7.1.1.4 and 7.1.1.5 for specific aspects about partial safety
factors.
Figure 122: partial factor set "Coefficients TAL"
7.1.1.2. Geometry
When reading .tal files, the slope boundary is never set to “automatic” (because Talren 4
displays the user-defined Talren 97 slope boundary).
Except for specific cases (slope boundary on purpose different from groundlevel), it is
recommended to activate the “automatic slope boundary” in the “Geometry” dialogue box (as
indicated in the figure hereunder) when first opening .tal files.
IMPORTANT: It is even compulsory to activate the "automatic slope boundary" mode in the
case where the user wishes to define additional construction stages for his project, with
activation/deactivation of soil clusters (and therefore potentially change of the slope
boundary): if several stages are defined and the boundary is not “automatic”, the boundary
will not automatically change with each stage, and the same initial slope boundary will be
taken into account for all calculated phases and situations (which can lead to errors).
Copyright TALREN 4 - TERRASOL – February 2005
Page 111
TALREN 4
B - User manual
Figure 123: definition of the slope boundary
Generally, when reading a .tal file, no particular problem is raised about the geometry, except
if the .tal file contains vertical limits without corresponding segments: take for example the
simple case of 2 adjacent horizontal segments, one with soil layer 1 below, and the other
with soil layer 2 below, without the vertical limit between both soil layers being defined with a
geometrical segment (this was possible in Talren 97, Figure 124).
Reading this kind of file will raise a problem in Talren 4, which needs closed soil clusters to
be able to associate them with different soil layers: in the previous example, the "missing"
segment should be added manually, and then the soil layers should be assigned to both
clusters again.
Example of a Talren 97 file with
2 layers, without a vertical
separation line
After importation in Talren 4:
Talren was not able to identify
the soil clusters
After drawing a vertical line and
associating both soil layers
Figure 124: specific case of Talren 97 file reading
Note: the previous comments apply to vertical geometrical lines inside the model: the vertical
lines delimiting the model in Xmin and Xmax are created automatically in Talren 4 when reading
a Talren 97 file (it is not necessary to draw these lines).
7.1.1.3. Loads
In Talren 97, the partial load factors were specific to each load. In Talren 4, this partial load
factor is common for all loads (one single value for each set of partial safety factors): it is the
value defined in "Coefficients TAL" (section 7.1.1.1).
Copyright TALREN 4 - TERRASOL – February 2005
Page 112
TALREN 4
B - User manual
When reading a Talren 97 file including one or more loads, all defined with the same load
factor, Talren 4 will define the load factor of the "Coefficients TAL" set to be equal to this
same value, and the Talren 4 file will be equivalent to the Talren 97 file.
However, when reading a Talren 97 file including several loads with different load factors, it
is necessary to adjust the load values, to make the Talren 4 equivalent to the Talren 97 file
although the same load factor will be used for all loads.
7.1.1.4. Reinforcements
There is no special comment about reinforcements reading, except for the nails and anchors.
For the nail data, Talren 4 needs to know whether the unitary skin friction (qsnails) is issued
from tests and curves. This datum did not exist in Talren 97. It enables to choose the
relevant partial safety factor (in the Clouterre recommendations for example, the partial
safety factor for qsnails is not the same whether qs is known from tests or curves).
When reading a .tal file:
• This datum is set to "Curves" (default value);
• In the specific "Coefficients TAL" set generated for the project (section 7.1.1.1), the
values of the safety factors for qsnails curves and qsnails tests are set to the same value.
In this way, the Talren 4 calculations will give the same results as the Talren 97 calculations.
IMPORTANT: if you later change the set of safety factors (and choose for example a
Clouterre set), you should make sure to select for each nail whether the qs value is issued
from curves or tests, so that when calculating, the relevant safety factor is applied (also refer
to section 4.7.2.3 for the description of the partial safety factors).
The same comments apply to anchors, about qsanchors.
7.1.1.5. Soil properties
The important point to underline here is the use of “specific partial safety factors” when
reading .tal files. Indeed, Talren 97 enabled to define partial safety factors, but not to save
them as sets associated with a given standard. Talren 4, when reading .tal files, cannot
therefore associate a partial safety factor set (Clouterre for example) with the individual
values defined in the .tal file (that's why a specific “coefficients TAL” set is created when
reading each tal file, refer to section 7.1.1.1).
Moreover, it was possible in the .tal files to define different partial safety factors for each soil
layer. So when reading tal files, specific partial safety factors are activated and defined for
each layer: these factors replace for each layer, the global set selected in the situations, and
ensure therefore that .tal files will provide the same results with Talren 4 as with Talren 97.
Copyright TALREN 4 - TERRASOL – February 2005
Page 113
TALREN 4
B - User manual
Figure 125: soil characteristics and specific partial safety factors
However, if the .tal file includes the same partial safety factors for all layers, it is possible to
deactivate the use of specific partial safety factors for each layer, and to use for all situations
the factor set created automatically “Coefficients TAL” (or even another predefined set if
relevant or necessary).
When reading a .tal file:
• The cohesion type is set to “Effective” for all layers;
• The action of the soil weight is considered to be unfavourable for all layers;
• In the specific factors for each layer, the partial factors for the cohesion and the soil
weight are identical to those that were defined for each layer in Talren 97;
• In the specific "Coefficients TAL" set generated for the project, the values of the
safety factors for c' and cu are the same.
This way, Talren 4 will provide the same results as Talren 97.
IMPORTANT: in the case where you change the safety factors set (and choose for example
a Clouterre set), you should make sure to select the right cohesion type for each layer
(effective or undrained): this choice will decide which safety factor will be applied. In the
same way, you should check if the soil weight is an unfavourable action (default choice) or
not. Also refer to section 4.7.2.3 for the description of the partial safety factors.
7.1.1.6. Definition of the construction stages
When reading a .tal file, Talren 4 automatically creates a stage and a situation for this stage,
which corresponds to the calculation performed in the .tal file, except in the case of polygonal
failure surfaces: in this case Talren 4 automatically creates a stage and as many situations
as polygonal failure surfaces defined in the .tal file (there can only be one single polygonal
failure surface for each situation in Talren 4).
Copyright TALREN 4 - TERRASOL – February 2005
Page 114
TALREN 4
B - User manual
7.1.1.7. Hydraulic conditions (properties of stage 1)
Phreatic level
A single point was sufficient in Talren 97 to define a horizontal groundwater level.
However, in Talren 4, 2 extremities should be defined for the groundwater level: if in the
Talren 97 file, the groundwater level is defined with a single point, Talren 4 automatically
adds a 2nd point at the same level when reading the file.
This comment also applies if necessary to the water table base.
External phreatic line
As for the slope boundary (section 7.1.1.2), there is in Talren 4 an "automatic" mode for the
external water level, that is deactivated by default when reading a .tal file (because Talren
reads the previously user-defined data), but can be activated (it is even recommended,
except if the user wishes on purpose to impose an external phreatic level that is different
from the one calculated by default).
Hydraulic pore pressure mesh
No special comment.
ru coefficients
In Talren 97, the ru coefficients were defined in the soil characteristics.
In Talren 4, the hydraulic conditions can be changed for each stage, and the ru coefficients
are defined (and therefore can be edited) in the hydraulic conditions for each stage (with a
table enabling to define ru for each soil layer).
7.1.1.8. Situations: partial safety factors (properties of stage 1 / situation 1 or i)
The "Coefficients TAL" set is selected by default for the situation (section 7.1.1.1).
7.1.1.9. Situations: failure surfaces (properties of stage 1 / situation 1 or i)
There is no special comment about failure surfaces settings.
In the case of polygonal failure surfaces, one single failure surface can be defined for each
situation: Talren 4 therefore creates as many situations as polygonal failure surfaces when
reading a Talren 97 file.
7.1.2. Reading .plx files saved with Plaxis v8
Talren 4 enables to read Plaxis files created with Plaxis v8 (but not previous files created
with previous versions of Plaxis, or with other Plaxis products). These files have the .plx
extension (be careful: the plaxis v7 files also have the .plx extension, but can not be loaded
with Talren 4).
IMPORTANT: the Plaxis files for a given project include a project.plx file, and a project.DTA
directory, which itself includes a copy of the project.plx file. To open the project with Talren 4,
you should select the project.plx file that is “outside” the project.DTA directory (and not the
one inside this directory).
The data imported when opening a Plaxis data file are the following:
• Project limits (Xmin, Xmax and Ymax), initialised from the dimensions of the Plaxis model;
• The project geometry (all points and segments, association of soil clusters with soil
properties), as defined in the Input module of Plaxis (section 7.1.2.1);
• Some soil properties (section 7.1.2.2);
• Loads, as defined in the Input module of Plaxis (section 7.1.2.3);
• Groundwater conditions from the Plaxis initial conditions.
The staged construction defined in Plaxis is not imported (section 7.1.2.4).
The imported data should be completed (for instance the file number, the project title and the
situation properties are missing) before being able to perform a calculation.
Copyright TALREN 4 - TERRASOL – February 2005
Page 115
TALREN 4
B - User manual
After the importation of a Plaxis data file, Talren 4 displays the following warning:
Figure 126: warning displayed when reading a Plaxis v8 file
It is strongly recommended that Plaxis v8 users read the following sections, in order
to know and use the possibilities of Talren 4 when reading Plaxis v8 files.
Please also refer to chapter D of the manual: tutorial 3 describes in a detailed manner an
example of .plx file reading.
IMPORTANT: The .plx files opened with Talren 4 (menu File/Open, selecting the .plx file
extension) can only be saved with the .prj format.
7.1.2.1. Geometry
When reading a Plaxis file, Talren 4 automatically creates vertical segments on the left and
right boundariess of the model: indeed, these segments have been defined in Plaxis, and are
therefore read in Talren 4 like the others.
These segments are not necessary, but they are no problem either. The user can therefore
keep or delete them at his convenience.
On the other hand, the slope boundary is not a Plaxis datum: it is therefore calculated in
automatic mode when reading a Plaxis file in Talren 4.
7.1.2.2. Soil properties
The soil characteristics compatible between Talren 4 and Plaxis v8 (in other words read by
Talren 4 when opening a Plaxis v8 file) are the following:
•
•
Unit weight: it is the unsaturated unit weight (γunsat) that is used in Talren 4.
Cohesion: cref value. Be careful, the possible linear cohesion variations with depth
that can be defined with Plaxis v8 are not read by Talren 4.
• Friction angle (phi).
These 3 data are read for each layer defined in Plaxis v8 (independently from the behaviour
laws chosen in Plaxis v8, and other soil parameters possibly defined with Plaxis v8).
7.1.2.3. Loads
No special comment.
7.1.2.4. Construction stages
A single stage is automatically created in Talren (as it is always the case). But no data are
imported from Plaxis concerning the stage (neither hydraulic conditions, nor
activation/deactivation of soil clusters, loads, etc).
Copyright TALREN 4 - TERRASOL – February 2005
Page 116
TALREN 4
B - User manual
A single situation is also automatically created for this first stage (as it is always the case).
No data are imported from Plaxis for the situation.
A Plaxis v8 file behaves therefore as a new file as far as the "Stages/calculation" mode is
concerned.
7.2. Other files handled by TALREN 4
7.2.1. Files provided during installation
In addition to the system files (DLL, etc) and the example files, files provided during the
program installation (in the Talren 4 installation directory) are the following:
• talren4.jar: it is the Talren 4 "exe" file.
• run.bat: this file should be executed to run Talren 4 in the best conditions (this
enables a better optimisation of your computer memory than running directly
talren4.jar).
• Properties, fra and ang files: these files include Talren 4 settings (language, hardlock
type, etc.) as well as all text resources.
• bd files: these are the global Talren databases (partial safety factor sets, soils and
reinforcements databases).
7.2.2. Result files
Several result files are generated by Talren 4 for each calculation (situation).
• –n.prr or -c.prr file: result file in XML format, that contains all the available results for a
situation if they exist. This file is created in the same directory as the project file. It
has the same name as the .prj file, with the stage and situation number added at the
end. For example, the result file for situation 2 of stage 1 of the project.prj file will be
named project12-c.prr. The –c notation indicates that the file actually contains up-todate results, whereas the –n notation indicates that it is not the case.
When sending a Talren 4 project to another user, the files to be sent are:
o The prj file, which contains all the data;
o The –c.prr file (optional result file).
Copyright TALREN 4 - TERRASOL – February 2005
Page 117
TALREN 4
B - User manual
7.2.3. Temporary files
Talren 4 handles additional file types linked to the calculation (data and results). You don't
have to know these files. They are however listed here.
• .ta2 file: text file necessary to the calculation module, generated by the user interface
when the user asks for a calculation. This file is created for each calculated situation.
The .ta2 filename is composed of the .prj file name, followed by the number of the
stage and the number of the situation. For example when calculating situation 3 of
stage 2 of the example.prj file, the ta2 file is named example23.ta2. This file is
created in the same directory as the project file.
• talren.ava file: file generated by the calculation module, and allowing the interface to
know the calculations progress (display of the gauge during the calculation). This file
is created in the same directory as the project file. It is unique in each directory: It is
therefore overwritten each time a new calculation is asked for in the same directory.
• talren.fic file: text file used as a link between the user interface and the calculation
module. This file is generated in the installation directory of Talren 4 at the beginning
of each calculation.
• .re1 file: formatted text file generated by the calculation module and listing calculation
data. The filename is the same as ta2 filename. The .re1 file is created in the same
directory as the project file.
• .res file: same comments as for the .re1 file. The .res file contains the detail of the
calculation results for failure surfaces. These results are displayed in the “Results for
failure surfaces” dialogue box.
• .ren file: same comments as for the .re1 file. The .ren file contains the detail of
reinforcements results. These results are displayed in the “Forces in reinforcements”
dialogue box.
• .tra file: same comments as for the .re1 file. The .tra file contains the details of the
slices results (this file can therefore be very big: often several Mb). These results are
displayed in the “Slices results” dialogue box.
• .trb file: same comments as for the .re1 file. The .trb file is specific to the yield design
calculation method.
• -n.rrp or –c.rrp file: same comments as for the .re1 file. It is a temporary result file
(these files are deleted when the project is saved and/or closed).
• .err file: this file contains relevant error messages generated by the calculation
module (it is almost always empty). These error messages, if any, are displayed in
the calculation window: the user therefore automatically views these messages. The
name of the .err file is the same as for the ta2 file. The .err file is created in the same
directory as the project file.
Copyright TALREN 4 - TERRASOL – February 2005
Page 118