1
FastCube 2.0 User
manual
© 2013 Fast Reports Inc.
I
FastCube 2.0 User manual
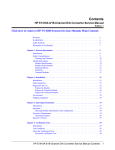
Table of contents
I
2
Chapter I Example of FastCube Use
1 Example
...................................................................................................................................
"Demography"
2
Chapter II Description of the FastCube
Library
12
1 The
...................................................................................................................................
Grid
12
Setting up.........................................................................................................................................................
the Grid Structure
13
Totals
......................................................................................................................................................... 14
Drill Up/Dow
.........................................................................................................................................................
n
19
Drill Through
......................................................................................................................................................... 21
Rotation ......................................................................................................................................................... 21
Filtering ......................................................................................................................................................... 23
Sorting ......................................................................................................................................................... 27
Grouping ......................................................................................................................................................... 28
Form atting,
.........................................................................................................................................................
highlighting
32
Data Formatting
.................................................................................................................................................. 32
Conditional..................................................................................................................................................
highlighting
33
Continuous..................................................................................................................................................
highlighting
35
FastScript.........................................................................................................................................................
use
38
Calculated..................................................................................................................................................
measures
38
Measures ..................................................................................................................................................
w ith calculated filters
46
Data export
......................................................................................................................................................... 47
Export to XLS
.................................................................................................................................................. 48
Export to ODS
.................................................................................................................................................. 49
Export to HTML
.................................................................................................................................................. 49
Export to XML
.................................................................................................................................................. 50
Toolbar ......................................................................................................................................................... 51
2 The
...................................................................................................................................
Chart
51
The Chart .........................................................................................................................................................
Toolbar
53
3 Working
...................................................................................................................................
with FastReport Report Generator
53
The cross-view
.........................................................................................................................................................
object
54
© 2013 Fast Reports Inc.
I
© 2013 Fast Reports Inc.
Chapter
I
Example of
FastCube Use
Example of FastCube Use
6
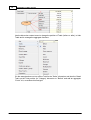
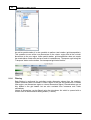
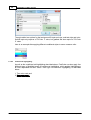
Example 2: The dynamics of population growth
This example is based on the grid created above.
To achieve our objective we need to move the "Year" dimension from the filters region to
the columns region, before the measures field, and add the values '1996' and '2001' to the
years filter. As a result, the grid will show the population size in 5-year intervals between
1996 and 2006. Further, we can filter the country dimension to show just six countries:
China, France, Germany, Russia, United Kingdom and the USA:
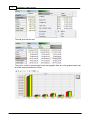
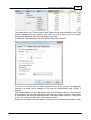
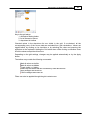
Now the first column shows the sum of the other columns and does not make any sense
in this context, so we can hide the column. This is done through the context menu for the
People item - 'Grand total->Hide':
© 2013 Fast Reports Inc.
7
FastCube 2.0 User manual
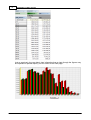
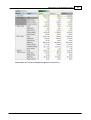
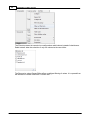
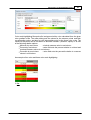
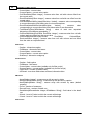
The final grid looks like this:
This grid is useful for presenting the raw demographic data, but a far greater impact can
be made when presented as a chart:
© 2013 Fast Reports Inc.
Example of FastCube Use
8
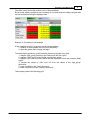
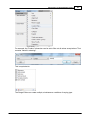
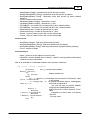
The chart clearly shows the relative sizes of the populations.
But to reveal which populations are increasing in size and which are falling, the grid data
can be emphasized using the highlight tools:
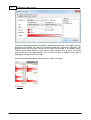
Example 3: Population by sex and age
In this example we will try to answer the following questions:
1. children of which gender are born more frequently?
2. does this gender ratio change with age?
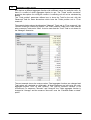
To answer these questions we will make the following changes to the grid:
1. drag the "Age_group" field from the Field list into the row region
2. drag the "Year" and "Country" fields into the filters region
3. drag the "Sex" field from the Field list and the measures field to the measure fields
region
4. exclude the values of '100+' and '5-9' from the values of the "Age_group"
dimension
5. leave only 2006 in the "Year" dimension
6. leave only Russia in the "Country" dimension
These steps produce the following grid:
© 2013 Fast Reports Inc.
9
FastCube 2.0 User manual
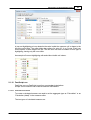
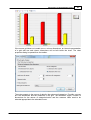
Just as previously, the raw data is less informative than a chart (though the figures may
be important for printed reports), so let's switch to the chart page:
© 2013 Fast Reports Inc.
Example of FastCube Use
10
A chart makes it easy to answer our initial questions:
1. more boys are born than girls
2. however, from the age group 40-44 more women survive than men
If you have not been able to reproduce these examples, you can open the ready-made
examples from the Advanced demo, "Life Examples", "Demography".
© 2013 Fast Reports Inc.
Chapter
II
Description of
the FastCube
Library
Description of the FastCube Library
2.1
12
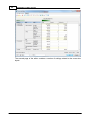
The Grid
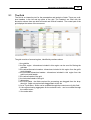
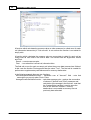
The Grid is an interactive tool for the presentation and analysis of data. There are multilevel headers in the left and top parts of the grid. The 'headers' are filled with the
dimension values; there are both horizontal and vertical 'headers'. The central part of the
grid displays the values of the measures.
The grid consists of several regions, identified by numbers above:
1. the grid title
2. the filter region : dimensions included in this region can be used for filtering the
grid data
3. the vertical dimension headers : dimensions included in this region form the grid's
vertical header
4. the horizontal dimension headers : dimensions included in this region form the
grid's horizontal header
5. the vertical header of the grid
6. the horizontal header of the grid
7. data region
8. the list of fields : the fields required for processing are dragged from the dropdown list : fields not required are dragged back to this list
9. list of Top-N filters : filters can be modified through the context menu for this field
10. the region showing aggregates for the selected cells : can be modified through
the context menu
11. the scale editor
© 2013 Fast Reports Inc.
13
2.1.1
FastCube 2.0 User manual
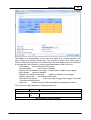
Setting up the Grid Structure
The grid structure many be defined in several different ways: by code, by loading from a
cube or scheme file or by manual setup by the user. This paragraph deals only with
manual setup of the grid structure.
Dimensions and measures are added to the grid by dragging from the drop-down list
(shown below) or by using the Field List dialog. They are added to one of the following
regions:
the filters region
the row fields region
the column fields region
or the measure fields region (the data region)
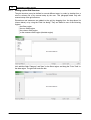
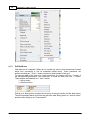
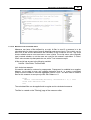
Let's add the fields "Category" and "Item" to the filters region, and drag the "Price" field to
the data region. The grid now looks like this:
© 2013 Fast Reports Inc.
Description of the FastCube Library
14
The number in brackets in the "Measures" dimension indicates the number of measures
defined for this grid. Here the number of measures is 1, since we dragged the "Price" field
to the data region. The "Measures" dimension is in fact not a simple dimension. Unlike all
the others, "Measures" contains measures, and not elements of the database row as its
values. This implementation of the measure list as a pseudo-dimensions allows a
consistent approach in the user interface - dragging to any dimension region and value
filter.
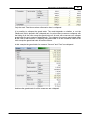
No data is yet displayed in the grid above as the grid only displays data when it contains at
least one measure and the "Measures" dimension is located either in the row fields region
or in the column fields region.
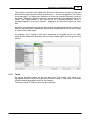
For example, if the "Category" and "Item" dimensions are dragged into the row fields
region and the "Measures" dimension into the column fields region, then the grid will look
like this:
2.1.2
Totals
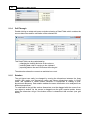
As well as dimension values the grid can also show Total values. Total value is an
aggregated measure value over a group of dimension values. A Total value is calculated
using the default aggregate function for the measure.
The various levels of Total are shown in this partial grid:
© 2013 Fast Reports Inc.
15
FastCube 2.0 User manual
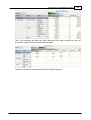
Use the dimension context menu to change the position of Totals (before or after), to hide
Totals and to manage the aggregate functions.
If in the example above we turn off the Total for the "Seller" dimension and also the Grand
Total, set the Total position for "Category" dimension to "Before" and add an aggregate
"Count" to it, we achieve this final grid:
© 2013 Fast Reports Inc.
Description of the FastCube Library
16
The context menu item "From measure" sets Totals to show a value defined on the "Total
position" parameter for the measure. This item only has a value for the axis which
contains the "Measures" field and is ignored for other axes.
A measure's Total parameters can be modified in the measure editor:
A Total value is calculated using the default aggregate function for the measure. The aggregate
function to be used can be changed or can even be implemented using a script, if
required.
The Total calculation can be made either on the source dataset values or on total values
of a child level. This can be set using the "Calc totals on to totals" checkbox. If this option
is checked then the axis from which to take the Total value (either columns or rows) must
be set. This can be set using "Use column totals as base".
Sometimes a situation can arise where, according to the dimensions parameters, each
© 2013 Fast Reports Inc.
17
FastCube 2.0 User manual
axis requires a different aggregate function with a different values for particular cells. So
there is a conflict of which aggregate function to use. The "Totals conflict resolution"
group-box has options for solving the conflict. A conflicting cell will not be calculated by
default.
The "Total position" parameter defines how to show the Total for the axis with the
"Measures" field for those dimensions which have the Totals position set to "From
measure".
The example below shows the dimension "Manager" Totals set to "From measure", the
"Amount" measure Totals set to "Before", the "Cost" measure Totals set to "Hide" and the
other measures Totals set to "After". It can be seen that the "Cost" Total is not shown for
the "Manager" dimension:
The next example shows the outcome when Total aggregate functions are changed and
Total values are calculated on child totals. All three measures are built using the main
aggregate function "Sum" by field "Amount". The Total for measure "Amount" is not
customized. For measures "Amount1" and "Amount2" the Totals aggregate function is
changed to "Average" and the measure "Amount2" uses the "Calculate totals on totals"
option:
© 2013 Fast Reports Inc.
Description of the FastCube Library
Grand totals can only be managed through the context menu:
© 2013 Fast Reports Inc.
18
19
2.1.3
FastCube 2.0 User manual
Drill Up/Down
Grid data can be collapsed (drilled up) to exclude the values of the dimensions located
below from processing or can be expanded (drilled down). These operations are
performed using the "-" and "+" buttons located on both headers of the grid.
To group the data by the value of a certain dimension, you need to click the "-" button of
the corresponding dimension. And conversely, to refine the data click the "+" button.
These buttons are identified as '1' and '2' below:
1. drill up button
2. drill down button
Drilling up or drilling down changes the structure of the grid header and the data region.
The two illustrations below show how the grid looks after drilling down on "service center"
and then after drilling up on "Consumption":
© 2013 Fast Reports Inc.
Description of the FastCube Library
20
Only the main Total shows when a dimension item is collapsed.
It is possible to collapse the grand totals. The result depends on whether or not the
"Measures" field is placed in the collapsed axis. An axis without measures collapses with
the hiding of all the cells except the grand total cell. An axis with measures can collapse
grand totals for each measure independently. The collapse of measure grand totals hides
all the cells of that measure. Collapsing the grand totals of all the measures hides all the
cells except the grand total cells for each measure.
In this example the grand totals for measure "Amount" and "Cost" are collapsed:
And here the grand totals for all the measures are collapsed:
© 2013 Fast Reports Inc.
21
2.1.4
FastCube 2.0 User manual
Drill Through
Double-clicking on a data cell opens a window showing a Detail Table which contains the
source data rows used for calculation of the selected cell:
This Detail Table can be manipulated by:
changing the visibility and size of the columns
selecting data cells for copying to the clipboard
exporting data to the same format as the main grid
The status bar shows the current row and total row count.
2.1.5
Rotation
The grid layout can easily be changed by moving the dimensions between the three
regions: filter region, row dimensions region and column dimensions region. In OLAP
terms, this operation is called rotation, because it corresponds to rotating a multidimensional data array. Data rotation enables the same information to be analysed from
different perspectives.
To rotate data in the grid the various dimensions must be dragged with the mouse from
one region to another. As the mouse is dragged over the grid a special pointer shows
where the dimension will go if the button mouse is released at that moment (see grid
below):
© 2013 Fast Reports Inc.
Description of the FastCube Library
22
This is the resultant grid after the "Item" dimension has been moved from the row
dimensions region to the column dimensions region:
The move can also be made using the field list dialog of the grid:
© 2013 Fast Reports Inc.
23
FastCube 2.0 User manual
As well as partial rotation it is also possible to perform total rotation (grid transposition).
This operation moves all the row dimensions to the column region and all the column
dimensions to the row region. Unlike partial rotation, grid transposition does not require
the recalculation of data cells and as a result is instantaneous. Transpose a grid using the
'Transpose' button on the toolbar. Our transposed grid looks like this:
2.1.6
Filtering
Data filtering is performed by excluding certain dimension values from the analysis.
Please note that it does not matter in which region of the grid this dimension is located
(filter region, row dimensions region or column dimensions region). Filtered values are not
only hidden in the grid header but are also excluded from measures and Totals
calculations.
Values of dimensions can be filtered using the drop-down list which is opened with a
mouse-click on the dimension filtering button ('1' below):
© 2013 Fast Reports Inc.
Description of the FastCube Library
24
Key to the grid above:
1. dimension filtering button
2. list of dimension values
3. drop-down list toolbar
Checked values in the drop-down list are visible in the grid. If un-checked, all the
corresponding rows of the source data are excluded from grid calculations. Values are
toggled either by clicking on its checkbox or by selecting the value and pressing the
spacebar on the keyboard. Holding the Ctrl button down while clicking a checkbox turns
off all the values except the clicked one.
Depending on the grid settings, changes may be applied automatically or by the Apply
button.
The toolbar may contain the following commands:
Mark all values as visible
Mark all values as hidden
Toggle visible <> hidden
Show only the values that are not filtered by other dimensions
Apply changes and close list
Cancel changes and close list
Filters can also be applied through the grid context menu:
© 2013 Fast Reports Inc.
25
FastCube 2.0 User manual
The Filter drop-down list can also be configured as radio buttons instead of checkboxes.
Radio buttons allow the selection of only one value at a time as visible:
The Dimension values Range Editor offers conditional filtering of values. It is opened from
the dimension context menu item "Custom filter...":
© 2013 Fast Reports Inc.
Description of the FastCube Library
26
For example, the "Product" dimension can be set to filter out all values except where "Text
contains 'utensils' substring":
This is equivalent to:
The Range Editor can create multiple, simultaneous conditions of varying type:
© 2013 Fast Reports Inc.
27
FastCube 2.0 User manual
Filtering affects measures and the calculation of Totals, but the grid can also be set to
simply hide particular nodes in the headers. In this case the hidden nodes do not affect
measures and the calculation of Totals. Node hiding can only be set using the context
menu.
2.1.7
Sorting
All the data in the grid is displayed in sorted order, irrespective of the original order in the
source table. The sort order is either ascending or descending. Numeric values and date/
times are sorted in their natural order, ascending or descending. Strings are sorted
alphabetically, ascending or descending.
Every dimension in the grid can have its own sort order. For example, rows for the
"Category" dimension can have ascending order and those for the "Seller" dimension
descending order. The default sort order is ascending for all dimensions.
The sort order for a selected dimension is changed either by:
1. double-clicking on the dimension title
2. or selecting the required order from the dimension context menu (numbered '2' in
diagram below)
The current dimension sort order is marked with a special symbol (numbered '1' in
diagram below):
Apart from the sort order, it is also possible to set the sort type separately for lines and
columns.There are three types of sorting:
1. by axes values
: the default sort type
2. by measure Totals
: data is sorted by the Total values for a measure - if there
are several measures then only the values of the measure associated with the
selected cell are included in the sort
3. by active row/column : sorting is similar to the previous type, but instead of the
© 2013 Fast Reports Inc.
Description of the FastCube Library
28
Total values of the row/column the values of the current row/column (selected in the
grid) are used
The sort type is selected through the toolbar for both row dimensions and column
dimensions .
2.1.8
Grouping
FastCube can collect several dimension values into a group. Grouping is a two stage
process - group creation followed by population with values.
Grouping features:
unlimited number of dimension groups
empty groups allowed
empty groups not shown on axes
groups must have unique names inside a dimension
a dimension value cannot belong to more than one group
inclusion of a dimension value in one group automatically excludes it from all other
groups
a dimension value can be excluded from grouping
a system group "Others" can be created, which includes all values not belonging to
any other group
group deletion automatically excludes all the values it contains
group creation, deletion, renaming, value inclusion and exclusion can be performed
while the cube is active
a filter window shows all groups and their members : group filtering state depends
on member states
moving a dimension from one region to another does not reset groups
dimension groups are saved in cube files together with the dimension members
The axis shows dimensions having groups at two levels: group level and member level.
The group level contains dimension group names and also dimension values that do not
belong to any group. The member level contains the values which belong to the groups. A
group can be in a collapsed state, in which case the group members are not shown. If all
groups are collapsed then the member level is not shown.
Beware! any operation involving a group, including collapse/expansion, causes measure
recalculation because of the change to the axis.
An example of a grid where the "Manager" dimension has no grouping:
© 2013 Fast Reports Inc.
29
FastCube 2.0 User manual
The same grid with the dimension "Manager" having two groups, "Dept.1" and "Dept.2",
each manager having been moved to the correct Department group:
Note that group "Dept.1" is expanded and group "Dept.2" is collapsed. Also, manager
"Viktoria Pobednaya" does not belong to any group since she works in "Dept.3". Let's
create a group for her. First open the context menu by right-clicking on value "Viktoria
Pobednaya". The "Move to group" options are : add to a previously created group, or start
a new group. Let's choose "Create new...":
© 2013 Fast Reports Inc.
Description of the FastCube Library
And enter the department name:
The new group is created and "Viktoria Pobednaya" is moved to it:
The filter drop-down list for the "Manager" dimension now looks like this:
© 2013 Fast Reports Inc.
30
31
FastCube 2.0 User manual
And the context menu for the dimension is:
While the context menu for a dimension member is:
And the context menu for the dimension group is:
© 2013 Fast Reports Inc.
Description of the FastCube Library
2.1.9
Formatting, highlighting
2.1.9.1
Data Formatting
32
By default a grid formats data according to the field type and the precision. For numeric
measures the grid uses a number format having the same precision as the database
field. But sometimes one or more measures need to be presented differently. For
example, let's change the format of the "Price" measure to currency:
The Format Editor is opened either from the cell's context menu or through the toolbar:
© 2013 Fast Reports Inc.
33
FastCube 2.0 User manual
This editor lists the format categories on the left with the corresponding formats on the
right. The format string and decimal separator for the selected category and format are at
the bottom. Let's select the "Number" category and "$1,234.50" format. The format string
is an argument for the Delphi "Format" function, which is used by FastCube to implement
number formatting. The format string and decimal separator can be altered if necessary.
If the decimal separator is left blank then the value from the current regional setup is used:
2.1.9.2
Conditional highlighting
The grid allows custom drawing styles to be set up for particular measure values. For
example, numbers inside or outside a particular range may need to be highlighted.
Before highlighting measure values a new highlight rule must be created in the measure
editor dialog:
© 2013 Fast Reports Inc.
Description of the FastCube Library
34
Highlight rules can process measure data as value, text or data, or as NULL. Allowable
conditions depend on the type of the measure's data. So, for example, value processing
allows "greater" and "lower" conditions while text processing allows "contains" and "not
contains" conditions, which look for a substring within a text string:
The "Style..." button opens the drawing style editor:
© 2013 Fast Reports Inc.
35
FastCube 2.0 User manual
The style editor has options for the background fill style and color, and text style and color.
Solid fill style only requires a "Fill Color 1" value, but gradient fills also require a "Fill Color
2" value.
Here is an example after applying different conditional styles to some measure cells:
2.1.9.3
Continuous highlighting
As well as the conditional cell highlighting described above, FastCube can also apply four
different types of highlight known as continuous highlighting, which applies highlighting to
all cells dependent on their values. Each type of continuous highlighting is described
below.
1. Two color scale and
2. Three color scale
© 2013 Fast Reports Inc.
Description of the FastCube Library
36
Color scale highlighting fills each cell's background with a color calculated from the given
color gradient scale. The editor dialog sets the values for the extreme points and their
corresponding colors, and also for one intermediate point for the three color scale. The
values for the points can be set either as absolute numbers ("Number" option) or as one
of the following relative options:
Minimum by row/column
- minimal measure value in row/column
Percent by row/column
- value field sets the percent relative to minimal and
maximal measure values in row/column
Percentile by row/column
- value field sets the percentile relative to measure
values in row/column
An example of two color and three color scale highlighting:
3. Bar
© 2013 Fast Reports Inc.
37
FastCube 2.0 User manual
This type of highlighting draws a colored bar within the measure cell. The length of the bar
depends on the values set under the Shortest bar and the Longest bar properties. The
property values, as previously, can be set with either the absolute or the relative option.
The bar can be drawn either in a solid color or with a gradient color to white. The frame
color for the bar is set independently. The cell value can also be hidden for this type of
highlighting, leaving only the bar visible.
An example of bar highlighting with and without visible cell values:
4. Icon set
© 2013 Fast Reports Inc.
Description of the FastCube Library
38
In Icon set highlighting an icon related to the value inside the measure cell is drawn to the
left of the cell's value. The editor dialog has options for sets of 3, 4 or 5 icons. Each icon
used requires a value range to be set. The cell value can also be hidden for this type of
highlighting, leaving only the icon visible.
An example of icon set highlighting with and without visible cell values:
2.1.10 FastScript use
FastCube can use FastScipt to perform non-standard calculations.
Scripts can be used for both measure and filter calculations.
2.1.10.1 Calculated measures
To create a calculated measure we need to set the aggregate type as "Calculation" or as
"Calculation (detail)" in the measure editor.
The two types of calculated measure are:
© 2013 Fast Reports Inc.
39
FastCube 2.0 User manual
Calculation based on other measure values ("Calculation")
Measures which are calculated after other measures have been built using the
standard measure processing. The calculation function has access to other
measure values, dimension values and previous measure values. The "Calc all
cells" checkbox turns on calculation for all cells, including "empty" cells (cells which
do not have corresponding rows in the source data).
Calculation based on source data ("Calculation (detail)")
Measures which are calculated on source data and built together with standard
measures. The calculation function has access to the current source data row and
to dimension values. The "Calc all cells" checkbox is disabled for this type of
calculation.
© 2013 Fast Reports Inc.
Description of the FastCube Library
40
The use of either type of calculated measure requires either a new calculation function to
be written or an existing function to be chosen in the "Function" field - double-clicking on
the "Function" field opens the measure editor. If the "Function" field is empty then a new
function is automatically created.
The "Order" field sets the calculation order.
The measure editor window has three areas:
1. toolbar
2. text editor with syntax highlighting
3. treeview with available variables, functions and classes
The toolbar contains the actions for checking syntax, saving changes, cancelling changes
and choice of programming language.
The text editor is used to compose and edit the function code (a 'script'). The function
code is a program written in the chosen language that is interpreted by FastScript at
calculation time. The function code must return a value through the "Result" variable.
The script has access to the following grid elements:
dimension list - Dimensions : TDimensions;
measure list - Measures : TMeasures;
field list
- SliceFields : TfcxSliceFields;
service variable
- CustomObject: TfcxCustomObject.
© 2013 Fast Reports Inc.
41
FastCube 2.0 User manual
The service variable enables the reading/writing of user data
for a particular measure cell. For example, a pointer for future
use can be assigned to any object created in the calculation
function. Each cell has its own service variable. The
CustomObject can only be used in measures built on source
data. If the CustomObject variable contains a pointer to an
allocated object or memory area then it must be deallocated
after use. For this purpose a 'Final: boolean' argument is
passed to the function body. If 'Final' = 'True' then the
finalization procedure is activated, which includes memory
deallocation.
The following classes are available for use in calculated measure functions:
// Measure list
TMeasures = class
published
property Items[AIndex: Integer]: TMeasure;
property ItemByCaption[AIndex: String]: TMeasure;
property ItemByName[AIndex: String]: TMeasure;
property Count: Integer;
property RecordCount: integer;
property DetailValue[ARecordIndex: Integer; AFieldName: String]:
Variant;
property XLevel: integer;
property YLevel: integer;
end;
// Dimension list
TDimensions = class
published
property Items[AIndex: Integer]: TDimension;
property ItemByCaption[AIndex: String]: TDimension;
property ItemByName[AIndex: String]: TDimension;
property XAxisItems[AIndex: Integer]: TDimension;
property YAxisItems[AIndex: Integer]: TDimension;
property IsTotalByCol: boolean
property IsTotalByRow: boolean
property XLevel: integer;
property YLevel: integer;
property XAxisLevelsCount: integer;
property YAxisLevelsCount: integer;
end;
// Field list
TfcxSliceFields = class
published
property Items[Index: Integer]: TfcxSliceField;
property ItemByCaption[AIndex: String]: TfcxSliceField;
property ItemByName[AIndex: String]: TfcxSliceField;
property Count;
end;
© 2013 Fast Reports Inc.
Description of the FastCube Library
42
// Measure
TMeasure = class
published
property Caption: String;
property CurrentValue: Variant;
property CurrentCaption: String;
property FieldName: String;
property ColOffsetValue[Offset: integer]: Variant;
property RowOffsetValue[Offset: integer]: Variant;
property ColOffsetValueWithDimValue[ADimValue: Variant]: Variant;
property RowOffsetValueWithDimValue[ADimValue: Variant]: Variant;
property TotalValueForDims[ADimNames: String]: Variant;
property ColRowOffsetValue[ColOffset, RowOffset: integer]: Variant;
property ColRowOffsetValueWLevel[ColOffset, RowOffset,
ColLevelOffset, RowLevelOffset: integer]: Variant
end;
// Dimension
TDimension = class
published
property FieldName: String;
property Caption: String;
property CurrentValue: Variant;
property CurrentCaption: String;
property SubGroup: TDimension;
end;
// Field
TfcxSliceField = class(TPersistent)
published
property FieldName: String;
property Caption: String;
property CurrentValue: Variant;
property CurrentCaption: String;
property FilterCount: Integer;
property IsFiltered: Boolean;
end;
// Service object
TfcxCustomObject = class(TPersistent)
published
property Value: Pointer;
property ValueIsNil: Boolean;
end;
Here are detailed descriptions of the methods and properties of the above listed classes:
TMeasure
o Caption - measure caption
o FieldName - measure field name
© 2013 Fast Reports Inc.
43
FastCube 2.0 User manual
o CurrentValue - current value
o CurrentCaption - current value caption
o ColOffsetValue[Offset: integer] - measure value from cell with column offset from
the current value
o RowOffsetValue[Offset: integer] - measure value from cell with row offset from the
current value
o ColOffsetValueWithDimValue[ADimValue: Variant] - measure value corresponding
to current dimension ADimValue value of column dimensions
o RowOffsetValueWithDimValue[ADimValue:
Variant]
measure
value
corresponding to current dimension ADimValue value of row dimensions
o TotalValueForDims[ADimNames: String] - value of total over requested
dimensions (DimNames separated by ',')
o ColRowOffsetValue[ColOffset, RowOffset: integer] - measure value from cell with
column and row offset from the current value
o ColRowOffsetValueWLevel[ColOffset,
RowOffset,
ColLevelOffset,
RowLevelOffset: integer] - measure value from cell with column and row offset
from the value on requested level
TDimension
o Caption - dimension caption
o FieldName - dimension field name
o CurrentValue - current value
o CurrentCaption - current value caption
o SubGroup - dimension subgroup
TfcxSliceField
o Caption - field caption
o FieldName - field name
o CurrentValue - current value (available only for filter script)
o CurrentCaption - current caption (available only for filter script)
o FilterCount - number of filtered values
o IsFiltered - true when field values are filtered, otherwise false
TMeasures
o Items[AIndex: Integer] - measure array with access by index
o ItemByCaption[AIndex: String] - measure array with access by caption
o ItemByName[AIndex: String] - measure array with access by name (default
property)
o Count - number of measures
o RecordCount - number of detail rows
o DetailValue[ARecordIndex: Integer; AFieldName: String] - field value in the detail
row
o XLevel - Level of X axis to which the current cell belongs
o YLevel - Level of Y axis to which the current cell belongs
TDimensions
© 2013 Fast Reports Inc.
Description of the FastCube Library
44
o Items[AIndex: Integer] - dimension array with access by index
o ItemByCaption[AIndex: String] - dimension array with access by caption
o ItemByName[AIndex: String] - dimension array with access by name (default
property)
o Count - number of dimensions
o XAxisItems[AIndex: Integer] - dimension in X axis
o YAxisItems[AIndex: Integer] - dimension in Y axis
o IsTotalByCol - true when cell is a total cell by X axis, otherwise false
o IsTotalByRow - true when cell is a total cell by Y axis, otherwise false
o XAxisLevelsCount - number of dimensions in X axis
o YAxisLevelsCount - number of dimensions in Y axis
o XLevel - Level of X axis to which the current cell belongs
o YLevel - Level of Y axis to which the current cell belongs
TfcxSliceFields
o Items[Index: Integer] - field array with access by index
o ItemByCaption[AIndex: String] - field array with access by caption
o ItemByName[AIndex: String] - field array with access by name (default property)
o Count - number of fields
TfcxCustomObject
o Value - pointer to a user object or memory area
o ValueIsNil - checks whether value is empty : used for checking before initial object
creation or memory allocation
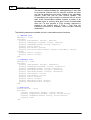
Here is an example of a calculated measure value on other measures:
Sum = Price * Amount + WorkPrice
procedure
func_3(varprocedure header
Result: Variant);
var
declare variable wp
wp: Variant;
begin
wp := Measures['Workassign current measure "Work price" value
price'].CurrentValue;
to wp variable
if VarType(wp) <= 1 if wp does not exists (Null or UnAssigned),
then wp := 0;
then treat wp value as 0
Result :=
Measures
['Price'].CurrentValue*
Measures
['Amount'].CurrentValue+
wp;
end;
© 2013 Fast Reports Inc.
(we use this test to prevent addition
using Null and UnAssigned values)
define Result as current measure "Price"
value
multiplied by current value of measure
"Amount"
plus wp value.
45
FastCube 2.0 User manual
A function which calculates the measure value on other measures is called once for each
cell (dimension intersection). If "Calc all cells" is not set then the function is not called for
empty cells.
A function which calculates the measure value on source data is called for each cell as
many times as rows exist in the source data. The function has two arguments: Result
and Final:
Result - current measure value
Final - true when this is a final call, otherwise false
The final call occurs for each non-empty cell when the source data traverse has finished.
In this case the function Final argument has the value "True". The final call is needed for
performance supplementary calculations and for memory deallocation.
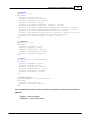
In the following example there are two functions:
AmountScriptOnGetValue function - calculates sum of "Amount"" field : note that
summation occurs only when Final = False
AveragePriceOnGetValue function - calculates average price : requires the summation
of values of "Amount" and "Cost" measures and
calculation of the average in the final call : note that
the CustomObject variable is used to store the
sum of the "Amount" measure : memory
deallocation is not needed as memory has not
previously been allocated
© 2013 Fast Reports Inc.
Description of the FastCube Library
46
2.1.10.2 Measures with calculated filters
Measures can have a filter defined by a script. A filter is used if a measure is to be
calculated only for those rows of source data that meet some criteria. The script is run for
each row of the source data before the calculation of the measure occurs. The script
checks whether source rows meet one or more criteria. The script return value (Boolean
type) controls whether or not the rows are used for the measure calculation. A 'False'
return value means skip that particular row, while 'True' means accept it.
A filter script has access to the following variable:
field list - SliceFields: TfcSliceFields
Let's look at an example:
We need to calculate a customer's prepayments. Prepayment is modelled as a negative
balance, so we need to sum only negative balances, that is, to create a calculated
measure on the "Balance" field with aggregate function "Sum". We also need to create a
filter for this measure to accept only rows with Balance < 0:
begin
Result :=SliceFields['Balance'].CurrentValue < 0; // test
field with "Balance" name
end
The calculated filter can be applied both to regular and to calculated measures.
The filter is created on the "Filtering" page of the measure editor:
© 2013 Fast Reports Inc.
47
FastCube 2.0 User manual
2.1.11 Data export
FastCube can export grid data to a number of formats for further editing, archiving or
sending by email, etc.
Presently export is supported in five formats: Excel, ODS, XML, HTML and DBF. Export in
each format is initiated from buttons on the toolbar:
Exporting uses either the grid data or the source cube data, depending on the export
format chosen. So, for example, Excel export uses the dimensions and measures in the
grid, while DBF export is from the source cube data.
In addition to exporting data, FastCube can copy data from a selected region to the
clipboard. A region in the grid can be selected either using the mouse or by pressing the
Shift+arrow keys on the keyboard. Copying to the clipboard is done using the usual 'Ctrl
+C' or 'Ctrl+Insert' combinations or using the context menu:
© 2013 Fast Reports Inc.
Description of the FastCube Library
48
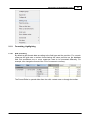
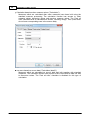
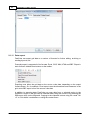
2.1.11.1 Export to XLS
Excel is a Microsoft application for working with electronic spreadsheets. It is included in
Microsoft Office. XLS files can also be opened with OpenOffice and LibreOffice.
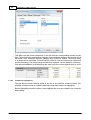
When exporting to Excel format the output file settings are made in the export dialog:
Export settings:
Repeat axes values
column
© 2013 Fast Reports Inc.
- grouped values in grid headers are repeated for each row/
49
FastCube 2.0 User manual
Grid lines
- whether or not to draw grid lines
Open after export
- open file immediately after export (requires Excel,
OpenOffice or LibreOffice)
Auto create file - create the file name without showing the file save dialog
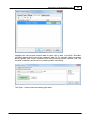
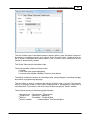
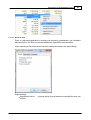
2.1.11.2 Export to ODS
OpenDocument Format (ODF : OASIS Open Document Format for Office Application)
was designed by OASIS and based on the XML format used in OpenOffice.
FastCube supports export to the table type OpenDocument format (.ods). These files can
be opened in OpenOffice or LibreOffice.
When exporting to ODF format the output file settings are made in the export dialog:
Export settings:
Repeat axes values
column
Open after export
LibreOffice)
- grouped values in grid headers are repeated for each row/
- open file immediately after export (requires OpenOffice or
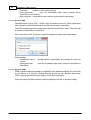
2.1.11.3 Export to HTML
HTML (Hypertext Markup Language) is regarded as the standard language for documents
on the Internet. It is used for creating relatively simple but well designed documents.
HTML supports hypertext linking as well as simple document layout.
When exporting to HTML format the output file settings are made in the export dialog:
© 2013 Fast Reports Inc.
Description of the FastCube Library
50
Export settings:
HTML format
o HTML table
- export as a normal HTML table (<table> tag)
o Excel Worksheet HTML - export in HTML format containing Excel extensions
Repeat axes values - grouped values in grid headers are repeated for each row/
column
Open after export
- open file immediately after export
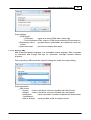
2.1.11.4 Export to XML
XML (Extensible Markup Language) is an extendable markup language. XML is intended
for structured data storage and also for information exchange between different
programs.
When exporting to XML format the output file settings are made in the export dialog:
Export parameters:
XML format:
o Rowset
- export cube data in a format compatible with ADO Rowset
o Dataset
- export cube data in a format compatible with .Net Dataset
o DataPacket
- export cube data in a format compatible with Embarcadero
ClientDataset
o XML for Analysis - export grid data in XML for Analysis format
© 2013 Fast Reports Inc.
51
FastCube 2.0 User manual
Open after export
- open file immediately after export
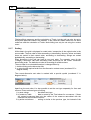
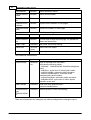
2.1.12 Toolbar
The grid toolbar contains the following set of buttons:
Icon Command
Save cube or scheme to file
cube files have an mdc extension - they contain source data array, filters and
formatting settings
scheme files have an mds extension - as well as formatting settings they can
also contain filters
Load cube or scheme file
also allows loading of an additional data array to the current cube (e.g. data from
another period)
Clear formatting scheme
Export data to external formats
drop-down menu shows list of available formats
Transpose grid
Hide dimension values having only zero or empty data in rows
Hide dimension values having only zero or empty data in columns
Select sort mode by rows
Select sort mode by columns
Open measure editor dialog
Open measure highlight options
Open measure format options
Open field list window
Show information about grid structure, data loading elapsed time, creation of
headers and calculation of measures
2.2
The Chart
The data in a grid may be presented as a cumulative 2D chart. The TeeChart component
is used for display of the chart. Depending on the settings, one of the major dimensions of
the rows/columns is used for the chart series and the opposing dimension (i.e. the major
dimension in the columns/rows) is used to supply the values in each of the series.
© 2013 Fast Reports Inc.
Description of the FastCube Library
52
If the source grid does not contain row or column dimensions, an internal representation
of a grid with row and column dimensions will be built inside the chart. The chart
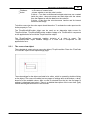
properties dialog is opened from the toolbar:
The main property is the source of data for the series and categories. Possible sources
are: the dimensions and the measures in the grid. The dimension region, number of
dimensions for the names of categories/series and the measure index need to be
selected appropriate to the selected source.
© 2013 Fast Reports Inc.
53
2.2.1
FastCube 2.0 User manual
The Chart Toolbar
The chart toolbar contains the following set of buttons:
Icon
Command
Save chart layout settings to file
Load chart layout settings from file
Select type of chart series
"Freeze" chart
chart will not update automatically
Chart properties editor
Display labels on values of series
Display chart legend
Display data editor
Copy to clipboard
Multiple-bar type
2.3
Working with FastReport Report Generator
Building a report with the help of a FastCube grid is very similar to creating standard
cross-tab reports in the FastReport environment. To avoid repetition, refer to the parts of
the FastReport manual dealing with cross-tab reports. However, the practicalities of
creating a grid-based report are described here.
All grids use a multi-dimensional data structure (the cube) as their data source. A cube
must contain data in a format that is suitable for grid construction. This minimizes the
time required for building and setting up the grid. One cube may serve as a data source
for an unlimited number of grids having different structures. Two elements are required for
building a report:
1. a cube (TfcxpCube) - the data source for the grid
2. a cross-view (TfcxpCrossView) - the object representing the data in the grid
To build a grid-based report place a TfcxpCube
object on the data sheet from the
FastCube 2 palette. Then using the object inspector connect a dataset to this object, or
enter the name of a previously created cube file.
The TfcxpCube object's main properties are:
Dataset
- a FastReport dataset : at the moment only TfrxDBDataset is
supported
© 2013 Fast Reports Inc.
Description of the FastCube Library
FileName
Active
54
- a file name of a saved cube
- shows whether or not the cube is active
if Active = True then multi-dimensional data structures are created
inside the cube : these structures are filled either with the values
from the Dataset or with the data from the cube file
if Active = False then the cube becomes inactive and its internal
structures are empty
To build a cross-view the cube report should be active. To activate the cube report set its
Active property to True.
The TfcxpSliceGridProvider object can be used as an alternative data source for
TfcxpCrossView. TfcxpSliceGridProvider enables linkage of a TfcxSliceGrid component
on the application's form with the TfcxpCrossView object.
The TfcxpChartView component enables inclusion of a chart in report. The
TfcxpChartProvider object enables linkage of a chart with a component on the
application's form.
2.3.1
The cross-view object
The cube data is output using a cross-view object, TfcxpCrossView. Place the "FastCube
2 Cross-tab" object on the report design page:
The main settings for the object are listed in its editor, which is opened by double-clicking
on the object. The cross-view editor has two pages of settings and, at the bottom, a dropdown list of the available cubes. After a cube is selected from the list, the first page of
settings is displayed (see below). There is a detailed description of the cross-view (grid)
toolbar and the grid itself earlier in this manual.
© 2013 Fast Reports Inc.
55
FastCube 2.0 User manual
The second page of the editor contains a number of settings related to the cross-view
layout:
© 2013 Fast Reports Inc.
Description of the FastCube Library
56
The diagram is a representation of the cross-view object as it currently appears in the
report, using the currently selected style. The drop-down "Select style" menu gives a
choice of one of six preset color schemes for the cross-view display layout. At the bottom
of the page there are options for customizing the appearance of the cross-view:
Field names - show field (dimension) names
Column header
- show columns headers
Reprint column header on new page - repeat column headers on new pages
Row header - show row headers
Reprint row header on new page
- repeat row headers on new pages
Border around cells - show border around cells
Print down then across
- if the cross-view is bigger than a page, it is printed
first down and then across
Auto size
- defines how cell width and height are calculated (see below)
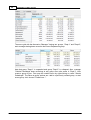
The Cross-view object properties (TfcxpCrossView) are:
Property
Cube
© 2013 Fast Reports Inc.
Type
Description
data related settings
TfrcxpCu
data source - cube
be
representation related settings
57
FastCube 2.0 User manual
ShowNames
Boolean
show dimension names
ShowColumnH
eader
Boolean
show column header
ShowRowHead
er
Boolean
show row header
RepeatColumn
Headers
Boolean
repeat column headers on new pages
RepeatRowHea
ders
Boolean
repeat row headers on new pages
cell size settings
PaintSizes
class
(see table below)
other settings
DownThenAcro
ss
Boolean
if cross-view is larger than the page, it is printed first
down and then across
GapX, GapY
Extended
horizontal and vertical spacing
NextCross
TfrcCros
sView
next cross-view object
NextCrossGap
Extended
spacing from the next cross-view object
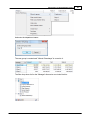
The PaintSizes members are:
Property
Type
Description
AutoSizeStyle
enumerat
ion
style of automatic size calculation
may have the following values:
- ssDefault : DefaultColWidth, DefaultRowHeight are
used
- ssBySlice : by the size of "actual" grid in editor
- ssAutoColWidth : automatic width calculation
- ssAutoColWidthRestrict : automatic width
calculated with value limitation
- ssAutoRowHeight : automatic height calculation
- ssByMemoSize : by the size of memo objects
nested in cross-view
MaxColWidth
Extended
width limit when AutoSizeStyle =
ssAutoColWidthRestrict
DefaultRowHei
ght,
DefaultColWidt
h
Extended
default values for cross-view drawing
There are several styles for setting the cell width and height while creating the report:
© 2013 Fast Reports Inc.
Description of the FastCube Library
58
ssDefault - the width and height of all the cells are set to DefaultColWidth and
DefaultRowHeight, respectively
ssBySlice
- the sizes of the external grid or the editor grid are used
ssAutoColWidth - automatic column width calculation : column width is set
according to the values and the fonts in use : the width is large enough to fit all the
data in the column
ssAutoColWidthRestrict - also automatic column width calculation (as before) but
limited to a MaxColWidth value : if width exceeds MaxColWIdth then the height of the
affected row increases
ssAutoRowHeight
- automatic row height calculation : row height is set
according to the values and fonts in use : the height is large enough to fit all the data
in the row, providing that the column width is set to DefaultColWidth.
ssByMemoSize - by the size of the memo-objects, which are embedded in the
TfrcCrossView object in the FastReport designer : memo-objects are able to change
their size only when AutoSizeStyle = ssByMemoSize
If required the print layout of the cross-view may be further customized. This includes the
selection of font (size, style, color etc.), background fill, alignment etc. separately for each
memo-object embedded into the TfrcCrossView in the FastReport designer. All these
changes are made in the object inspector : the properties are similar to the properties of
the TfrxCrossObject component in FastReport.
© 2013 Fast Reports Inc.