1
HD RANGER 2
ISDB-T/TB
TV & SATELLITE ANALYSER
- 0 MI2025 99 Washington Street
Melrose, MA 02176
Phone 781-665-1400
Toll Free 1-800-517-8431
Visit us at www.TestEquipmentDepot.com
SAFETY NOTES
Read the user’s manual before using the equipment, mainly "SAFETY RULES"
paragraph.
on the equipment means "SEE USER’S MANUAL". In this manual
The symbol
may also appear as a Caution or Warning symbol.
WARNING AND CAUTION statements may appear in this manual to avoid injury
hazard or damage to this product or other property.
MULTIMEDIA CONTENT
You can access instantly to any chapter by clicking on the title of the chapter in the
table of contents.
Click on the arrow
at the top right of the page to return to the table of contents.
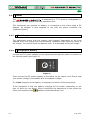
. It identifies a direct
Throughout this manual are boxes with the symbol
access to an explanatory video related to the function where it is. User has to click on
this icon to watch the video.
All videos are in the PROMAX channel on YouTube, which is accessible through the
PROMAX website.
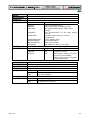
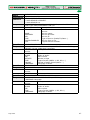
USER'S MANUAL VERSION
Version
1.2
Date
July 2014
Software Version
13.2
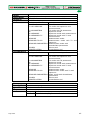
SAFETY RULES
* The safety could not be assured if the instructions for use are not closely
followed.
* Use this equipment connected only to systems with their negative of
measurement connected to ground potential.
* The AL-103 external DC charger is a Class I equipment, for safety reasons plug it
to a supply line with the corresponding ground terminal.
* This equipment can be used in Overvoltage Category I installations and
Pollution Degree 2 environments.
External DC charger can be used in Overvoltage Category II, installation and
Pollution Degree 1 environments.
* When using some of the following accessories use only the specified ones to ensure
safety.:
Rechargeable battery
External DC charger
Car lighter charger cable
Power cord
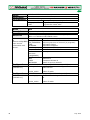
* Observe all specified ratings both of supply and measurement.
* Remember that voltages higher than 70 V DC or 33 V AC rms are dangerous.
* Use this instrument under the specified environmental conditions.
* When using the power adaptor, the negative of measurement is at ground
potential.
* Do not obstruct the ventilation system of the instrument.
* Use for the signal inputs/outputs, specially when working with high levels,
appropriate low radiation cables.
* Follow the cleaning instructions described in the Maintenance paragraph.
* Symbols related with safety:
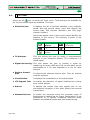
Descriptive Examples of Over-Voltage Categories
Cat I
Low voltage installations isolated from the mains.
Cat II Portable domestic installations.
Cat III Fixed domestic installations.
Cat IV Industrial installations.
July 2014
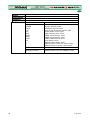
TABLE OF CONTENTS
1 INTRODUCTION ........................................................................................ 1-1
1.1 Description .................................................................................... 1-1
2 SETTING UP ............................................................................................. 2-3
2.1 Package Content ............................................................................ 2-3
2.2 Power ........................................................................................... 2-4
2.2.1 First charge................................................................................ 2-4
2.2.2 Charging the battery ................................................................... 2-4
2.2.3 Charge/discharge times ............................................................... 2-5
2.2.4 Smart control battery .................................................................. 2-5
2.2.5 Usage Tips ................................................................................. 2-6
2.3 Equipment Details .......................................................................... 2-7
2.4 Switching On/Off the equipment ....................................................... 2-9
2.5 Screen Icons and Dialog boxes ........................................................2-11
2.6 Menu Tree ....................................................................................2-12
2.7 Controls .......................................................................................2-16
2.7.1 Touch Screen ............................................................................2-16
2.7.2 Joystick ....................................................................................2-21
2.7.3 Keyboard shortcuts ....................................................................2-22
2.7.4 Softkeys ...................................................................................2-27
2.7.5 Virtual Keyboard ........................................................................2-27
2.8 StealthID Function: Signal Auto-identification ....................................2-28
2.9 Equipment Settings and Configuration ..............................................2-30
2.9.1 Settings Menu ...........................................................................2-30
2.9.2 Video & Audio settings................................................................2-33
2.9.3 Preferences Menu ......................................................................2-34
3 MEASUREMENT MODE ..............................................................................3-39
3.1 Introduction..................................................................................3-39
3.2 Operation .....................................................................................3-40
3.3 Screen Description.........................................................................3-40
3.4 GENERIC Signal.............................................................................3-42
4 SPECTRUM ANALYSER MODE .....................................................................4-43
4.1 Introduction..................................................................................4-43
4.2 Operation .....................................................................................4-43
4.3 Screen description .........................................................................4-47
4.4 Joystick Operation .........................................................................4-48
4.5 Specific Options.............................................................................4-50
4.6 Locking a signal.............................................................................4-51
4.7 Satellite Identification ....................................................................4-52
July 2014
5 TV MODE ................................................................................................5-53
5.1 Introduction..................................................................................5-53
5.2 Operation .....................................................................................5-53
5.3 Screen Description.........................................................................5-54
5.3.1 TV MODE: TV views....................................................................5-54
5.3.2 TV MODE: Radio views ...............................................................5-58
5.4 Specific Options.............................................................................5-60
5.5 IRG Descriptor ..............................................................................5-60
6 GENERAL MENU OPTIONS .........................................................................6-62
6.1 F1: Tuning....................................................................................6-62
6.2 F2: Signal Parameters ....................................................................6-66
6.3 F3: Tools ......................................................................................6-67
7 TOOLS ...................................................................................................7-69
7.1 TS Analyser ..................................................................................7-69
7.1.1 Description ...............................................................................7-69
7.1.2 General Operation......................................................................7-69
7.1.3 Table Analyser...........................................................................7-70
7.1.4 Bitrate Analyser.........................................................................7-72
7.1.5 Alarms .....................................................................................7-74
7.2 Constellation.................................................................................7-76
7.2.1 Description ...............................................................................7-76
7.2.2 Operation .................................................................................7-76
7.2.3 Menu Options ............................................................................7-78
7.3 LTE Ingress test ............................................................................7-79
7.3.1 Description ...............................................................................7-79
7.3.2 Operation .................................................................................7-79
7.3.3 Menu options ............................................................................7-81
7.4 Echoes .........................................................................................7-81
7.4.1 Description ...............................................................................7-81
7.4.2 Operation .................................................................................7-82
7.4.3 Menu Options ............................................................................7-84
7.5 Spectrogram .................................................................................7-85
7.5.1 Description ...............................................................................7-85
7.5.2 Operation .................................................................................7-85
7.5.3 Menu options ............................................................................7-87
7.6 Attenuation Test............................................................................7-87
7.6.1 Description ...............................................................................7-87
7.6.2 Operation .................................................................................7-88
7.6.3 Menu Options ............................................................................7-90
7.7 Signal Monitoring...........................................................................7-91
7.7.1 Description ...............................................................................7-91
7.7.2 Operation .................................................................................7-91
7.7.2.1 Settings ................................................................................7-92
7.7.2.2 Screen Description..................................................................7-93
7.7.3 Menu Options ............................................................................7-94
July 2014
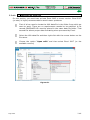
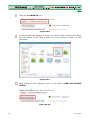
7.7.4 Data file processing....................................................................7-94
7.7.4.1 Description ............................................................................7-94
7.7.4.2 Obtaining an excel file .............................................................7-95
7.8 Datalogger ...................................................................................7-97
7.8.1 Description ...............................................................................7-97
7.8.2 Operation .................................................................................7-97
7.9 Export key.................................................................................. 7-101
7.9.1 Description ............................................................................. 7-101
7.9.2 Operation ............................................................................... 7-102
7.10 Explore Channel Plan ................................................................... 7-103
7.10.1 Description ............................................................................. 7-103
7.10.2 Operation ............................................................................... 7-103
8 IPTV..................................................................................................... 8-106
8.1 Description ................................................................................. 8-106
8.2 Operation and Options ................................................................. 8-106
8.3 Settings and Preferences .............................................................. 8-107
9 INSTALLATIONS MANAGEMENT................................................................ 9-108
9.1 Description ................................................................................. 9-108
9.2 Operation ................................................................................... 9-108
9.3 Installation Management .............................................................. 9-109
9.4 New installation........................................................................... 9-112
9.5 Tools ......................................................................................... 9-113
10 CONNECTING TO EXTERNAL DEVICES.................................................... 10-114
10.1 Mini-USB connector.................................................................... 10-115
10.1.1 Connecting the HD RANGER 2 ISDB-T/TB (host) to an USB memory (device)10-115
10.1.2 Connecting a computer (host) to the HD RANGER 2 ISDB-T/TB (device).... 10-117
10.2 V/A Output Connector ................................................................ 10-117
10.3 V/A Input Connector .................................................................. 10-118
10.4 RF Connector ............................................................................ 10-118
10.5 HDMI Output ............................................................................ 10-120
10.6 Common Interface Slot............................................................... 10-121
10.7 TS ASI Input / Output ................................................................ 10-122
10.7.1 TS-ASI Input......................................................................... 10-122
10.7.2 TS-ASI Output....................................................................... 10-123
10.8 IP network................................................................................ 10-123
11 SPECIFICATIONS ................................................................................ 11-124
11.1 General Specifications ................................................................ 11-124
11.2 Measurement Mode.................................................................... 11-127
11.3 Spectrum Analyser Mode ............................................................ 11-129
11.4 TV Mode................................................................................... 11-131
11.5 Tools ....................................................................................... 11-132
11.6 IPTV ........................................................................................ 11-133
11.7 Transport Stream Analyser ......................................................... 11-134
11.8 Options .................................................................................... 11-135
July 2014
12 MAINTENANCE.................................................................................... 12-137
12.1 Considerations about the Screen.................................................. 12-137
12.2 Cleaning Recommendations ........................................................ 12-137
ANNEX 1
SIGNALS DESCRIPTION .................................................................. 1
ANNEX 2
HOW TO POINT A DISH ANTENNA ...................................................13
ANNEX 3
DiSEqC COMMANDS ......................................................................21
ANNEX 4
REMOTE CONTROL COMMANDS ......................................................31
ANNEX 5
OP-002-PS: OPTICAL + 5 GHz RF AUXILIARY INPUT OPTION ..............53
ANNEX 6
OP-002-GPS: SIGNAL COVERAGE OPTION........................................67
ANNEX 7
OP-002-DAB: DAB/DAB+ OPTION ...................................................79
ANNEX 8
MULTIMEDIA CONTENT..................................................................83
July 2014
TV & SATELLITE ANALYSER
HD RANGER 2 ISDB-T/TB
1
1 INTRODUCTION
1.1
Description
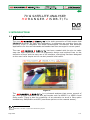
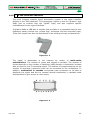
The new HD RANGER 2 ISDB-T/TB is the sixth generation of field meters that
PROMAX launches. As each new generation, it represents an evolution from the
previous, since it integrates the latest technological innovations and develops
applications for the new demands and needs that have emerged in recent years.
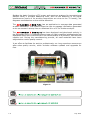
The new HD RANGER 2 ISDB-T/TB has been created with the aim to make
easy the user experience. From its ergonomic design and stylized lines to the
reduction of keys and the easy use of its interface, everything has been designed
so the user has a simple tool to use but powerful and useful.
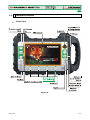
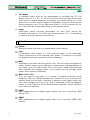
Figure 1.
The HD RANGER 2 ISDB-T/TB is a universal analyser that covers several of
the most popular standards as well as formats such as MPEG-2 or MPEG-4 and
Dolby audio. There is also the possibility of an extension to work in fibre optics
installations, DAB/DAB+ and GPS (see these options on the manual annex).
1
Trademark of the DVB - Digital Video Broadcasting Project.
July 2014
1-1
Besides the basic functions of TV meter and spectrum analyser for terrestrial and
satellite band, it provides additional tools, such as the detection of 4G signal
interferences (some of its working frequencies are close to the TV bands), the
diagrams constellations or the echoes detection.
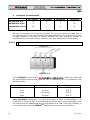
The HD RANGER 2 ISDB-T/TB has an application to manage data generated
at each installation. This feature helps the user to manage information generated
so he can access it at any time or download it to a PC for further analysis.
The HD RANGER 2 ISDB-T/TB has been designed and developed entirely in
the European Union. A multidisciplinary team of highly qualified professionals has
dedicated effort and commitment to the development of a powerful, efficient and
reliable tool. During the manufacturing process, all used materials have been
subjected to a strict quality control.
In an effort to facilitate its work to professionals, our long experience ensures an
after sales quality service, which includes software updates and upgrades for
free.
Figure 2.
1-2
July 2014
2 SETTING UP
2.1
Package Content
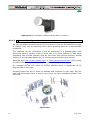
Check that your package contains the following elements:
HD RANGER 2 ISDB-T/TB Analyser.
External DC charger.
Mains cord for external DC charger.
Car lighter charger.
"F" Adapters (3 units).
•
"F" / H - BNC / H Adapter.
•
"F" / H - DIN / H Adapter.
•
"F" / H - "F" / H Adapter.
Support belt and carrying bag.
USB On-the-go (OTG)(A) Male - Mini USB (B) Male cable.
USB cable (A) Female - Mini USB (B) Male cable.
4V/RCA Jack Cable.
Transport suitcase.
Quick Start Guide.
NOTE: Keep the original packaging, since it is specially designed to protect the
equipment. You may need it in the future to send the analyser to be
calibrated.
July 2014
2-3
2.2
Power
The HD RANGER 2 ISDB-T/TB is powered by a 7.2 V built-in rechargeable LiIon battery of high quality and long operation time.
This equipment can operate on battery or connected to the mains using a DC
adapter. An adapter is also supplied to use with the power connector car
(cigarette lighter).
2.2.1
First charge
The equipment comes with the battery half charged. Depending on the time
elapsed from first charge and environmental conditions may have lost some of
the charge. You should check the battery level. It is advisable a first full charge.
2.2.2
Charging the battery
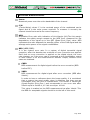
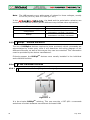
Connect the DC power adapter to the equipment through the power connector on
the left side panel (see figure 3).
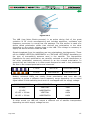
Figure 3.
Then connect the DC power adapter to the mains via the mains cord. Ensure that
your mains voltage is compatible with the adapter voltage.
For a fast charging of the battery is necessary to switch off the equipment.
If the equipment is ON, the battery charging will be slower, depending on the
type of work you are doing. When connecting the equipment to the mains the
appears inside the battery icon.
mains connected symbol
2-4
July 2014
When the equipment is connected to the mains, the CHARGER indicator remains
on. This indicator changes its colour according to the percentage of battery
charge:
RED
Less than 80% of charge.
ORANGE
Between 80% and 90% of charge.
GREEN
100% full charge.
When switching on the equipment, the battery voltage is checked. If the tension
is too weak to start, the LED EXT and DRAIN flashes and the equipment does not
start up. In this case please charge the battery immediately.
2.2.3
Charge/discharge times
Average charging time with the equipment off (fast charge):
3 hours to achieve an 80% charge.
5 hours to achieve a 100% charge.
With the equipment on (slow charge):
5 hours to achieve an 80% charge.
8 hours to achieve a 100% charge.
Average discharge time (with external supply disabled):
With the battery full charge the average battery time is 5:30 hours.
With the battery at 80% charge the average battery time is 4 h.
2.2.4
Smart control battery
The built-in battery of the equipment is of the "smart" type, which means that
reports its state of charge. This information is displayed inside the battery icon in
the form of the average time available. In this way the user can know at any
time the remaining battery level.
The remaining time charge that appears is calculated according to the work that
has been doing. If you activate the external supply of the equipment, the
average time would be reduced according to the increase in consumption that
occurs.
July 2014
2-5
2.2.5
Usage Tips
The battery is losing storage capacity as you go through its life. Contact your
PROMAX distributor when necessary to replace the battery.
To prolong battery life the user should follow these tips:
In case of providing a long inactivity period of the equipment it is
advisable to make every 3 months a charge / discharge cycle and a
subsequent partial charge (40% aprox.).
It is advisable to keep it in a cool place and away from heat.
You should avoid keeping the battery for a long period of time at full load
or fully discharged.
There is not necessary to wait to fully discharge before a charge because
these batteries have no memory effect.
2-6
July 2014
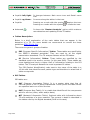
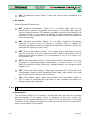
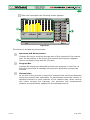
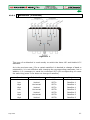
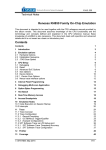
2.3
Equipment Details
Front View
Figure 4.
July 2014
2-7
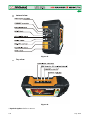
Lateral view
Figure 5.
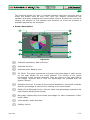
Top view
Figure 6.
* Optical Option. Refer to annex.
2-8
July 2014
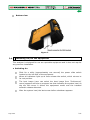
Bottom view
Figure 7.
2.4
Switching On/Off the equipment
This analyser is designed for use as a portable equipment and it does not require
any previous installation.
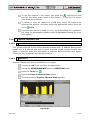
► Switching On:
Slide for a while (approximately one second) the power slide switch
located on the left side of the equipment.
When all indicators light up at once release the switch, which returns to
its rest position.
The boot image (user can select the boot image from "Preferences"
menu) appears and also a progress bar that indicates the system load. At
the top left corner it shows the equipment model and the installed
software release detected.
After the system load, the last screen before shutdown appears.
July 2014
2-9
► Switching Off:
Slide for a while (approximately one second) the power slide switch
located on the left side of the equipment.
When the screen goes off release the switch, which returns to its rest
position.
The starting display picture appears and the progress bar showing the
system shutdown progress.
► Reset:
key for 5 seconds. The equipment automatically turns off.
Press the
Use only in case of system crash.
(press 1s), APPEARANCE tab, option "Off" the
In the PREFERENCES menu
user can activate the automatic shutdown option, selecting a waiting time (time
without pressing any key) after which the equipment turns off automatically.
2-10
July 2014
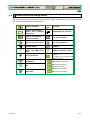
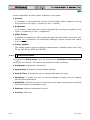
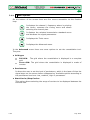
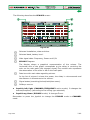
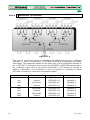
2.5
Screen Icons and Dialog boxes
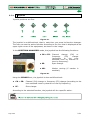
On the screen are some icons that provide useful information to the user about
the current status of the instrument.
Battery charging.
Warning.
Battery not charging.
Yellow level indicates
charge left.
USB flash drive inserted.
Battery not charging,
time left indicator.
LTE filter enabled.
USB in serial port mode.
Current installation.
Satellite band.
SATCR commands
enabled.
Current voltage, 22 kHz
signal and LNB power
level
5 GHz RF Auxiliary Input
Terrestrial band.
Multi-function Joystick
enabled.
Two-letter code indicates the
exact function:
Compressed
installation.
OK.
FR Frequency tuning.
CH Channel tuning.
SP Span change.
MK Marker moving.
Searching.
July 2014
EC Echo/zoom change.
2-11
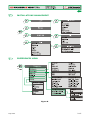
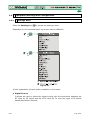
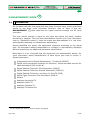
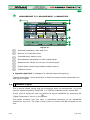
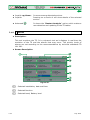
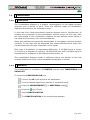
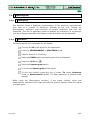
2.6
Menu Tree
SPECTRUM ANALYSER MENU
2-12
Only available for digital channels
Only available for analogue channels
Option available for terrestrial band
Option available for satellite band
July 2014
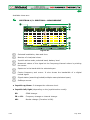
TV MENU
MEASUREMENT MENU
Only available for digital channels
Only available for analogue channels
Option available for terrestrial band
Option available for satellite band
July 2014
2-13
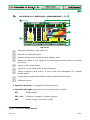
SETTINGS MENU
Option available for terrestrial band
2-14
Option available for satellite band
July 2014
INSTALLATIONS MANAGEMENT
PREFERENCES MENU
Figure 8.
July 2014
2-15
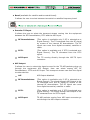
2.7
Controls
The equipment has been designed to be an easy tool to use. For this reason the
number of keys has been reduced and these are grouped by function.
The menu navigation includes hints that appear when the cursor is placed on a
disabled (greyed) option for a while. This hints help the user to understand why
an option is disabled and what to do to enable it.
The equipment can be fully operated using both the touch panel (even using
wearing gloves) and the conventional keyboard.
For measurement and navigation through the menus, the equipment has the
touch panel, a joystick, 4 programmable keys (softkeys) and 6 direct access keys
(shortcut keys).
Next the use of each one of them is described:
2.7.1
Touch Screen
The control software is designed in such a way that the meter can be fully
operated using both the touch panel and the conventional keyboard:
Menu Selection.
Frequency or channel selection.
Frequency or channel scroll.
Virtual keyboard writing.
Each touch on the screen is associated with a physical vibration. This vibration
can be enabled or disabled through the option “Vibration” in the “Preferences”
menu.
2-16
July 2014
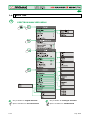
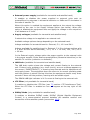
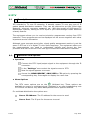
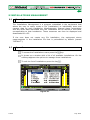
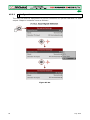
► Menu Selection
User can operate on the menus on screen: drop-down menu, select an option,
accept or exit a message, and so on, just touching on the option.
Figure 9.
Figure 10.
Figure 11.
July 2014
2-17
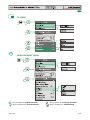
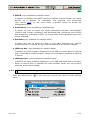
► Frequency or Channel Selection
At the Spectrum Analyser mode, user can select a channel or frequency by
tapping on the frequency or channel.
Figure 12. First screen (channel locked).
Figure 13. Tap on the new frequency.
Figure 14. The cursor moves to the frequency.
2-18
July 2014
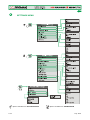
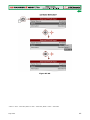
► Frequency or Channel Scroll
At the Spectrum Analyser mode, user can scroll through frequency or channels
by dragging and dropping his finger on the screen.
Figure 15.
Figure 16.
July 2014
2-19
► Virtual keyboard/keypad writing.
User can type directly on the on-screen keyboard or keypad.
Figure 17.
Figure 18.
2-20
July 2014
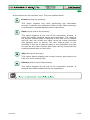
2.7.2
Joystick
Joystick positions are five:
Figure 19.
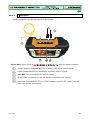
The joystick is multifunctional, that is, each time you press its function changes.
The user can see the active function according to the icon that is displayed at the
upper right corner of the equipment, as shown in the image.
In the SPECTRUM ANALYSER mode, the joystick has the following functions:
► CH or FR:
► SP:
► MK:
Channel
change
(CH)
or
frequency
(FR)
change
(according
to
the
tune
selected: tune by channel or
tune by frequency).
Span change.
Marker moving (if marker is
enabled).
Figure 20.
Using the ECHOES tool, the joystick is also multifunctional:
► CH or FR:
Channel (CH) change or frequency (FR) change (according to the
tune selected: tune by channel or tune by frequency).
► EC:
Echo change.
According to the selected function, the joystick will do a specific action.
July 2014
2-21
2.7.3
Keyboard shortcuts
► Export key
Pressing this key for one second it makes a capture of what it is shown on screen
at the time.
The capture may be from the screen image, from the measurement data or from
both.
The type of capture, either screen, data, or both can be set in the "Export
button" option which is on the label "Measures" in the "Preferences" menu.
More information in the chapter "Export key".
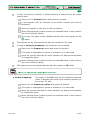
► Management Keys
There are two Management keys. Each one has two different functions according
to the pressing time:
Short press: It shows the list of installations and
the menus to manage them.
Long press: It shows the preferences menu.
Short press: It shows the menu of terrestrial or
satellite settings (according to the selected band).
Long press: It shows the Video & audio settings.
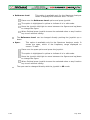
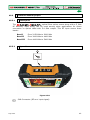
► Mode keys
On the left side there are 3 keys to access the equipment modes.
Measurement Mode key.
Spectrum Analyser Mode key.
TV Mode Key.
The active function on screen is indicated by the LED next to the mode key.
2-22
July 2014
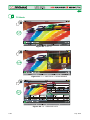
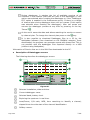
Pressing a key repeatedly provides access to a different view within the same
mode. Each view is shown at the top. When reaching the third view it returns to
the first view. For some signals (analogue, generic) not all the views are
available.
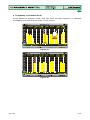
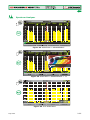
Following there is an example of the views available for each mode (examples
extracted from a digital terrestrial signal):
July 2014
2-23
Measurements
Figure 21. FULL MEASUREMENT
Figure 22. MEASUREMENT + TV + SPECTRUM
Figure 23. MEASUREMENT + PARAMETERS
2-24
July 2014
Spectrum Analyser
Figure 24. SPECTRUM + MEASUREMENT
Figure 25. SPECTRUM + MEASUREMENT + TV
Figure 26. FULL SPECTRUM
July 2014
2-25
TV Mode
Figure 27. FULL TV
Figure 28. TV + SPECTRUM + MEASUREMENT
Figure 29. TV + SERVICE DATA
2-26
July 2014
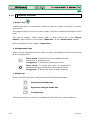
Softkeys
2.7.4
There are four programmable keys, also called softkeys, numbered from
to
.
Each key provides access to a menu. This menu varies depending on the function
the user is working on the meter.
The menu is displayed on each softkey at the bottom of the screen.
Figure 30.
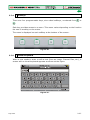
2.7.5
Virtual Keyboard
When a user needs to enter or edit a text (from an image, Channel Plan, etc.), a
screen with a virtual keyboard appears as shown at the figure.
Figure 31.
July 2014
2-27
To edit the file name user should follow these steps:
Place the cursor over the text box where the name appears.
Move the cursor to place it next to the letter that user wants to edit.
Press on the virtual keyboard to edit.
To delete a letter, move the cursor to the right side of the letter and then press
the joystick on the Delete key
or press
To enter an upper case letter press first
upper case press
lower case press
or press on the
(Del).
or press on the
key. To block
key twice consecutively. To return to
or the key again.
Keys with a point at the top right corner give access to special characters, by
keeping pressed for one second on the key.
After editing press
(Cancel) to cancel.
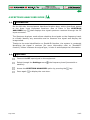
2.8
(Ok) to validate the name and continue the process or
StealthID Function: Signal Auto-identification
The StealthID function of the HD RANGER 2 ISDB-T/TB is a signal
identification function performed automatically by the equipment without any
user intervention.
The equipment tries to identify the channel or frequency of the input signal it
receives, and according to the band selected by the user, it applies identifying
criteria according to the standards of that band. When the equipment recognizes
in the input signal the identification parameters of a standard, it decodes the
signal and shows the data of that signal on the screen.
The identification system tries to lock the first signal using the modulation
defined in the channel plan for that signal. If after five seconds it fails to lock
with that modulation, it starts the wheel for automatic detection. If then it locks
in a modulation other than indicated, it generates an internal temporary channel
plan to accelerate tuning the same channel later on.
2-28
July 2014
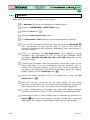
Then, the user only has to follow these steps in order to identify a signal:
Press the Preferences key
for 1 second.
In the StealthID tab, select the signal types to auto-identify (see "Menu
tree" figure 7). By default all them are selected. Press the
the changes made and the
Press the Settings
key to save
key to exit the Preferences screen.
key.
Select the band (terrestrial or satellite).
Select a channel or frequency to identify.
The bottom of the screen shows the message "Searching for signal" and
the standard transmission checking. Wait a few seconds for the equipment
to identify the signal. User can force the auto-identification of a signal by
pressing the
key and selecting the type of signal from the menu.
When the equipment identifies the signal a text shows the detected signal
type.
Press
July 2014
(Signal Parameters) to see the signal parameters.
2-29
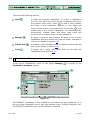
2.9
Equipment Settings and Configuration
2.9.1
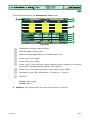
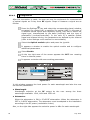
Settings Menu
Press the Settings key
to access the settings menu.
Depending on the selected band, the menu may be different.
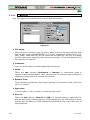
Figure 32.
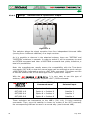
A brief explanation of each option available on the menu:
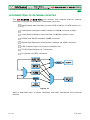
► Signal Source
It allows the user to select the signal coming into the equipment between the
RF input for RF signal and the IPTV input for TV over any type of IP packet
based distribution network.
2-30
July 2014
► Band (available for satellite and terrestrial band)
It allows the user to select between terrestrial or satellite frequency band.
► Decoder TS Input
It allows the user to select the transport stream coming into the equipment
between the RF Demodulators, IPTV and the ASI Input.
RF Demodulators:
(This option is available only if RF is selected as a
Signal Source). The TS extracted from the RF signal
by means of the internal RF demodulator. The RF
signal can come from digital terrestrial, satellite or
cable.
IPTV:
(This option is available only if IPTV is selected as a
Signal Source). The TS extracted from the IPTV
signal.
ASI Input:
The TS coming directly through the ASI-TS input
connector.
► ASI Output
It allows the user to select the signal source for the TS-ASI packets going out
through the equipment ASI Output. User can select among Off, RF
Demodulators, IPTV and ASI Input. This transport stream can feed the signal
to other devices.
July 2014
Off:
ASI Output disabled.
RF Demodulators:
(This option is available only if RF is selected as a
Signal Source). The signal through ASI Output is the
TS extracted from the RF signal by means of the
internal RF demodulator. The RF signal can come
from digital terrestrial, satellite or cable.
IPTV:
(This option is available only if IPTV is selected as a
Signal Source). The signal through ASI Output is the
TS extracted from the IPTV signal.
ASI Input:
TS-ASI packets coming from ASI input connector go
out through the ASI output connector.
2-31
► External power supply (available for terrestrial and satellite band)
It enables or disables the power supplied to external units such as
preamplifiers for antennas in terrestrial television or LNBs and FI simulators in
the case of satellite TV.
When this option is enabled the equipment applies at the output the voltage
selected by the user in the Supply Voltage option (see below). When this
option is disabled the equipment does not apply the voltage to the output but
it will behave as if it did.
► Supply voltages (available for terrestrial and satellite band)
It selects the voltage to be applied to an external unit.
Available voltage options change depending on the selected band.
Voltage available for terrestrial band is: External, 5 V, 12 V and 24 V.
Voltage available for satellite band is: External, 5 V (for devices working with
5 V such as GPS active antennas), 13 V, 13 V + 22 kHz, 15V, 18 V, 18 V
+ 22 kHz.
In the External supply voltage option the power supplier to the external units
is the power supplier of the antenna preamplifiers (terrestrial television) or the
satellite TV receiver (collective or domestic).
► LNB Drain (available for terrestrial and satellite band)
The LNB drain option shows the voltage and current flowing to the external
unit. If there is any problems (e.g. short circuit), an error message appears on
the screen ('SHORTCIRCUIT'), a warning beep sounds and the equipment will
not supply power. The equipment does not return to its normal operating state
until the problem is solved .During this time the equipment checks every three
seconds if there still the problem, warning with an audible signal.
The DRAIN LNB light indicator is lit if current is flowing to the external unit.
► LTE Filter (only available for terrestrial band)
It enables or disables the LTE filter (see 7.3 section: LTE Interference Test).
When the LTE filter is enabled an icon will appear at the top right of the
screen.
► DiSEqC Mode (only available for satellite band)
It enables or disables DiSEqC mode. DiSEqC (Digital Satellite Equipment
Control) is a communication protocol between the satellite receiver and
accessories of the satellite system (see section 10.4).
2-32
July 2014
► SatCR (only available for satellite band)
It enables or
devices of
(see section
configuration
disables the SatCR function (Satellite Channel Router) to control
a satellite TV installation that supports this technology
10.4). In this menu there is another option to access the
menu.
► Polarization (only available for satellite band)
It allows the user to select the signal polarization between Vertical/Right
(vertical and circular clockwise) and Horizontal/Left (horizontal and circular
anti-clockwise), or disable it (OFF). In tuning mode the Polarization option can
not be changed.
► Sat Band (only available for satellite band)
It allows the user to select the High or Low band frequency for satellite
channel tuning. In channel tuning mode the Band Sat can not be changed.
► LNB Low Osc. (only available for satellite band)
It defines the local oscillator frequency for the LNB low band. When a channel
plan is selected but LNB oscillator values are not properly selected, a warning
is issued.
► LNB High Osc. (only available for satellite band)
It defines the local oscillator frequency for the LNB high band (up to 25 GHz).
When a channel plan is selected but LNB oscillator values are not properly
selected, a warning is issued.
2.9.2
Video & Audio settings
Press the Settings key
menu.
for one second to access the Video & Audio settings
Figure 33.
July 2014
2-33
A brief explanation of each option available on the menu:
► Volume
It increases or decreases the volume of the speaker audio output by moving
the joystick to the right (+ volume) or left (- volume).
► Brightness
It increases or decreases the screen brightness by moving the joystick to the
right (+ brightness) or left (- brightness).
► Video Output
It enables or disables the video output through the audio/video connector (see
section 10.2 Connection of video/audio analogue output through the output
V/A connector).
► Colour System
The coding system used in analogue transmissions. Available options are: PAL
50 Hz, PAL 60 Hz, NTSC and SECAM.
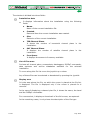
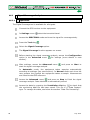
Preferences Menu
2.9.3
You access the Preferences menu by pressing the Installations Management
key
for one second. The options are grouped in tabs as follows:
► Equipment: Equipment information.
► Appearance: Equipment customization options.
► Date & Time: It allows the user to change date and time zone.
► Measures: It allows the user to choose between several units of measure
among other parameters.
► StealthID: It allows the user to select the set of signal types being used while
auto identifying any modulation type.
► Network: Network parameters to edit.
► Security: PIN code.
2-34
July 2014
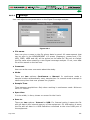
Figure 34.
To navigate between tabs move the joystick left or right. To navigate between
the options within the tab move the joystick up or down.
Press
Exit to exit Preferences.
Press
Save to save changes.
A brief explanation of the options available in each tab:
► Equipment information:
Provider:
Provider's name.
Name:
Equipment's name.
Serial number: Unique identification number for this equipment.
Release:
Version of the software installed on the equipment.
Date:
Date of the software installed on the equipment.
Free memory: Free size of the flash memory installed on the equipment
/ Size of the flash memory installed on the equipment.
July 2014
Company:
Name of the company which owns the equipment
(protected by pin code).
User:
Name of the equipment's user (protected by pin code).
2-35
► Appearance Options:
Language:
Language used on menus, messages and screens.
Available languages are: Spanish, Catalan, English,
German, French, Czech, Italian, Norwegian, Polish,
Russian and Slovak. Once the new language is selected,
the equipment shows a warning message and re-starts in
order to load the new language.
Skin:
Colours used on the screen.
Power Off:
It allows the user to select the time to power off, which is
the time after which the equipment shuts down
automatically unless user press any key.
Brightness:
User can select between two options:
Manual:
The display brightness is adjusted manually
using the brightness setting (see section
Video and audio settings).
Automatic: The display brightness is automatically
adjusted according to the light received by
the sensor.
Background:
It allows the user to select the background colour on the
display screen. Options available are: white, green, red,
black and blue.
Battery Time:
It hides or shows the remaining battery time. Remaining
battery time is displayed on the inside of the battery
level icon.
TFT Screen:
User can select a time after which the TFT screen turns
off, but the equipment is still running normally. The
screen turns on by pressing any key. Time options are:
off, 1, 5, 10 or 30 minutes.
Colour System: The coding system used in analogue transmissions.
Available options are: PAL 50 Hz, PAL 60 Hz, NTSC and
SECAM.
2-36
Boot Image:
User can select the image that appears when the
equipment is booting.
Vibration:
User can turn the vibration on or off. When the vibration
is ON the user feels a vibration when touching the
screen.
July 2014
► Time & Date Options:
Date:
It allows the user to edit the date. Press the joystick for
edit mode.
Time:
It allows the user to edit the time. Press the joystick for
edit mode.
Date Format:
It allows the user to change the date format, which is the
order in which is shown day (DD), month (MM) and year
(YYYY or YY).
Time Zone:
It allows the user to select the time zone where he is.
► Measures Options:
Terrestrial
Units:
Satellite
Units:
Optical Units:
It allows the user to select the terrestrial measurement
units for the signal level. Available options are: dBm
dBmV and dBµV.
It allows the user to select the satellite measurement
units for the signal level. Available options are: dBm,
dBmV and dBµV.
It allows the user to select the optical measurement units
for the signal level. Available options are: dBm.
Satellite Band: It allows the user to select the type of satellite band used
between Ku/Ka band and C band.
Reference
Level:
Datalogger
PSI:
July 2014
It allows the user to select the type of reference level
adjustment between manual (modified by the user) or
automatic (selected by the equipment).
If you select the option "Capture", when datalogger is
working it captures the service list of each channel. This
process slows the datalogger, but provides additional
information that can be downloaded in XML files. To
disable this option select "Don't capture".
2-37
Database
services:
When it is enabled, it saves all the services been
detected in the current installation. There is a database
for services in terrestrial band and another for services in
satellital band. Services are included automatically when
the signal is locked. If enabled, these services will be
displayed on the "View all services" option in the
menu. When disabling the option all services
Tuning
in the database of the installation will be deleted.
Min. TER.
Power:
Min. SAT.
Power:
Min. TER.
Level:
It sets the minimum power for a terrestrial digital signal
to be identified.
It sets the minimum power for a satellite digital signal to
be identified.
It sets the minimum level for a terrestrial analogue signal
to be identified.
Export button: It allows the user to select the data to be exported when
pressing the export key among the following options:
screen only, data only or both. More info in the "Export
key" chapter.
► StealthID Options:
It allows the user to select the set of signal types being used while auto
identifying any modulation type. More information in the "StealthID function"
chapter.
► Network Options:
Network parameters that user has to fill out in order to identify the equipment
into a data network. This is necessary to receive IPTV signal (refer to IPTV
chapter for more information). Network parameters are MAC, IP Address and
Mask.
► Security Options
It allows the user to change the Pin Code that gives access the protected data
fields. The pin code by default is "1234".
2-38
July 2014
3 MEASUREMENT MODE
3.1
Introduction
On the panel left side, the equipment has three functions keys, which give direct
access to the three most important functions. One of them is the key
MEASUREMENT
connector.
that measures the signal received through the RF input
The user should connect a signal to the input and select the band, whether
terrestrial or satellite. Then the auto-identification function (for more information
refer to "StealthID function") locks the signal and demodulates it in real time,
automatically detecting its characteristic parameters.
Having identified the signal, the equipment measures according to the signal
type. All information about transponders or multiplex is automatically displayed
without introducing any additional parameter identification.
Next there is a list of signals that the equipment can automatically detect. For
more information about characteristics of each signal type refer to Annex 1:
Signals description.
Integrated Services Digital Broadcasting - Terrestrial (ISDB-T)
Digital multi-programme systems for television, sound and data services for
cable distribution (J83 Annex B)
Digital Satellite Television First Generation (DVB-S)
Digital Satellite Television Second Generation (DVB-S2)
Digital Satellite Television, exclusive for DirecTV (DSS)
Digital Cable Television First Generation (DVB-C)
Generic
2
Analogue terrestrial TV
Analogue Cable TV
Analogue Satellite TV
Analogue Terrestrial FM
2
For this signal type refer to "Generic Signal" paragraph.
July 2014
3-39
3.2
Operation
Connect the RF input signal to the equipment.
Select through the “Settings” menu
satellite).
the frequency band (terrestrial or
Access the MEASUREMENT option by pressing the
Press again
3.3
key.
to display the next view.
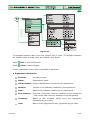
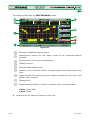
Screen Description
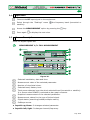
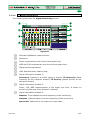
Views for digital signals are:
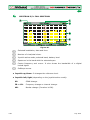
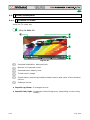
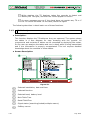
MEASUREMENT 1/3: FULL MEASUREMENT
Figure 35.
Selected installation, date and time.
Measurement value of the selected parameter.
Number of view/total views.
Selected band, battery level.
Total power detected over the whole selected band (terrestrial or satellite).
It is shown when POWER is selected as bar graph measure.
Graphical measurement of the selected parameter.
Measurement values for the type of locked signal.
Signal status (searching/locked/multiplex name).
Softkeys menus.
► Joystick up/down: It changes selected parameter.
► Joystick left/right: It changes channel/frequency.
3-40
July 2014
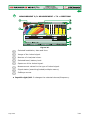
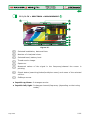
MEASUREMENT 2/3: MEASUREMENT + TV + SPECTRUM
Figure 36.
Selected installation, date and time.
Image of the locked signal.
Number of view/total views.
Selected band, battery level.
Spectrum of the locked signal.
Measurement values for the type of locked signal.
Signal status (searching/locked/multiplex name).
Softkeys menus.
► Joystick right/left: It changes the selected channel/frequency.
July 2014
3-41
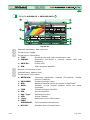
MEASUREMENT 3/3: MEASUREMENT + PARAMETERS
Figure 37.
Selected installation, date and time.
Number of view/total views.
Selected band, battery level.
Demodulation parameters of the locked signal.
Measurement values for the type of locked signal.
Signal status (searching/locked/multiplex name).
Softkeys menus.
► Joystick right/left: It changes the selected channel/frequency.
"Signals description" annex describes in detail the measurement parameters for
each type of signal.
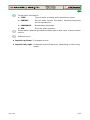
3.4
GENERIC Signal
This a special digital signal that the equipment does not demodulate. It can be
used for special signals as DAB/DAB + or COFDM modulation with narrow BW.
In this type of signal the user can select the signal bandwidth by accessing the
"Signal Parameters" menu on the
key.
The power measure and C/N ratio is calculated according to the bandwidth
selected by the user. The triple cursor shows on screen the BW selected by the
user.
3-42
July 2014
4 SPECTRUM ANALYSER MODE
4.1
Introduction
On the left side, the equipment has three function keys, which give direct access
to the three most important functions. One of them is the SPECTRUM
ANALYSER key
input connector.
that displays the signal spectrum received through the RF
The Spectrum Analyser mode allows checking the signals on the frequency band,
to visually identify any anomalies and to measure the signal and display the
image tuned.
Thanks to the auto-identification or StealthID function, the system is constantly
identifying the signal it receives (for more information refer to "StealthID"
function). When it detects the signal type, it locks it and displays the information.
4.2
Operation
Connect the RF input signal to the equipment.
Select through the Settings menu
satellite).
the frequency band (terrestrial or
Access the SPECTRUM ANALYSER option by pressing the
Press again
July 2014
key.
to display the next view.
4-43
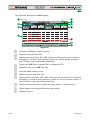
Available views are:
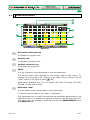
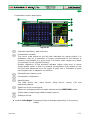
SPECTRUM 1/3: SPECTRUM + MEASUREMENT
Figure 38.
Selected installation, date and time.
Number of view/total views.
Joystick active mode, selected band, battery level.
Measured values of the signal at the frequency/channel where is pointing
the cursor.
Spectrum in the band with the selected span.
Centre frequency and cursor. It also shows the bandwidth of a digital
locked signal.
Signal status (searching/locked/multiplex name/selected span).
Softkeys menus.
► Joystick up/down: It changes the reference level.
► Joystick left/right (depending on the joystick active mode):
4-44
SP:
SPAN change.
FR or CH:
Frequency change or channel change.
MK:
Marker change (if marker is ON).
July 2014
SPECTRUM 2/3: SPECTRUM + MEASUREMENT + TV
∗
Figure 39.
Selected installation, date and time.
Number of view/total views.
Joystick active mode, selected band, battery level.
Measured values of the signal at the frequency/channel where is pointing
the cursor.
Image of the tuned signal.
Spectrum in the band with the selected span.
Centre frequency and cursor. It also shows the bandwidth of a digital
locked signal.
Signal status (searching/locked/multiplex name/selected span).
Softkeys menus.
► Joystick up/down: It changes the reference level.
► Joystick left/right (depending on the joystick active mode):
∗
SP:
SPAN change.
FR or CH:
Frequency change or channel change.
MK:
Marker change (if marker is ON).
Only available for digital channels.
July 2014
4-45
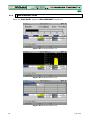
SPECTRUM 3/3: FULL SPECTRUM
Figure 40.
Selected installation, date and time.
Number of view/total views.
Joystick active mode, selected band, battery level.
Spectrum in the band with the selected span.
Centre frequency and cursor. It also shows the bandwidth of a digital
locked signal.
Softkeys menus.
► Joystick up/down: It changes the reference level.
► Joystick left/right (depending on the joystick active mode):
4-46
SP:
SPAN change.
FR or CH:
Frequency change or channel change.
MK:
Marker change (if marker is ON).
July 2014
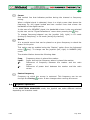
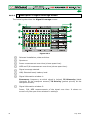
4.3
Screen description
Figure 41.
Horizontal reference line
It indicates the signal level.
Vertical axis
It indicates the signal level.
Vertical reference line
It indicates the frequency.
SPAN
It is the frequency range displayed on the horizontal axis.
The current span value appears at the bottom right of the screen. To
change use the joystick (left, right) in span mode (SP) or change it by the
"span" option in the Tuning menu (
key).
Span values available are: Full (full band), 500 MHz, 200 MHz, 100 MHz,
50 MHz, 20 MHz and 10 MHz.
Reference Level
It is the power range represented on the vertical axis.
To change use the joystick (up, down; 5 dB steps).
This equipment has an option to activate the automatic adjustment of the
reference level, so it detects the optimal reference level for each situation.
This option can be enabled or disabled through the PREFERENCES menu
and Measures tab.
July 2014
4-47
Cursor
Red vertical line that indicates position during the channel or frequency
tuning.
When a digital signal is detected, there is a triple cursor that shows the
frequency for the signal locked and two vertical lines that shows the
bandwidth of the digital carrier.
In the case of a GENERIC signal, the bandwidth shown is the one selected
by the user on the "Signal Parameters" menu when pressing the
key.
To change frequency/channel use the joystick (left, right) in FR mode
(tuning by frequency) or CH mode (tuning by channel).
Marker
It is a special cursor that can be placed on a given frequency to check the
power in this point.
This option can be enabled using the "Marker" option from the Advanced
menu (
mode.
key). To change use the joystick (left, right) in MARKER (MK)
The window Marker shows the following data:
Freq:
Level:
ΔF:
ΔL:
Frequency where is placed the marker.
Power level at the frequency where is placed the marker.
Difference of frequency between the marker and the main
cursor.
Difference of power level between the marker and the main
cursor.
Centre frequency
Frequency at which the screen is centered. This frequency can be set
through the Tuning
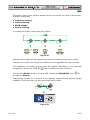
4.4
menu. It also changes when moving the cursor.
Joystick Operation
In the SPECTRUM ANALYSER mode, the joystick can make different actions
depending on its active mode.
4-48
July 2014
The active mode of the joystick appears as an icon at the top right of the screen.
Available modes are:
► Frequency tuning.
► Channel tuning.
► SPAN change.
► Marker moving.
To change the active mode press the joystick.
Figure 42.
Pressing left or right will take appropriate action according to the active mode.
Pressing up or down will change the reference level regardless the active mode.
The frequency or channel tuning mode will appear depending on the selected
tuning type. Access the TUNE BY
menu to select the type of tuning.
To show the Marker mode, it must be ON. Access the ADVANCED menu
activate the Marker.
to
Pressing the joystick for 1 second, a box appears explaining the joystick modes
available. From here user can also select the active mode.
Figure 43.
July 2014
4-49
4.5
Specific Options
function key. It allows selecting among several parameters to
Access by the
display the spectrum.
The advanced menu consists of the following options:
► Average:
► Spectrum
Line:
4-50
The user can select the amount of signal values to be used
to set the average signal value to be displayed on screen.
The larger the average value, the more stable the displayed
signal appears.
It defines the spectrum display. Outline option displays the
spectrum outline. The Solid option displays the contour of
the spectrum with solid background. The Transparence
option shows the outline in yellow and the background in a
softer yellow.
► Tone Level:
This option produces a tone that changes according to the
input level of the signal so the tone is sharper if the level
increases and deeper if the level decreases.
► Marker:
It allows enabling/disabling the marker. This marker is
displayed on screen with the shape of an arrowhead,
showing on screen some information about the frequency
and power level where it points. You can move left/right by
the joystick in MK mode (press the joystick until the icon
MK appears).
When the Marker is ON at the top right corner a window
pops up with the following data:
Freq:
Frequency where is placed the marker.
Level: Power level at the frequency where is placed the
marker.
ΔF:
Difference of frequency between the marker and
the main cursor.
ΔL:
Difference of power level between the marker and
the main cursor.
► Max. Hold:
(Off/Permanent/Curtain). It allows the user to display the
current signal with the maximum values measured for each
frequency. The OFF option disables this function. The
Curtain option displays the maximum values in blue for a
moment with the current signal. The Permanent option
maintains maximum signal on the screen. This option is
especially useful for detecting sporadic noises.
July 2014
► Min. Hold:
(Off/Permanent/Curtain). It allows the user to display the
current signal with the minimum values measured for each
frequency. The OFF option disables this function. The
Curtain option displays the minimum values in green for a
moment with the current signal. The Permanent option
maintains minimum signal on the screen. This option is
useful for detecting interferences in TV cable or identify
deterministic interference in analogue and digital channels.
► Persistence:
When active, the signal is displayed on a coloured
background. The signal prior to current signal persists for a
while before disappearing so the user can see how the signal
changes easily.
► Vertical Range: It allows to adjust the vertical scale on screen. Available
values are 1, 2, 5 and 10 dB per division.
► Dashed BW:
When it is ON the channel bandwidth area is hatched by
lines.
To edit or select any parameters of these described above, follow these
instructions:
Place over and press on the option.
The data field gets into the edit mode, indicated by the yellow
background.
A menu is displayed at the right with some options or if it is numeric, a
number gets a black blackground.
Move up/down to select one option. To move between figures press
right/left and to change it press up/down.
When finished press again or any function key to exit.
4.6
Locking a signal
Connect the cable with the input signal to the RF input connector.
Press the SPECTRUM key. The spectrum of the signal is displayed.
Adjust the span (recommended value for a terrestrial signal 50 MHz
and for a satellite signal 100 MHz). The current value of the span is at
the right bottom of the screen.
Find the frequency of the signal by moving the joystick left or right to
move sweeping the entire band.
If you know the channel change the tuning by frequency to tuning by
channel. The channel mode allows you to navigate from channel to
channel, using the selected channel plan.
July 2014
4-51
When the channel is locked information appears at the bottom left of
the screen. A triple cursor shows the detected BW for a digital carrier.
The equipment automatically detects transmission parameters of the
signal and makes the corresponding measurements.
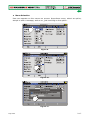
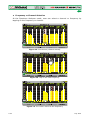
4.7
Satellite Identification
The spectrum analyser makes easier the fieldwork for engineers when working
with SNG mobile units and VSAT communications, since it allows adjusting
transmission-reception systems. It also has several functions to identify satellites
that avoid any possibility of error. When the signal is locked it identifies the
satellite and shows on screen its name.
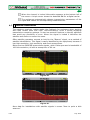
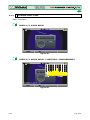
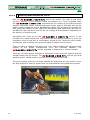
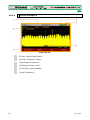
Often satellite operators request to look for the "Beacon" signal, as a method of
satellite identification. This signal is easily identified by the equipment, because it
has high resolution, high sensitivity and short sweep times.
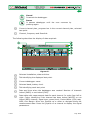
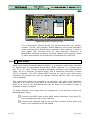
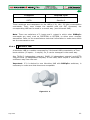
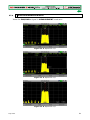
Below are two BEACON screenshots signals, with a little span and a bandwidth of
100 kHz resolution, all with a sweep time of 90 ms.
Figure 44.
Figure 45.
More data for installations with satellite signals in annex "How to point a dish
antenna."
4-52
July 2014
5 TV MODE
5.1
Introduction
On the left side of the front panel there are three functions keys, which give
direct access to the three most important functions. One is the TV MODE key
which displays the resulting image from decoding received RF signal.
TV MODE, thanks to the StealthID function of automatic identification,
automatically identifies and demodulates the signal received by the RF input, so
the user can check the signal on the screen. It shows information about the
channel and its services.
5.2
Operation
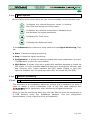
To access the TV MODE option, press the
key.
If it locks the signal, the screen shows the tuned signal demodulated.
For digital carriers, the first service of the terrestrial multiplex or
satellite transponder appears. In case the signal is scrambled the
image will not appear and it shows the icon for scrambled signal.
In the case of an analogue signal, tuned signal will appear.
To access the next view (if digital signal) of the TV MODE, press the
again. At the last view it will return back to the first.
July 2014
5-53
5.3
Screen Description
5.3.1
TV MODE: TV views
Views for TV mode are:
TV 1/3: FULL TV
Figure 46.
Selected installation; date and time.
Number of view/total views.
Selected band, battery level.
Tuned service image.
Signal status (searching/locked/multiplex name) and name of the selected
service.
Softkeys menus.
► Joystick up/down: It changes service.
► Joystick left/right: It changes channel/frequency (depending on the tuning
mode).
5-54
July 2014
TV 2/3: TV + SPECTRUM + MEASUREMENT
Figure 47.
Selected installation; date and time.
Number of view/total views.
Selected band, battery level.
Tuned service image.
Spectrum.
Measured values of the signal in the frequency/channel the cursor is
pointing.
Signal status (searching/locked/multiplex name) and name of the selected
service.
Softkeys menus.
► Joystick up/down: It changes service.
► Joystick left/right: It changes channel/frequency (depending on the tuning
mode).
July 2014
5-55
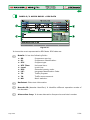
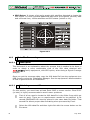
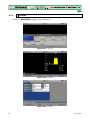
TV 3/3: SCREEN TV + SERVICE DATA
Figure 48.
Selected installation; date and time.
Tuned service image.
Tuned service information.
► TYPE:
► FORMAT:
► PROFILE:
► PID:
Encoding type and video transmission rate.
Resolution (horizontal x vertical), aspect ratio and
frequency.
Profile level.
Video program identifier.
Number of view/total views.
Selected band; battery level.
Tuned service information.
► NETWORK:
► PROVIDER:
► NID:
► ONID:
► TSID:
► SID:
► App. Type:
► VCH:
► +Info:
Television distribution network (Terrestrial). Orbital
position (Satellite).
Program provider name.
Network identifier where the signal is distributed.
Identifier of the original network where the signal
originates.
Transport stream identifier.
Service Identifier.
Interactive service.
Virtual Channel.
Additional service information.
► FREE/
SCRAMBLED:
► DTV/DS:
5-56
Free/scrambled transmission.
Standard type of transmission.
July 2014
Tuned audio information.
► TYPE:
Type of audio encoding and transmission speed
► FORMAT:
Service audio format. Bit depth; sampling frequency;
sound reproduction.
► LANGUAGE:
Broadcasting language.
► PID:
ID of the audio program.
Signal status (searching/locked/multiplex name) and name of the selected
service.
Softkeys menu.
► Joystick up/down: It changes service.
► Joystick left/right: It changes channel/frequency (depending on the tuning
mode).
July 2014
5-57
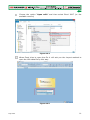
5.3.2
TV MODE: Radio views
Radio views are:
RADIO 1/3: AUDIO RADIO
Figure 49.
RADIO 2/3: AUDIO RADIO + SPECTRUM + MEASUREMENTS
Figure 50.
5-58
July 2014
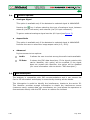
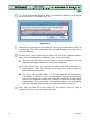
RADIO 3/3: AUDIO RADIO + RDS DATA
Figure 51.
It shows the most representative RDS data. RDS data are:
Details: It has the following fields:
► PS:
► PI:
► PTY:
► UTC Time:
► Local:
► ECC:
► LIC:
► TP:
► TA:
► MS:
Programme service.
Programme Identification.
Program type.
Universal time.
Local time.
Extended country code.
Language Identification Code.
Traffic program.
Traffic announcement.
Music switcher.
Radiotext: Extra text information.
Decoder ID (decoder identifier): It identifies different operation modes of
the decoder.
Alternative freqs: It shows alternative frequencies and total number.
July 2014
5-59
5.4
Specific Options
►
Analogue Signal
This option is available only if the detected or selected signal is ANALOGUE.
key it allows selecting the type of analogue input, between
Pressing the
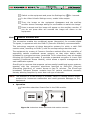
antenna (via RF connector) and external (via V/A input connector).
To get an external analogue signal use the A/V input (see figure 5).
►
Aspect Ratio
This option is available only if the detected or selected signal is ANALOGUE.
It allows the user to select the image aspect ratio (4:3; 16:9).
►
Advanced
It gives access to two options:
5.5
Audio:
It allows the user to select among the audio tracks available.
TS Data:
It shows the IRG data descriptor. If the signal contains this
carrier identifier, this option will be enabled. If the signal
does not contain this identifier, the option will be disabled
(for more information refer to section "IRG descriptor").
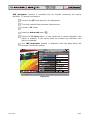
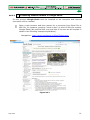
IRG Descriptor
The analyser is compatible with IRG recommendations and it can extract the
Carrier ID information and display it conveniently showing all the details.
This information is useful to identify the interference, thanks to the carrier ID.
This identifier provides enough information to detect the interference source
(customer name, contact data, geo coordinates, etc.) and allows the operators to
communicate directly with the RFI source to resolve the incident.
5-60
July 2014
IRG descriptor function is available only for signals containing the carrier
identifier. To access this feature:
Connect the RF input signal to the equipment.
Tune the channel that produces interferences.
Access to TV mode.
Press the Advanced menu
.
Select the TS Data option. If the signal has a carrier identifier, this
option is enabled. If the signal does not contain this identifier, this
option is disabled.
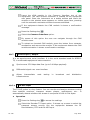
The IRG descriptor window is displayed with the data about the
provider (see figure below).
Figure 52.
July 2014
5-61
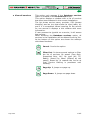
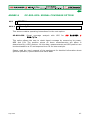
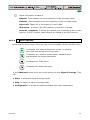
6 GENERAL MENU OPTIONS
At the bottom of the screen four menus are accessible via the softkeys or
programmable keys.
It displays the channel where is pointing the cursor
and gives access to the tuning menu.
It displays the selected transmission standard and
gives access to the signal parameters menu.
It displays the Tools menu.
It displays the Advanced menu.
In general, these options are the same for all modes (Measure, Spectrum
Analyser and TV).
The specific options for a mode are placed in the menu "Advanced" pressing the
key. For more details about these options go to section "Specific Options" in
the chapter.
Next each one of these menus is described.
6.1
F1: Tuning
Access by the function
key. It contains the options to tune a channel.
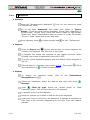
The tuning menu consists of the following options:
► Channel/Frequency: It displays the channel/frequency pointed by the
cursor. Tuning type (channel/frequency) is selected by
means of the "Tune by" option.
6-62
► Channel Plan:
This option allows the user to select a channel plan
from the ones available for the current installation.
► Tune by:
It allows the user to select between tuning by channel
(selecting a channel or channel by channel with the
joystick) and tuning by frequency (selecting a
frequency or step by step with the joystick).
July 2014
In case of tuning by channel, it allows selecting a channel from the active
channel plan:
Place over the Channel option and press the joystick.
A box appears with all channels of the active channel plan and its
frequency.
Move the joystick on the box to select a channel.
When finished press joystick to save the selected value or any function
key to exit without saving.
The cursor will place on the selected channel and it will appear on the
option.
The channel can be changed directly with the joystick in CH mode.
In case of tuning by frequency, the frequency can be edited:
Place over the Frequency option and press the joystick.
The option is highlighted in yellow to indicate it is in edit mode.
Move the joystick left/right to move between the figures and up/down
to change the figure.
When finished press joystick to save the selected value or any function
key to exit without saving.
The frequency can be changed directly with the joystick in FR mode.
► Centre Frequency:
This option is available only for the Spectrum Analyser
mode. It displays the value of the central frequency on
the screen. To edit:
Place over the Frequency option and press the joystick.
The option is highlighted in yellow to indicate it is in edit mode.
Move the joystick left/right to move between the figures and up/down
to change the figure.
When finished press joystick to save the selected value or any function
key to exit without saving.
July 2014
6-63
► Reference level:
This option is available only for the Spectrum Analyser
mode. It displays the reference level. To edit:
Place over the Reference Level option and press joystick.
The option is highlighted in yellow to indicate it is in edit mode.
Move the joystick left/right to move between the figures and up/down
to change the figure.
When finished press joystick to save the selected value or any function
key to exit without saving.
The Reference Level can be changed directly pushing the joystick up or
down.
► Span:
This option is available only for the Spectrum Analyser mode. It
shows the span, which is the frequency range displayed on
screen. To edit:
Place over the span option and press the joystick.
The option is highlighted in yellow to indicate it is in edit mode.
Move the joystick left/right to move between the figures and up/down
to change the figure.
When finished press joystick to save the selected value or any function
key to exit without saving.
The span can be changed directly with the joystick in SP mode.
6-64
July 2014
► View all services:
This option only appears if the Database services
option is enabled in the Preferences menu.
This option displays a window with a list of services
that have been detected in the current installation.
The list shows service name, provider, SID (stream
identifier) and an icon that shows its type (radio, tv)
and if it is scrambled. When hovering on the service
for one second it displays a hint window with more
information.
If user presses the joystick on a service, it will access
that service.
When disabling the Database services option, all
services in the installation will be deleted from the list.
At the bottom of this option are shown the softkeys
with these functions:
Cancel: It exits the option.
Filter List: It shows several options to filter
the list of services: By access (Free Only,
Scrambled Only, All); By type (All, TV,
Radio); Search by name (filtered by the
name); Reset list (it restarts the list as at
first) Service filtering is persistent until
reseting.
Page Up: It jumps one page up.
Page Down: It jumps one page down.
July 2014
6-65
6.2
F2: Signal Parameters
Access by the
function key. It allows selecting the standard transmission and
displays the parameters for signal transmission.
This menu allows selecting the transmission standard:
► Type of signal: It displays the selected standard. It allows selecting another
standard in the same band (terrestrial or satellite):
Place over the Signal Type option and press the joystick.
It displays a menu at the right with the transmission standards.
Move the joystick up / down to select a standard.
Press joystick to select the standard or any function key to exit
without selecting.
► View Advanced
Parameters:
It shows the TPS parameters (Transmission Parameters
Signalling) for the locked signal according to the modulation
standard. This option is available only when these
parameters are detected.
The remaining transmission parameters are detected demodulating the
locked signal.
In case of a DVB-S2 signal, there will be some special settings for this type
of signal. They are:
Physical Layer Scrambling or PLS is used in DVB-S2 as a way to improve
data integrity. A number called the "scrambling sequence index" is used by
the modulator as a master key to generate the uplink signal. This same
number must be known by the receiver so that demodulation is possible.
Most satellite transponders use PLS 0 as a default value but there are some
transponders that use other values.
If it is a multistream signal, it will appear an option that enables filtering by
the input stream identifier (ISI) and to select the stream to demodulate.
In case of a Generic signal, the menu shows an option to select the signal
bandwidth.
6-66
July 2014
6.3
F3: Tools
Access by the
key. It shows the Tools menu. Tools that are not available for
the current locked signal are disabled. Tools are:
► Select Service:
It displays the list of services available in the multiplex
tuned, with the service name, icons that identify the
service type, SID (stream identifier) and LCN (logic
channel number).
Icons that appear next to the service name identify the
features of the service. The meaning is given in the
following table:
Digital TV
service
High Definition
TV service
Digital radio
Data
Scrambled
service
► TS Analyser:
This tool allows the user to make a comprehensive
analysis of the Transport Stream (TS) contained in a
tuned signal.
► Signal monitoring: This
tool allows the user to monitor a signal by
measuring its power, MER and C/N. All this data, can be
downloaded to a PC and exported to a file for later
analysis.
► Explore channel
plan:
It explores the selected channel plan. Tune by channel
must be selected.
► Constellation:
It displays the constellation of the locked signal.
► LTE Ingress Test:
It enables the detection of signal interferences coming
from mobile phones.
► Echoes:
It detects the echoes that may appear due to the
simultaneous reception of the same signal from several
transmitters.
► Attenuation test:
It checks the response along the complete range of
frequencies by measuring the losses (attenuation) in the
distribution of TV signals, comparing reference levels
between the headend output and each antenna plug.
July 2014
6-67
► Datalogger:
It creates a file in which are stored measurements. This
file belongs to the selected current installation.
► Spectrogram:
This function shows a graphical representation of the
spectrum superimposed over time of a channel or
frequency selected by the user.
For more information about these features, see the "Tools" chapter.
6-68
July 2014
7 TOOLS
7.1
TS Analyser
7.1.1
Description
This tool allows the user to make a comprehensive analysis of the Transport
Stream (TS) contained in a tuned signal. The signal can be received through any
of the equipment inputs: TS -IN, RF, IP, CAM module and terrestrial and satellite
demodulators. This feature gives a great flexibility to process the signal in
multiple ways, so the equipment becomes a portable laboratory for the analysis
of digital signal.
This tool can be of great interest to research centres, broadcasting operators,
universities or training centres as well as to installers that want to expand their
technical knowledge or training in analysing the smallest unit of a digital signal
transmission.
This tool has three main functions:
► Tables:
It shows all the metadata carried in the corresponding
PSI/SI tables in a tree diagram so user can deploy its
content to the detail.
► Bitrates:
It shows the bitrate information for each program in real
time, in a graphical way and also shows the percentage
contribution of each one to the total TS.
► Alarms:
It shows a list of alarms that warn about any possible
failure in the TS layer according to the three priority
levels described in the TR 101 290 measurement
guidelines by the DVB group.
7.1.2
General Operation
The Transport Streams (TS) Analyser tool is available for all DIGITAL signals.
Connect the digital signal to any input of the equipment.
Select the channel or frequency and tune the signal.
Press the Tools key
.
Select the TS Analyser option.
A drop down menu appears with three options: Tables, Bitrates and
Alarms. Select your option.
July 2014
7-69
While starting, the TS Analyser takes few seconds to detect and
identify the TS signal, and then the results appear on screen.
An error message pops up if the signal does not contain any TS or if
the TS cannot be found. In this case, check the signal.
The following describes in detail each one of these functions.
7.1.3
Table Analyser
► Description:
This function displays the TS tables as they are captured. The system shows
the tables in a tree diagram for easy browsing with the joystick. All
components and contents of tables can be consulted by deploying the nodes.
So the user can analyse the tables and see in detail what is being transmitted
and if the information is properly encapsulated. This tool requires detailed
knowledge about the contents of these tables.
► Screen Description:
Figure 53.
Selected installation; date and time.
Selected function.
Selected band; battery level.
Main Table Tree.
Detail TableTree.
Signal status (searching/locked/multiplex name).
Softkey menus.
7-70
July 2014
► Joystick left/right:
It changes between Main menu tree and Detail menu
tree.
► Joystick up/down:
It moves along the tables in the tree.
► Joystick:
Pressing on a node with the symbol
Pressing on a node with the symbol
► Advanced
:
deploys the tree.
it closes the tree.
It shows the "Restart Analysis" option which makes a
new detection and updating of the TS tables.
► Tables Description:
Below is a brief explanation of the main tables that can appear in the
detection of a TS. For more details we recommend to consult the these
guidelines ETSI TR 101 211.
There are two generic groups of tables:
PSI (Program Specific Information) Tables: These tables are specified by
the MPEG-2 standard worldwide. They are used by all the digital
transmission standards. The TS analyzer detects all the PSI tables.
SI (Service Information) Tables: These tables are specified by the
standard used in the area or country (in this case DVB). These tables are
more detailed and imply a higher level of information relating to the PSI
tables. The TS analyzer detects the most important SI tables.
The PID (Packet Identification) code next to the name of the table is a
13-bit code that identifies each packet type and therefore to what kind of
table corresponds.
► PSI Tables:
PSI tables are:
PAT (Program Association Table): It is a master table that lists all
services found in the TS being transmitted. It also points the table where
are specified each one of the services.
PMT (Program Map Table): It is a table that identifies all the components
within a service (video, audio and/or data).
NIT (Network Information Table): Optional table with information about
TS and multiplex of a given network. The content in detail is described in
the tables used by the digital standard (DVB in this case).
July 2014
7-71
CAT (Conditional Access Table): Table that controls the scrambling of a
service.
► SI Tables:
Most important SI tables are:
NIT (Network Information Table): It is a master table used by the
broadcasting network to manage the services. It provides logic network
info by grouping several TS together and adding tuning information for all
network services. In the case of a satellite provides information about its
channels. It also contains the LCN descriptor that provides information to
order the services.
BAT (Bouquet Association Table): It is a table containing information
required to group a set of services or content, which is related for
commercial reasons (packs of a particular distribution platform, packs of a
particular film genre or sport, etc.).
SDT (Service Description Table): It is a table with a description of each
service, providing a service name and other related information such as
head-end and service details, if it is scrambled or not, if it is radio or tv,
the provider, etc.
EIT (Event Information Table): Table that provides information on events
(program or programs being broadcasted) in a given service. It is the
basis for building an EPG (Electronic Program Name), the program guide
shown on TV.
TDT (Time and Date Table): Table that provides UTC (Universal Time
Coordinated) coded as MJD (Modified Julian Date) that means, time and
date at the current moment and universal.
TOT (Time Offset Table): Table that provides the time offset related to
UTC in order to calculate the local time. It also provides information on
daylight saving time changes.
7.1.4
Bitrate Analyser
► Description:
This function shows the TS bitrate in a graphical way, and also by numbers
and percentage. A pie graph, which is updated in real time, shows the
evolution of the bitrate distribution for each one of the services in the tuned
multiplex. It also allows selecting any of the services to check its composition,
which is also shown in bar graph.
7-72
July 2014
This function allows the user to compare between television services and to
check the bitrate used by each one. User can observe dynamically the
variation that when changing the transmission content. Another use may be to
identify the amount of null packets and therefore to know the amount of
available payload by the multiplex.
► Screen Description:
Figure 54.
Selected installation; date and time.
Selected function.
Selected band; Battery level.
Pie Chart. The graph represents and shows the percentage of each service
on the total bitrate for the tuned channel. The colours of the graph
correspond to the services detected. They are shown on the right side of
the screen. Services with a very low percentage are grouped with the
legend "Others".
Detected services. It shows all the services identified in the tuned multiplex
and the percentage of each service relating to the total bitrate.
Detail of the Selected Service: Service name and percentage related to the
total bitrate (bitrate/total bitrate).
Bar graph representing the bitrate percentage for each component (video,
audio, data).
Video bitrate, audio and data.
Softkey menus.
July 2014
7-73
► Joystick up/down:
It moves among detected services.
► Joystick:
Pressing on a service it will show details of the selected
service.
► Advanced
7.1.5
:
It shows the "Restart Analysis" option which makes a
new detection and updating of the TS tables.
Alarms
► Description:
This tool monitors the TS. It is a dynamic tool as it displays in real time the
evolution of the TS and the alarms that may occur. The priority levels of
alarms are set according to the recommendations by technical standards TR
101 290.
► Screen Description
Figure 55.
Selected installation; date and time.
Selected function.
Selected band; Battery level.
7-74
July 2014
Priority 1: High level security parameters. These are alarms that make
the TS vulnerable and avoid them to be received. The parameters at this
level must be correct for the TS to be decoded. If any of these parameters
fails the information cannot be recovered and therefore the signal cannot
be decoded.
Priority 2: Medium level security parameters. These are alarms
recommended by DVB for continuous or periodic monitoring of TS and
ensure quality of transmission parameters. The alarm in any of these
parameters does not prevent the receiving but it is indicative of a possible
problem.
Priority 3: Low level security parameters. These are parameters that are
not harmful but are required for getting the most from the receiver
capabilities. They ensure that the receiver can extract in the best
conditions the TS information especially when there are additional features
such as the program guide or the services list.
Signal status (searching/locked/multiplex name).
Softkey menus.
► Joystick up/down: It moves among alarms and highlights one on blue
background.
► Advanced
:
It shows the "Restart Analysis" option which makes a
new detection and updating of the TS tables.
► Icons are:
OK.
Warning.
Error.
July 2014
7-75
7.2
7.2.1
Constellation
Description
The constellation diagram is a graphic representation of the digital symbols
received over a period of time. There are different types of constellation
diagrams according to the modulation type.
In the case of an ideal transmission channel without noise or interference, all
symbols are recognized by the demodulator without errors. In this case, they
are represented in the constellation diagram as well defined points hitting in
the same area forming a very concentrated dot.
Noise and interferences cause the demodulator to not always read the symbols
correctly. In this case hits are dispersed and create different forms which can
visually determine the type of problem in the signal.
Each type of modulation is represented differently. A 16-QAM signal is shown
on screen by a diagram of a total of 16 different zones and a 64-QAM signal is
represented by a diagram of 64 different zones and so on.
The constellation diagram shows in different colours the density of hits and
includes features to zoom, move and delete the display on screen.
7.2.2
Operation
The constellation is available to all DIGITAL signals, both TERRESTRIAL and
SATELLITE.
To access the CONSTELLATION tool:
Connect the RF input signal to the equipment.
Tune to a digital signal from satellite or terrestrial band.
Enter the MEASUREMENT
Press the
or SPECTRUM mode
.
key (Tools).
Select CONSTELLATION.
The CONSTELLATION of the tuned signal appears.
7-76
July 2014
Constellation screen description:
Figure 56.
Selected installation; date and time.
Constellation window.
The colour scale placed at the left side indicates the signal quality in a
qualitative way by a gradation of colours proportional to the density of
symbols concentrated in a given area. The colour scale ranges from black
(no symbols) to red (highest density).
Greater dispersion of the symbols indicates higher noise level or worse
signal quality signal. If there is symbols concentration with respect to the
full grid (see advanced menu for types of grid) this is indicative of good
ratio signal/noise or absence of problems.
Selected band, battery level.
Constellation modulation.
Data Window.
The data shown are: Start Carrier, Stop Carrier, Power, C/N and
frequency/channel.
Spectrum of the tuned signal.
Spectrum is displayed with the span selected at the SPECTRUM mode.
Signal status (searching/locked/multiplex name).
Softkeys menus.
► Joystick Left/Right: Frequency/Channel change (depending on the tuning
mode).
July 2014
7-77
7.2.3
Menu Options
On the bottom of the screen there are four menus accessible via the function
keys.
It displays the channel / frequency where is pointing
the cursor, accesses the tuning menu and allows
selecting the channel plan.
It displays the selected transmission standard menu
and accesses the signal parameters.
It displays the Tools menu.
It displays the Advanced menu.
In the Advanced menu there are some options to set the constellation tool.
They are:
► Grid type:
Full Grid:
grid.
The grid where the constellation is displayed is a complete
Cross Grid: The grid where the constellation is displayed is made of
crosses.
► Persistence:
It allows the user to set the level of persistence, which is the lapse of time the
signal stays on the screen before disappearing. Available options according to
the persistence level are: low, medium, high or permanent.
► Start Carrier/Stop Carrier:
This option allows selecting the range of carriers to be displayed between the
first and last.
7-78
July 2014
7.3
LTE Ingress test
7.3.1
Description
Long Term Evolution is a new standard for mobile networks. This mobile
communication standard uses a frequency band close to the bands used by
television. For this reason it can cause interferences.
The LTE Ingress Test identifies this type of interferences in a television
distribution system, so that they can be compared on the same screen
measurements with LTE filter and without LTE filter and thus if there is any
interference it can be detected and take appropriate action to fix it.
Operation
7.3.2
The LTE Ingress Test input is available to all DIGITAL TERRESTRIAL
signals.
To access the LTE Ingress Test tool:
Connect the RF input signal to the equipment.
Tune a digital signal of the terrestrial band.
Enter the MEASUREMENT mode
Press the
or SPECTRUM mode
.
key (Tools).
Select the LTE Ingress Test mode.
Enable/disable the LTE filter pressing the key
The Lte icon
enabled.
: Filter ON/OFF.
on the screen upper right corner means the filter is
This function displays measurements obtained with LTE filter or without LTE
filter. Measuring the signal with filter or without filter is not done
simultaneously, but alternately, by means of the
disables the filter.
July 2014
key that enables or
7-79
The following describes the LTE display:
Figure 57.
Selected installation; date and time.
Elapsed time with filter ON.
Measurement with filter ON: MER (minimum and maximum for channel)
and power (minimum and maximum power for all the signals present in
the LTE band; both upload and download).
Signal with LTE filter enabled (ON) or disabled (OFF).
Identifier icon of the LTE filter ON.
Selected band; battery level.
Measuring time with filter OFF.
Measurement with filter OFF: MER (minimum and maximum for channel)
and power (minimum and maximum power for all the signals present in
the LTE band; both upload and download).
Measurement units/centre frequency/span (span: 10 MHz/division).
Signal status (searching/locked/multiplex name).
Softkeys menus.
7-80
July 2014
7.3.3
Menu options
On the bottom of the screen there are four menus accessible via the function
keys.
It displays channel/frequency and access the tuning
menu. It allows selecting the channel plan and the
channel where apply the LTE ingress test.
It displays the selected transmission standard menu
and accesses the signal parameters.
It displays the Tools menu.
It enables (ON) / disables (OFF) the LTE filter.
7.4
Echoes
7.4.1
Description
The Echoes function shows the response in time of a digital terrestrial channel
and therefore it can detect echoes that can occur due to the simultaneous
reception of the same signal from several transmitters with different delays and
amplitudes.
Another cause that may cause echoes is reflection of the signal on large objects,
as buildings or mountains. This may be the explanation that having a good C/N
and a good signal, the BER does not reach the minimum value.
With the Echoes function is possible to know the distance from where the
equipment is to the transmitter or the object that caused the echo. Thus, the
installer can minimise the effect that the echo may cause on the installation,
reorienting the antenna and reducing the effect of received echoes.
This function is only available for ISDB-T, J83 Annex B and DVB-C2.
Therefore, previously have to configure the equipment for the reception of such
signals.
July 2014
7-81
7.4.2
Operation
Echoes function is available for ISDB-T, J83 Annex B and DVB-C2 signals.
Connect the RF input signal to the equipment.
Tune a ISDB-T, J83 Annex B or DVB-C2 digital signal at the
terrestrial band.
Enter the MEASUREMENT mode
Press the
or SPECTRUM mode
.
key (Tools).
Select ECHOES.
The ECHOES function of the tuned signal appears on screen.
7-82
July 2014
The following describes the ECHOES screen:
Figure 58.
Selected installation; date and time.
Selected band, battery level.
Main signal data: Frequency, Power and C/N.
ECHOES Diagram.
The display shows a graphical representation of the echoes. The
horizontal axis of the graph corresponds to the delay in receiving the
echo on the main path (the stronger signal).The vertical axis represents
the attenuation of the echo in dB on the main path.
Data box with main data regarding echoes.
In the list of echoes it shows the power, the delay in microseconds and
the distance in kilometres to the echoes.
Signal status (searching/locked/multiplex name).
Softkeys menus.
►
Joystick left/right (CHANNEL/FREQUENCY active mode): It changes the
channel/frequency (according to the tuning type selected).
►
Joystick up/down (ECHOES mode): It changes Zoom.
Remember to press the joystick to change the ECHOES mode to CHANNEL
mode.
July 2014
7-83
7.4.3
Menu Options
At the bottom of the screen there are four menus available via the function keys.
It displays the channel/frequency where is pointing
the cursor, it allows the user to select a channel or
frequency, a channel plan and access the tuning
menu.
It displays the selected transmission standard menu
and accesses the signal parameters.
It displays the Tools menu.
It displays the Advanced menu. The ZOOM option
changes the zoom on the echoes windows. Zooms
are 1x, 2x, 4x and 8x.
7-84
July 2014
7.5
Spectrogram
7.5.1
Description
This function shows a graphical representation of the spectrum superimposed
over time of a channel or frequency selected by the user. During the
Spectrogram, maximum and minimum of several measures and time are
registered. This tool is especially useful to analyse the behaviour of a spectrum
over time, because sporadic and indeterminate anomalies can be detected.
7.5.2
Operation
The Spectrogram tool is available for all signals.
Connect the RF input signal to the equipment.
Enter the MEASUREMENT or SPECTRUM mode.
Select a channel or frequency.
Select the SPAN within the spectrogram will be displayed.
Press the Tools key
.
Select the Spectrogram option.
It shows the Spectrogram of the signal.
To exit this function press any key of mode (TV mode, Spectrum
mode or Measurement mode). All data registered is cleaned after
leaving.
While using the Spectrogram function, if the signal unlocks, timer and
measurement registered will clean and they will start to register when the signal
is locked again.
July 2014
7-85
The following describes the SPECTROGRAM screen:
Figure 59.
Selected installation; date and time.
Measurement values for the signal tuned at the frequency/channel
selected.
Spectrum over time at the selected span.
Softkeys menus.
Selected band, battery level.
Maximum and minimum values of signal power and band power over
time.
Maximum and minimum value of the measure selected by the user in the
option "User measure".
Elapsed time.
Signal status (searching / locked / multiplex name / selected span).
X Axis: Span (MHz)
Y Axis: Power
►
7-86
Joystick does not have any function in this tool.
July 2014
Menu options
7.5.3
At the bottom of the screen there are four menus available via the function keys.
It displays the channel/frequency where is pointing
the cursor and access the tuning menu.
It displays the selected transmission standard menu
and accesses the signal parameters.
It displays the Tools menu.
It displays the Advanced menu.
In the Advanced menu there are some options for the spectrogram configuration.
They are:
► User measure:
It allows the user to select the measure to view on screen among the several
available for each type of signal.
► Details:
It allows the user to view on screen the date and time when maximum and
minimum measures were reached. To quit this view press the key
.
► Clear measures:
It cleans the spectrogram and measures and it restarts the timer.
7.6
Attenuation Test
7.6.1
Description
This feature allows the user to easily check the response of the
telecommunications installations before antennas and headers are working. It
allows the user to evaluate the response along the complete range of frequencies
by measuring the losses (attenuation) in the distribution of TV signals, comparing
reference levels at headend output and at each house antenna plugs.
July 2014
7-87
7.6.2
Operation
Attenuation test function is available for all signals.
In Settings
select the terrestrial or satellite band.
Access the MEASURES or SPECTRUM mode.
Press the Tools key
.
Select the Attenuation Test option.
The Attenuation Test function for the signal appears on screen.
First, set the parameters before the test, pressing the Advanced
key: Frequencies of pilot signals (pilot 0, pilot 1 and pilot 2),
maximum attenuation and threshold attenuation (see more details in
the next section ).
Then it is necessary to Set References. This requires a signal
generator. We recommend to use of one of the PROMAX signal
generators: RP-050, RP-080, RP-110 or RP-250 (depending on the
frequency band).
Connect the generator and the equipment where
signal distribution is in the installation (antenna,
connect the generator directly to the RF input of
necessary, the equipment can feed the generator
Output” option from the Settings menu
the origin of the
headend, etc.) or
the equipment. If
using the "Supply
.
Active the signal generator and in the equipment, press the Set
Reference key
.
Once are set the references for the pilot signals, let the signal
generator connected to the source point of the distribution system and
take measurements in each user access point with the equipment.
In each measurement a message over each pilot signal indicates
whether the measure "Pass" or "Fail" according to the parameters set.
Measurement data or screen image can be exported by pressing the
Export
key (see more details in section "Export key") and after
that display the images or download the data files (in XML format).
7-88
July 2014
The following describes the Attenuation Test screen:
Figure 60.
Installation selected, date and time.
Selected band; battery level.
Status message depending on the attenuation level.
Power level of the signal.
Signal Frequency (MHz).
Power level of the reference signal obtained when setting the reference
and used to calculate the attenuation level (dBµV).
Power level of the test signal at the user access point (dBµV).
Attenuation level (dB); Attenuation = Reference – Current.
Softkeys.
X-axis: Pilot signals
Y-axis: Power
►
July 2014
Joystick: The joystick does not have any function in this tool.
7-89
7.6.3
Menu Options
In the bottom of the screen are four menu accessible via the softkeys.
Exit: Exits the tool.
Set Reference: Pressing this option the current
power values are captured and they are assigned as
reference values.
Tools: It access the Tools main menu.
Advanced: It access the Advanced menu.
In the Advanced menu there are five parameters to set the attenuation test.
They are:
► Threshold Attenuation:
It defines the maximum difference that may exist between the pilot signal of
higher level and the pilot signal of lower level. All pilot signals out of this
range will be removed and not used as a pilot signal during the measurement
process.
► Maximum Attenuation:
It sets the attenuation level used by the equipment to show on screen if the
signal passes or fails. When the attenuation level is below this value the
message on screen is "PASS" and when it is above this value is "FAIL".
► Pilot 0:
It defines the frequency of the pilot signal 0 (MHz).
► Pilot 1:
It defines the frequency of the pilot signal 1 (MHz).
► Pilot 2:
It defines the frequency of the pilot signal 2 (MHz).
7-90
July 2014
7.7
Signal Monitoring
7.7.1
Description
This tool allows the user to monitor a locked signal over time, measuring its
power, MER and C/N. All this data can be downloaded to a PC and exported to a
file for later analysis.
7.7.2
Operation
The Signal Monitoring tool is available for all signals.
In Settings menu
select the terrestrial band.
Access the SPECTRUM mode and tune the signal for monitoring.
Press the Tools key
.
Select the Signal Monitoring option.
The Signal Monitoring function appears on screen.
Before starting the monitoring, access the Configuration option in the
Advanced menu
for settings (more details in next section).
After settings, access the Advanced menu
start the signal monitoring.
and press on Start to
In Automatic mode, the equipment takes samples automatically. In
Manual mode each time the user presses the joystick the equipment
takes a sample.
Access the Advanced menu
and press on Stop to finish the signal
monitoring. Data obtained is automatically stored.
Access the data by pressing the Installation List key
to check that
the monitoring data file has been saved. This file is a "Data Capture"
type. To manage the data, see below the section "Data File Processing".
July 2014
7-91
7.7.2.1
Settings
User can adjust some parameters on the Signal Monitoring:
Figure 61.
► File name:
User can give a name to the file where data is saved. All measurement that
can be seen in the MEASUREMENT 1/3 screen (frequency, power/level, C/N,
MER, CBER, LBER and LM) will be stored on the data file. Be sure to change
the file name when starting a new signal monitoring. If not, new data file will
be saved on the last one.
► Comment:
User can write some comments about the monitoring.
► Mode:
There are two options: Continuous or Manual. In continuous mode a
sample is taken automatically every sample time. In manual mode a sample is
taken every time that user presses the joystick.
► Sample Time:
Time between acquisitions. Only when working in continuous mode. Minimum
time is 1 second.
► Span time:
It is the width, in time, shown on screen for the X axis.
► Save to:
There are two options: Internal or USB. For Internal option it saves the file
with all data in the internal memory of the equipment. For USB option it saves
the file with all data in a USB flashdrive connected to the micro-USB port of
the equipment.
7-92
July 2014
7.7.2.2
Screen Description
The following describes the Signal Monitoring screen:
Figure 62.
Selected installation; date and time.
Spectrum.
Power measurement over time (shows span time).
MER and C/N measurement over time (shows span time).
Signal monitoring started.
LNB, Selected band; battery level.
Signal information window 1:
Frecuency: frequency at which signal is locked; TS Hierarchy (table
hierarchy at the transport stream) TS Priority (packet priority at the
transport stream).
Signal information window 2:
Power, C/N, MER measurements of the signal over time. It shows on
screen only the span time selected in settings.
Signal information window 3:
Elapsed: Time elapsed since the beginning of the monitoring.
Samples: Samples taken since the beginning of the monitoring.
Space left: Space left in the memory to save data.
July 2014
7-93
Menu Options
7.7.3
At the bottom of the screen there are four menus available via the function keys.
It displays the channel/frequency where is pointing
the cursor and access the tuning menu.
It displays the selected transmission standard menu
and accesses the signal parameters.
It displays the Tools menu.
It displays the Advanced menu.
In the Advanced menu there are some options for the Signal Monitoring. They
are:
► Start: It starts the signal monitoring.
► Stop: It stops the signal monitoring.
► Configuration: It shows the settings window with some parameters. (see the
"Configuration" section for more details).
► GPS Status: It shows a list and a graph with satellites detected to locate the
GPS signal. It is also provided additional data such as longitude, latitude, date
and universal time, visible satellites and GPS status (locked or not) (this
option is available only for equipment with GPS, see annex OP-001-GPS).
7.7.4
7.7.4.1
Data file processing
Description
This document is an explanation about the process that is needed to be done in
order to obtain a more comfortable view of the XML data obtained with
HD RANGER family equipment, when performing a Signal Monitoring.
Once you got the monitoring data, copy the XML data file from the equipment to
a USB memory using the Installation Manager. See the equipment’s
documentation in how to get files from an Installation.
7-94
July 2014
7.7.4.2
Obtaining an excel file
For this section, you must have at least Excel 2003 or newer version. Excel 2007
(or later) is highly recommended to avoid macro problems.
First of all we need to locate the XML data file in the folder from which we
want to work. There are no requirements needed to be satisfied. A file
named COVERAGE.XSL must be placed in the same data file folder. That
second file allows proper data formatting when processed by Excel.
Select the XML data file and then right click with the mouse button on the
file name.
Choose the option “Open with” and then select Excel 2007 (or the
available version)
Figure 63.
July 2014
7-95
When Excel tries to open the file it will ask you the import method to
open the XML data file by this way:
Figure 64.
You must choose the option in which a stylesheet is asked. It will appear
as an option the “COVERAGE.xsl” file.
Figure 65.
Now Excel is opening the XML data file using the format that the XSL file
is providing. This step could take few seconds depending on the size of
the XML data file.
7-96
July 2014
At this point, you should have an excel file with three different sheets.
Each sheet corresponds to a different view of the same data:
3
The first one will show you the generic signal information and the
different coverage measures for each point acquired.
3
In the second one, you will find the same data but presented in a
table format, more user friendly for working with graphs based on
each measured parameter.
3
The third one provides data in a format adapted for geolocation. This
is available only for users with GPS option (refer to annex
OP-001-GPS).
Now save the data as a true excel file. No specific name or path is
required, but you must remember the path.
7.8
Datalogger
7.8.1
Description
The Datalogger function stores automatically measurements in a file set by the
user (name, channel plan), and associated to a specific installation. User can
store for each datalogger measurements taken at different test points of the
selected installation. Measurements are made for all channels in the active
channel plan, both analogue and digital.
7.8.2
Operation
To create a new datalogger:
First select one installation of the list of installations
and load it
. An installation contains the channel plans
pressing the "Load" key
and DiSEqC commands selected by the user and it stores dataloggers
and screenshots made while it is selected (more information in chapter
"Installations management").
Check the installation is selected. The name of the installation should
appear on the upper left corner of the screen.
Enter the MEASUREMENT mode or the SPECTRUM mode.
Press the
July 2014
: Tools key.
7-97
Press on the "Datalogger" option.
It displays a menu with the "New ..." option and a list of all
dataloggers at the selected installation.
Select "New ..." to create a new datalogger or select the file name of
an existing datalogger if the user want to save data on a specific
datalogger already existing.
If "New ..." is selected, a installation wizard shows how to create a
new datalogger. Follow its instructions (
screen,
cancel).
: Next to move to the next
: Previous to move to the previous screen or
: Cancel to
During the creation of a new datalogger using the wizard, the user can
assign a name and select the channel plans. The channel plans are the
ones available for the current installation. At least one channel plan
has to be selected, either terrestrial or satellite. The wizard also gives
an option to select if during datalogger user wants to capture the list
of services (it slows down the process but gives more information) and
also if user wants a pause between channel plans (the process stops
until the user resume it). At the end user has the option to open the
new datalogger (by default, these last three options are enabled).
Once a new datalogger is created or selected an already existing one,
it shows the datalogger viewer screen and measurements of test
points can start.
If it is a new datalogger, in first place before starting the datalogger,
user must create a new test point (see next section).
To start the datalogger:
After creating a new datalogger file or selecting an existing one, the
user can start the datalogging process.
From the datalogger viewer screen, press the "Test point" key
and
from the menu select an existing test point using the "Go to ..." option
or "Create new ..." to create a new test point. If a new test point is
created, user has to give it a name.
Now datalogger is ready to start. Press the "Datalogger" key
select "Start".
7-98
and
July 2014
During datalogger, it catches the list of available services of all
channels in the channel plan that are part of the datalogger (if this
option was selected when creating the datalogger or if the "Datalogger
PSI" option is enabled in the Preferences menu). If there is a change
of channel plan during datalogger there will be a pause (if this option
was selected when creating the datalogger). User can pause and
resume the datalogger process at any time by pressing on the key
"Pause"
.
At the end it saves the data and allows watching the results on screen
by channel plan. To change the channel plan press on the
key.
It is also possible to download Datalogger files to a PC by the
NetUpdate software (free download on the PROMAX website). Once
downloaded, the program can generate reports with these files. This is
not possible with the datalogger files exported directly to a USB
(without using NetUpdate).
Information of Service lists are in the XML files downloaded to the PC.
►
Description of Datalogger screens
The following describes the datalogger screen:
Figure 66.
Selected installation; date and time.
Current datalogger name.
Selected band; battery level.
Exploring the spectrum in real time.
Level/Power, C/N ratio, MER, time remaining to identify a channel,
elapsed time since the start of the channel identification.
Softkey menus.
July 2014
7-99
Cancel
It cancels the datalogger.
Pause
It pauses datalogger until the user resumes by
pressing again.
Current channel plan, progress bar in the current channel plan, selected
test point.
Channel, frequency and Downlink.
The following describes the display of data acquired:
Figure 67.
Selected installation; date and time.
Tab identifying the displayed test point.
Current datalogger name.
Selected band; battery level.
Tab identifying each test point.
Date and time when the datalogger was created. Number of channels
locked (PASS) or not locked (FAIL)
Data table with measurement data for each channel. In order from left to
right: Colour identifying if the channel has been locked (WHITE) or not
locked (RED) channel; signal type; power/level; Carrier/Noise (C/N) rate;
MER; Link Margin. Move the joystick up or down to navigate along the
measurement data. Press the joystick on a channel to display the signal
parameters.
7-100
July 2014
Softkey menus.
Acquisition
It contains two options:
Start: It starts the datalogger in the selected test
point.
Clear: It deletes the data in the selected test
point.
Channel plan
It displays a menu with the available channel plans
to select the channel plan whose data want to be
displayed. Channel plans available are those that
have been selected during the creation of the
datalogger.
Test Point
It contains four options:
Jump to:
It allows selecting a test point.
Create New…: It creates a new test point.
Delete current: It deletes the current test point.
Delete all:
It deletes all test points of the
datalogger.
7.9
Export key
7.9.1
Description
It captures what is displaying at that moment.
The capture can be an image, measurement data or both. This is set through the
Preferences menu ("Export button" option).
Data capture is saved in a XML file with all data, measurements and text, that is
on screen at this time. The image is saved in a PNG file.
Data can be viewed later on through an external software.
July 2014
7-101
7.9.2
Operation
► Settings
Press the "Management Installation"
"Preferences" menu.
key for one second to enter
Go to the label "Measures" and select your option in "Export
button". There are three options available: Screen Only, Data Only or
Screen+Data. "Screen Only" saves the screen image in PNG format.
"Data Only" saves measurement data on screen in a XML file format.
"Screen + Data" saves both screen and data.
to save changes and
Once selected, press
to exit "Preferences".
► Capture
Press the Export key
for one second when on screen appears the
screen to be captured. The LED next to key lights.
A progress bar shows the progress of the capture process. When
finished, the screen is captured and the LED is OFF.
Then the virtual keyboard appears with the default name assigned to
the file.
Edit the name if necessary (see section 2.7.3). Then press
end the capture or
: OK to
: Cancel for cancellation.
► Display
To
display
the
Management key
captured
screen
click
on
the
Installations
.
Select the installation where the capture was done and press
Manage.
:
Press
: Filter by type. Select the “Screen Shots” or "Data
Captures" option. This will limit the list to the selected.
It appears a list of all the captures.
Move the joystick up or down to find the file to be displayed.
Leave the cursor on the file to be displayed. It appears a progress bar
that lasts a few seconds, depending on the size. Then the capture
appears.
7-102
July 2014
To see the capture in full screen just press the
: Options key and
then on the menu press "View in Full Screen". To exit the full screen
view press any softkeys.
To delete or copy the capture to a USB stick, select the captures by
pressing the joystick, and then select the appropriate option from the
menu
: File.
Captures can also be viewed on a PC, by downloading the installation
file using the NetUpdate software (see the NetUpdate manual for more
information).
7.10
7.10.1
Explore Channel Plan
Description
This option performs a scan of the selected channel plan. It detects where active
signals are in a channel plan and in which channels of the current channel plan
signal is received. With this information it explores these channels with signal,
looking for any broadcast and identifying them.
7.10.2
Operation
Explore Channel plan tool is available for all signals.
Connect the RF input signal to the equipment.
Access the MEASUREMENTS mode or SPECTRUM mode.
Press the Tools key
.
Select the Explore Channel Plan option.
The first screen of Explore Channel Plan appears.
Figure 68.
July 2014
7-103
After the exploration the following screen appears:
Figure 69.
The window is divided into three areas:
Spectrum and Measurement
It shows the cursor scrolling through each of the channels of the channel
plan. On the bottom of the screen the channel and frequency appears
next to the Power/Level and the C/N ratio.
Progress Bar
It shows the signal type detected and the scan progress in real time. At
the end a box shows a message informing the exploration process has
finished.
Channel plan
At the end of the process it shows the channels that have
during the channel plan exploration. In parentheses shows
detected channels to total channels of the channel plan.
the cursor through the channels, the spectrum and
windows are dynamically updated for the selected channel.
7-104
been detected
the number of
When moving
measurement
July 2014
At the bottom are the function keys. They are detailed below.
Cancel (during the process):
This option appears only while performing the exploration
process. It cancels the exploration before finish. When pressing,
a confirmation message appears before cancelling.
Save (at the end of the process):
This option appears at the end of the exploration process. It
saves the results obtained during the exploration. The name of
the original channel plan is assigned to the new one by default
and the user can modify the name using the virtual keyboard
that appears prior to saving. The new channel plan is now
available in the list of channel plans in the installation and can
be used as any other channel plan. After saving it becomes the
selected channel plan to work with.
Skip (during the process):
This option allows skipping the current channel and explore the
next one in the channel plan.
Discard (at the end of the process):
This option appears at the end of the exploration process. It
discards the results obtained from the exploration.
July 2014
7-105
8 IPTV
8.1
Description
IPTV stands for TV over IP networks. It actually means TV over any type of IP
packet based distribution network. They can be referred to as LAN (Local Area
Network), ethernet, computer networks, etc.. With the growth of LAN based TV
distribution systems, having an IPTV input in your field strength meter becomes
a handy feature.
The equipment allows you to receive television programmes coming from IPTV
networks. Those programmes can be displayed on the screen together with other
important service information.
Although some concepts are similar, signal quality assessment metrics is not the
same in IPTV as it is in digital TV over radio frequency. The equipment offers you
the measurements you need to understand, identify and correct the new
problems that can be found in this new type of television distribution networks.
8.2
Operation and Options
► Operation
Connect the IPTV input/output signal to the equipment through the IP
connector.
In the “Settings” menu select the signal source to IPTV.
Now the signal appears on screen.
Access the MEASUREMENT, ANALYSER or TV option by pressing the
corresponding key. Press again to display the next view.
► Menu Options
: Multicast key. These options are
The IPTV menu options are on the
available to receive a multicast signal. Multicast is an open broadcasting over
IP in which the device only takes data packets with a specific address.
For multicast distribution the options are:
Server IP Address: The IP address for the server to send.
Server Port: The IP port for the server to send.
8-106
July 2014
Protocol: Available protocols are RTP and UDP. RTP (Real-time
Transport Protocol) is a higher level of communication that adds a time
stamp so that packets can reach destination at specific times and order.
Packets are processed with different priorities. It is usually used to
transmit video in real-time. UDP (User Datagram Protocol) is uses a
simple transmission model with a minimum of protocol mechanism. UDP
is suitable for purposes where error checking and correction is either not
necessary or performed in the application.
Recent Servers: The last servers used to send the data.
Settings and Preferences
8.3
► Preferences
key for 1 second. Go to the Network
To access preferences press the
options tab to fill out the network options to identify the equipment into a data
network. This is necessary to receive IPTV signal. Network parameters are
MAC, IP Address and Mask.
► Settings
The IPTV settings when pressing the settings
key are:
Signal Source: It allows the user to select the signal coming into the
equipment between the RF input for RF signal and the IPTV input. In this
case select IPTV.
Decoder TS Input: It allows the user to select the transport stream
coming into the equipment. In this case select IPTV.
ASI Output: It allows the user to select the way out for TS-ASI packets.
User can select among Off, IPTV and ASI Input. This transport stream
received by the equipment can feed the signal to other devices as well. In
the case of IPTV option the TS-ASI packets go out through the IPTV
connector.
July 2014
8-107
9 INSTALLATIONS MANAGEMENT
9.1
Description
The Installations Management is a program embedded in the equipment that
allows the user to easily create a file (installation) to individually store and
manage data for each installation. Measurements, channel plans, screenshots
and any other data associated with the installation will be stored in the folder
corresponding to that installation. These measures can then be displayed and
downloaded to a PC.
If the user does not create any file installation, the equipment stores
measurements in the installation file that is preinstalled by default (named
"DEFAULT").
9.2
Operation
To access the Installations menu press the
key.
It shows up a window with a list of all available installations. On the
softkeys appears the options to manage these installations.
To exit the list of installations press the key
.
Figure 70.
9-108
July 2014
There are the following options:
Load
:
It loads the selected installation. To select a installation
from the list, place the cursor on the installation and press
to load it. Once loaded,
the joystick, then press “Load”
the name of the installation appears on the upper left
, that
corner of the screen, accompanied by the symbol
means that is the current installation. All measurements,
screenshots, channel plans and other data since this
moment will be stored in the current installation.
Manage
:
Create new
Tools
9.3
:
It opens a window that displays all data of the current
installation and from where they can be edited, changed or
view (more details in section 9.3).
:
It creates a new installation with the data introduced by the
user (more details in section 9.4).
It shows up a menu with some tools to use with the
installations (see section 9.5).
Installation Management
In the list of installations, press on the option Manage
Installation manager screen:
to access to the
Figure 71.
The DEFAULT installation is the installation preinstalled on the equipment. It is
like any other installation and it can load channel plans, DiSEqC programs, etc.
The DEFAULT installation can not be deleted or renamed.
July 2014
9-109
The window is divided into three fields:
Installation data
It displays information about the installation using the following
fields:
►
Name:
Name of the current installation file.
►
Created:
Date and time the current installation was created.
►
Size:
Data size of the current installation.
►
TER Channel Plans:
It shows the number of terrestrial channel plans in the
installation.
►
SAT Channel Plans:
It displays the number of satellite channel plans in the
installation.
►
Free Space:
It displays the amount of memory available.
List of files area
It shows all channel plans, screenshots, dataloggers, DiSEqC commands,
data captures and service databases available for the selected
installation.
To move along this file list move the joystick up or down.
Any of these files can be selected or deselected by pressing the joystick.
Display area
It is the area where the file, on which the cursor is placed at the file list,
is displayed. The file is displayed only if the cursor is placed for a
moment.
In the case of displaying a channel plan file, it shows the name, the band
and the DiSEqC commands.
For a screenshot, it displays a thumbnail of the full screen, as captured.
In the remaining cases, it only shows the description of the file type.
9-110
July 2014
The installation manager menu has four options linked with the softkeys. They
are described below:
Filter by type
► All:
On the list of files area it shows all type of files.
► Screenshots:
On the list of files area it shows all available screenshots.
► Channel Plans:
On the list of files area it shows all available channel plans.
► Datalogger:
On the list of files area it shows all available dataloggers.
► DiSEqC:
On the list of files area
commands.
it shows all available DiSEqC
► Data Captures
On the list of files area it shows all available data captures.
► Service Databases
On the list of files area it shows the service database
available.
File
► Mark All:
It marks all files on the list of files area.
► Unmark All:
It deselects all files on the list of files area.
► Delete:
It deletes all selected files on the list of files area.
► Copy to USB:
It saves selected files on the list of files area to an USB stick
connected to the equipment.
If the name of the file to be copied is greater than 8
characters the system cuts it. To keep the file names with
more than 8 characters it is recommended to export the
complete installation using the "Export to USB" option (see
"Tools" section).
The Datalogger files copied to the USB cannot be used to
generate reports by the NetUpdate program. To do this the
datalogger files must be exported directly through the
NetUpdate program (see the NetUpdate user's manual for
details).
July 2014
9-111
Installation
► Add TER Channel Plan:
It adds a terrestrial channel plan available in the equipment
to the current installation.
► Add SAT Channel Plan:
It adds a satellite channel plan available in the equipment to
the current installation.
► Add DiSEqC Program:
It adds a DiSEqC program available in the equipment to the
current installation.
Options
► See full screen:
This option only appears if user selects an image in the list of
files. It displays the selected image full screen.
► Diseqc program:
This option only appears if a satellite channel plan is selected
in the list of files area. It allows the user to add a Diseqc
program to the selected satellite channel plan from the list of
diseqc programs available for the current installation.
To get out from the Installation manager
MEASUREMENT, SPECTRUM or TV mode.
9.4
press
any
key
to
access
New installation
In the list of installations, when selecting the option Create New
installation wizard that helps to create a new installation:
it runs the
During the process, the user has the option to edit the default name
assigned or import data from another installation.
The user can select the channel plans (terrestrial and satellite) that
will be used in that installation. At least one for each band has to be
selected.
For satellite channel plans the user can select the Diseqc commands
associated to the installation and also the satellite band (Ku-Ka or C
band) and the frequencies of the LNB Oscillator.
9-112
July 2014
During the creation process the softkeys function are: Next (it goes to
the next step), Previous (it goes to the previous step) or Cancel (it
cancels the process).
When finish,
installation.
9.5
the
new
installation
created
will
be
the
current
Tools
In the list of installations, when pressing the Tools
with some options to edit the installation files:
option it shows a menu
►
Mark All:
It selects all installations in the list of installations.
►
Unmark All:
It deselects all installations in the list of installations.
►
Archive:
It compresses (using the ZIP algorithm) the selected installations to save
at the left side in the
more space. A zipped installation shows a box icon
list of installations. A zipped installation can be loaded as anyone else, but
the load time can be slightly higher because previously it is unzipped
automatically. Once the installation is unzipped the user must re-zip it if
necessary. To transfer an installation file from the equipment to a PC, it must
have been previously zipped.
►
Delete:
It deletes the selected installations and all the files associated to them. The
DEFAULT installation cannot be deleted.
►
Rename:
It edits the name of the installation selected in the list of installations. The
installation by default DEFAULT cannot be renamed.
►
Export to USB:
It saves the installations files selected in the list of installations to an USB
stick connected to the instrument. The installation file is exported in zip
format.
►
Import from USB:
It imports installation files from a USB stick connected to the equipment. It
has to use the same folder structure that is generated when exporting to
USB.
July 2014
9-113
10 CONNECTING TO EXTERNAL DEVICES
The HD RANGER 2 ISDB-T/TB can interact with external devices, sharing
information through its interfaces. Connection types are:
Input/output data interface via mini-USB connector to USB memory or
PC.
Video/Audio analogue output interface via V/A connector output.
Video/Audio analogue input interface via V/A connector input.
DiSEqC and SatCR interface via RF connector.
Digital High Resolution Video/Audio interface via HDMI connector.
CAM modules input via Common Interface slot.
TS-ASI Input/Output via F connector.
IP network via 8P8C connector.
Figure 72.
Next is described each of these interfaces and their interaction with external
devices.
10-114
July 2014
10.1
Mini-USB connector
The equipment has a female mini USB port that uses a USB media specific
protocol called "On-the-Go" (OTG abbreviated). This type of communication
allows the equipment to work in two different ways depending on the device
connected to the USB port: as a server (host) or device. More often, the
HD RANGER 2 ISDB-T/TB will work as a host when connecting a USB memory
and as device when connecting to a computer. This feature makes the equipment
in a much more versatile tool.
10.1.1
Connecting the HD RANGER 2 ISDB-T/TB (host) to an USB
memory (device)
This connection allows the user to copy files (screenshots, channel plans,
dataloggers, DiSEqC commands and others) and export/import installations from
the equipment to the USB and vice versa.
To copy some select data from the installation:
Connect the CC-045 cable (USB (A) Female - Mini USB (A) Male) to
the mini-USB socket (see figure 5) of the equipment.
Connect the USB stick to the female port of the cable.
USB icon should appear on the top right corner of the equipment. This
icon indicates that an USB stick has been detected at the port.
Press the Installations key
download some of its data.
Press the key
installation.
and select check the installation to
: Manage to access the data of the selected
Press
: Filter by type to select the type of list to view (list of all the
files, only screenshots, only channel plans, only dataloggers or only
DiSEqC commands).
Select the files from the list to be copied on the USB memory stick, by
pressing the joystick or by pressing
: File and selecting “Mark All”
(it selects all files on the list displayed).
Once files are selected press
: File and select the “Copy to USB”
option. This option is enabled only if it detects that there is an USB
connected to the equipment and if any file has been selected.
It shows a progress bar and a message informing that files are being
copied to the USB.
July 2014
10-115
When finish you can remove the cable with the USB stick memory
directly from the equipment and connect it to a computer to view the
files copied.
Default files are copied to the root directory of the USB memory.
Screenshots appear with PNG extension and data with XML extension.
To export one or more complete installations:
Connect the CC-045 cable (USB (A) Female - Mini USB (A) Male) to
the mini-USB socket (see figure 5) of the equipment.
Connect the USB stick to the female port of the cable.
USB icon should appear on the top right corner of the equipment. This
icon indicates that an USB stick has been detected at the port.
Press the Installations key and check the installations to export.
Press the key
: Tools and select Export to USB.
A progress bar and a message indicates that the files are being copied
to the USB. The files are copied to the root directory of the USB in ZIP
format.
When finished, the cable can be extracted directly with the USB stick
and connect it to a computer to display the copied files.
Unzip the installation file to access the data.
To import one installation:
Connect the CC-045 cable (USB (A) Female - Mini USB (A) Male) to
the mini-USB socket (see figure 5) of the equipment.
Connect the USB stick to the female port of the cable.
USB icon should appear on the top right corner of the equipment. This
icon indicates that an USB stick has been detected at the port.
Press the Installations key and check the installation to export.
Press de key
: Tools and select Import from USB.
A dropdown menu shows the installations identified in the USB
memory. An installation can be imported if it has the same folder
structure than when exporting. Select the installation to import from
those available.
The import process starts. If the name of the installation matches with
an existing one, it gives a warning before import.
10-116
July 2014
10.1.2
Connecting a computer (host) to the HD RANGER 2 ISDB-T/TB
(device)
This connection allows the communication between the equipment and a
computer via an USB cable or using the program NetUpdate of PROMAX.
NetUpdate program can be downloaded for free from the PROMAX website.
Connect the equipment to your computer using the cable CC-041 (mini USB male
– USB male) supplied with the equipment.
For more information about the NetUpdate program, see the user's manual,
which is available on the PROMAX website.
10.2
V/A Output Connector
The V/A output connector allows connecting a video/audio analogue output
signal. This connection allows you to switch between the image from the
equipment to an auxiliary monitor by following these steps:
Connect the jack 4V cable to the video/audio output connector
(see figure 5), ensuring that the plug is fully inserted.
1
Connect the opposite end (RCA connector) to the auxiliary monitor
where video and audio of the equipment will be played.
Switch on the equipment and press the Settings key
for 1 second.
In the Video & Audio Settings menu, enable Video output.
Then, the image on the equipment disappears and the auxiliary
monitor shows a message asking for confirmation to switch the image.
Press the joystick to accept and the image will appear on the auxiliary
monitor. If you do not press the joystick after ten seconds the image
will return to the equipment.
July 2014
10-117
10.3
V/A Input Connector
The V/A input connector allows connecting a video/audio analogue input signal.
This connection allows the user to view an image on the equipment screen
coming from an external source by following these steps:
Connect the supplied jack 4V cable to the video/audio input connector
(see Figure 5), ensuring that the plug is fully inserted.
Connect the
video/audio.
opposite
end
(RCA
connector)
to
the
source
of
Switch on the equipment and select the terrestrial and analogue
signal.
Select TV mode
and press
: Input.
From the menu, select “External”. A message shows that the external
input has been selected.
After a few seconds, the input image will be displayed on screen.
With the option
: Aspect, you can select the aspect ratio of the
image, between 4:3 and 16:9.
10.4
►
RF Connector
DiSEqC commands:
The RF connector allows controlling an antenna using DiSEqC commands. DiSEqC
(Digital Satellite Equipment Control) is a communication protocol between the
satellite receiver and the installation accessories of satellite (switches, LNBs,
etc.) proposed by Eutelsat, in order to standardize the diversity of switching
protocols (13 to 18 V, 22 kHz) and meet the needs of the installations for the
reception of digital TV.
Connect the RF cable (see Figure 6) to the RF connector for the input
signal of the equipment.
Press the Spectrum key
Press the Settings key
to access the spectrum analyser mode.
and select the satellite band.
From the Settings menu, select the polarization (horizontal/vertical)
and the satellite band (high/low).
If necessary, enable the Supply output and select the supply voltage
for the LNB.
10-118
July 2014
Select the option DiSEqC mode.
Two new functions appear on the softkeys: Command
Software
folders.
and
. DiSEqC programs appear classified in categories or
Select the command or program and press the joystick to send it to
the antenna. These commands or programs allow the user to control
an antenna (for more information about DiSEqC commands and
programs see Annex 3).
►
SatCR commands:
By means of function SatCR it is possible to control the devices of a TV satellite
installation that are compatible with the SatCR (Satellite Channel Router)
technology, which allows to concentrate downlink frequencies (slots) by an only
cable. By this way each user using a slot can tune and decode any signal present
in the satellite.
Connect the RF cable (see Figure 6) to the RF connector for the input
signal of the equipment.
Press the Spectrum key
Press the Settings key
to access the Spectrum analyser mode.
and select the satellite band.
Select the polarization (horizontal/vertical) and the satellite band
(high/low).
If necessary, enable the Supply output and select the supply voltage
for the LNB.
In the option SatCR, select ON to enable it. It appears the
the top right corner.
icon at
Also in the SatCR option, select Configuration to access SatCR
parameters.
July 2014
10-119
Figure 73. SatCR command screen.
The configuration window shows the options that user can modify:
number of slots, slot selected, device address, pilot signal activation
(when activating the SatCR device located in the headend, it emits a
pilot signal with constant level for each downlink frequency to
identificate available channels), selected satellite and frequency step.
In other box appears the frequencies corresponding to each slot.
10.5
HDMI Output
HDMI (High-Definition Multimedia Interface) is a compact audio/video interface
for transmitting uncompressed digital data. HDMI supports, on a single cable,
any TV or PC video format, including standard, enhanced, and high-definition
video; up to 8 channels of digital audio; and a Consumer Electronics Control
(CEC) connection. The CEC allows HDMI devices to control each other when
necessary and allows the user to operate multiple devices with one remote
control handset.
This connection allows the equipment to interface with other High Definition
equipment. It can also be very useful to check proper operation of the client’s TV
while on a service call. Everything that can be seen on the meter’s screen is
available through the HDMI.
To switch between the image from the equipment to an auxiliary monitor by
following these steps:
Connect the HDMI cable to the HDMI output connector (see figure 5),
ensuring that the plug is fully inserted.
Connect the opposite end to the auxiliary monitor where video and
audio of the equipment will be played.
10-120
July 2014
Switch on the equipment and press the Settings key
for 1 second.
In the Video & Audio Settings menu, enable Video output.
Then, the image on the equipment disappears and the auxiliary
monitor shows a message asking for confirmation to switch the image.
Press to accept and the image will appear on the auxiliary monitor. If
you do not press after ten seconds the image will return to the
equipment.
10.6
Common Interface Slot
This connection enables the conditional access (decryption) for encoded digital
TV signals, in agreement with the DVB-CI (Common Interface) recommendation.
This technology supports all those decryption systems for which a valid CAM
module exists, according to DVB-CI, with the corresponding subscriber card.
The equipment by means of Common Interface method offers the possibility of
supporting various conditional access systems, so that video and/or audio
broadcast by encrypted services (scrambled TV for subscribers) may be decoded
following the SimulCrypt model. It provides a standard connector to insert CAM
modules (Conditional Access Module), which allows a specific management for
each codification system.
SimulCrypt is a process that supports various parallel conditional access systems,
together with the encryption algorithms specified by DVB-CSA (Common
Scrambling Algorithm) to control access to pay-TV services. The SimulCrypt
broadcasts Transport Stream contains keys for various conditional accesses,
thereby allowing reception by more than one type of decoder.
NOTE: The insertion of a CAM module or a SMART-CARD in a wrong position might
produce the instrument malfunction and could generate damages to the
equipment.
►
Operation
Insert the subscriber Smart-Card in the CAM module.
Figure 74. Subscriber Smart-Card and CAM module insertion.
July 2014
10-121
Insert the CAM module in the Common Interface slot of the
equipment. The CAM module connector is located on the equipment
rear panel. Place the instrument on a stable surface and insert the
module so the printed arrow appears on visible upper face, pressing
until the extractor mechanism button becomes activated.
If the equipment detects the CAM module it shows a confirmation
message.
Press the Settings key
.
Select the Common Interface option.
By means of this option the user can navigate through the CAM
module menu.
To extract an inserted CAM module, press the button from extractor
mechanism and remove the module. If the equipment detects the CAM
module extraction it shows a confirmation message.
10.7
TS ASI Input / Output
It is an asynchronous serial interface. It is the serial standard used for MPEG-2
TS, in multimedia equipment interconnection:
Synchronous 270 Mbps data flow (up to 218 Mbps payload).
Differential signal over coax interface.
Allows intermediate
infrastructures.
10.7.1
node
testing
in
broadcast
and
distribution
TS-ASI Input
The TS-ASI option is a key feature. You can monitor and analyze streams coming
from satellite receivers, transport stream players, multiplexers, etc... It
automatically detects whether the stream is composed of 188 or 204 bytes.
►
Operation
Press the Settings key
to access the settings.
Select the Decoder TS Input option. It shows up a menu to select the
transport stream coming into the equipment between the RF
Demodulators, IPTV and the ASI Input.
10-122
July 2014
The RF Demodulators option (this option is available only if RF is
selected as a Signal Source) extracts the TS from the RF signal by
means of the internal RF demodulator. The RF signal can come from
digital terrestrial, satellite or cable.
The IPTV option (this option is available only if IPTV is selected as a
Signal Source) extracts the TS from the IPTV signal.
The ASI Input option gets the TS directly through the ASI-TS input
connector.
10.7.2
TS-ASI Output
It can transmit in packet mode or burst mode. User can use the transport stream
received by the equipment to feed the signal to other devices as well through the
TS-ASI output.
►
Operation
Press the Settings key
to access the settings.
Select the ASI Output option. It allows the user to select the signal
source for the TS-ASI packets going out through the ASI Output. User
can select among Off, IPTV, RF demodulators and ASI Input.
The Off disables the ASI Output. If the RF Demodulators option (this
option is available only if RF is selected as a Signal Source) is selected,
the signal through ASI Output is the TS extracted from the RF signal
by means of the internal RF demodulator. The RF signal can come
from digital terrestrial, satellite or cable. If the IPTV option is selected
(This option is available only if IPTV is selected as a Signal Source),
the signal through ASI Output is the TS extracted from the IPTV
signal. The ASI Input option enables the TS-ASI packets coming from
ASI input connector go out through the ASI output connector.
10.8
IP network
Refer to IPTV chapter.
July 2014
10-123
11 SPECIFICATIONS
11.1
►
General Specifications
Inputs and Outputs
Parameter
Value
Additional data
F female
130 dBμV
50 V rms
75 Ω
RF Input
Connector Input type
Maximum Signal
Maximum Input Voltage
30 V rms
140 dBμV
DC to 100 Hz; powered by the
AL-103 power charger
DC to 100 Hz; not powered by the
AL-103 power charger
Protected up to 30 seconds
Video/Audio Input/Output
Connector Input
Connector Output
Sensibility
Multipole Jack
Multipole Jack
1 Vpp
75 Ω
75 Ω
75 Ω; positive video
Multipole Jack
Built-in speaker
Multipole Jack
75 Ω; same V/A input multipole jack
Sound Input/Output
Connector Input
Outputs
75 Ω; same V/A output multipole
jack
DVB-ASI Input/Output
Connector Input
Connector Output
Bit Rate max
BNC female
BNC female
80 Mbit/s
75 Ω
75 Ω
Connector
RJ45
Also known as 8P8C. With Tx/Rx LED
indication
Type
Protocol
Transmission
Protection
Payload
Ethernet 10/100/1000 Mbps
UDP/RTP
Multicast, IGMP v2 standard SMPTE 2022-1
FEC standard SMPTE 2022-2
from 1 to 7 Transport stream MPEG-2 packets
IP Interface
USB Interface
Connector
Characteristics
11-124
mini-USB
OTG (On-the-go)
Mass storage host
Serial port emulation
USB CDC
Can read/write on flash drives
Communications Device Class
July 2014
Parameter
Value
Additional data
7" TFT
16:9
800 x 480 dots
700 cd/m2
Transmissive colour dot matrix type
Monitor Display
Monitor
Aspect ratio
Dot Format
Brightness
(R,G,B)(W) x (H)
External Unit Power (through the RF input connector)
Terrestrial Supply
Satellite Supply
22 kHz signal Voltage
22 kHz signal Frequency
Maximum Power
External, 5, 12 and 24 V
External
13 V
15 V
18 V
0.65 V ± 0.25 V
22 kHz ± 4 kHz
At least 6 W for 13, 15, 18, 24 V
DiSEqC Generator
According to DiSEqC 1.2 standard
►
Up to 500 mA
Up to 500 mA
Up to 500 mA
Up to 500 mA
Selectable in Satellite band
Selectable in Satellite band
If you select 5V, the maximum power
shall not excede 2.25 W (450 ma)
DiSEqC is a trademark of EUTELSAT
Mechanical Features
Parameter
Value
Additional data
Dimensions
Weight
Size
290x185x95 mm
2.2 kg
5.096 cm3
WxHxD
without options
Parameter
Value
Additional data
Internal battery
Battery Operation Time
Recharging time
External Voltage
7.2 V; 13 Ah
> 5 hours in continuous mode
3 hours up to 80%
12 V DC
Li-Ion Intelligent battery
No EXTERNAL supply active
Instrument off
Using
only
PROMAX
accesories
Consumption
Auto Power Off
50 W
Programmable
►
►
Power Supply
supplied
After the selected amount of minutes
without operating on any control.
Deactivable
Operating Environmental Conditions
Parameter
Value
Altitude
Temperature range
Up to 2000 m
From 5 °C to 45 °C
Max. Relative humidity
80%
July 2014
Additional data
Automatic disconnection by excess of
temperature
up to 31°C; decreasing lineally up to
50 % at 40 °C.
11-125
►
Included Accesories
Parameter
Value
1x CC-046
1x CC-041
Jack 4V/RCA cable
Connection USB Cable On-the-go (A) Male –
Mini USB (B) Male
USB Cable (A) Female – Mini USB (A) Male
Car lighter charger
External DC charger
"F"/H-BNC/H adapter
"F"/H-"DIN"/H adapter
"F"/H-"F"/H adapter
Mains cord
Rechargeable Li+ battery 7,2 V 13 Ah
Transport belt
Carrying bag
Transport suitcase
Quick Reference Guide
1x
1x
1x
1x
1x
1x
1x
1x
1x
1x
1x
1x
CC-045
AA-103
AL-103
AD-055
AD-056
AD-057
CA-005
CB-084
DC-300
DC-302
DC-230
DG0166
Additional data
RECOMMENDATIONS ABOUT THE PACKING
It is recommended to keep all the packing material in order to return the equipment, if necessary, to the
Technical Service.
11-126
July 2014
11.2
►
Measurement Mode
ISDB-T
Parameter
Value
Modulation
Margin of power
measurement
Measures
COFDM
From 35 dBμV to 115 dBμV
Displayed data
Mode
Guard Interval
Code Rate
Constellation
Bandwidth
Spectral inversion
Layer
Segments
►
Power, CBER, VBER, MER, C/N and Link
margin
Numeric and level bar
1 (2k), 2 (4k), 3 (8k)
1/4, 1/8, 1/16, 1/32
1/2, 2/3, 3/4, 5/6, 7/8
DQPSK, QPSK, 16-QAM, 64-QAM
6, 7 and 8 MHz.
ON, OFF
A, B, C
1…13
Additional data
Auto
J83 Annex B
Parameter
Value
Modulation
Margin of power
measurement
Measures
Displayed data
Bandwidth
Spectral Inversion
Demodulation
Symbol rate
Roll-off (α)factor of Nyquist
filter
Spectral Inversion
COFDM
From 35 dBμV to 115 dBμV
Additional data
Power, BER, MER, C/N and Link Margin.
Numeric and level bar
5, 6, 7 and 8 MHz.
ON, OFF
64/256 QAM
5057/5361 kbauds
0.18/0.12
Auto
ON, OFF
Auto
Parameter
Value
Additional data
Modulation
Margin of power
measurement
QAM
From 45 dBμV to 115 dBμV
Measures
Displayed data
Demodulation
Symbol rate
Roll-off (α) factor of
Nyquist filter
Spectral inversion
Power, BER, MER, C/N and Link margin
Numeric and level bar
16/32/64/128/256 QAM
1800 to 7200 kbauds
0.15
►
DVB-C
July 2014
ON, OFF
256QAM:42dBμV
128QAM: 39dBμV
64QAM: 36dBμV
32QAM: 33dBμV
16QAM: 30dBμV
Auto
11-127
►
Analogue TV
Parameter
Value
Colour System
Standard supported
Sensibility
PAL, SECAM and NTSC
M, N, B, G, I, D, K and L
40 dBμV for a correct synchronism
►
FM
Parameter
Value
Tuning range
Tuning step size
Sensitivity
Selectivity (mono)
45 to 1000 MHz
10 kHz
5 dBμV
± 200 kHz 25 dB
►
Additional data
Additional data
150 MHz (S+N/N = 40 dB)
DVB-S
Parameter
Value
Modulation
Margin of power
measurement
QPSK
From 35 dBμV to 115 dBμV
Measures
Displayed data
Symbol rate
Roll-off (α) factor of
Nyquist filter
Spectral inversion
Power, CBER, MER, C/N and Link Margin
Numeric and level bar
2 to 45 Mbauds
0.35
Additional data
18 dBµ[email protected] GHz / 2 MSs;
30 dBµ[email protected] GHz / 27 MSs;
33 dBµ[email protected] GHz / 45 MSs
ON, OFF
Auto
Parameter
Value
Additional data
Modulation
Margin of power
measurement
QPSK, 8PSK, 16APSK, 32APSK
From 35 dBμV to 115 dBμV
Measures
Power, CBER, LBER, MER, C/N, BCH ESR,
Wrong Packets and Link Margin
Numeric and level bar
2 to 45 MSps
ON, OFF
Presence Indication
►
DVB-S2
Displayed data
Symbol rate
Spectral inversion
Pilots
►
8PSK:
24 [email protected] GHz / 2 MSs;
34 [email protected] GHz / 27 MSs
QPSK, 8PSK, 16APSK, 32APSK
Auto
DSS
Parameter
Value
Modulation
Margin of power
measurement
Measures
QPSK
From 35 dBμV to 115 dBμV
Displayed data
Symbol rate
Roll-off (α) factor of
Nyquist filter
Code Rate
Spectral Inversion
11-128
Additional data
Power, CBER, VBER, MER, C/N and Noise
Margin
Numeric and level bar
20 Mbauds or variable
Auto detected
0.20
1/2, 2/3, 6/7 and AUTO
ON, OFF
Auto
July 2014
11.3
►
Spectrum Analyser Mode
Digital Signal
Parameter
Value
Additional data
General Parameters
Resolution filter
Markers
100 kHz
1
Reference Level
Spectrum range
60 dBμV to 135 dBμV
It
displays
frequency,
level
indication, level difference, frequency
difference
Adjustable in steps of 5 dB
Span, dynamic range and reference
level are variable by means of arrow
cursors
Terrestrial
Tuning range
5 to 1000 MHz
Tuning mode
Resolution
Measurement range
Measurement bandwidth
Span
Channel or frequency
10 kHz
10 dBμV to 130 dBμV
100 kHz
Full span-500-200-100-50-20-10 MHz
Digital channels measures
Channel power, C/N
Continuous
tuning
from
1000 MHz
Channel plan configurable
5
to
3.16 μV to 3.16 V
Full span (full band); selectable by
joystick
Satellite
Tuning range
Tuning mode
Resolution
Measurement range
Measurement bandwidth
Span
950 to 2150 MHz
Intermediate frequency or downlink
10 kHz
10 dBμV to 130 dBμV
100 kHz
Full span-500-200-100-50-20-10 MHz
Digital channels measures
Channel power, C/N
July 2014
Channel plan configurable
3.16 μV to 3.16 V
Full span (full band); selectable by
joystick
According to modulation type
11-129
►
Analogue Signal
Parameter
Value
Additional data
General Parameters
Attenuation scale
Numerical indication
Graphical indication
Audible indicator
Auto-range
Absolute value according to selected units
Analogue bar on screen
Pitch sound
Tone with pitch proportional to signal
strength
Terrestrial
Tuning range
Tuning mode
Resolution
Measurement range
Measurement bandwidth
Analogue channels
measures
Accuracy
5 to 1000 MHz
Manual
10 kHz
15 dBμV to 130 dBμV
100 kHz
Level, C/N, V/A
Out of range indication
<, >
±1.5 dB
3.16 μV to 3.16 V
25-120 dBμV; 45-1000 MHz;
22 °C ± 5 °C
Satellite
Tuning range
Tuning mode
Resolution
Measurement range
Measurement bandwidth
Analogue channels
measures
Accuracy
950 to 2150 MHz
Intermediate frequency or downlink
10 kHz
20 dBμV to 130 dBμV
100 kHz
Level, C/N
Out of range indication
<, >
11-130
±1.5 dB
Channel plan configurable
31.6 μV to 3.16 V
35-100 dBμV; 950-2050 MHz; 22 °C
± 5 °C
July 2014
11.4
►
TV Mode
Video
Parameter
Value
Codecs
MPEG-1
MPEG-2
MPEG-4 AVC H.264
Maximum Image Size
Minimum Image Size
Bitrate
Aspect Ratio
SI/PSI data
HD Video Resolution
Conditional Access Type
HDMI output resolution
►
1920x1080x60i; 1280x720x60p/50p
352x240x30p; 352x288x25p
40 Mbps
16/9; 4/3
Service list and main PIDs
1080, 720 and 576
Common Interface
1920x1080
Additional data
MP@HL (Main profile high level)
High Profile Level 4.1; maximum
bitrate 40 Mbps
Progressive or interlaced
By means the CAM module
Audio
Parameter
Value
Codecs
MPEG-1
MPEG-2
HE-AAC
Dolby Digital and Dolby Digital +
According to the TV standard
50 μs
75 μs (NTSC)
Digital frequency synthesis according to the
TV standard
Demodulation
De-emphasis
Sound subcarrier
►
Additional data
Transport Stream
Parameter
Value
Communication protocol
Packets
Transmission
Methode
Payload
Video Info
UDP or RTP/UDP
188 or 204 bytes
Packet or burst mode
MULTICAST / IGMP version 2
From 1 to 7 packets MPEG-2
Type, bitrate, format, aspect ratio, frequency,
profile, PID
Network, provider, NID, ONID,
scrambled/free, TSID, SID, LCN
Type, bitrate, format, frequency,
mono/stereo, language, PID
Service Info
Audio Info
July 2014
Additional data
Automatic detection
11-131
11.5
►
Tools
Constellation
Parameter
Value
Type of Signal
ISDB-T, J83 Annex B, DVB-C, DSS, DVB-S Type of Signal
and DVB-S2
I-Q graph
Displayed data
Displayed data
►
Echoes
Parameter
Value
Type of Signal
Measurement range
ISDB-T, J83 Annex B
Depends on the standard, carrier and guard
interval
0.1 μs to 224 μs
0.3 km to 67.2 km
0 dBc to –30 dBc
1/3 symbol period
Delay
Distance
Power range
Time scale
►
Value
Type of signal
Displayed data
ISDB-T, J83 Annex B, DVB-C
LTE band plus quality parameters for a
selected TV channel
Additional data
Attenuation Test
Parameter
Value
Test frequencies
3 selectable pilots
►
Additional data
LTE Ingress Test
Parameter
►
Additional data
Additional data
Datalogger
Parameter
Value
Stored data
Signal type, modulation parameters, all
measures available for the detected signal
type, and time stamp
Date and time at each measured channel
Timestamp
11-132
Additional data
July 2014
11.6
►
IPTV
Streams Multicast
Parameter
Value
IP
Ports
Maximum bitrate
224.0.0.0 to 239.255.255.255
1024 to 65535
80 Mbit/s
July 2014
Additional data
11-133
11.7
►
Transport Stream Analyser
Tables
Parameter
Value
Additional data
PSI Tables
PAT
PMT
NIT
CAT
NIT
BAT
SDT
EIT
TDT
TOT
Program Association Table
Program Map Table
Network Information Table
Conditional Access Table
Network Information Table
Bouquet Association Table
Service Description Table
Event Information Table
Time and Date Table
Time and Date Table
Parameter
Value
Additional data
Maximum bitrate
80 Mbit/s
SI Tables
►
►
Bitrate
Alarm
Parameter
According to ETSI std
TR101 290 V1.2.1
11-134
Value
Additional data
Sections 3.3, 3.9 and
measurements done)
3.10
(no
July 2014
11.8
►
Options
Fibre Optics
Parameter
Value
Additional data
Selective Optical Power Meter
Optical Measure bands
Connector
Measurement Dinamic
Range
Isolation between bands
1310 nm ± 50 nm; 1490 nm ± 10 nm; 1550
nm ± 15 nm
FC/APC
- 49,9 dBm to +10 dBm
Accuracy ± 0,5 dB
> 45 dB
Optical to RF Converter
Dynamic range of
conversion
Atenuación RF
RF band converted (Optical
Cable and DTT links)
RF band converted (Optical
IF-Satellite Installations)
RF output
From -5 dBm to +10 dBm
ON = 15 dB; OFF = 0 dB
From 65 MHz to 1000 MHz
From 950 MHz to 5450 MHz
for universal optical LNB
From 65 MHz to 2150 MHz
5 GHz RF Auxiliary input
Connector
Frequency bands
Dynamic Range
Conversion Gain
Flatness
Spurious
Intermodulation products
Maximum input signal
►
SMA
Band1 = De 2150 MHz a 3000 MHz
Band2 = De 3400 MHz a 4400 MHz
Band3 = De 4400 MHz a 5400 MHz
45 -105 dBμV
60 - 120 dBμV
7 dB
-8 dB
± 5 dB
< 45 dBμV
<15 dB typical
RF: 120 dBμV; DC: 50 V
ATT OFF
ATT ON
(-65 dBm) typical
DAB/DAB+
Parameter
Value
Combined antenna input
DAB sensitivity
Decodes audio services
for Band III
up to -94 dBm typical
up to 384 kbit/s
July 2014
Additional data
11-135
►
GPS
Parameter
Value
Additional data
Chipset
Frequency
C/A code
Channels
Accuracy Position
GSP3F
L1, 1575.42 MHz
1.023 MHz chip rate
20
10 meters, 2D RMS
5 meters 2D RMS, WAAS corrected
<5 meters (50%), DGPS corrected
0.1 meters/second
1 microsecond synchronized to GPS time
0.1 sec., average
1 sec., average
8 sec., average
38 sec., average
42 sec., average
18.000 meters max
515 meters/second max
4g, max
20 meters/second, max
SIRF Start III technology
Velocity
Time
Reacquisition
Snap start
Hot start
Warm start
Cold start
Altitude
Velocity
Acceleration
Jerk
11-136
July 2014
12 MAINTENANCE
12.1
Considerations about the Screen
This paragraph offers key considerations regarding the use of the colour screen,
taken from the specifications of the manufacturer.
In the TFT display, the user may find pixels that do not light up or pixels that are
permanently lit. This should not be regarded as a defect in the TFT. In
accordance with the manufacturer quality standard, 9 pixels with these
characteristics are considered admissible.
Pixels which are not detected when the distance from the surface of the TFT
screen to the human eye is greater than 35 cm, with a viewing angle of 90°
between the eye and the screen should not be considered manufacturing defects
either.
It is advisable a viewing angle of 15° in the 6.00 o’clock direction in order to
obtain the optimum visualization of the screen.
12.2
Cleaning Recommendations
The equipment consists of a plastic case and a TFT screen. Each element has its
specific cleaning treatment.
Cleaning the TFT screen
The TFT screen surface is VERY DELICATE. It has to be cleaned with a soft
fabric cloth (cotton or silk), always making the same move from left to right
and from top to bottom, without putting pressure on the screen.
The TFT screen has to be dry-cleaned or with a product specifically designed
for TFT screens, by slightly dampening the cloth. NEVER use tap or mineral
water, alcohol or conventional cleaning products, because they contain
components that can damage the screen.
Turn off the equipment to locate dirt on the screen. After cleaning, wait a few
seconds before turning on.
July 2014
12-137
Cleaning the plastic case
The equipment has to be disconnected before cleaning the case.
The case must be cleaned with a solution of neutral soap and water, using a
soft cloth dampened with this solution.
Before use, the equipment has to be completely dry.
Never clean with abrasive soaps, chlorinated solvents
hydrocarbons. These products may degrade the case.
12-138
or
aromatic
July 2014
ANNEX 1
A1.1
SIGNALS DESCRIPTION
DIGITAL signals
Integrated Services Digital Broadcasting - Terrestrial (ISDB-T)
A1.1.1
ISDB-T Parameters
July 2014
►
Bandwidth
It shows the channel bandwidth.
►
Code Rate
Also known as Viterbi ratio, defines the ratio between the data bits
number and the total number of bits transmitted (the difference
corresponds to the number of control bits for the error detection and
recovery).
►
Modulations
Carriers modulation. It also defines the system noise immunity.
(QPSK, 16-QAM and 64-QAM).
►
Time interleaving
Length of time interleaving (in bits).
►
High layer
It shows information about the high priority layer.
►
Partial reception
It shows If it is or not possible the partial reception.
►
Guard Interval
The Guard Interval parameter corresponds to the dead time between
symbols, its purpose is to permit a correct detection in multi path
situations. This parameter is defined according to the symbol length: 1/4,
1/8, 1/16, 1/32.
►
Mode
Transmission mode identification based on the separation of OFDM carrier
frequencies. In the case of Brazil, the separation of frequency must
necessarily be about 4 kHz, 2 kHz or 1 kHz, respectively for modes 1, 2
and 3. The number of carriers varies depending on the mode, but the
useful rate of each mode must necessarily be exactly the same in all
modes.
►
Spectral Inversion
This option enables spectral inversion to be applied to the input signal,
though in the majority of cases it in the OFF position.
1
►
TS Layers
It indicates layers used by the demodulator to generate the TS. The
default value is "A + B + C", so the TS will be built with data from these
three layers. If Partial Reception is available, you should choose "A" if you
want just a TS with partial reception information. Keep in mind that the
layers assigned to the TS will affect the MPEG-2 / H.264 Decoder so the
list of services can change depending on the selected layers.
►
Layer
Information about encoding parameters for each layer during the
hierarchy transmission. The layer can be selected (A, B or C) depending
on what is the layer active at the channel.
ISDB-T Measurements
Power
Measured power over the entire bandwidth of the channel.
C/N
Carrier/Noise ratio, where C is the received power of the modulated
carrier signal and N is the received noise power. To measure it correctly
the channel should be tuned at its centre frequency.
MER
Modulation error ratio with link margin (LM). The link margin indicates the
safety margin respect to the MER level, measured for the degradation of
the signal up to the QEF (Quasi Error Free) value. MER represents the
ratio between the average power of the signal and the average noise
power of the signal constellation.
BER (VBER/CBER)
It is the system error rate. In a system of digital terrestrial signal
reception, after the COFDM decoder two methods of error correction are
applied. Each time an error correction is applied on the digital signal, the
error rate changes, so if the error rate is measured at the demodulator
output or after Viterbi or at the Reed-Solomon decoder output, different
error rates are obtained.
CBER
BER measurement for digital signal before the error correction (BER
before FEC).
VBER
BER measurement for digital signal after error correction (BER after
Viterbi).
2
July 2014
In order to have a reference about the image quality, it is considered that
a system has good quality when it produces less than one un correctable
error per hour of transmission. This border is called QEF (Quasi-English
Error-Free,) and corresponds to one error rate after Viterbi equal to
2x10E-4, or 2 bit errors per 10.000.
This value is marked on the BER measurement bar after Viterbi. This the
BER for acceptable signals should be to the left of this mark.
Digital multi-programme systems for television, sound and data
services for cable distribution (J83 Annex B)
A1.1.2
J83 Annex B Parameters
July 2014
►
Spectral inversion
If necessary, activates the Spectral inversion (On).
►
Modulation
It defines the modulation type 64 or 256.
3
J83 Annex B Measurements
Power
Measured power over the entire bandwidth of the channel.
C/N
(Carrier/Noise) where C is the received power of the modulated carrier
signal and N is the noise power received. To measure it correctly the
channel should be tuned at its centre frequency.
MER
Modulation Error ratio with indication of Link Margin (LM).The link margin
indicates the safety margin respect to the MER level, measured for the
degradation of the signal up to the QEF (Quasi Error Free) value. MER
represents the ratio between the average power of the DVB signal and the
average noise power of the signal constellation.
BER (VBER/CBER)
It is the system error rate. In a system of digital terrestrial signal
reception, after the decoder two methods of error correction are applied.
Each time an error correction is applied on the digital signal, the error
rate changes, so if the error rate is measured at the demodulator output
or after Viterbi or at the Reed-Solomon decoder output, different error
rates are obtained.
CBER
BER measurement for digital signal before the error correction (BER
before FEC).
VBER
BER measurement for digital signal after error correction (BER after
Viterbi).
In order to have a reference about the image quality, it is considered
that a system has good quality when it produces less than one un
correctable error per hour of transmission. This border is called QEF
(Quasi-English Error-Free,) and corresponds to one error rate after
Viterbi equal to 2x10E-4, or 2 bit errors per 10.000.
This value is marked on the BER measurement bar after Viterbi. This
the BER for acceptable signals should be to the left of this mark.
4
July 2014
Digital SATELLITE Television FIRST Generation
(DVB-S standard/QPSK modulation)
A1.1.3
DVB-S Parameters
July 2014
►
Channel Bandwidth
It displays the channel bandwidth from 1.3 MHz to 60.75 MHz.
►
Spectral inversion
It detects if the input signal has been inverted.
►
Symbol Rate
It represents the number of times that the signal status changes in a
period of time. The bandwidth is related to this parameter.
►
Roll-Off Factor
Roll-off factor of Nyquist filter. It indicates the excess of bandwidth over
the ideal bandwidth
►
Constellation
QPSK modulation for constellations with DVB-S signals.
►
Code rate
Also known as Viterbi ratio. It defines the ratio between the number of
data bits and the total number of bits transmitted (the difference
corresponds to the number of control bits for the error detection and
recovery). This value should be between 1/2, 2/3, 3/4, 5/6 and 7/8.
5
DVB-S Measurements
Power
Measured power over the entire bandwidth of the channel.
C/N
Carrier/Noise ratio where C is the received power of the modulated carrier
signal and N is the noise power received. To measure it correctly the
channel should be tuned at its centre frequency.
MER
Modulation Error ratio with indication of Link Margin (LM). The link margin
indicates the safety margin respect to the MER level, measured for the
degradation of the signal up to the QEF (Quasi Error Free) value. MER
represents the ratio between the average power of the DVB signal and the
average noise power of the signal constellation.
BER (CBER/VBER)
It is the error rate. There are two measurements related to BER:
CBER (Channel Bit Error Rate):
BER of the signal after the QPSK demodulator and before applying the
error correction or FEC (Forward Error Correction).
VBER (Viterbi Bit Error Rate):
Measurement of the BER for the digital signal after error correction
(BER after Viterbi).
In a system for receiving digital satellite signals (DVB-S) after the QPSK
decoder two methods of error correction are applied. Each time an error
correction is applied on a digital signal its error rate changes, so if we
measure the error rate at the output of the QPSK demodulator or after
Viterbi or after the Reed-Solomon output decoder, the error rates
obtained are different.
6
July 2014
Digital SATELLITE television signal of SECOND generation
(DVB-S2 standard/QPSK/8PSK modulation)
A1.1.4
DVB-S2 Parameters
►
Channel Bandwidth
It displays the channel bandwidth from 1.3 MHz to 60.75 MHz.
►
Spectral inversion
It detects if the input signal has been inverted.
►
Symbol Rate
It represents the number of times the signal status changes in a period of
time. The bandwidth is related to this parameter.
►
Roll-Off Factor
Roll-off factor of Nyquist filter. It indicates the excess of bandwidth over
the ideal bandwidth.
►
Constellation
QPSK or 8PSK modulation for DVB-S2 signal constellation.
►
Code rate
It defines the ratio between the number of data bits and the total number
of bits transmitted (the difference corresponds to the number of control
bits for the error detection and recovery).
►
PLP id
It is the PLP identifier. In the case of PLP Single mode identifies the input
stream (0-255). In the case of PLP Multiple mode clients can choose the
PLP ID to view.
DVB-S2 Measurements
Power
Measured power over the entire bandwidth of the channel.
C/N
Carrier/Noise ratio where C is the received power of the modulated carrier
signal and N is the noise power received. To measure it correctly the
channel should be tuned at its centre frequency.
July 2014
7
MER
Modulation Error ratio. MER represents the ratio between the average
power of the DVB signal and the average noise power of the signal
constellation.
Next to the MER appears the Link Margin (LM) measurement. The LM is
equivalent to the noise margin (NM) and indicates the distance to the QEF
(usually defined as a one lost packet per hour).The LM is measured in dB
and its value corresponds to the safety margin that separates from the
QEF. The greater is the LM better the quality signal. LM of negative values
implies no reception or that video errors are starting to appear in the
video or audio so clear. LM of 0 (zero) value will display a service and
occasionally some artefact.
BER (CBER/LBER)
It is the bit error rate. There are two measurements related to BER:
CBER (Channel Bit Error Rate):
BER of the signal after the QPSK/8PSK demodulator and before
applying the error correction or FEC (Forward Error Correction).
LBER (LDPC Bit Error Rate):
BER after applying LDPC error correction (Low-density parity-check).
This standard makes use of two codes to correct errors that are the LDPC
(Low Density Parity Check) codes combined with BCH (Bose-Chaudhuri Hocquengham) to protect against high levels of signal noise and
interference. Each time you apply an error correction to the digital signal,
the error rate changes, so if we measure the error rate at the output of
the QPSK/8PSK demodulator or after LDPC (Low Density Parity Check)
decoder or at the BCH decoder output, error rates obtained are different.
Next to the LBER measure appears ESR (Error Second Ratio).This
measures indicates the percentage of time with errors after BCH. The
error correction is internal with BCH or external with LDPC. The internal
error correction provides basic minimum load while the outer error
correction is an additional correction with load. It also measures the PER,
which is the number of erroneous packets, that is packets received during
the measurement time not correctable by the demodulator.
8
July 2014
Digital CABLE television signal of FIRST generation
(DVB-C standard/QAM modulation)
A1.1.5
DVB-C Parameters
July 2014
►
Bandwidth channel
It displays the channel bandwidth up to 9.2 MHz.
►
Spectral inversion
It detects if the input signal has been inverted.
►
Symbol Rate
It represents the number of times the signal status changes in a period of
time. The bandwidth is related to this parameter.
►
Roll-Off Factor
Roll-off factor of Nyquist filter. It indicates the bandwidth excess over the
ideal bandwidth.
►
Constellation
Modulation used by the carriers. It also defines immunity to the system
noise (16QAM, 32QAM, 64QAM, 128QAM and 256QAM).
9
DVB-C Measurements
Power
Measured power over the entire bandwidth of the channel.
C/N
Carrier/Noise ratio where C is the received power of the modulated carrier
signal and N is the noise power received. To measure it correctly the
channel should be tuned at its centre frequency.
MER
Modulation Error ratio with indication of Link Margin(LM).The link margin
indicates the safety margin respect to the MER level , measured for the
degradation of the signal up to the QEF (Quasi Error Free) value. MER
represents the ratio between the average power of the DVB signal and the
average noise power of the signal constellation.
BER (CBER)
It is the system error rate. In a digital signal reception via cable, after the
QAM demodulator an error correction method is applied, called ReedSolomon. The error rate after correction is less than the error rate at the
output of the QAM demodulator. For this reason the BER is given prior to
error correction.
CBER
BER measurement for digital signal before the error correction (BER
before FEC)
10
July 2014
A1.2
ANALOGUE signals
Terrestrial band
A1.2.1
Analogue TV
In the measurement of analogue signals in terrestrial band, measurements
available are:
►
LEVEL
Indication of the carrier level of the tuned video.
►
C/N
Ratio between the modulated signal power and noise power for the same
bandwidth (depending on TV standard).The modulation error ratio (MER),
used in digital systems is analogue to the Signal-Noise (S/N) ratio in
analogue systems. T Carrier level is measured by a quasi-peak detector
(100 kHz BW).The noise level is measured with an average detector and
corrected to refer it to the bandwidth equivalent to channel noise
(according to its definition for the TV selected standard).
►
Video/Audio
Ratio between levels of the video carrier to audio carrier.
Analogue FM
In the analogue FM measurement mode signal, the display acts as an
analogue indicator of signal representing the signal at the input. The
equipment also demodulates the FM carrier (radio) and can be listened
through the speaker.
July 2014
11
Satellite band
A1.2.2
Analogue TV
In the measurement mode of analogue signals in the satellite band, measures
available are:
12
►
Level
Measurement of the tuned carrier level.
►
C/N
Ratio between the modulated signal power and noise power equivalent to
the same bandwidth (as TV standard).The modulation error ratio (MER),
used in digital systems is analogue to the Signal-Noise (S/N) ratio in
analogue systems. The carrier level is measured by a quasi-peak detector
(4 MHz BW).The noise level is measured with an average value detector
(230 kHz) and corrected to refer it to the channel bandwidth.
July 2014
ANNEX 2
A2.1
A2.1.1
HOW TO POINT A DISH ANTENNA
INSTALLING A SATELLITE DISH USING HD RANGER 2 ISDB-T/TB
A bit of history
That's it, a bit of history. First artificial satellite "Sputnik I" was launched 4th of
October of 1957 by former Soviet Union. It was about the size of a basketball
with a weight below 100 Kgrs but went down in history as the start point for the
space age. For three weeks it was transmitting radio signals to the excited
scientist on the ground that were gathering fundamental data for the launches to
come.
Figure A2.1.
The first telecommunications satellite was Telstar I launched in 1962. Some
people refers to Echo I as the World's first in 1960 but it was a passive signal
reflector as opposite to Telstar that carried electronics on board like today's
satellites. It was also the first to use the modern transponder concept where the
satellite "transposes" the up-link frequency (6,390 GHz in Telstar) to another
down-link frequency (4,170 GHz in this case). Telstar I trans-mitter power was 3
Watts and the antenna was omnidirectional.
Figure A2.2.
July 2014
13
The antenna used to receive the test transmission from Telstar I was a huge horn
inside a bubble radome 48 metres high. Only four decades later we have broken
all records and we have high power DBS geostationary satellites carrying a lot of
digital transponders on board and we start to worry about space junk having
thousands of satellites in orbit, plenty of them beyond its useful life. Satellites
use highly efficient directional antennas and very high transmitters power, digital
transponders, meaning in plain words that we can receive hundreds of TV
channels with a small, fix, cheap, 60 cm dish.
Figure A2.3.
Modern broadcast satellites use geostationary orbits. This simply means that
they could be seen from the ground hunging in the sky at the same exact
position all the time and therefore receiving signals from them does not require
complex steering systems. A piece of cake.
All we need to do to receive their signals with the enormous amount of programs
they carry is to set up the satellite receiving antenna properly and to ensure that
the signals are received with the proper quality levels…and here is where the
HD RANGER 2 ISDB-T/TB comes into action.
A2.1.2
The basics
A professional installer will instantly tell us from the top of his head what to have
in the to-do-list if we want to install a satellite dish properly. Surely the list will
require us to select the proper mount kit and dish size from the numerous
options available in the market, pick a good location for the dish, free of
obstacles to the south (in the north hemisphere) or to the north (in the south
hemisphere), etc.
Other than the mechanical bits and pieces the dish is made of two clearly
differentiated parts, the reflector and the LNB.
The reflector is passive and simply reflects signals from the satellite in such a
way that the beam is collimated to the LNB's mounting point.
14
July 2014
Figure A2.4.
The LNB (Low Noise Block-converter) is an active device fruit of the great
evolution of RF circuit manufacturing and includes amplifiers, oscillators and
frequency converters in a small low cost package. The first section is made of a
device called polarisation shifter that receives one polarisation or the other
depending on the supply voltage given to the LNB. This voltage is necessary to
supply the active devices inside the LNB.
Signals broadcast from the satellites use two polarisations simultaneously. These
can be LINEAR VERTICAL/HORIZONTAL or CIRCULAR LEFT/RIGHT depending on
the type of transmitting antenna used in the satellite. The transponder
frequencies for each polarisation are carefully selected to avoid interference to
the other polarisation commonly referred to as the crossed polarisation. In
general they are imbricate or in other words frequencies used in one polarisation
are free in the crossed polarisation and viceversa.
13 VDC
VERTICAL
CIRCULAR RIGHT
18 VDC
HORIZONTAL
CIRCULAR LEFT
Modern universal LNB's use mostly linear polarisation and have also the
capability to select a different input frequency range depending on a control
signal called 22 kHz switching tone which is overlapped with the supply voltage.
SUPPLY VOLTAGE
POLARISATION
BAND
13 VDC
VERTICAL
LOW
18 VDC
HORIZONTAL
LOW
13 VDC + 22 kHz
VERTICAL
HIGH
18 VDC + 22 kHz
HORIZONTAL
HIGH
In other words our LNB will output a different set of satellite transponders
depending on which supply voltage we use.
July 2014
15
Figure A2.5. An example of LNB(Low Noise Block-converter)
A2.1.3
Coarse dish alignment
We can use different techniques to find out where in the sky the satellite we want
is located. They can be anything from a pure guessing game to a sophisticated
procedure.
The satellites we are interested in are all positioned in a geostationary orbit
above the earth's equator. Each of them has a fix given position in that orbit,
something like a street number, that we can know from various sources. Orbital
position is an important datum so it is commonly part of the name as well.
Websites like http://www.lyngsat.com/ or http://www.satcodx.com/ offer plenty
of useful information about the satellites we are talking about.
For example ASTRA 19E refers to ASTRA satellite which is positioned at 19
degrees East in the orbit.
Knowing where we are in terms of latitude and longitude is also easy. We can
read that information from a map or even from our car's navigation system if we
have one.
Figure A2.6.
16
July 2014
With this information in hand we can calculate the elevation and azimuth we
should put on the dish to begin our coarse antenna alignment. There are
formulas to do that but some websites are again quite useful. There are also free
mobile applications, as Dish Aligner, which calculates the elevation and azimuth
and also your current location determined by the GPS of the mobile phone. This
one is especially interesting for you can select the satellite you want and then
position yourself on a graphical map:
http://science.nasa.gov/realtime/jtrack/3d/JTrack3D.html/
For example if we take ASTRA (19E position) and select a location somewhere in
Germany:
•
Latitude: 50 degrees North
•
Longitude: 12 degrees East
The required elevation and azimuth for the dish are:
•
Azimuth: 170 degrees
•
Elevation: 31 degrees
Elevation must be measured from the horizontal level (may be using an
inclinometer) and azimuth from magnetic north (with a compass) there are some
applications for smartphones, as mentioned above, that include compass and
inclinometer, although it should be noted that the measurements made by
mobile phone may be affected by interferences from the antenna itself. It is
normally more practical to start with azimuth moving the dish horizontally and
then look for the elevation.
Figure A2.7.
July 2014
17
A2.1.4
Knowing what satellite we are on
And the HD RANGER 2 ISDB-T/TB comes into action. Our dish is now more
ore less "looking" in the direction where we presume our "bird" is parked. With
the HD RANGER 2 ISDB-T/TB connected to the output of the LNB we select
satellite frequency range, antenna alignment mode, span of 200 MHz and set the
power supply voltage to one of the possible values. We will take for example 13
VDC, which will take us to the VERTICAL polarisation and LOW band. We can use
80 dBµV for the reference level for we can change that at pleasure depending on
the amount of signal we get.
Something will come up on the HD RANGER 2 ISDB-T/TB screen. It will
normally be a weak signal that may come from the desired satellite or from the
neighbour ones for the dish is not properly tuned up yet. Swing the dish slightly
horizontally and vertically until a decent signal is shown on the screen.
There we have a satellite but which one is it? Most probably the signals we are
looking at are digital transponders from the unknown satellite. The
HD RANGER 2 ISDB-T/TB can be operated in frequency or channel modes.
Tune any of those digital channels in frequency mode using the joystick and the
markers shown on the screen. The HD RANGER 2 ISDB-T/TB will tell you what
satellite and/or orbital position you are on in a matter of seconds !
If we are unlucky and this is not the satellite we want then we only need to move
the dish slightly to pick the signal from the next satellite and repeat the process.
Figure A2. 8.
18
July 2014
A2.1.5
Fine tuning the dish
Once we know for certain that we are on ASTRA 19E it is time to make fine
adjustments to the dish to optimise the alignment. There are two goals to
achieve. On the one hand we want to receive the maximum amount of power
possible and on the other hand we need to make sure we minimise the
interference from the crossed polarisation.
In order to maximise the received signal power we need only to move the dish's
azimuth and elevation very carefully ensuring that the display of the spectrum
analyser show us the highest values possible.
As you move the dish's position you will see the signal change on the spectrum
analyser. Cross-polarisation is adjusted by rotating the LNB on its axis. As you do
so you will see on the HD RANGER 2 ISDB-T/TB screen how the channels
interfering from the opposite polarisation go up and down the objective being to
leave the LNB in such a position that those channels are as low as possible.
A2.1.6
Testing signal quality
The HD RANGER 2 ISDB-T/TB is the ideal instrument for quick and effective
checks of signal quality not only because it shows all measurements in one single
screen but also because the meter doesn't require bothering configuration
processes.
►
Option 1: Frequency mode
I can tune in frequency mode all channels coming up in the screen, all of
them or the most representative ones only. We can move our cursor in
frequency mode, in spectrum, through out the band. When we stop on a
channel, the meter will acquire all the settings needed to measure the
channel without bothering us. Then pressing the measurement button and
voilà.
►
Option 2: Channel mode
I can select channel mode and a satellite channel table from the list. The
HD RANGER 2 ISDB-T/TB has several of them preloaded but this can be
changed using software application.
Once we select the desired table, ASTRA 19E in this case, we can browse the
channels at once. There are channel tables grouped by polarisation or band
or those with all channels in the satellite.
July 2014
19
A2.1.7
Look what we’ve got
The HD RANGER 2 ISDB-T/TB can also display the free to air programs
available in the satellite. That is very practical not so much for the picture itself
but for amount of interesting data related to the transponders we can display as
well. This includes:
Tuned video information.
► TYPE:
► FORMAT:
► PROFILE:
► PID:
Encoding type and video transmission rate.
Resolution (horizontal x vertical), aspect ratio and
frequency.
Profile level.
Video program identifier.
Tuned service information.
► NETWORK:
► PROVIDER:
► NID:
► ONID:
► TSID:
► SID:
► MHP:
► LCN:
► +Info:
Television distribution network (Terrestrial). Orbital
position (Satellite).
Program provider name.
Network identifier where the signal is distributed.
Identifier of the original network where the signal
originates.
Transport stream identifier.
Service Identifier.
Interactive service.
Logic Channel Number. It is the first logic number
assigned to the first channel in the receiver.
Additional service information.
► FREE/
SCRAMBLED:
► DTV/DS:
Free/scrambled transmission.
Standard type of transmission.
Tuned audio information.
► TYPE:
Type of audio encoding and transmission speed
► FORMAT:
Service audio format. Bit depth; sampling frequency;
sound reproduction.
► LANGUAGE:
Broadcasting language.
► PID:
ID of the audio program.
At any time it is possible to display the SERVICE LIST pressing the F3 key and
show all the programs and services available within the tuned channel. Selecting
one particular channel or service becomes very intuitive.
20
July 2014
ANNEX 3
A3.1
DiSEqC COMMANDS
DiSEqC introduction
The DiSEqCTM (Digital Satellite Equipment Control) is an open protocol created
by Eutelsat in 1997 as a communication standard between satellite TV receivers
and external peripherals. The DiSEqCTM communications are based on the control
commands, which travel combined with power voltage through the coaxial cable
that leads the TV signal. The compatible peripherals and receivers detect these
commands and react in agreement with such.
A DiSEqCTM command is a digital command represented by a succession of
binary messages: “0” and “1” obtained when modulating the 22 kHz signal.
The DiSEqCTM usually is used in the satellite TV facilities in order to use different
types of switchers, through the coaxial cable that leads the TV signal.
A3.2
To begin: The Universal LNB
The Universal LNB is the simplest and most used LNB. This allows the signal
reception coming from one single satellite.
TWIN (2 independent outputs), QUAD (4 independent outputs) and OCTO
(8 independent outputs) versions exist in the market. Each output is independent
from others and can be connected to a different receiver.
An universal LNB is controlled by means of a power voltage and a 22kHz signal,
sent through the RF cable, which allows us to switch between the different bands
and polarities, according to the following table:
∗
∗
‘Standard’
‘TWIN’
‘QUAD’
1 satellite only
1 receiver
1 satellite only
2 receivers
1 satellite only
4 receivers
‘OCTO’
1 satellite only
8 receivers
Power
Band
Polarization(linear / circular)
13 V
Low
Vertical / Right
18 V
Low
Horizontal / Left
13 V + 22 kHz
High
Vertical / Right
18 V + 22 kHz
High
Horizontal / Left
Not to confuse with LNB Quattro used in collective facilities.
July 2014
21
Note: The LNB accept a very wide range of values for these voltages, usually
10-14.5V (for 13V) and 15.5-20V (for 18V).
In the HD RANGER 2 ISDB-T/TB, the band and the polarisation selection can
be done from different menus (all the different ways indicate dare equivalent):
Menu
Line
External units power supply
13 V, 18 V, 13 V+22kHz, 18 V+22kHz
Band: High / Low
Polarization: Vertical / Horizontal
Band: High / Low
Polarization: Vertical / Horizontal
Configuration
DiSEqC
A3.3
DiSEqCTM around the world
The use of DiSEqCTM devices requires to know previously which commands are
acknowledged by these ones, since it will determine the wiring diagram of the
different elements, as well as the way as they can be controlled. This information
must be provided by the device manufacturer.
Following appear the DiSEqCTM devices more usually installed in the individual
and collective facilities.
A3.4
A3.4.1
In the individual facilities
Tone-burst switcher (2 inputs – 1 output)
Figure A3. 1.
It is the simpler DiSEqCTM switcher. This one uses the « SAT A/B » commands
and allows to switch between two different Universal LNB:
22
July 2014
Command
Selected input
SAT A
Satellite 1
SAT B
Satellite 2
These switchers are transparent to the LNB's (13V, 18V, 22 kHz) commutation
commands. Then, once chosen the satellite with the SAT command, the
corresponding LNB can be used in a normal way. (see Universal LNB).
Note: There are switchers of 2 inputs and 1 output in which other DiSEqCTM
commands are used, such as POSITION or OPTION, to allow more complex
assemblies. Refer to the manufacturer technical information to make sure which
are the commands to use.
A3.4.2
Monobloc LNB
A Monobloc LNB is a module composed by 2 Universal LNB connected by a Toneburst switcher (2 inputs – 1 output). So, it can be managed in the same way.
Also TWIN (2 independent outputs), QUAD (4 independent outputs) and OCTO
versions exist (8 independent outputs). In this case, each output is controlled in
a different way from the rest.
Important: If it is desired to use Monobloc LNB with DiSEqCTM switchers, is
necessary to make sure that these are compatible.
Figure A3. 2.
July 2014
23
A3.4.3
DiSEqCTM Switcher with 4 inputs and 1 output
Figure A3. 3.
This switcher allows the signal reception from four independent Universal LNBs
(coming from 4 different satellites) on a single receiver.
As it is possible to observe in the attached scheme, there are “OPTION” and
“POSITION” switchers in cascade. In order to switch it, will be necessary to send
an OPTION command and later a POSITION command that yields, therefore, a
total of 4 possibilities.
Note: the manufacturers usually assure the compatibility with the Tone-burst
commands (SAT A/B) so that the second stage can be switched as much using a
«POSITION A/B» command as using a «SAT A/B» command. This allows us then
to use the switcher like a Tone-burst type with 2 inputs and 1 output.
With the HD RANGER 2 ISDB-T/TB, it is very easy to use this type of
switcher, because it incorporates a specific «OPT / POS»command:
HD RANGER 2
Combination of DiSEqCTM
Commands send
Selected input
OPT/POS A-A
Option A + Position A
Satellite 1
OPT/POS A-B
Option A + Position B
Satellite 2
OPT/POS B-A
Option B + Position A
Satellite 3
OPT/POS B-B
Option B + Position B
Satellite 4
ISDB-T/TB
Command
These switchers are transparent to the LNB's (13V, 18V, 22 kHz) switching
commands. Then, once the satellite is chosen by means of the SAT command,
the corresponding LNB can be used in a normal way. (see Universal LNB).
24
July 2014
A3.5
In the collective facilities
The most frequent satellite signal distribution system in the small collective
facilities is the “BIS-switched”. This technology implies to use the “Quattro” type
LNBs (not to confuse with the “QUAD” type) and also supports specific
multiswitches for this type of facilities.
A Quattro-LNBis a LNB with 4 outputs that provides in a separated way the four
frequency bands (vertical low, vertical high, horizontal low and horizontal high).
These four signal scan then be distributed in the building through multiswitches.
Figure A3. 4.
The signal is distributed in the network by means of multi-outlet
multiswitches. The number of inputs and outputs is variable. The number of
inputs depends on the number of satellites (LNB).Usually a multiswitch includes
also an input for the TV terrestrial signal. The number of outputs depends on the
number of terminals (receivers) that can be connected to the multiswitch. In
addition, multiswitch in cascade incorporate pass connectors to be able to
distribute the signal and thus to connect several multiswitch in cascade mode
and therefore to give access to more users.
Figure A3. 5.
July 2014
25
►
Examples of multiswitch
SAT Inputs
TER Inputs
Satellites
Terminals
Multiswitch 9/4
8
1
2
4
Multiswitch 5/16
4
1
1
16
Multiswitch 17/16
16
1
4
16
…
…
…
…
…
We will not consider the input of terrestrial TV, since this does not take part in
the satellite signal. Also the following indicated examples do not show more than
a single output. In the case of several outputs, the own operation scheme is
reproduced for each one of them, because they are independent of the others.
A3.5.1
Multiswitch (1 satellite)
Figure A3. 6.
In the DiSEqCTM menu of the HD RANGER 2 ISDB-T/TB, select the band and
the polarisations desired and send the SAT A command, as it is indicated in the
following table:
Band
Polarization
Command
Low
Horizontal
SAT A
Low
Vertical
SAT A
High
Horizontal
SAT A
High
Vertical
SAT A
Very important: Whenever you wish to change of band or polarisation, it is
necessary to send the SAT A command at the same time, since multiswitch does
not respond to the habitual switching commands for a LNB (13V/18V/+22kHz): it
is necessary the complete DiSEqCTM sequence to cause the commutation.
26
July 2014
A3.5.2
Multiswitch (2 Satellites)
Figure A3. 7.
This type of multiswitch is used usually to switch the Astra 19º and Hotbird 13º
satellites.
As in the previous case, if for a certain satellite it is desired to change of band or
polarisation, it is not sufficient with changing the corresponding parameter, but in
addition it is necessary to send the command SAT A/B corresponding to cause
the switching (even if one does not change of satellite).
July 2014
Band
Polarization
Command
Output
Low
Horizontal
SAT A
Satellite-1
Low
Vertical
SAT A
Satellite-1
High
Horizontal
SAT A
Satellite-1
High
Vertical
SAT A
Satellite-1
Low
Horizontal
SAT B
Satellite-2
Low
Vertical
SAT B
Satellite-2
High
Horizontal
SAT B
Satellite-2
High
Vertical
SAT B
Satellite-2
27
A3.5.3
Multiswitch (4 Satellites)
Figure A3. 8.
This type of multiswitch allows to distribute the signal coming from 4 different
satellites. It uses a combination of OPTION, POSITION, Polarisation and Band
commands. The equipment allows to use easily this type of multiswitch thanks to
the « OPT/POS » command, which sends the OPTION et POSITION commands in
the necessary order. Like in the others multiswitch, if itis wanted to change of
band or polarisation, if the satellite is even he himself, is necessary to send
OPT/POS command to cause the commutation again.
28
Band
Polarization
Command
Satellite
Low
Horizontal
OPT/POS A-A
Satellite-1
Low
Vertical
OPT/POS A-A
Satellite-1
High
Horizontal
OPT/POS A-A
Satellite-1
High
Vertical
OPT/POS A-A
Satellite-1
Low
Horizontal
OPT/POS A-B
Satellite-2
Low
Vertical
OPT/POS A-B
Satellite-2
High
Horizontal
OPT/POS A-B
Satellite-2
High
Vertical
OPT/POS A-B
Satellite-2
July 2014
A3.6
►
Band
Polarization
Command
Satellite
Low
Horizontal
OPT/POS B-A
Satellite-3
Low
Vertical
OPT/POS B-A
Satellite-3
High
Horizontal
OPT/POS B-A
Satellite-3
High
Vertical
OPT/POS B-A
Satellite-3
Low
Horizontal
OPT/POS B-B
Satellite-4
Low
Vertical
OPT/POS B-B
Satellite-4
High
Horizontal
OPT/POS B-B
Satellite-4
High
Vertical
OPT/POS B-B
Satellite-4
DiSEqC
programs
and
commands
ISDB-T/TB
in
the
HD RANGER 2
Commands
The Commands option allows executing any of the following commands:
COMMAND
SAT AB-A
SAT AB-B
SWITCH OPTION AB-A
SWITCH OPTION AB-B
DISABLE LIMITS
LIMIT EAST
LIMIT WEST
DRIVE ROTOR
GOTO
HALT
STORE
RECALCULATE
SWITCH 1A
SWITCH 1B
SWITCH 2A
SWITCH 2B
SWITCH 3A
SWITCH 3B
SWITCH 4A
SWITCH 4B
POWER
RESET
STANDBY
July 2014
29
►
Programs
There are eight predefined programs that execute basic functions to control an
universal switch with two or four inputs. It also has more programs that control
installations with 8 or 16 satellite antennas using SPAUN devices or switches
Commited/Uncommited. Whenever a DiSEqCTM program is sent, the commands
that correspond to the equipment status in relation to the Horizontal or Vertical
polarization and High or Low frequency band are also sent. This allows assuring
that the installation status is the one indicated by the equipment.
DiSEqC Programs
16x1 LNB01 U1A2A/OpA_PoA
16x1 LNB02 U1A2A/OpA_PoB
16x1 LNB03 U1A2A/OpB_PoA
16x1 LNB04 U1A2A/OpB_PoB
16x1 LNB05 U1B2A/OpA_PoA
16x1 LNB06 U1B2A/OpA_PoB
16x1 LNB07 U1B2A/OpB_PoA
16x1 LNB08 U1B2A/OpB_PoB
16x1 LNB09 U1A2B/OpA_PoA
16x1 LNB10 U1A2B/OpA_PoB
16x1 LNB11 U1A2B/OpB_PoA
16x1 LNB12 U1A2B/OpB_PoB
16x1 LNB13 U1B2B/OpA_PoA
16x1 LNB14 U1B2B/OpA_PoB
16x1 LNB15 U1B2B/OpB_PoA
16x1 LNB16 U1B2B/OpB_PoB
8x1 LNB1 U1A/OptA_PosA
8x1 LNB2 U1A/OptA_PosB
8x1 LNB3 U1A/OptB_PosA
8x1 LNB4 U1A/OptB_PosB
8x1 LNB5 U1B/OptA_PosA
8x1 LNB6 U1B/OptA_PosB
8x1 LNB7 U1B/OptB_PosA
8x1 LNB8 U1B/OptB_PosB
LNB4 (Sw1A-OptB-PosB)
LNB8 (Sw1B-OptB-PosB)
Position AB-A
Position AB-A
Sat A (Toneburst)
Sat B (Toneburst)
Switch Uncom.1/AA
Switch Uncom.1/AB
Switch Uncom.1/BA
Switch Uncom.1/BB
Switch Uncom.2/AA
Switch Uncom.2/AB
Switch Uncom.2/BA
Switch Uncom.2/BB
30
July 2014
ANNEX 4
A4.1
REMOTE CONTROL COMMANDS
Introduction
The design of HD RANGER 2 ISDB-T/TB based on a microprocessor, allows
data to be exchanged between the equipment and a remote controller (usually a
personal computer) via USB. By this way, data can be obtained from the
equipment and also control it remotely. These data can be stored and
subsequently processed for use in maintenance work. Furthermore, the remote
control allows tracking and monitoring installations.
A4.2
Protocol for communication
ISDB-T/TB and a PC
between
the
HD
RANGER
2
This protocol is controlled by software and is using a virtual serial port over an
USB interface. Data and information are exchanged using messages consisting of
ASCII alphanumerical characters. This method ensures easy carrying between
different types of personal computers.
To activate the virtual serial port, a special driver must be installed. The driver is
included with the purchased instrument.
►
Connections
The cable between the HD RANGER 2 ISDB-T/TB and the PC is supplied
with the equipment.
You need at least Windows XP to work with HD RANGER 2 ISDB-T/TB.
Drivers only work for Windows operative systems. What drivers do is to create a
virtual COM port, so the software application can “see” the equipment.
July 2014
31
Operation Mode
A4.3
The HD RANGER 2 ISDB-T/TB accepts remote commands at any time, which
the instrument is on. That is, it is not necessary to put the instrument in special
remote control mode; rather, this mode is selected immediately when it detects a
complete command during the time necessary for its execution. The protocol
communication is as follows:
1.-
HD RANGER 2 ISDB-T/TB transmits a XON code (11H) every second.
The aim is to indicate to any possible remote device that the equipment is
ready to receive data.
2.-
At this moment, data streams can be sent it. Each data stream is
composed by:
a. Stream beginning: ‘*’ (code 2AH).
b. Set of characters that describe data message.
c.
CR (carriage return, code 0DH).
3.-
Once a data stream has been sent, will be received a XOFF (code 13H)
indicating that the transmission is stopped.
4.-
Next, in case of correct message an ACK (acknowledge, code 06H) is
expected or a NAK (not acknowledge, code 15H) in the opposite case.
5.-
If the sent message requires answers it will be sent at this moment.
6.-
Once completed the data stream transmission, the HD RANGER 2
ISDB-T/TB will send a XON (code 11H) indicating that already it is
prepared to receive a new data stream.
A typical communication chronogram would be as follows:
PC (REMOTE CONTROLLER)
1)
2)
3)
4)
5)
6)
7)
*?TV<CR>
wait…
HD RANGER 2 ISDB-T/TB
<----------->
<-----<-----<------
<------
XON
XOFF
ACK 5
*TV0<CR>
XON
(all characters are transmitted in ASCII code).
32
July 2014
Commands should always be sent in capital letter and cannot be edited online,
i.e., once a character is received it is stored in the HD RANGER 2 ISDB-T/TB
buffer and cannot be rectified by sending an erase code.
Commands in remote control are divided into two groups, orders and
interrogations. Orders modify a variable or the equipment status. Interrogations
respond with information concerning equipment status or the value of a variable.
For interrogative command, it is necessary to add the character ´?´ after the
character '*'.
A4.4
Virtual Serial Port Configuration
In order to ensure error-free communication between the computer and the
HD RANGER 2 ISDB-T/TB you must programme following communication
parameters into the control console via USB:
July 2014
Rate:
115200 bits/s
Data bits:
8 bits
Parity:
No
Stop Bits:
1
33
A4.5
Remote commands table
Remote Commands
CAPTURE
EQUIPMENT POWER
OFF
EQUIPMENT SN
INSTALLATION
INSTALLATION
CURRENT
INSTALLATION
CURRENT CLEAR
INSTALLATION
CURRENT REMOVE
INSTALLATION
DEFLATE
INSTALLATION FILE
INSTALLATION FILE
ZIP
INSTALLATION
INFLATE
INSTALLATION PC
FILE
INSTALLATION PC ZIP
INSTALLATION
REMOVE
INSTALLATION ZIP
LNB
LTE
MEASURE
MODE
NAM
PRINT SCREEN
PSI
RTC
SIGNAL
SPECTRUM
TUNE
TUNE CH
TUNE PLAN
VER
VIDEO
34
Short Description
It makes and read screen captures.
It shutdowns the equipment
It provides the serial number of the equipment
It provides information about all the installations
It provides information about the current installation
It removes all files of the current installation. The
installation itself is not remove, only its contents
It removes the files of the same type in the current
installation
It compresses the installation, if it exists. If is the
current installation, it changes to DEFAULT installation
before the compression
It reads an “xml” file of the current installation and
sends it to a PC
It reads an “xml” file of the current installation and
sends all the installation files zipped to a PC
It decompresses the installation, it it exists
It sends a file of the current installation to the PC
It sends a file from a PC to the equipment zipped with
all files of the installation
It removes an installation
It receives the installation from the host
It
It
It
It
It
It
It
It
It
It
It
It
It
It
It
provides / configures the LNB output
provides / configures the LTE filter status
provides information of all active measurements
provides / sets the operation mode of the equipment
provides the program name
makes a screenshot in PNG format
provides / configures services
provides / sets date and time
provides / configures the signal type
configures the span and/or the reference level
provides / configures the frequency
provides / configures the channel
configures a channel plan
provides the version of the main software application
configures the video source
July 2014
Name
Description
Configuration
* Before save
file, this
command delete
the files “capture”
from c: directory.
Name
Description
Question
Response
CAPTURE (MAKES SCREEN CAPTURE)
It build a file with the current screen data in xml/png format
*CAPTURE FORMAT=format
format
Description format
PNG
XML
Makes a screen capture in PNG format and save
this capture as “c:/capture.png”.
TODO. Copy a file from “a:/usr/var/prova.xml” to
“c:/capture.xml”.
CAPTURE (READ SCREEN CAPTURE)
It read a file with the current screen capture. See command
*CAPTURE
*?CAPTURE BLOCK=bbbb <CR>
*CAPTURE SIZE=nnn blockn crcn
name
Description name
size
nnn
Description size
Size in bytes (nnn) of file
Description blockn crcn
blockn crcn
Amount of data blocks (blockn) and CR code
(crcn)
Read a file from c:/ .
Files: capture.xml or capture.png.
Protocol:
PC→*?CAPTURE BLOCK=xx <cr>
RANGER→Xoff It check if file exist then send ACK, otherwise
send NACK + Xon abort the command.
RANGER→*CAPTURE SIZE=xx
RANGER→Xon
PC→ ACK
RANGER→Xoff
RANGER→block1 + crc (1 byte) + Xon
PC→It Calculates the block crc if correct send ACK
RANGER→ if detect ACK then send Xoff
RANGER→block2 + crc (1 byte) + Xon
PC→It Calculates the block crc if correct send ACK
....
Until last block.
*See File command.
Name
Description
Order
July 2014
EQUIPMENT POWER OFF
It shutdowns the equipment
*EQUIPMENT POWEROFF
35
36
Name
Description
Question
Response
EQUIPMENT SN
It provides the serial number of the equipment
*?EQUIPMENT SN
*EQUIPMENT SN = equipment_resp
equipment_resp Description equipment_resp
nnn
Unique numeric code that identifies the
equipment
Name
Description
Question
Response
INSTALLATION
It provides information about all the installations
*?INSTALLATION install
*INSTALLATION install_resp
install
install_resp
Description install_resp
<empty>
Number (nn) of
NUMBER=nn
installations
CURRENT
Name (name) of current
NAME=name
installation
Number (nn) of terrestrial
TER-CH=nn
channel plans in the
current installation
Number (nn) of satellite
SAT-CH=nn
channel plans in the
current installation
Number (nn) of DISEQC
DISEQC=nn
programs in the current
installation
Number (nn) of print
SCREEN=nn
screens in the current
installation
Number (nn) of
DATALOGGER=nn
dataloggers in the current
installation
Number (nn) of spectrum
SP=nn
captures in the current
installation
Number (nn) of captures
MER=nn
MERxcarrier in the current
installation
Number (nn) of echo
ECHOES=nn
captures in the current
installation
CONSTELLATION=nn Number (nn) of
constellation captures in
the current installation
NUMBER=nn NAME=name
Name of the installation
with index “nn”
July 2014
Name
Description
Question
Response
Name
Description
Order
July 2014
INSTALLATION CURRENT
It provides information about the current installation
*?INSTALLATION CURRENT current=nn
*INSTALLATION NAME=current_resp
current
Description nn
Description
(decimal value)
current_resp
<empty>
<empty>
Available data from the
current installation
TER-CH
Terrest. channel
Terrestrial channel plan
plan index
name with “nn” index
SAT-CH
Sat. channel plan Satellite channel plan
index
name with “nn” index
DISEQC_PROGRAM DISEQC program
DISEQC program name
index
with “nn” index
PNG
Print screen file
Print screen file name
index
with “nn” index
DATALOGGER
Datalogger index
Datalogger name with
“nn” index
SPECTRUM
Capture index
Spectrum capture name
with “nn” index
CONSTELLATION
Constellation
Constellation capture
index
name with “nn” index
ECHOES
Capture index
Echo capture name with
“nn” index
MER capture name with
MER
Capture index
“nn” index
NUMBER
Installation index Installation name with
“nn” index
INSTALLATION CURRENT CLEAR
It removes all files of the current installation. The installation
itself is not remove, only its contents
*INSTALLATION CURRENT CLEAR
37
Name
Description
Order
INSTALLATION CURRENT REMOVE
It removes the files of the same type in the current installation
*INSTALLATION CURRENT REMOVE tag=name
tag
Description tag
Spectrum capture file
SPECTRUM
Terrestrial channel plan file
TER-CH
Satellite channel plan file
SAT-CH
DISEQC program file
DISEQC_PROGRAM
Print screens file
PNG
Constellation capture file
CONSTELLATION
Echo capture file
ECHOES
MER x carrier capture file
MER
Datalogger file
DATALOGGER
Spectrogram file
SPECTROGRAM
Merogram file
MEROGRAM
Transport stream file
TS
name
<empty>
abcd
Name
Description
Configuration
38
Description name
It removes all files belonging to the
same type, which is determined by the
tag
It removes the file with name (“abcd”)
of the type indicated by the tag
INSTALLATION DEFLATE
It compresses the installation, if it exists. If is the current
installation, it changes to DEFAULT installation before the
compression
*INSTALLATION NAME= name DEFLATE
name
Description name
abcd
Name of the installation (“abcd”)
July 2014
Name
Description
Question
Response
INSTALLATION FILE
It reads an “xml” file of the current installation and sends it to a
PC
*?INSTALLATION CURRENT tag=name BLOCK=bbbb
*INSTALLATION SIZE=size
tag
Description tag
SPECTRUM
It reads spectrum captures in the current
installation
TER-CH
It reads terrestrial channel plans in the
current install
SAT-CH
It reads satellite channel plans in the
current install
DISEQC_PROGRAM It reads DISEQC programs in the current
installation
PNG
It reads print screens in the current
installation
CONSTELLATION
It reads constellation captures in the
current install
ECHOES
It reads echo captures in the current
installation
MER
It reads MER x carrier captures in the
current install
DATALOGGER
It reads datalogger in the current
installation
SPECTROGRAM
It reads spectrograms in the current
installation
MEROGRAM
It reads merograms in the current
installation
TS
It reads transport stream in the current
installation
name
Description name
abcd
bbbb
nnn
July 2014
Name (“abcd”) of the capture. In case of a
DATALOGGER tag, the name could be the
header file of a datalogger or the file name
of a test point (datalogger.xml or
datalogger/tp.xml).
Description bb
Byte (nnn decimal) size to which the file
will be divided to be send
size
Description size
nnn
File byte (nnn decimal) size when send
39
Name
Description
Question
Response
Name
Description
Configuration
40
INSTALLATION FILE ZIP
It reads an “xml” file of the current installation and sends all
the installation files zipped to a PC
*?INSTALLATION CURRENT ZIP BLOCK=bbbb
*INSTALLATION SIZE=size
bbbb Description bb
nnn
Byte (nnn decimal) size to which the file will be divided
to be send
size
nnn
Description size
File byte (nnn decimal) size when send
INSTALLATION INFLATE
It decompresses the installation, if it exists
*INSTALLATION NAME= name INFLATE
name
Description name
abcd
Name of the installation (“abcd”)
July 2014
Name
Description
Order
INSTALLATION PC FILE
It sends a file of the current installation to the PC.
*INSTALLATION CURRENT tag=name SIZE=size BLOCK=bbbb
tag
Description tag
SPECTRUM
name
abcd
Spectrum captures files to the
installation
Terrestrial channel plans files
current install
Satellite channel plans files
current instal.
DISEQC programs files to the
installation
Print screens files to the
installation
Constellation captures files
current install
Echo captures files to the
installation
MER x carrier captures files
current install
Datalogger
files
to
the
installation
Spectrograms files to the
installation
Merograms
files
to
the
installation
Transport stream files to the
installation
Description name
Capture name (“abcd”).
size
Description size
nnn
File byte (nnn decimal) size when send
bbbb
Description bbbb
nnn
Byte (nnn decimal) size to which the file
will be divided to be send
TER-CH
SAT-CH
DISEQC_PROGRAM
PNG
CONSTELLATION
ECHOES
MER
DATALOGGER
SPECTROGRAM
MEROGRAM
TS
July 2014
current
to the
to
the
current
current
to
the
current
to the
current
current
current
current
41
Name
Description
Order
42
INSTALLATION PC ZIP
It sends a file from a PC to the equipment zipped with all files
of the installation
*INSTALLATION ZIP NAME=name SIZE=size BLOCK=bbbb
name
Description name
abcd
Name (“abcd”) of the installation
size
nnn
Description size
Byte (nnn decimal) size of the file when send
bbbb
Description bbbb
nnn
Byte size (nnn decimal) of blocks that will be send
from the ZIP file
Name
Description
Order
INSTALLATION REMOVE
It removes a installation
*INSTALLATION NAME= name REMOVE
name
Description name
abcd
Installation name (“abcd”)
Name
Description
Configuration
INSTALLATION ZIP
It receives the installation from the host
*INSTALLATION NAME= name ZIP
name
Description name
abcd
Name of the installation (“abcd”)
July 2014
Name
Description
Question
Response
LNB
It provides / configures the LNB output
*?LNB lnb
*LNB lnb = lnb_resp
lnb
Description lnb_resp
OUTPUT
ENABLE
VOLTAGE
CURRENT
AVAILABLE
Configuration
Name
Description
Question
Response
Configuration
July 2014
UNDERVOLTAGE
OVERCURRENT
SHORTCIRCUIT
DRAINLED
*LNB lnb = lnb_conf
lnb
ENABLE
ENABLE
OUTPUT
Current selected output
LNB enable (ON) or disabled (OFF)
Last measurement of the LNB output
voltage
Last measurement of the LNB output
current
Available output with the current
configuration
Under voltage alarm
Overvoltage alarm
Short circuit alarm
LED DRAIN lit (ON) or not (OFF)
lnb_conf
ON
OFF
nnn
Description lnb_conf
Enables the LNB.
Disables the LNB.
LNB output voltage (nnn must
be one of the available
options seen on the command
*?LNB AVAILABLE)
LTE
It provides/configures the LTE filter status
*?LTE
*LTE lte_resp
lte_resp
Description lte_resp
ON
LTE filter enabled
OFF
LTE filter disabled
*LTE lte_conf
lte_conf
Description lte_conf
ON
It enables the LTE filter
OFF
It disables the LTE filter
43
Name
Description
Question
Response
44
MEASURE
It provides information of all active measurements
*?MEASURE measure
*MEASURE measure=measure_resp units
measure
Description measure_resp
<empty>
All the active measures
POWER
Digital channel power
LEVEL
Analogue channel level
C/N
C/N of the measured channel (dB)
V/A
Video/Audio carrier ratio
MER
MER measurement value
CBER
CBER measurement value
VBER
VBER measurement value
LBER
LBER measurement value
LM
Link Margin value
=
Measurement within scale
<
Measurement under the value shown
>
Measurement over the value shown
units
Description units
dB
Measurement units for C/N, V/A, MER
dBm/dBuV/dBmV
Measurement units for POWER, LEVEL
July 2014
Name
Description
Question
Response
Configuration
MODE
It provides/sets the operation mode of the equipment
*?MODE
*MODE mode_resp
mode_resp
Description mode_resp
TV
TV mode
TV+SP+MEASURE
TV mode with spectrum and
measurements
TV+PARAMETERS
TV mode with TS parameters
SP
Spectrum mode
SP+MEASURE
Spectrum mode with measurement
SP+MEASURE+TV
Spectrum mode with TV and
measurement
MEASURE
Measurement mode.
MEASURE+TV+SP
Measurement mode with TV and
spectrum
MEASURE+PARAMETERS Measurement mode with
demodulator parameters
ECHOES
Echoes tool
CONSTELLATION
Constellation tool
*MODE mode_conf
mode_conf
Description mode_conf
TV
TV+SP+MEASURE
TV+PARAMETERS
SP
SP+MEASURE
SP+MEASURE+TV
MEASURE
MEASURE+TV+SP
MEASURE+PARAMETERS
ECHOES
CONSTELLATION
Name
Description
Question
Response
July 2014
TV mode
TV mode with spectrum and
measurements
TV mode with TS parameters
Spectrum mode
Spectrum mode with measurement
Spectrum mode with TV and
measurement
Measurement mode
Measurement mode with TV and
spectrum
Meas. mode with demodulator
parameters
Echoes tool
Constellation tool
NAM
It provides the program name
*?NAM
*NAM nam_resp
nam_resp Description nam_resp
abc
It provides the program name “abc”
45
Name
Description
Configuration
Name
Description
Question
Response
Comments:
If
status!=ACQUIRED
then service
information isn’t
shown.
Configuration:
OPTIONAL:
[AUDIO=xx]
PRINT SCREEN
It makes a screenshot in PNG format
*PRINT SCREEN=printscreen_conf
=printscreen_conf Description =printscreen_conf
<empty>
It gives a name by default
=abc
It gives the name “abc”
PSI
It provides / configures services
*?PSI
*PSI STATUS=status_resp NUMBER=number_resp ONID=onid
NID=nid TSID0tsid NETWORK=name
status_resp
Description status_resp
ACQUIRED
Acquired services of channel.
IN_PROGRESS
Acquiring services of channel (in progress).
FAIL
Acquisition failed.
STOPPED
Acquisition stopped.
number_resp
Description number_resp
xx
xx=Number of services
Information
Description
services
(ACQUIRED)
ONID
Original Network id
NID
Network id
TSID
Transport Stream id
NETWORK
Name of service network
*PSI SERVICE= index_conf [AUDIO=index_audio]
index_conf
Index of service. Selecting service from the
index service.
index_audio
Configuration:
OPTIONAL:
[AUDIO=xx]
*PSI SID= service_id_conf [AUDIO=index_audio]
service_id_conf Service id. Selecting service from the service
id.
index_audio
46
Index of audio.
Index of audio.
July 2014
PSI SERVICE
Name
Description It provides / configures services
*?PSI SERVICE=service
Question
Response
Question
Response
Question
Response
Question
Response
July 2014
-*?PSI SERVICE=CURRENT.
-*?PSI SERVICE=xx
*PSI SERVICE=ss NAME=name PROVIDER=provider SID=sid
TYPE=type FREE/SCRAMBLED LCN=lcn
Information service Description information service
SERVICE
Service number. ss=CURRENT o ss=index of
service.
NAME
Service name.
PROVIDER
Service provider.
SID
Service id.
TYPE
Type of service (Radio/TV/Data...)
FREE/SCRAMBLED
Service free or not.
LCN
Logical channel number.
*?PSI SERVICE=CURRENT AUDIO
*PSI NUMBER=nn AUDIO=aa PID=pid BITRATE=bitrate TYPE=type
FORMAT=format LANGUAGE=language
Information
Description information service
service
NUMBER
Audios number
AUDIO
Index of audio
PID
PID number
BITRATE
Bitrate in kbps
TYPE
Type of audio (MPEG-1, DD, DD+...)
FORMAT
Format of audio (Stereo/Mono...)
LANGUAGE
Language of audio
*?PSI SERVICE=xx AUDIO
*PSI NUMBER=nn
Information
Description information service
service
NUMBER
Audios number
*?PSI SERVICE=CURRENT/xx AUDIO=aa
*PSI NUMBER=nn AUDIO=aa PID=pid TYPE=type
LANGUAGE=language
Information
Description information service
service
NUMBER
Audios number
AUDIO
Index of audio
PID
PID number
TYPE
Type of audio (MPEG-1, DD, DD+)
LANGUAGE
Language of audio
47
Question
Response
Question
Response
Question
Response
Question
Response
48
*?PSI SERVICE=CURRENT/xx AUDIO=aa
*PSI PID=pid BITRATE=bitrate TYPE=type RESOLUTION=resolution
FORMAT=format FRAME=frame PROFILE=profile
Information
Description information service
service
PID
PID number.
BITRATE
Bitrate in kbps.
TYPE
Type of video (MPEG-2,H264,...).
RESOLUTION
Resolution of video.
FORMAT
Format of video (16:9/4:3...)
FRAME
Freq
PROFILE
Profile level
*?PSI SERVICE= xx VIDEO
*PSI PID=pid TYPE=type
Information
Description information service
service
PID
PID Number
TYPE
Type of audio (MPEG-1, DD, DD+...)
*?PSI SERVICE=CURRENT/xx DATA
*PSI NUMBER=nn
Information
Description information service
service
NUMBER
Number of datas
*?PSI SERVICE=CURRENT/xx DATA=dd
*PSI NUMBER=nn DATA=nn PID=pid TYPE=type
Information
Description information service
service
NUMBER
Number of datas
DATA
Index of data
PID
PID number
TYPE
Type of data (txt, subtitles, data...)
July 2014
Name
Description
Question
Response
Configuration
July 2014
RTC
It provides/sets date and time
*?RTC rtc
*RTC rtc=rtc_resp
rtc
rtc_resp
Description rtc_resp
DATE=date
It shows current date, time and
TIME=time
date format
FORMAT=format
TIME
hh:mm:ss
Hours:minutes:seconds
DATE
DD/MM/YYYY
day/month/year
DD/MM/YY
day/month/year (last two digits)
MM/DD/YYYY
month/day/year
YYYY/MM/DD
year/month/day
FORMAT
Selected format
*RTC rtc= rtc_conf
rtc
rtc_conf
Description rtc_conf
TIME
hh:mm:ss
Hours:minutes:seconds
DATE
Date according to the selected
format
FORMAT DD/MM/YYYY
day/month/year
DD/MM/YY
day/month/year (last two digits)
MM/DD/YYYY
month/day/year
YYYY/MM/DD
year/month/day
49
Name
Description
Question
Response
Configuration
50
SIGNAL
It provides/configures the signal type
*?SIGNAL signal
*SIGNAL signal=signal_resp
signal
Description signal_resp
TYPE
Signal standard type
CR
Current code rate
BANDWIDTH
Signal bandwidth
SR
Signal symbol rate
SP
Spectral inversion enabled (ON) or
disabled (OFF)
MODE
Measurement of the FFT in a COFDM
modulation
GI
Measurement of the guard interval
CONSTELLATION Constellation type
HIERARCHY
DVB-T hierarchy
COLOR
Type of colour coding
STANDARD
Analogue standard type
RATE
Field frequency
*SIGNAL signal=signal_config
signal
signal_config Description signal_config
TYPE
DVB-T
Terrestrial signal standard
DVB-C
Cable signal standard
ANALOG
Analogue signal standard
DVB-S
Satellite signal standard
DVB-S2
Satellite signal standard
(2d generation)
COLOR
PAL
PAL coding colour
NTSC
NTSC coding colour
SECAM
SECAM coding colour
STANDARD
BG
Analogue standard type BG
Analogue standard type DK
DK
Analogue standard type I
I
Analogue standard type N
N
Analogue standard type M
M
Analogue standard type L
L
July 2014
Name
Description
Configuration
SPECTRUM
It configures the span and/or the reference level
*SPECTRUM spectrum=spectrum_config
spectrum spectrum_config
Description spectrum_config
REF
nn.n
Value (nn.n) of the reference
level in units of the current
band
SPAN
nnnF
nnn= span value number
F= Order of magnitude for the
span.
F values:
<empty> = 1
K= 1 x 10 E3
M=1 x 10 E6
G=1 x 10 E9
Name
Description
Question
Response
TUNE
It provides/configures the frequency
*?TUNE
*TUNE BAND=band_resp FREQ= freq_resp
band_resp
Description band_resp
TER
Terrestrial band
SAT
Satellite band
Configuration
July 2014
freq_resp
Description freq_resp
nnnK
nnn=Number value for the frequency; K= (kHz)
*TUNE BAND= band_conf FREQ= freq_conf
band_conf
Description band_conf
TER
SAT
Terrestrial band
Satellite band
freq_conf
nnnF
Description freq_conf
nnn= Number value for the frequency
F= Order of magnitude for the frequency
F values:
<empty> = 1
K= 1 x 10 E3
M=1 x 10 E6
G=1 x 10 E9
51
Name
Description
Question
Response
Configuration
TUNE CH
It provides/configures the channel
*?TUNE CH
*TUNE BAND= band_resp PLAN=plan_ resp CH= ch_ resp
band_resp
Description band_resp
TER
It means that channel belongs to the terrestrial
SAT
band
It means that channel belongs to the satellite
band
plan_resp
Description plan_resp
xyz
Alphanumeric code that identifies the channel
plan
ch_resp
Description ch_resp
xyz
Alphanumeric code that identifies the channel
*TUNE ch_conf
ch_conf
Description ch_conf
CH=xyz
CH NEXT
CH PREV
Name
Description
Configuration
TUNE PLAN
It configures a channel plan
*TUNE PLAN= plan_conf
plan_conf Description plan_conf
xyz
Name
Description
Question
Response
Name
Description
Configuration
Alphanumeric code that identifies a channel plan
VER
It provides the version of the main software application
*?VER
*VER ver_resp
ver_resp Description ver_resp
x.yy.zzz
Alphanumeric code that identifies a version
VIDEO
It configures the video source
*VIDEO video= video_conf
video
video_conf Description video_conf
SOURCE
SYSTEM
52
“xyz” is an alphanumeric code that identifies a
channel
It increases +one channel
It decreases –one channel
INTERNAL
EXTERNAL
PAL_50 Hz
PAL_60 Hz
NTSC
SECAM
It
It
It
It
It
It
enables
enables
enables
enables
enables
enables
internal video source
external video source
the video system selected
the video system selected
the video system selected
the video system selected
July 2014
ANNEX 5
A5.1
A5.1.1
OP-002-PS: OPTICAL + 5 GHz RF AUXILIARY
INPUT OPTION
GENERAL
Description
This annex contains operating instructions for the next option:
OP-002-PS: Selective Optical Power Meter +
Optical to RF Selective Converter + 5 GHz RF Auxiliary Input.
The evolution of the telecommunications market, more and more demanding in
quality standards, speed, services and so on and also economical and
competitiveness factors has changed the trend in telecommunications
installations, and increasingly, fibre-optics is being imposed on traditional ADSL
twisted-pair copper lines.
For this reason and in anticipation of an increase of fibre-optics installations, this
option has been developed. It is applicable to the HD RANGER 2 ISDB-T/TB
analysers and allows adapting it in order to work with fibre-optics networks.
This optical module expansion includes two separate functions: The selective
optical power meter and the selective optical to RF converter.
The selective meter option allows measurements on optical fibre networks, which
are necessary to certify an installation according to the parameters set by local
policies.
The optical to RF selective converter has a photosensor for each wavelength,
which obtains the RF signal carried by each one. With this module, user can
measure terrestrial or cable (up to 1 GHz) networks or optical LNB for satellite
antennas (up to 5.45 GHz), so that the installer does not need any additional
equipment to measure this type of installations.
The 5 GHz RF auxiliary option can be used among other applications for direct
connection to optical LNBs with 5.4 GHz output.
This expansion module is available for HD RANGER 2 ISDB-T/TB unit (both for
new equipments or to upgrade equipments owned).
July 2014
53
A5.2
DESCRIPTION OF INTERNAL OPERATION
The selective meter consists, in first place, of a selective triple filter for 1310,
1490 and 1550 nm signals. The filter separates each wavelength and each one
leads to an independent circuit with a photosensor, which obtains the RF signal
that it carries. Next, a circuit measures the optical signal power received by the
photosensor. The RF signal obtained for each wavelength goes to a band switch.
The band switch receives a signal and converts it to a frequency within the RF
band (65 — 2150 MHz). In the case of a terrestrial/cable signal the signal is not
converted since that signal is within the RF range.
After the conversion, the RF signal output is connected to the analyser input
connector and the measurement is performed in the usual way to an RF signal.
In the conversion, bear in mind that for every unit of optical attenuation
(one dB), occurs two dBs of power loss in RF. As an example, every 3 dB of
optical attenuation for each splitter are equivalent to 6 dB of power loss for RF.
The following diagram explains graphically how works the module:
Figure A5.1.
54
July 2014
A5.3
A5.3.1
Fibre optical test
Description
The optical function of this module allows the user to certify a telecommunication
installation by calibrating the signals at the installation and then measuring them
in each of the user access points.
The HD RANGER 2 ISDB-T/TB with optical module can measure
simultaneously and in a selective way the three wavelengths used in optical fibre
(1310, 1490 and 1550 nm). It has a selective receiver with a filter for each band
that makes a real and very stable measurement of each wavelength. With this
feature, user will be able to certify any installation according to the
telecommunications infrastructure policies.
A5.3.2
Operation
To access the FIBRE OPTIC TEST tool:
Connect the optical input signal to the optical input of the
equipment.
Enter the MEASUREMENT or SPECTRUM mode.
Press the TOOLS key
.
Select the FIBRE OPTIC TEST option.
It appears the screen to perform the FIBRE OPTIC TEST on the
signal.
Figure A5.2.
July 2014
55
Next it is shown the screen to perform the fibre optic test:
Figure A5.3.
Status message depending on the level of attenuation.
Power level of the signal.
Wavelength of the signal (nm).
Power level of the reference signal, which is used to calibrate and
calculate the attenuation level (dBm).
Power level of the test signal at the user's access point (dBm).
Attenuation level (dB); Attenuation = Current - Reference.
"Advanced" key to access these options: Threshold attenuation and
Max. attenuation (see Max. dashed line).
"Exit" button to exit the screen.
"Set Reference" key to calibrate the reference signal.
56
July 2014
Menu options
A5.3.3
On the bottom of the screen there are three menus accessible via the function
keys.
It exits the tool.
When pressing this key it uses the current values of
power as a reference values.
It accesses the Advanced menu.
In the Advanced menu there are two parameters to configure the fibre optical
test. They are:
► Threshold Attenuation:
It defines the maximum difference that can exist between the reference signal
with the highest power level and the reference signal with the lowest power
level. Any signal out of this range will be deleted and not used as a reference
signal during the measurement process.
► Max. Attenuation:
It defines the attenuation level used by the field meter to display the status
message on screen. If the attenuation level is below this value the status
message will be "PASS" and if it is above this value the status message will
be "FAIL".
A5.3.4
Example of a practical application in order to
installation by using the HD RANGER 2 ISDB-T/TB
certify
an
Next there is a step by step example to certify a telecommunication installation
of optical fibre by using the HD RANGER 2 ISDB-T/TB optical module.
To make the required certification it is necessary:
HD RANGER 2 ISDB-T/TB with the optical module.
A signal generator of the three wavelengths used in fibre optical
installations in order to calibrate and measure (PROLITE-105).
A pigtail with a FC to SC adapter.
July 2014
57
► Step 1. Capturing reference measurements.
Connect the SC pigtail end connector to the PROLITE-105 output
connector.
Connect the FC end of the pigtail to the optical input of the
HD RANGER 2 ISDB-T/TB (see figure below).
Turn on the PROLITE-105 and the HD RANGER 2 ISDB-T/TB.
In the HD RANGER 2 ISDB-T/TB, from the SPECTRUM or
MEASUREMENT screen, press
key to access the Tools menu.
Select the FIBRE OPTIC TEST option and press the joystick.
In the PROLITE-105, press once the SEQ
key to select the
SIMULTANEOUS mode. This mode simultaneously sends three
wavelengths signals.
In the HD RANGER 2 ISDB-T/TB, press the
key Set Reference.
All current values are captured, which will be used as reference values.
Now, user can proceed to Stage 2 in order to measure the attenuation
at each user's access point.
Figure A5.4.
58
July 2014
► Step 2. Attenuation Test Measurement.
Connect the PROLITE-105 in a source node of the transmission
optical network, for example in a free strip of the main
telecommunications cabinet of the building.
Keep the PROLITE-105 in simultaneous mode for generating signals,
so it SIMULTANEOUSLY generates all three wavelengths (1310 nm,
1490 nm and 1550 nm).
Connect the HD RANGER 2 ISDB-T/TB to a receiving node of the
optical network that is going to be measured, such as for example in a
UAP (User Access Point).
Using the HD RANGER 2 ISDB-T/TB, check measurements on the
FIBRE OPTIC TEST screen.
Figure A5.5.
July 2014
59
A5.4
A5.4.1
Selective optical to RF converter
Description
The selective optical to RF converter has a filter that separates each wavelength
and directs it to an independent circuit with a photosensor, which obtains the RF
signal that carries. The RF signal obtained for each wavelength passes to a band
switch.
The band switch receives a signal and converts it to a frequency within the RF
band (65 — 2150 MHz). In the case of a terrestrial / cable signal the signal is not
converted since that signal is within the RF range. After the conversion, the RF
signal output is connected to the analyser input connector and the measurement
is performed in the usual way to an RF signal. In the conversion, bear in mind
that for every unit of optical attenuation (one dB), occurs two dBs of power loss
in RF. As an example, every 3 dB of optical attenuation for each splitter are
equivalent to 6 dB of power loss for RF.
60
July 2014
A5.4.2
Operation
Signal connection to use this option is as follows:
Figure A5.6. Upper panel of HD RANGER 2 ISDB-T/TB (with this option installed).
Pigtail adapter (supplied with the module) with input optical signal.
Cable (supplied with this expansion module) with RF signal.
FC—APC input connector for optical signal.
Output BNC connector for the RF signal converted from optical.
Universal Connector for F/F or F/BNC adapter input for RF signal (coming
from the optical conversion).
July 2014
61
A5.4.3
Configuration
After the connection is made, the user can use the equipment for measurement
of optical signals as if they were RF signals. Steps to measure a signal are as
follows:
Press the Settings
key and select the corresponding band, whether
terrestrial (for optical link) or satellite (for optical LNB). In the case of
a satellite optical signal and frequency tuning, user has to select the
signal type, characterized by the band (low/high) and the type of
polarization (vertical/horizontal). In the case of a satellite optical
signal and channel tuning, the parameters are defined by the channel
(refer to the Settings menu section for more details).
Select the Optical module option and press the joystick.
It appears a window to enable the optical module and to configure
additional parameters.
Select Enable.
At the top right area of the screen appears the OPT icon meaning
there is external power.
It appears a window with some setting parameters.
Figure A5.7.
In this window appears the level power for each wavelength and also the user
can set two parameters:
► Wavelength:
Wavelength selection at the RF output by the user among the three
wavelength available: 1310, 1490 and 1550 nm.
► Attenuator:
When the attenuator is ON is 15 dB RF attenuation. When the attenuator is
OFF is 0 dB RF attenuation. The attenuator must be adapted to the installation
according to the RF power (modulation index).
Also, on the right side appears the selective power in dBm for each wavelength.
62
July 2014
A5.5
A5.5.1
5 GHz RF Auxiliary Input
Description
The HD RANGER 2 ISDB-T/TB optical fibre option comes along with a 5 GHz
RF auxiliary input which can be used among other applications for direct
connection to optical LNBs with 5.4 GHz output. This RF input covers three
bands:
A5.5.2
Band I
From 2150 MHz to 3000 MHz
Band II
From 3400 MHz to 4400 MHz
Band III
From 4400 MHz to 5400 MHz
Operation
Figure A5.8.
SMA Connector (RF aux. input signal).
July 2014
63
A5.5.3
Configuration
The user can use the equipment for direct connection to optical LNB with 5.4 GHz
output. Steps to measure it are as follows:
Figure A5.9a.
64
July 2014
Figure A5.9b.
∗
Band 1: 2150 - 3000 MHz; Band 2: 3400 - 4400 MHz; Band 3: 4400 - 5400 MHz.
July 2014
65
A5.5.4
Screen Description
Figure A5.10.
RF Aux. Input Signal Power.
Auxiliary Frequency Input.
Input Signal Frequency.
LNB Optical Power Level.
RF Auxiliary Input Enabled.
Center Frequency.
66
July 2014
ANNEX 6
A6.1
A6.1.1
OP-002-GPS: SIGNAL COVERAGE OPTION
GENERAL
Description
This annex contains operating instructions for the next option:
OP-002-GPS:
Signal coverage
ISDB-T/TB
analysis
with
GPS
for
HD RANGER 2
This option allows the user to check signal coverage by measuring its power,
MER and C/N. The position where all these measurements are taken is
determined by a GPS receiver. All this data, measurements and GPS position can
be downloaded to a PC and exported to a file for later analysis.
Please, read the user's manual of the equipment for detailed information about
general operation, specifications and other data.
July 2014
67
A6.2
A6.2.1
Signal Coverage Analysis
Operation
The Signal Coverage tool is available for all signals.
Connect the GPS receiver to the equipment.
In Settings menu
select the terrestrial band.
Access the SPECTRUM mode and tune the signal for coverage study.
Press the Tools key
.
Select the Signal Coverage option.
The Signal Coverage function appears on screen.
Before starting the signal coverage analysis, access the Configuration
option in the Advanced menu
section).
for settings (more details in next
After settings, access the Advanced menu
start the signal coverage analysis.
and press on Start to
In Automatic mode, the equipment takes samples automatically
according to settings (see next section). In Manual mode each time the
user presses the joystick the equipment takes a sample. Measurement
are linked to the GPS reference.
Access the Advanced menu
and press on Stop to finish the signal
coverage analysis. Data obtained is automatically stored.
Access the data by pressing the Installation List key
to check that
the monitoring data file has been saved. This file is a "Data Capture"
type. To manage the data, see below the section "Data File Processing".
68
July 2014
Settings
A6.2.2
User can adjust some parameters on the Signal Coverage analysis:
Figure A6.1.
► File name:
User can give a name to the file where data is saved. All measurement that
can be seen in the MEASUREMENT 1/3 screen (frequency, power/level, C/N,
MER, CBER, LBER and LM) will be stored on the data file. Be sure to change
the file name when starting a new Signal coverage analysis. If not, new data
file will be saved on the last one.
► Comment:
User can write some comments about the study.
► Mode:
There are two options: Continuous or Manual. In continuous mode a
sample is taken automatically every sample time. In manual mode a sample is
taken every time that user presses the joystick.
► Sample Time:
Time between acquisitions. Only when working in continuous mode. Minimum
time is 1 second.
► Span time:
It is the width, in time, shown on screen for the X axis.
► Save to:
There are two options: Internal or USB. For Internal option it saves the file
with all data in the internal memory of the equipment. For USB option it saves
the file with all data in a USB flashdrive connected to the micro-USB port of
the equipment.
July 2014
69
A6.2.3
Description of signal coverage screen
The following describes the Signal Coverage screen:
Figure A6.2.
Selected installation; date and time.
Spectrum.
Power measurement over time (shows span time).
MER and C/N measurement over time (shows span time).
Signal coverage started.
LNB, Selected band; battery level.
Signal information window 1:
Frecuency: frequency at which signal is locked; TS Hierarchy (table
hierarchy at the transport stream) TS Priority (packet priority at the
transport stream).
Signal information window 2:
Power, C/N, MER measurements of the signal over time. It shows on
screen only the span time selected in settings.
70
July 2014
Signal information window 3:
Elapsed: Time elapsed since the beginning of the coverage study.
Samples: Samples taken since the beginning of the coverage study.
Space left: Space left in the memory to save data.
GPS status: It shows if the GPS receiver is locked or unlocked.
Latitude, Longitude: It shows the latitude and longitude at the current
position, if GPS is locked. Measurement are linked to the GPS position.
A6.2.4
Menu Options
At the bottom of the screen there are four menus available via the function keys.
It displays the channel/frequency where is pointing
the cursor and access the tuning menu.
It displays the selected transmission standard menu
and accesses the signal parameters.
It displays the Tools menu.
It displays the Advanced menu.
In the Advanced menu there are some options for the Signal Coverage. They
are:
► Start: It starts the signal coverage study.
► Stop: It stops the signal coverage study.
► Configuration: It shows the settings window with some parameters.
July 2014
71
► GPS Status: It shows a list and a graph with satellites detected to locate the
GPS signal. It is also provided additional data such as longitude, latitude, date
and universal time, visible satellites and GPS status (locked or not).
Figure A6.3.
A6.3
A6.3.1
Data File Processing
Description
This document is an explanation about the process that is needed to be done in
order to obtain a more comfortable view of the XML data obtained with
HD RANGER family equipment, with GPS option, when doing a Signal Coverage
analysis.
Once you got the coverage data, copy the XML data file from the equipment to a
USB memory using the Installation Manager. See the equipment’s documentation
in how to get files from an Installation.
A6.3.2
Obtaining an excel file
For this section, you must have at least Excel 2003 or newer version. Excel 2007
(or later) is highly recommended to avoid macro problems.
First of all we need to locate the XML data file in the folder from which we
want to work. There are no requirements needed to be satisfied. A file
named COVERAGE.XSL must be placed in the same data file folder. That
second file allows proper data formatting when processed by Excel.
Select the XML data file and then right click with the mouse button on the
file name.
72
July 2014
Choose the option “Open with” and then select Excel 2007 (or the
available version)
Figure A6.4.
When Excel tries to open the file it will ask you the import method to
open the XML data file by this way:
Figure A6.5.
July 2014
73
You must choose the option in which a stylesheet is asked. It will appear
as an option the “COVERAGE.xsl” file.
Figure A6.6.
Now Excel is opening the XML data file using the format that the XSL file
is providing. This step could take few seconds depending on the size of
the XML data file.
At this point, you should have an excel file with three different sheets.
Each sheet corresponds to a different view of the same data:
3
The first one will show you the generic signal information and the
different coverage measures for each point acquired.
3
In the second one, you will find the same data but presented in a
table format, more user friendly for working with graphs based on
each measured parameter.
3
The third one provides data in a format adapted for geolocation.
Information is shown in terms of parameters required for presenting
the measured data as a map layer (latitude, longitude, id, description
and an icon identifier number) as required for GIS and Google Earth
technologies. This third sheet is formatted mainly to be compatible
with main Google Earth format converters available in Internet.
Now save the data as a true excel file. No specific name or path is
required, but you must remember the path.
74
July 2014
A6.3.3
Presenting measurements in Google Earth
For this process Google Earth must be installed on the computer and internet
connection will be needed.
Open a web browser and then search for a converter from Excel file to
KML file, for instance, googling “excel to kml” (a kind of XML file used by
Google Earth) We propose this one (and this is the one we will explain in
detail in the following example explanation).
Navigate to: http://www.earthpoint.us/ExcelToKml.aspx
Figure A6.7.
July 2014
75
Click on the BROWSE icon:
Figure A6.8.
A new window will appear in which you will be able to search the Excel
file you saved in the step number 9 of the previous section of this
document.
Figure A6.9.
After doing the file selection click on the option VIEW ON GOOGLE
EARTH:
Figure A6.10.
76
July 2014
The web page will perform the file conversion and then will ask if you
want to save the resulting file or just open it using Google Earth
software. Select OPEN WITH Google Earth.
Figure A6.11.
Google Earth will try to open the three different excel sheet explained
before in this document (see step 8 from Excel opening process for XML
data file in the previous section of this document). The first one is not
using the format that the converter is expecting and will generate an
error. The second and the third one will represent the coverage
measurement points, but only the third one will be with the really suitable
format.
Figure A6.12.
July 2014
77
Disable the first and the second sheets for a more comfortable view, and
click over the third one.
Figure A6.13.
The yellow flag symbol mark the first and the last coverage measure
point. The other measurement points will be presented as a C symbol.
Figure A6.14.
Every point will show the POWER and MER measurements, when
selected.
Figure A6.15.
Finally, the KML file generated with the procedure described here can be
used directly with most of the GIS tools, to import such data into a layer
over a GIS map.
78
July 2014
ANNEX 7
A7.1
OP-002-DAB: DAB/DAB+ OPTION
Description
This annex contains instructions for the following option:
OP-002-DAB: DAB/DAB+ signal analysis.
This option allows the user to detect, measure, analyse and visualise digital radio
DAB and DAB+ .
The DAB (Digital Audio Broadcasting) is a digital radio standard, designed for
both home and portable receivers to broadcast terrestrial and satellite audio and
also data. It works with Band III and L-Band frequencies.
The DAB+ is an evolution of DAB using the AAC + audio codec. It also includes
Reed-Solomon error correction, which makes it more robust. DAB receivers are
not compatible with DAB+ receivers.
A7.2
Operation
Connect the RF input signal to the equipment.
Select the frequency band (terrestrial or satellite) by means of the
“Settings”
menu.
Access the MEASUREMENT, SPECTRUM ANALYSER or TV MODE by
pressing the corresponding key.
Lock the DAB/DAB+ signal.
If you want to enable auto-detection function for DAB/DAB+, go to
key for 1 second and in the Stealth -ID
"Preferences” by pressing the
tab select the DAB/DAB+ option.
July 2014
79
A7.3
MEASUREMENT Mode
Views for DAB/DAB+ signal in MEASUREMENT mode are:
Figure A7 1. Measurement 1/3
Figure A7 2. Measurement 2/3
Figure A7 3. Measurement 3/3
80
July 2014
A7.4
SPECTRUM ANALYSER Mode
Views for DAB/DAB+ signal in MEASUREMENT mode are:
Figure A7 4. Spectrum 1/3
Figure A7 5. Spectrum 1/3
Figure A7 6. Spectrum 1/3
July 2014
81
A7.5
TV Mode
Views for DAB/DAB+ signal in TV mode are:
Figure A7 7. TV 1/3
Figure A7 8. TV 2/3
Figure A7 9. TV 3/3
82
July 2014
ANNEX 8
MULTIMEDIA CONTENT
Next it is the list with all the links of the multimedia content in the user's
manual:
TITLE
LINK
Introducing the HD RANGER Series
http://youtu.be/XpNxlOSfkf0
Introducing the HD RANGER 2
http://youtu.be/dl11jXoi_FQ
Navigating through the menus
http://youtu.be/Zm_QT-_qtY4
Switching satellite/terrestrial bands
http://youtu.be/ecv1P0Cf_fI
Manual input of frequencies
http://youtu.be/81l5ezO4cgg
DVB-S2 multi stream decoding
http://youtu.be/xuv9ESed_Ak
What is LTE?
http://youtu.be/ZNPeDC4K-YI
Datalogger
http://youtu.be/TUuHJBX0BQI?t=3m55s
Channel plan exploration
http://youtu.be/TUuHJBX0BQI?t=2m54s
Installation manager
http://youtu.be/TUuHJBX0BQI
Generating a measurement report
http://youtu.be/fQP8n-59pHc
Creation of a channel plan
http://youtu.be/YwbpfRNGJYI
July 2014
83
PROMAX ELECTRONICA, S. L.
99 Washington Street
Melrose, MA 02176
Phone 781-665-1400
Toll Free 1-800-517-8431
Visit us at www.TestEquipmentDepot.com