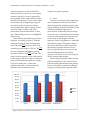
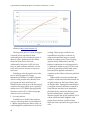
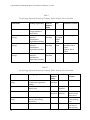
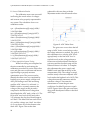
1
CpE 190/EEE 193A Senior Design Instructor: Prof. Tatro DC Microgrid May 5, 2014 Team 5: Tanya Konrad William Loria Troy Miller Matthew Yamasaki CpE190/EEE193A SENIOR PROJECT CSUS PROF. TATRO MAY 5th, 2014 Table of Contents I. Introduction ............................................................................................................................................................................. 1 II. Problem Statement Fully Explored ....................................................................................................................................... 2 A. History ............................................................................................................................................................. 2 B. Current Efforts and Obstacles .......................................................................................................................... 3 C. Microgrid In TICC, Uganda ............................................................................................................................. 3 III. Design Idea Contract .......................................................................................................................................................... 6 A. Overview ......................................................................................................................................................... 6 B. Elevator Pitch...................................................................................................................................................... 6 C. Societal Problem & Research Motivation ....................................................................................................... 6 D. Project Uniquity ............................................................................................................................................. 8 E. Other Approaches .............................................................................................................................................. 8 F. Team Members’ Skill set ................................................................................................................................... 8 G. Technology Use .................................................................................................................................................. 9 H. IV. Feature Set ........................................................................................................................................................................... 9 A. V. Other Possible Design Options .................................................................................................................... 9 Laboratory Prototype .................................................................................................................................... 9 Laboratory Prototype Resources and Project Funding .................................................................................................... 10 A. Required resources ...................................................................................................................................... 10 B. Laboratory Prototype Funding ...................................................................................................................... 10 C. Deployable Prototype Funding...................................................................................................................... 11 D. Final Prototype visual ................................................................................................................................. 11 VI. Laboratory Prototype Project Schedule and Milestone ............................................................................................... 11 VII. Laboratory Prototype Project Work Breakdown Structure ........................................................................................ 16 E. Preface ............................................................................................................................................................... 16 F. Local Generation .............................................................................................................................................. 16 G. Power Conditioning and flow........................................................................................................................ 17 H. i Power Electronics......................................................................................................................................... 18 I. Controls ............................................................................................................................................................. 18 J. Energy Storage ................................................................................................................................................. 18 CpE190/EEE193A SENIOR PROJECT CSUS PROF. TATRO MAY 5th, 2014 K. Loads.................................................................................................................................................................. 19 L. Energy Data and Management ...................................................................................................................... 20 M. Project Management .................................................................................................................................... 21 N. Total Hours Worked .................................................................................................................................... 23 VIII. Laboratory Prototype Risk Management for WBS....................................................................................................... 23 A. Laboratory Prototype .................................................................................................................................. 24 B. Deployable Prototype...................................................................................................................................... 24 IX. Laboratory Prototype Task Assignments ...................................................................................................................... 25 A. Tanya Konrad Tasks .................................................................................................................................... 25 B. William Loria Tasks ......................................................................................................................................... 25 C. Troy Miller Tasks ............................................................................................................................................. 26 D. Matthew Yamasaki Tasks ........................................................................................................................... 27 X. Creation of the Deployable Prototype................................................................................................................................ 28 A. Deployable Prototype Funding.................................................................................................................. 29 B. Project Publicity and Fundraising ................................................................................................................. 29 XI. Deployable Prototype Project Schedule and Milestones ............................................................................................. 29 XII. Deployable Prototype work Breakdown Stucture ....................................................................................................... 34 A. System Improvement Tasks ....................................................................................................................... 34 B. Deployable Prototype Testing........................................................................................................................ 34 C. Project Publicity and Awareness ................................................................................................................... 34 D. Deployable Prototype WBS Task Hours................................................................................................... 34 XIII. Deployable Protoype Task Assignments....................................................................................................................... 35 A. Tanya Konrad ............................................................................................................................................... 35 B. William Loria .................................................................................................................................................... 36 C. Troy Miller ........................................................................................................................................................ 37 D. Matthew Yamasaki ...................................................................................................................................... 37 XIV. Deployable Prototype Risk Management...................................................................................................................... 38 A. Deployable Prototype.................................................................................................................................. 38 XV. ii Market Review .................................................................................................................................................................. 40 B. Electricity Market Size..................................................................................................................................... 40 C. Localized Market Size: Regional Trends, Climate, and Saturation .......................................................... 40 CpE190/EEE193A SENIOR PROJECT CSUS PROF. TATRO MAY 5th, 2014 1) Asia ................................................................................................................................................................ 41 2) Middle East ................................................................................................................................................... 42 3) Latin America ............................................................................................................................................... 42 4) Africa ............................................................................................................................................................. 43 D. Rural vs. Urban Disparity: The Renewable Microgrid Solution ........................................................... 44 E. Renewable Microgrids Can Help Rural Areas Gain Access To Electricity.............................................. 44 F. Secondary Markets .......................................................................................................................................... 46 G. Financing of Energy Access............................................................................................................................ 47 H. Organizations that Contract and Install Energy Expansion Projects ................................................... 48 I. Market Review Wrap-up ................................................................................................................................ 50 XVI. User Manual ...................................................................................................................................................................... 50 A. Hardware Setup and Wiring ...................................................................................................................... 51 B. Electrical Equipment Connection .................................................................................................................. 52 C. Charging Switch............................................................................................................................................... 52 D. Maximum Power Point Tracking .............................................................................................................. 52 E. Critical Electrical Equipment ......................................................................................................................... 52 F. Non-Critical Electrical Equipment ................................................................................................................ 52 G. Software Setup ................................................................................................................................................. 52 H. Connecting to the Energy Monitor Server ............................................................................................... 53 5) Viewing Dashboard ..................................................................................................................................... 53 6) Viewing Data from Voltage and Current Sensors................................................................................... 53 7) Connecting to PhpMyAdmin ..................................................................................................................... 54 8) Demand Response Scripts .......................................................................................................................... 55 9) Microcontroller Software ............................................................................................................................ 55 10) XVII. I. XVIII. iii Troubleshooting – Rebuild from scratch .............................................................................................. 55 Design Concept Simulation ........................................................................................................................................ 55 Design Modifications ...................................................................................................................................... 56 Hardware ...................................................................................................................................................................... 57 A. Conceptual Design Plan .............................................................................................................................. 57 B. Laboratory Prototype General Power Flow Overview............................................................................... 58 CpE190/EEE193A SENIOR PROJECT CSUS PROF. TATRO MAY 5th, 2014 C. Hardware .......................................................................................................................................................... 59 1) Solar Panel .................................................................................................................................................... 60 2) Power Conversion Electronics ................................................................................................................... 60 XIX. Software ............................................................................................................................................................................. 65 A. Deployable Prototype General Energy Management Overview .......................................................... 65 B. Software System Overview ............................................................................................................................ 65 C. Microcontrollers ............................................................................................................................................... 66 D. Embedded Computer System .................................................................................................................... 66 E. Web Server and Database ............................................................................................................................... 67 F. DAC Algorithms .............................................................................................................................................. 67 G. Energy Management Algorithms .................................................................................................................. 68 1) Energy Generation Until Next Sunlight ................................................................................................... 68 2) Energy Available from our Battery ........................................................................................................... 69 3) Energy Consumption Until Next Sunlight ............................................................................................... 69 4) Demand Response ....................................................................................................................................... 70 H. Software Improvements.............................................................................................................................. 71 XX. Mechanical Design of Deployable Prototype ............................................................................................................... 71 XXI. Deployable Prototype Hardware Test Plan .................................................................................................................. 73 A. 1) TICC Load Profile ........................................................................................................................................ 73 2) Ugandian Weather Patterns ....................................................................................................................... 73 3) Testing Feature Set List ............................................................................................................................... 74 B. Test Plan Structure for Microgrid System .................................................................................................... 75 C. Individual Component Simulations .............................................................................................................. 75 D. Isolated Component Testing ...................................................................................................................... 77 4) Full System Experimental Testing ............................................................................................................. 80 5) Upgraded System Testing .......................................................................................................................... 81 6) Test Plan Time Frame and Resources Needed ........................................................................................ 82 E. Device Testing Results .................................................................................................................................... 82 1) iv Deesign Element and Testing Purpose and Considerations................................................................. 73 PV Characterization Testing....................................................................................................................... 82 CpE190/EEE193A SENIOR PROJECT CSUS PROF. TATRO MAY 5th, 2014 2) Buck Converter/Charge Controller Testing ............................................................................................. 88 3) MPPT Testing ............................................................................................................................................... 89 F. Complete System Testing ............................................................................................................................... 90 1) Sensor Measurement Setup ........................................................................................................................ 90 2) Sensor Measurement Hardwareand Results............................................................................................ 91 G. Complete System Test Results ....................................................................................................................... 92 H. Revisions Resulting from Testing .............................................................................................................. 92 1) Current Block Diode .................................................................................................................................... 92 2) Measurements .............................................................................................................................................. 93 XXII. Software Test Plan ........................................................................................................................................................ 93 A. Sensor Data Calibration .............................................................................................................................. 93 B. Sensor Calibration Results .............................................................................................................................. 94 C. Data Acquisition System Testing................................................................................................................... 94 D. Demand Response Test Plan ...................................................................................................................... 95 E. Demand Response Test Bench Code ............................................................................................................. 95 F. Demand Response Test Bench Results ......................................................................................................... 95 G. Content Management System Input Testing ............................................................................................... 96 H. Whole System Software Testing ................................................................................................................ 96 I. Embedded systems .......................................................................................................................................... 96 J. Database ............................................................................................................................................................ 97 K. Graphical User Interface ................................................................................................................................. 97 L. Time Zone Syncronization.............................................................................................................................. 98 M. Revisions to Software Testing .................................................................................................................... 98 XXIII. Conclusion................................................................................................................................................................... 100 References ..................................................................................................................................................................................... 102 Glossary ........................................................................................................................................................................................ 103 Appendix ...................................................................................................................................................................................... 104 A. .............................................................................................................................................................................. 104 B. ............................................................................................................................................................................... 105 C. .............................................................................................................................................................................. 109 v CpE190/EEE193A SENIOR PROJECT CSUS PROF. TATRO MAY 5th, 2014 Table of Figures Figure 1: Toggo International Children’s Center in Toggo Village Uganda ......................................................... 4 Figure 2: Typical Living Quarters in Toggo, Uganda ............................................................................................... 4 Figure 3: Troy in Uganda Africa with TICC Children .............................................................................................. 5 Figure 4: Shop in Kampala selling solar panels ......................................................................................................... 5 Figure 5: Initial Projected Block Diagram of DC Microgrid .................................................................................... 7 Figure 6: Project Timeline with Milestones and Other Significant Events for Fall 2013 .................................... 12 Figure 7: Project Timeline with Milestones and Other Significant Events for Fall 2013 .................................... 13 Figure 8: Project Timeline with Milestones and Other Significant Events for Fall 2013 .................................... 14 Figure 9: Project Timeline with Milestones and Other Significant Events for Fall 2013 .................................... 15 Figure 10: Project Team Members with Pastor Steve Trint .................................................................................... 16 Figure 11: Renewable Generation WBS Flow .......................................................................................................... 17 Figure 12: WBS Flow Diagram of the Power Conditioning and Flow Stage ....................................................... 18 Figure 13: WBS Flow of the Energy Storage Stage .................................................................................................. 20 Figure 14: WBS of the Loads Stage ............................................................................................................................ 20 Figure 15: Energy Data and Management WBS Flow ............................................................................................ 21 Figure 16: Project Management WBS Flow .............................................................................................................. 22 Figure 17: Breakdown of total man hours worked and by WBS block ................................................................ 23 Figure 18: Project Timeline with Milestones and Other Significant Events for Spring 2014 ............................ 30 Figure 19: Project Timeline with Milestones and Other Significant Events for Spring 2014 ............................ 31 Figure 20: Project Timeline with Milestones and Other Significant Events for Spring 2014 ............................ 32 Figure 21: Project Timeline with Milestones and Other Significant Events for Spring 2014 ............................ 33 Figure 22: Task Hours for Spring 2014 ..................................................................................................................... 35 Figure 23: Population without access to energy from 2002 through 2008 ........................................................... 40 Figure 24: Average global solar energy produced throughout the year.............................................................. 42 Figure 25: Rural vs urban electrification rates ......................................................................................................... 43 Figure 26: Cost per kilometer to expand grid in selected countries ..................................................................... 45 Figure 27: Cost over time of PV microgrids and Diesel microgrids. .................................................................... 46 Figure 28: Hardware Wiring ...................................................................................................................................... 52 Figure 29: Energy Monitor Login Screen .................................................................................................................. 53 Figure 30: Energy Monitor Dashboard ..................................................................................................................... 53 Figure 31: PuTTY Configuration ............................................................................................................................... 54 Figure 32: Load Support Simulation with Diode Reverse Biased ......................................................................... 55 Figure 33: Load Support Simulation with PV @ Max. Power ................................................................................ 56 Figure 34: Load Support Simulation with Battery Supply..................................................................................... 56 Figure 35: Block Diagram of Microgrid Power Flow .............................................................................................. 58 Figure 36: Hardware Block Diagram Model ............................................................................................................ 60 Figure 37: 100 Watt Ramsond solar panel installed on laboratory prototype..................................................... 60 Figure 38: DROK Buck circuit used in laboratory prototype ................................................................................ 61 Figure 39: Buck Regulator interfaced with Disconnect Switch (in on position) ................................................. 62 Figure 40: DROK Boost circuit used in laboratory prototype ............................................................................... 62 Figure 41: Boost Regulator installed on prototype and interfaced with diodes ................................................. 63 Figure 42: Sealed Lead Acid Battery and Variable Power Resistors .................................................................... 64 vi CpE190/EEE193A SENIOR PROJECT CSUS PROF. TATRO MAY 5th, 2014 Figure 43: Laboratory Prototype, Angled sideview ................................................................................................ 65 Figure 44: Laboratory Prototype; Front view .......................................................................................................... 65 Figure 45: Python Code Calibration and Storage Flow Chart ............................................................................... 66 Figure 46: Demand Response Flow Chart ................................................................................................................ 67 Figure 47: Data Acquisition Flow Chart ................................................................................................................... 68 Figure 48: Pseudo Code for Energy Generation ...................................................................................................... 69 Figure 49: Pseudo Code for Energy Consumption Until Next Sunlight Algorithm .......................................... 70 Figure 50: Pseudo Code for Demand Response ...................................................................................................... 71 Figure 51: Side View of Solar Panel Structure ......................................................................................................... 72 Figure 52: Back Side View of Solar Panel Structure ................................................................................................ 72 Figure 53: Front view of the new load cabinet......................................................................................................... 72 Figure 54: Side view of load cabinet.......................................................................................................................... 73 Figure 55: Solar Irradiance for February 21st in the Anatolia Housing Division in Rancho Cordova .......... 83 Figure 56: Solar Irradiance for February 21st in the Anatolia Housing Division in Rancho Cordova ............ 83 Figure 57: PV Generation Capture February 21 and 22, 2014 ................................................................................ 84 Figure 58: Ramsond 100W Mono-Crystalline Measured I-V Characteristics ...................................................... 85 Figure 59: Ramsond 100W Mono-Crystalline Power Output versus Panel Voltage .......................................... 86 Figure 60: Ramsond 100W Mono-Crystalline Power Output versus Load Impedance .................................... 87 Figure 61: Data collected from diurnal testing of 100 watt rapid prototype on March 12th 2014 ................... 90 Figure 62: Block Diagram of Microgrid Power Flow .............................................................................................. 93 Figure 63: ADC Offset Error ....................................................................................................................................... 94 Figure 64: Offset and Gain Error ............................................................................................................................... 95 Figure 65: Quantization Error .................................................................................................................................... 95 Figure 66: PV System ................................................................................................................................................... 97 Figure 67: Battery Data ................................................................................................................................................ 97 Figure 68: Bus Voltage and Battery State of Charge ............................................................................................... 98 Figure 69: Critical and Non-Critical Currents ......................................................................................................... 98 vii CpE190/EEE193A SENIOR PROJECT CSUS PROF. TATRO MAY 5th, 2014 List of Tables I List of Energy Expansion Projects .......................................................................................................................... 49 II List of Energy Expansion Projects ........................................................................................................................ 49 III Ramsond Solar Panel Characteristics .................................................................................................................. 60 IV DROK Buck Converter Specifications ................................................................................................................ 61 V DROK 150 Watt Boost Regulator Specifications ................................................................................................. 62 VI Test Plan Timeline ................................................................................................................................................. 82 VII Buck Converter/Charge Control Test Results ......................................................................................................... 89 viii CpE190/EEE193A SENIOR PROJECT CSUS PROF. TATRO MAY 5th, 2014 DC Microgrid – Team 5 William A. Loria, Troy Miller, Tanya Konrad and Matthew T. Yamasaki Electrical and Electronic Engineering-College of Engineering and Computer Science California State University, Sacramento Email: [email protected], [email protected], [email protected], [email protected] Abstract— World Poverty has been a well-documented societal problem. While no known one-fix solution exists, studies have shown a strong link between energy access and level of poverty. There is also a direct correlation between education and overcoming poverty. The village of Toggo in Uganda, Africa is just one case struggling with poverty. The majority of the issues villagers there face stems from a lack of reliable local power. This paper discusses in detail how we have developed a DC microgrid reference design that will aid Toggo International Children’s Center in their quest for education by providing reliable electricity generation. This microgrid has several distinguishable features which include PV generation, maximum power point tracking, energy storage, battery charging ability, and transmittable power flow throughout the system all complete with an optimized and robust energy management system. Each of these features have been fully vetted and tested under appropriate conditions for use in Uganda, Africa. This reference design will aid in the solution to world poverty by providing reliable power to enable the betterment of education, health and wellness. Keywords—Microgrid, Controls, Photovoltaic, PV, Solar, Energy Storage, Maximum Power Point Tracking, Energy Management, Inverter, Load Control I. INTRODUCTION Thanks to Troy Miller and Tanya Konrad’s affiliation with Bridgeway Christian Church, we’ve been blessed with having a senior design project that not only suits our interests, but maintains uniqueness in having a specific clientele in mind. The church pastor has been organizing and performing missionary work in Toggo, Uganda through their non-profit affiliate, Yaaka Afrika. Currently, they have established the Toggo International Children’s Center, which educates over 800 children and houses roughly 200 of them. Poverty is a well-known societal problem that extends globally and Toggo, Uganda is just one such instance of being clutched by this problem. Research shows a direct correlation between lack of 1 education and poverty. It is our belief that providing reliable means of electricity and educating villagers on how the renewable power system works can provide them the opportunity to rise up out of poverty. Being that the Toggo International Children’s Center (TICC) has specific needs already in mind, we have specific system requirements that we must satisfy. One of the overbearing issues currently present in Toggo is the need to travel 5 or more miles to charge their cell phones. For many in the village, a cell phone is their lifeline—in some cases literally, but in others, it’s their link to earning a living. We have provided a reliable and regulated DC power output for this purpose. Reliable power for indoor LED lighting will provide the ability to read and study at night with the added benefit of increased health when compared to the oil burning lamps presently used. Concern was also expressed to power office equipment necessary in registering new children into the center. While these electrical loads are necessary, two others are far more critical— perimeter LED security lighting and refrigeration with freezer unit. The perimeter security lighting is needed for traveling to and from the Center at night and provides peace of mind. Malaria is one of the largest health concerns in Toggo. Relief from high fevers caused by Malaria can be provided from ice packs that need to be stored in a freezer. Cold chain medications are also critical in providing remedies to a number of combatable diseases. Maximized PV generation in a climate such as Toggo, Uganda is the best way to charge energy storing batteries while providing support for the electrical loads discussed. Monitoring CpE190/EEE193A SENIOR PROJECT CSUS PROF. TATRO MAY 5th, 2014 power flows and battery state of charge is paramount to our energy management scheme that allows for non-stop critical load support with 2 days of autonomy in mind. Initially, we had discussed the implementation of a water filtration system as a dispatchable load. After speaking with Pastor Steven Trint, an individual with appreciable knowledge of the on goings in the village of Toggo, we came to the conclusion that the current village water well is more than sufficient if we can continuously supply the well pump with the power it needs. II. PROBLEM STATEMENT FULLY EXPLORED In order to come up with an effective solution and design that would implement this solution, we first had to understand the problem. To achieve this goal, we spent a considerable amount of time researching poverty and its effects as well as how our design could help the villagers of Toggo cope with poverty. This was a theme that we revisited often throughout the two semesters that we were designing the Microgrid to make sure that our solution was in line with what TICC needed. The results of this are presented below. A. History Each day nearly 22,000 children die due to poverty. The World Bank defines poverty as people who live on $1.25 per day. There are approximately 1.4 billion people living in poverty. There are 2.5 billion people that are forced to depend on biomass for energy needs for cooking and lighting which results in indoor pollution; 4000 people die each day from this pollution [1]. These are just some of the travesties, but from these facts and stats it is clear that world poverty remains a large issue. There are strong links between impoverished nations and energy generation, or more accurately, the lack thereof. One way to reduce some of the world’s poverty is by implementing electricity generation in these countries that are underserved concerning energy generation. For most of us, electrical energy consumption is taken for granted; we walk into a room and it is second nature to reach for a light switch. We operate our laptops and other 2 electronics without caution and regard for the battery life because if we need to we can easily find an electrical outlet. However, for many populations this is not the reality. Nearly 25% of the world’s population does not have access to a stable electrical grid [2]. This lack of electricity has many repercussions including continued poverty, and contributes to the poor health of the inhabitants. Economic prosperity is often linked to electrical generation with increases in electricity generation indicating increased prosperity and electricity generation decline indicating recessions [3]. Electricity enables societies to move beyond poverty by enabling them to be more productive. For example, electricity can provide lighting that allows for extended work days and can be used to power transportation or agricultural equipment that will greatly increase sellable goods production. This allows for a society to move beyond a mere subsistence economy [4]. Furthermore, electricity can provide benefits to education which is a wellknown way to help decrease poverty [5]. Education can empower individuals by giving them technical skills which then can be used to increase income with new career possibilities. And, electricity can aid in this education by providing power for school equipment to operate, and lighting for studying and reading during hours in which the sun is not shining. Additionally, providing electricity can also aid in promoting a healthier life style for those who live in poverty without reliable electricity. Currently, many nations without electricity burn wood or oil for lighting and cooking. This can create many health issues due to the toxic gases that combust from these materials cause. These health issues can be mitigated by implementing electricity options for lighting and cooking. Furthermore, many medicines and vaccines that are used to cure or prevent diseases need to be refrigerated. Without electricity, these nations do not have access to readily available medicines. These medicines can be imported, but often spoil before they reach their destination. Electric refrigeration will allow these societies to keep the medicines in stock for when they are needed. CpE190/EEE193A SENIOR PROJECT CSUS PROF. TATRO MAY 5th, 2014 B. Current Efforts and Obstacles World poverty is not a new or recent problem; however, this issue is quickly becoming a major concern among world leading nations today. In fact, universal access to stable electricity was one of the UN’s top 5 priorities in 2012 and as a result created an initiative to reach this goal by 2030 [6]. This initiative has 3 main tasks: Ensure universal access to modern energy; double the rate of improvement in energy efficiency; and, double the share of renewable energy in the global portfolio. The UN has created the Energy Access Practitioner Network to bring together engineers from the private sector to develop solutions to obtain these goals. Individual efforts by developed countries to aid undeveloped countries in gaining access to electricity generation is already under way. Peru has recent launched its effort to install solar panels in rural areas of Contumaza in the region of Cajamarca. The goal here is to install 12,500 solar photovoltaic systems to be used by 500,000 households. This project will cost $200 million and is part of a larger plan to bring electricity to the 8 million people there who do not currently have electricity. The larger goal is to bring electricity access to 95% of its residents and will cost an estimated $3 billion [7]. Japan, China, and the United States have also launched projects to aid impoverished people of Africa in gaining access to electricity. Of the 1.4 billion people in poverty and without electricity, Africa has the densest population. Japan has begun an $ 18 million geothermal project in Kenya. The goal here is to have Kenya, which currently can supply electricity for 2 million people, supply electricity to 20 million people by 2020. Japan will assist Kenya in building the geothermal plants and transmission lines. Meanwhile, China is currently building a 400 MW hydropower plant in Ghana which will cost more than $400 million and the United States has pledged over 7 billion dollars for electricity generation to be built in 6 countries of Africa [8]. Political volatility notwithstanding, critics point to cost and further environmental damages as 3 deterrents for implementing electrical grids in Third World countries. Cost poses a major obstacle is implementing electricity generation in undeveloped countries. For example, two-thirds of Africa’s residents lack electricity and live at or below poverty and it is estimated that providing them with electricity generation will cost $300 billion dollars. Furthermore, all of the above projects in Africa are for large energy generation plans which would require expensive transmission lines through some dense areas and will even more expensive and difficult to implement, at best, in order to reach the rural areas of Africa. Critics of implementing electricity generation in undeveloped nations also argue that doing so would cause more heat-trapping gasses to be released into the atmosphere which would ultimately do the world more harm than good [9]. C. Microgrid In TICC, Uganda The micro grid concept is based off of many small local generation systems that are fully selfsufficient and would serve small villages or communities. Each village, or several combined villages, could install a renewable energy system that would serve their residents. This solution would solve 2 of the 3 main obstacles that impede the implementation of electricity generation in undeveloped countries. The upfront costs, at this time, would not be much less expensive. Micro grids really require energy storage in order to mitigate the intermittency that is inherent with renewable energy generation and batteries (the practical and obtainable energy storage) are still relatively expensive. Furthermore, in order to be as efficient as possible, these micro grids should be equipped with a robust and optimized energy management system. However, the small local systems of micro grids would circumvent the need to run transmission line through dense rural areas which could potentially save money in the long term, and the renewable energies would release minuscule amounts of heat-trapping gasses into the atmosphere. This is the solution that our team will attempt to implement in a small impoverished CpE190/EEE193A SENIOR PROJECT CSUS PROF. TATRO MAY 5th, 2014 village in Uganda. Through members of our group and through the Bridgeway Christian Church, it came to our attention that Toggo International Children’s Center in Uganda had recently built a school in an attempt to educate the children of the village. The school started out educating 20 students consisting of mostly orphans and has grown year over year and include children from many neighboring villages. This school serves over 1000 children, and also doubles as their community and health center; however, progress in all these aspects has been greatly hindered by the lack of electricity. Figure 1 shows a photo of the school house. could be added to their school to assist with the difficulties of getting teachers out to the Toggo International Children’s Center to instruct students as well as these items can be used to augment the students learning curriculum. In addition to providing a boon to education, electricity would also greatly enhance the health of the villagers as well. For example, the residents of Toggo burn kerosene lamps for lights. Given the extremely small size of their huts, the indoor pollution can have devastating effects on their immediate and long term health. Figure 2 shows a photograph of the villager’s typical living quarters. Figure 1: Toggo International Children’s Center in Toggo Village Uganda Figure 2: Typical Living Quarters in Toggo, Uganda The villagers of Toggo view education as their main weapon to combat poverty. This was evident through discussions with missionaries who have firsthand knowledge of the villagers’ needs and wants. In our preliminary interview we sought to find out what were the main needs of the residents were and what additional comforts could be met with the implementation of electricity. What we learned was that the villagers wanted electricity to power their school office equipment, printers, and computers to help with school and sponsorship records. Additionally, lighting for reading and studying after dark would provide a huge boost to the students. With the implementation of electricity, other items such as monitors, and projectors for long distance learning With electricity generation, we could implement a charging station for portable battery powered LED lanterns. This would provide enough light to illuminate the residents’ huts eliminating a lot of the indoor pollution. These portable lights would also make the 1 mile trek from the dormitory to school safer after night fall. Another health benefit that would be had from electricity in the Toggo center would come from refrigeration. Malaria is prevalent in this village with as many as 2-3 cases a day. The main source of comfort and care for patients with malaria is to have their high fever lowered by cooling the patient’s body. However, due to the lack of refrigeration the village cannot maintain any type of cooling devices such as ice packs. While 4 CpE190/EEE193A SENIOR PROJECT CSUS PROF. TATRO MAY 5th, 2014 electricity in this manner would not prevent the malaria, it would greatly aid in the healing of those inflicted with the disease. In January, 2014, Troy was able to visit TICC and spend two weeks with the villagers. By making this trip, our team was able to learn a great deal more about the societal issues and needs of the people in Toggo, Uganda. Figure 3 shows a photo of Troy Miller in Uganda with two of the children attending TICC. Figure 4: Shop in Kampala selling solar panels Figure 3: Troy in Uganda Africa with TICC Children After visiting Uganda and TICC it was clear our initial view at the problem of poverty was accurate. We were also able to see firsthand just how much electricity would benefit the people of Toggo Village by aiding in their education, and affording them a higher quality of life. Furthermore, we also discovered that many of the resources needed to supply a proper microgrid system are currently available in Uganda and neighboring states. These include solar panels and batteries Figure 4 shows a shop with solar panels for sale in Kampala, Africa near Uganda. 5 Troy noted that the school and other buildings had limited amounts of solar panels and sealed lead acid batteries. The biggest hindrance that was noted was the lack of education in how to utilize the resources that are currently available to them. Even though the citizens of Toggo have attempted to gain access to electricity by obtaining solar panels and batteries these are underutilized simply because of lack of the proper equipment and lack of understanding on how to properly use the equipment. While there, Troy was able to give them basic instruction on how to better utilize their limited equipment; these instructions were absorbed by the villagers and used immediately. These basic instructions resulted in far more efficient solar charging of batteries which in turn give TICC more electricity than they had before with which they can now accomplish more. Education was found to be the key item needed. This only reinforces the idea that education can be a powerful weapon to fight poverty. The information that we discovered about poverty through research, including how to effectively combat poverty, combined with the information about TICC’s needs that came from interviews with village leaders and Troy’s visit to Uganda have played a major role guiding our design process from the start of this project in August 2013 through May 2014. This information is also a very large reason as to why our system includes most of the features that it does and was our main source when developing the Design Idea Contract for this project. CpE190/EEE193A SENIOR PROJECT CSUS PROF. TATRO MAY 5th, 2014 III. DESIGN IDEA CONTRACT A. Overview The Toggo International Children’s Center (TICC) is located in the village of Toggo in Uganda, Africa. Reliable power is a pressing local issue that’s also ubiquitous in nature. Providing local reliable power will aid the school with lighting to study at night, relief from indoor pollution caused by burning oils for lighting, access to resources like computer and the internet, and access to health resources such as water filtration and medical treatments required to be refrigerated or frozen. This paper will discuss a microgrid design and implementation that puts the needs of children at TICC first. The system design will include a photovoltaic array sized to load requirements from the school in Toggo. Using maximum power point tracking, we will maximize the power generation from the PV and further mitigate its intermittency by adding energy storage. Energy storage will be sized to provide system autonomy of critical loads. An inverter will be used to supply AC power to office equipment for registering children, and managing the center. Last and most important, a robust and optimized energy management system will manage necessary power conversion, track energy flow, monitor the system for reliability, and regulate power flow to the system loads. B. Elevator Pitch We designing and implementing microgrid systems that help impoverished nations combat poverty by aiding in education and health care through reliable electricity generation. C. Societal Problem & Research Motivation When looking at the issues including in world poverty, as discussed in the previous section, we can see that there is definitely a problem that has viable and plausible solutions. The aforementioned research points to the need for a microgrid. The microgrid concept is based off of many small local generation systems that are fully self-sufficient and 6 would serve small villages or communities. Each village, or several combined villages, could install a renewable energy system that would serve their residents. This solution would solve 2 of the 3 main obstacles that impede the implementation of electricity generation in undeveloped countries. The upfront costs, at this time, would not be much less expensive. Microgrids really require energy storage in order to mitigate the intermittency that is inherent with renewable energy generation and batteries (the practical and obtainable energy storage) are still relatively expensive. Furthermore, in order to be as efficient as possible, these microgrids should be equipped with a robust and optimized energy management system. However, the small local systems of microgrids would circumvent the need to run transmission lines through dense rural areas which could potentially save money in the long term, and the renewable energies would release minuscule amounts of heattrapping gases into the atmosphere. This is the solution that our team will implement in a small impoverished school in Uganda. Through members of our group the Bridgeway Christian Church, it came to our attention that Toggo International Children’s Center in Uganda had recently built a school in an attempt to educate the children of the village. This school serves over 1000 children, and also doubles as their community and health center; however, progress in all these aspects has been greatly hindered by the lack of electricity. The villagers of Toggo view education as their main weapon to combat poverty. This was evident through discussions with missionaries who have firsthand knowledge of the villagers’ needs and wants. In our preliminary interview we sought to find out what the main needs of the residents were and what additional comforts could be met with the implementation of electricity. What we learned was that the villagers wanted electricity to power their school office equipment, printers, and computers to help with school registrations and sponsorship records. Electricity would also provide lighting for reading and studying after dark would provide a huge boost to the students. With the implementation of CpE190/EEE193A SENIOR PROJECT CSUS PROF. TATRO MAY 5th, 2014 electricity, other items such as monitors, and projectors for long distance learning could be added to their school to assist with the difficulties of getting teachers out to TICC to instruct students as well as these items can be used to augment the students learning curriculum. In addition to providing a boon to education, electricity would also greatly enhance the health of the villagers as well. For example, the residents of Toggo burn kerosene lamps for lights. Given the extremely small size of their huts, the indoor pollution can have devastating effects on their immediate and long term health. With electricity generation, we could implement a charging station for portable battery powered LED lanterns. This would provide enough light to illuminate the residents’ huts eliminating a lot of the indoor pollution caused by oil burning lamps. These portable lights would also make the 1 mile trek from the dormitory to school safer after night fall. Another health benefit that would be had from electricity in the Toggo village would come from refrigeration. Malaria is prevalent in this village with as many as 2-3 cases a day. The main source of comfort and care for patients with malaria is to have their high fever lowered by cooling the patient’s body. However, due to the lack of refrigeration the village cannot maintain any type of cooling devices such as ice packs. While electricity in this manner would not prevent the malaria, it would greatly aid in the healing of those inflicted with the disease. Figure 5: Initial Projected Block Diagram of DC Microgrid 7 CpE190/EEE193A SENIOR PROJECT CSUS PROF. TATRO MAY 5th, 2014 D. Project Uniquity While the concept of microgrids aren’t new or unique, the design and implementation of our microgrid concept is unique in that it is being designed with a particular client in mind that has specific needs and loads that are wholly different from other microgrids. Furthermore, it is also unique because it is being designed to be a modular, scalable, microgrid system where the controllers not only control the power flow autonomously, but it will come equipped with an interface allowing the energy consumer to control and monitor the system performance. E. Other Approaches Other approaches include buying existing parts such as PV panels, batteries, a charge controller, a power inverter and hooking them up on site. This has been done before but there is no energy management system to keep a critical load such as cold chain supplied with power even over many days of bad energy generation. This system also does not use all available power from the panels if the loads are light and batteries are charged. There is also no regard to battery chemistry needs and health status. This approach would have limited life and power generation due to the lack of energy management system. Other more expensive AC inverter systems contain energy management systems but many of these are intended to be grid-tied to an existing AC power system. In this instance the power from the panel is DC which is inverted to AC but then must be rectified to DC to run a majority of the loads. This introduces more inefficiency and allows less power to be delivered to loads. Other systems will not have a user interface so the energy customer can see the system performance along with system maintenance items that need attention. F. Team Members’ Skill set Our team is ideally skilled to accomplish this task. We have three electrical engineers (EEE) who have nearly completed the power system program at CSUS. Additionally, each of these team 8 members is proficient and adept in electronics and, in particular, power electronic theory. To round out our team, we have a computer engineer (CPE) that is skilled at programming, embedded systems, and the use of microcontrollers. Individually, Tanya Konrad has breadth of CPE experience due to her education curriculum and course projects. Additionally, Tanya has been conducting research for the California Smart Grid Center for about four months which has given her unique insights to our design. Tanya will use these skills to lead the design and implementation of micro scale control sub-system. William Loria has strong theoretical background in electronics, power electronics, and power systems. He has also conducted extensive and in depth research into renewable energy generation and power flow systems during his 2 years of California Smart Grid Center research work. He has created a hardware validated simulation for renewable energy generation and power flow. He will use this experience and knowledge to lead and implement the system control design and strategies. Troy Miller has a mix of electrical engineering curriculum including power systems, electronics, and work experience in computer science that allows him to bridge the gap between an EEE and CPE. Through his curriculum, work experience, and work with the California Smart Grid Center, Troy has developed proficiencies with power systems, as well as power electronic interfacing. Troy has also gained work experience with web design, database management, and microcontrollers. He will put these skills to use by leading the design and implementation of the power electronics that will be used to interface each of the sub-systems in our design. Matthew Yamasaki has a strong theoretical background in electronics, power electronics, and power systems. He also has gained valuable experience working for the California Smart Grid Center where he has conducted in depth research into renewable energy generation systems with energy storage. He has also designed and built a more simplistic nano-scale version of our design. CpE190/EEE193A SENIOR PROJECT CSUS PROF. TATRO MAY 5th, 2014 Matthew will use these skills to implement the load management sub-system of our design. Overall, our team member’s skills complement each other and will be useful to our design. We will each work on every section together while each section has its expert lead. G. Technology Use Our project will use many different technologies covering the Electrical and Electronic Engineering, Computer Engineering, Computer Science and Information Technology fields. The energy storage system will use power electronics to facilitate the flow of electricity from source to load. Microcontrollers will be utilized to monitor and control the power electronic circuits as well as pass information to the embedded computer system. A computer system server will catalog the system’s performance to forecast energy use and storage in order to shed and dispatch loads as required to maintain system and energy stability. The computer system will also host a graphical user interface using web technologies to report on system use and display system and maintenance alerts. H. Other Possible Design Options The rapid prototype created is a reference system for the Toggo International Children’s Center. It is a proof of concept design used to show how renewable power generation, energy storage and electrical loads can be managed to provide autonomous and reliable electricity. Let’s examine some system features that may have been designed differently with a brief discussion on how these can be implemented and more beneficial. First, our rapid prototype has PV generation of 100W and we are operating under the assumption that the system can be up-scaled to perform in a similar fashion. An additional design consideration would involve creating a 1kW modular system with properly sized energy storage and determine whether the electronics required to maximum power point track and regulate battery charge are available at this higher range of voltage and power. The availability of such parts with testing would ensure 9 the system could be installed in multiples and produce the same desired results as our 100W rapid prototype, but with the power required to electrify all of the Toggo International Children’s Center. In addition, the rapid prototype has been tested to provide maximum power point tracking capability – but with the caveat that it must be performed manually. We wouldn’t expect the user to manually maximum power point track their own system. For this reason, additional design considerations must be made for automating this feature. This will require a different DC/DC Buck Converter with external feedback for closed loop control. It will also require an algorithm or code for the closed loop control of maximum power point tracking which may come in the form of the perturb and observe method or the incremental conductance method. Lastly, climatic conditions in Uganda can be humid and warmer than the environment the rapid prototype was tested under. The conditions can severely impact the efficiency of battery. One option for a design upgrade would have been to determine charge-discharge efficiency characteristics and the effect on capacity of the battery under varying humidity and temperature conditions, equip the battery with a hygrometer and thermometer, and adjust the efficiency according to the climate to get a better estimation of useable battery energy. The age and number of cycles the battery has been stressed by can also be a determining factor in properly estimating capacity and efficiency. IV. FEATURE SET A. Laboratory Prototype 1. PV Module Based Renewable Power Generation of approximately 500W - We will compare this to the results of our 100 watt system to determine if the scaling is linear. The final specs of the PV array will be based off loads, and usage of these loads which will be determined through discussions with our client. 2. Maximum Power Point Tracking (MPPT) of Generated Power- This system will have a CpE190/EEE193A SENIOR PROJECT CSUS PROF. TATRO MAY 5th, 2014 dedicated MPPT circuitry in order to ensure that the PV array is generating the maximum amount of power possible for a given temperature and irradiance. 3. Energy Storage- We will implement around 100AH lead acid battery as needed for our client. The battery is for energy storage to assist with the mitigation of intermittency of renewable energy generation. The final specs of the battery bank will be based off loads, and usage of these loads which will be determined through discussions with our client. 4. Constant Current Constant Voltage Battery Charging Capability- We will implement a charge controller sub system that will allow the lead acid battery banks to be charged through constant current at the beginning stages and finished off with constant voltage charging. 5. Power Conditioned DC Bus from Energy Storage and Renewable Power Generation Sources - We will implement power electronics circuitry to regulate the voltage from the power sources (PV and Battery) to a specific voltage level within limits that can be transmitted to the system’s loads. 6. Power Conditioning for DC Loads- we will implement power electronics circuitry to regulate the voltage within limits needed for specific loads. 7. Monitor Current and Voltage at Generation, Battery Storage, and Loads- we will measure the power at each stage of the system through instrumentation circuitry which will be recorded and communicated through microcontrollers. 8. Develop Algorithms to determine State of Charge of the battery and Priority Based Load Control- We will determine the best way to implement a ‘gas-gauge’ for the battery, as well as predicting the amount of future energy that 10 will be required by loads at times when only the battery bank is the source 9. Automated Switching and Load Shedding for Demand Response- we will treat the battery bank as a grid and implement relays and controls that will allow the loads to be turned off or on depending on the SoC of the battery and current amount of power being generated from the PV with override options for the system’s demand response. 10. Communication established between local controllers and embedded system controllerWe link the micro controllers to a master controller that will manage the energy data of the system through a local web server. 11. Store System Performance Data- we will store a prespecified amount of historical data. 12. Graphical User Interface showing system status, history, alerts- we will implement power consumption monitors that will allow the system’s resident users to view and properly manage their energy consumption V. LABORATORY PROTOTYPE RESOURCES AND PROJECT FUNDING A. Required resources In order to complete this project, we will need a few resources. These resources will consist mainly of testing equipment and laboratory work spaces. We will need access to RVR 3016A, an oscilloscope, current transducer, and PQube for measuring power. We will also need access to Santa Clara 1119D to build our prototype system. Non-facilities related resources will include any access to related grant funding. B. Laboratory Prototype Funding The laboratory prototype DC Microgrid developed the first semester was entirely selffunded. During the initial planning phase a rough approximate was developed based on foreseen part CpE190/EEE193A SENIOR PROJECT CSUS PROF. TATRO MAY 5th, 2014 costs and utilizing existing equipment. The total cost at that time consisted of parts such as existing PV array, existing battery, boost/buck/buck-boost voltage regulators, microcontrollers, computer system, and sensors. Based on parts alone this estimate was about $750. As the project progressed the need grew to test and evaluate power electronic circuits, wanting additional PV generation, and the need to make a presentable prototype increased beyond the initial parts only estimate. As the prototype was developed the scope changed as problems were encountered and overcome which also increased the overall cost. A total of $2000 was spent by all team members to complete the prototype DC Microgrid. C. Deployable Prototype Funding The initial estimated cost of the deployable prototype DC Microgrid was $7500. This estimate is within the range of the size we would like to deploy to Toggo International Children’s Center. If additional funding can be acquired then additional PV generation, battery storage, and power electronics can be purchased. The team plans to send letters to companies in the area seeking funding for the deployable prototype. Now that a laboratory prototype is complete and functional a request for funding letter will be developed showcasing TICC’s need and our working prototype. Our plan is to acquire funds early in the semester by sending letters over Christmas break. We also have received an offer from the California Smart Grid Center for $1000 in funding but it must be spent this year. D. Final Prototype visual Power systems in the US are taken for granted. You would not invite someone over to look at your breaker panel or light fixtures unless someone is coming over to repair it. Most of our system will be sight unseen. The controller boards will be tucked away in a project box, batteries stored safely in their place with only the PV arrays visible on the roof. How our system will be seen is when a TICC staff member goes into the office they will be able to turn on the computer to finish adding sponsorship information and test scores. 11 They will be able to hit the “Print” button to post the top scores for the previous week’s exam in the classroom. The school nurse will return the reusable ice packs to the freezer and grab another fresh pack for the second case of malaria that day. The teacher will be able to return to her quarters and flick on the light switch to work on adjustments to next week’s curriculum. Pastor Steve will be able to pop into the office to retrieve his fully charged cell phone. In essence our project will look like productivity replacing challenges. A few other possible things you will see about our system is on a bright day you would see the water distiller purification device producing clean water because the batteries are full and the excess power is put to use making clean water. On the fifth (or fifteenth) cloudy day in a row the LED above the power plug starts to blink red for a few minutes before turning off the cell phone chargers, the computer, and the overhead lights to make sure the freezer stays cold overnight. Once you connect to our system web server you would see the full spectrum of information showing total power generated, state of charge of the battery system, and even an alert showing battery number 1’s performance has decreased faster than expected along with a suggested date for replacement. VI. LABORATORY PROTOTYPE PROJECT SCHEDULE AND MILESTONE Microsoft Project was used to track the project timeline and track significant milestones. The next pages show a summary of the project timeline along with the project milestones. CpE190/EEE193A SENIOR PROJECT CSUS PROF. TATRO MAY 5th, 2014 Figure 6: Project Timeline with Milestones and Other Significant Events for Fall 2013 12 CpE190/EEE193A SENIOR PROJECT CSUS PROF. TATRO MAY 5th, 2014 Figure 7: Project Timeline with Milestones and Other Significant Events for Fall 2013 13 CpE190/EEE193A SENIOR PROJECT CSUS PROF. TATRO MAY 5th, 2014 Figure 8: Project Timeline with Milestones and Other Significant Events for Fall 2013 14 CpE190/EEE193A SENIOR PROJECT CSUS PROF. TATRO MAY 5th, 2014 Figure 9: Project Timeline with Milestones and Other Significant Events for Fall 2013 15 CpE190/EEE193A SENIOR PROJECT CSUS PROF. TATRO MAY 5th, 2014 Figure 10: Project Team Members with Pastor Steve Trint VII. LABORATORY PROTOTYPE PROJECT WORK BREAKDOWN STRUCTURE E. Preface After being introduced to TICC’s dilemma and thoroughly researching the societal problem they face, we as a group determined that supplying TICC with electric energy to aid in their education would be an acceptable solution and a large step towards answering their societal problem. After meeting with Pastor Steve to determine the TICC’s electricity needs and developing our feature set list from this information, we had to use this information along with our knowledge of the components of a local photovoltaic energy generation system to develop a work plan that would aid us in efficiently creating a micro-grid reference design that could be implemented at the TICC to supply the needed electricity. Microgrid is a simple term for a large and complex system. Essentially, we are designing an electricity generation system that will need to be fully selfsufficient, reliable, and contain its own energy management system. Designing a 16 microgrid system that can have all the required subsystems interface we each other to provide stable and reliable electricity is a large project with many potential pitfalls. In order to be successful, there must be some type of project or work plan developed that can sufficiently break the overall project down into manageable bites that can be efficiently worked as tasks. The Work Breakdown Structure (WBS) method does exactly this. There are six basic major components to a micro-grid: Local (Renewable) Generation, Power Conditioning and Flow, Energy Storage, Load Management, and Energy Management, and as with any other large project, Project Management. Each stage requires its own design considerations. And, each stage also has its own complexities and dependencies on other parts of the system to ensure interoperability. In the remainder of this paper we discuss in detail each part of micro-grid design and the tasks for the design that resulted as a result of using the WBS method. F. Local Generation At the front of the entire system is the power generation stage. For micro-grids, the most likely type of generation is some sort of renewable energy. For our design, we have chosen to use solar panels. This is because of where we will implement our reference design. In Uganda Africa, they are located pretty close to the equator and the sunshine that they receive all year is remarkably stable. Figure 11, below, shows the WBS flow chart for this stage of the system. The breakdown from solar panels is that we have to properly size the panel depending on the overall load requirements of the system. CpE190/EEE193A SENIOR PROJECT CSUS PROF. TATRO MAY 5th, 2014 G. Renewable Generation Solar Panels MPPT Spec Solar Panel Power Rating Per Load Requirements Research, Develop, or Purchase suitable MPPT Install on Prototype Install on Prototype Figure 11: Renewable Generation WBS Flow In addition to settling on solar panels as the renewable source, a maximum power point tracker (MPPT) is needed for renewable energy sources to ensure that the sources is generating the most power that it possibly can. This block will involve tasks of researching how MPPTs work and developing, or purchasing a suitable electronic device that will function as a MPPT. This stage will terminate with the action items of installing the chosen solar panel and MPPT on to our prototype system. 17 Power Conditioning and flow This stage of the system is responsible for regulation of voltages for various parts of our system and for controlling the overall power flow throughout the micro-grid system. This stage has two main parts: Voltage regulation via Power Electronics and Controls section. Figure 12 shows the WBS for this stage of the micro-grid system. CpE190/EEE193A SENIOR PROJECT CSUS PROF. TATRO MAY 5th, 2014 Power Conditioning Stage/ Power FLow Power Electronics Boost Circuit Regulated DC Bus Voltage Controls Buck Circuit Charge Controller Constant Voltage Constant Current Charging method Voltage, Current Measurements Hall Effect, Shunt Battery as a Source measurement methods Microcontroller I. Feedback PWM, Duty Cycle control Figure 12: WBS Flow Diagram of the Power Conditioning and Flow Stage H. Power Electronics Power Electronics are responsible for changing the voltage and or current signals from one section of the power system to flow to another section. This is done for various reasons ranging from power transmission to component voltage requirements. We will use them for both. For this block we will need a buck regulator circuit. This circuit will lower our 18 DC bus voltage to an acceptable amount to be able to charge our battery. In addition, we will also require a boost circuit to allow our battery to supply voltage to our loads; thus, it needs to boost the voltage to that of the DC bus voltage. This task is a difficult one as the type of circuit we need must be a custom design to provide us with the flexibility that we seek in being able to seamlessly switch from solar panels to battery in powering the loads. Furthermore, this circuit will also function as the base for our constant current, constant voltage charge controller. So, the circuit also needs to be capable of holding the voltage steady while adjusting the current up or down to charge the battery. And, then near the end of the charge cycle the circuit must hold the current steady and let the voltage float. Controls Another key section for the Power Conditioning Stage is the control section. This block will be broken down into current and voltage measurements and microcontroller. We will measure current and voltages using voltage sensors and Hall Effect sensors and or shunt resistance method. The microcontroller will process these measurements and we will create feedback algorithms that will control the pulse width modulation of the power electronic switches and the power electronic duty cycles. J. Energy Storage Energy storage is a key element for the DC micro-grid to help mitigate the intermittency that is inherent in renewable energy generation. This stage will have two main subsections: The battery and Battery Monitoring. First we will need to determine the type of battery chemistry we want to include in the system. Once that task is CpE190/EEE193A SENIOR PROJECT CSUS PROF. TATRO MAY 5th, 2014 complete, we will spec the capacity of the battery according to our load requirements and our power generation size. The monitoring aspect of the energy storage stage is also key. Here, we will need to determine the state of charge of the battery at all times. For this task we will research the best way to do this. We will then need to monitor all power measurements into and out of the battery and develop appropriate algorithms that can use this info to give us an accurate state of charge. We will then create a feedback system that feeds this information to the charge controller of the Power Conditioning Stage as well as to the Energy Management stage of our system. Figure 13 shows the WBS of the Energy Storage stage. K. Loads The loads (Lighting, refrigeration, office equipment etc.) and the load management stage is the next main section of our design. We must begin with determining the load demands and the load usage for our design. We will do this through continuous communication with our client. After obtaining the load information, we will need to categorize the loads and determine a load profile for the system. We can categorize the loads into three main subsections: Lighting, appliances, and electronics. For the lighting section we will need to determine the types of lighting that we will use with our micro-grid system. Then we must establish the proper link with the DC bus to supply power to the lights. For the appliances, we will need to research and spec out a properly sized inverter to convert the DC energy into AC energy. Once we have these specs we will need to obtain and install this inverter into our prototype. The electronic devices will require a DC-DC converter to convert the 19 DC bus voltage to the appropriate levels. Once this is done we will create a battery charging stations for laptops and cell phones. Once these loads have been complete, we will create a management system that will control solid state relays and allow us to switch loads on and off based on demand response signals from linking with the Energy management stage. Figure 14 shows the WBS for the Loads stage. CpE190/EEE193A SENIOR PROJECT CSUS PROF. TATRO MAY 5th, 2014 Loads Energy Storage Determine Loads and Usage through Communication with Client Categorize and Obtain Load Profiles Battery Determine Type of Battery Chemistry Control/ Measurments State of Charge and Battery Health Lighting Appliances Electronics Determine type of Lighting Spec Inverters for AC Voltage DC/DC Converter Establish Proper Link with DC Bus Voltage Obtain and Install Inverter on to Prototype Cell Phone and Laptop Battery Charging Stattion Solid State Relays to Shed Loads Based on Demand Response Signal Spec Capacity to Load and Generation Requirements Monitor V,I Measurements and feedback Develop Algorithm to Determine SoC of Battery Link to Energy Management System Figure 14: WBS of the Loads Stage Feedback to Charge Controller and Energy Management Systems Figure 13: WBS Flow of the Energy Storage Stage 20 L. Energy Data and Management This stage is responsible for monitoring energy usage and feeding this back to consumers. We will set up communication to send the power measurement data to a web server where this raw data can be processed into more intuitive information. We will then choose a type of consumer feedback HAN device that will allow us to display to the users their current (near) real-time energy consumption. This stage is also responsible for the optimized energy management of our system as well. For this section we will CpE190/EEE193A SENIOR PROJECT CSUS PROF. TATRO MAY 5th, 2014 determine critical loads that must be maintained by our system at all times. We will then monitor the State of Charge, Power Generation, and Current Power Consumption. We will parallel this task by researching and developing a way to track the sun and time of day. This will lead to us developing algorithms that will be able to predict how much power can be generated for the remainder of a given day as well as determining the amount of power required to maintain our critical loads throughout the day. We will then need to find a way to compare this data to the predicted remaining power generation, and battery state of charge. The result of this comparison will then send signals to the Load stage solid state relays that will allow us to load shed if necessary. Figure 15 shows the WBS of the Energy Data and Management stage. Energy Data and Management Monitor Power Measurements Communicatio n Protocol to Send Data to Web Server Determine Critical Loads Research How to Track Sun, Time of Day Monitor Battery SoC, Power Generation, and Current Power Consumption Process Data Determine HAN Devices to Use Consumer Feed Via HAN Device Develop Algorithm to Predict Remaining Possible Power Generation for a Day Develop Algorithm to Compare Needed Power to Predicted Power and SoC and Current Consumption Develop Algorithm to Determine Power Needed to Maintain Critical Load throughout the Day Send Signal to Solid State Relays Figure 15: Energy Data and Management WBS Flow M. Project Management The project management portion of a project can often be overlooked; however, it importance cannot be. In a project with a large scope, this block is just as important as every other, if not more so. This block details the Administration, Scheduling, and Milestone or Deliverables. Figure 16 shows a block diagram of our Project Management tasks. 21 CpE190/EEE193A SENIOR PROJECT CSUS PROF. TATRO MAY 5th, 2014 Figure 16: Project Management WBS Flow The Project Management blocks splits into two main sections; Administration and Deliverables. On the Administration side, we have the basic reporting and evaluations. This is the part of the Project Management that often gets overlooked. Here, we have the mundane tasks of weekly reporting and status updates. However these are extremely important as the weekly reporting not only allows those with a vested interest outside of the working group to be updated with the status of the project, but also helps to keep the working group focused on the tasks and quickly alerts them to any problems or issues that may arise. We also have the Outgoing Team Leader Reports under this section, this is a brief status update and a basic transfer of knowledge that the current Team Lead has gained to 22 the new Team Lead taking over. This is an important result as it allows the team to continue working smoothly by lowering the learning curve for the new Team Lead. The last type of reporting in this section is the Team Evaluations. These evaluations allow each individual to know what the team felt they did well and also what the team feels an individual needs to improve upon. On the other side of the Project Management, we have the Deliverables section. The Deliverables are milestones and deadlines along the way to the term of the project time. Our deliverables in this case were taken from the assignments section. Each assignment had a due date associated with it; therefore, we used these dates and an estimation of work time for the tasks that resulted from the WBS blocks detailed above to formulate a schedule. This led to creating a Microsoft Project Timeline (TimeLine). The Timeline that we created lists every task that has been discussed in this report in detail. The TimeLine lists actionable tasks that are needed from September 2013 through May 2014 with due dates, and member assignments attached to each task. The TimeLine also lists all critical task paths and tasks dependencies. The TimeLine also has automated percentages that give updates not only on the entire project block, but also on the sub-blocks of the project as well. The TimeLine is a dynamic document that should be updated very often. As a task is worked on, the percentage complete should be reflected in the TimeLine. Additionally, there may be times when an unexpected task for the project arises. In this case it’s important to update the TimeLine so that it is an accurate reflection of the amount of work done and also to ensure that the percentage status CpE190/EEE193A SENIOR PROJECT CSUS PROF. TATRO MAY 5th, 2014 update that the TimeLine gives is also accurate. The creation of the TimeLine also gives our work group a formal written set of tasks assigned to individuals. N. Total Hours Worked Due to the complex nature of our project and the fact that each WBS block breakdown resulted in promised features that spanned many different areas of expertise, we assigned each block to an appropriate team member to act as a manager for that section. For example, the Energy Storage feature requires expertise in electrical engineering hardware for the instrumentation as well as software engineering to make proper use of the measurement data. That data is the same as the data used for the Energy Management features. Therefore, the Energy Storage and Energy Management features are directly linked and heavily dependent. As a result, each member would serve to organize and lead the completion of an assigned WBS block with the others’ help in addition to miscellaneous individual tasks that would arise. The total man hours that went into the Fall 2013 completion of these blocks was 995 hours. The graph below shows the breakdown in hours for each block as well as the team member responsible for management of the block. Figure 17: Breakdown of total man hours worked and by WBS block VIII. LABORATORY PROTOTYPE RISK MANAGEMENT FOR WBS Every successful engineering project must incorporate ways to manage risk. The DC microgrid project for the laboratory prototype isn’t any different. The initial 23 WBS led to the creation of a project timeline. Due to unforeseen circumstances, changes to the original WBS altered the project timeline. This section will discuss the assessment and mitigation of risk for the laboratory prototype during the Fall 2013 term. CpE190/EEE193A SENIOR PROJECT CSUS PROF. TATRO MAY 5th, 2014 A. Laboratory Prototype Before the project got off the ground, our team formulated an initial WBS that led to a project timeline. During the stages of research and work, the initial plans changed. Since we determined one of the leading factors contributing to the spread of malaria in Toggo was access to clean drinking water, we had initially planned on creating a dispatchable load for purifying water. After meeting with Pastor Steve, it was determined that the village had a well with plenty of clean drinking water. While we could easily remove the task for the dispatchable load, another task fell into place. We now needed to generate, control and manage the power required to operate the pump that pulls water from the well and delivers it to closer to elevated tanks in the village. This task goes hand-in-hand with the scope of our entire project and our modular power system design. We plan on examining the specifications and requirements of the well pump over the winter and setting up an individual microgrid for powering the pump in the deployable prototype. Additional system costs for the deployable prototype have now increased and changes to funding will follow. Similarly, our embedded computer system gave us fits all semester and once we realized the onboard analog to digital converters on the BeagleBone Black were not functioning properly, we collectively made the decision to switch over to the Digilent chipKIT max32. In hindsight the switch should have been made earlier, but given the late change, we were forced to put in extra time on project tasks that had slowed due to the BeagleBone. By putting in a total of 183.5 hours in the final week leading up to the midterm technical review, we were able to mitigate the risk associated 24 with the bad choice in embedded computer systems. B. Deployable Prototype After development of the small-scale laboratory prototype, we will look to increase the scale to deploy for use in TICC, Uganda. When transitioning from the small-scale to full-scale system for deployment, we need to first examine the risk factors involved. Given the small-scale power converters currently employed on our system, we’ve assumed that higher power rated converters exist and that the cost scales somewhat linearly. During the following semester, we will examine the availability and costs of these larger converters along with the possibility of implementing a bi-directional converter for the battery. The change in geographical location from our small-scale prototype in Sacramento, CA to the full-scale deployed prototype in TICC, Uganda brings many uncertainties. The humidity in this region of Uganda is much greater than in Sacramento, we will have to test the durability of system components under higher humidity. Parts and costs will also need to be explored for protecting our system from rain water. Conversely, the increased temperatures in Uganda will need to be accounted for with cooling mechanisms. The most prohibitive risk for the deployable prototype is shipping. If it’s later determined that necessary system components can’t be purchased locally, we we’ll have to investigate the added cost of shipping all system components to TICC, Uganda. Mitigating the costs and risks involved, we may have to down scale our original sizing of the full-scale deployable prototype to adjust for shipping. CpE190/EEE193A SENIOR PROJECT CSUS PROF. TATRO MAY 5th, 2014 IX. LABORATORY PROTOTYPE TASK ASSIGNMENTS With the WBS complete and the five main blocks of tasks generated for the promised features of our system design plus the appropriate risk assessment and mitigation strategies in place, we assigned each team member individual tasks. These individual tasks were mainly from the WBS blocks the team member was assigned to with the addition of some miscellaneous tasks. These tasks are listed below with hours worked for each individual. A. Tanya Konrad Tasks • • • • • • • • • • 25 Build and wire prototype according to mockup so that the system can easily be put together and demonstrated Implement Microcontroller to Receive Signal from Energy Management System to Control Solid State Relays to Shed Loads Decide on Battery Type (Chemistry) through Discussion with Clients Obtain and Install Battery on Prototype Monitor V and I Measurements to and from Battery Research Battery Management to Determine Methods for Tracking State of Charge Develop Algorithms to Determine State of Charge of Battery Implement State of Charge Function through Microcontrollers and Communicate this Information with Energy Management System and Charge Controller System Communicate V and I Measurements to Web Server and Process Data Determine Critical Loads Research and Develop Algorithm to Predict Remaining Possible Power Generation Left • Develop Algorithm to Determine Power Needed to Maintain Critical Loads throughout Day • Develop Algorithm to Use Battery SoC, Power Generation, and Consumption Data to Compare Needed Power to Possible Power to Generate DR Signal to Send to Load Management System • Await Approval For Contract Idea • Bulletin Board Decoration • Midterm Technical Design ReviewA more complete Prototype demonstration • End of Term Report- Complete Documentation of Prototype • Breadboard Proof- Demonstrate a critical element of design • Laboratory Prototype Presentation • Elevator Pitch Presentation, Revised Problem Statement Report and Presentation • Device Test Plan Written Report • Market Review Report and Presentation • Midterm Progress Review- Testing Results Presentation • Deployable Prototype ReviewPresentation • Final Documentation • Final Team Presentation • Team Leader Administrative Duties Total hours worked for Tanya: 236 hours • B. William Loria Tasks • • Design Layout of Prototype mockup Build and wire prototype according to mockup so that the system can CpE190/EEE193A SENIOR PROJECT CSUS PROF. TATRO MAY 5th, 2014 • • • • • • • • • • • • • • • • • 26 easily be put together and demonstrated Establish Proper Link with DC Bus Voltage to Power Lighting Obtain and Install scaled down lighting on Prototype Obtain Specifications for Inverter to Supply AC Voltage Obtain and Install AC Inverter on to Prototype Install refrigeration or AC load equivalent on Prototype Implement DC DC Converter to Power Electronic Loads Scale System Down to Match Approximately 500 Watts of Solar Power Obtain Approximately 300W of Solar Panels and Install on Prototype Research and Develop or Purchase a Suitable MPPT Install Maximum Power Point Tracking on Prototype Research operations of Buck, Boost, and Buck/Boost Power Electronic Circuits Test PV, buck, boost and battery interfacing according to test plan Design or interface Buck/Boost with Bidirectional Power Flow Capability Develop and Implement Charge Controller with Constant V,I Charging Based off Buck Boost Circuit Research and Implement Microcontroller to Feedback Voltage and Current Measurements to Control PWM of Power Electronics Decide on Battery Type (Chemistry) through Discussion with Clients Obtain and Install Battery on Prototype Determine How To Process Power Consumption Data and Feedback to Users in a Useful Manner • Determine HAN Devices to Use to Give Data Feedback • Acquire and Install HAN Devices • Determine Critical Loads • Research How to Track Sun, and Time of Day • Research and Develop Algorithm to Predict Remaining Possible Power Generation Left • Problem Statement Report • Design Idea Report • Await Approval For Contract Idea • WBS Flow Chart • WBS Report • GANTT Chart • Midterm Technical Design ReviewA more complete Prototype demonstration • End of Term Report- Complete Documentation of Prototype • Breadboard Proof- Demonstrate a critical element of design • Laboratory Prototype Presentation • Market Review Report and Presentation • Midterm Progress Review- Testing Results Presentation • Deployable Prototype ReviewPresentation • Final Documentation • Final Team Presentation • Team Leader Administrative Duties Total Hours by William Loria: 292 hours • C. Troy Miller Tasks • Build and wire prototype according to mockup so that the system can easily be put together and demonstrated CpE190/EEE193A SENIOR PROJECT CSUS PROF. TATRO MAY 5th, 2014 • • • • • • • • • • • • • • • • 27 Determine Total Loads, and Usage Through Communication with Client Implement Cell Phone and Battery Charging Station Install Solid State Relays to Connect Loads to Energy Flow Implement Microcontroller to Receive Signal from Energy Management System to Control Solid State Relays to Shed Loads Install Maximum Power Point Tracking on Prototype Create Test plan for testing PV, buck, boost and battery interfacing with small(er) scale components Research operations of Buck, Boost, and Buck/Boost Power Electronic Circuits Test PV, buck, boost and battery interfacing according to test plan Obtain Boost Circuit Based off Scaled Load Requirements and Install on Prototype Design or interface Buck/Boost with Bidirectional Power Flow Capability Develop and Implement Charge Controller with Constant V,I Charging Based off Buck Boost Circuit Decide on Battery Type (Chemistry) through Discussion with Clients Obtain and Install Battery on Prototype Develop Algorithms to Determine State of Charge of Battery Implement State of Charge Function through Microcontrollers and Communicate this Information with Energy Management System and Charge Controller System Create Webserver for Data Storage and Data Processing Determine How To Process Power Consumption Data and Feedback to Users in a Useful Manner • Determine Critical Loads • Develop Algorithm to Determine Power Needed to Maintain Critical Loads throughout Day • Revise Feature Set List • Await Approval For Contract Idea • Midterm Technical Design ReviewA more complete Prototype demonstration • End of Term Report- Complete Documentation of Prototype • Breadboard Proof- Demonstrate a critical element of design • Laboratory Prototype Presentation • Market Review Report and Presentation • Midterm Progress Review- Testing Results Presentation • Deployable Prototype ReviewPresentation • Final Documentation • Final Team Presentation • Team Leader Administrative Duties Total Hours by Troy Miller: 244 hours • D. Matthew Yamasaki Tasks • • • • • Build and wire prototype according to mockup so that the system can easily be put together and demonstrated Determine Total Loads, and Usage Through Communication with Client Determine Type of Lighting to Use Determine Type and Total Loads of Appliance Determine Type and Amount of Electronics CpE190/EEE193A SENIOR PROJECT CSUS PROF. TATRO MAY 5th, 2014 • • • • • • • • • • • • • • • • • 28 Determine Solar Panel Power Ratings Based off Load Requirements Install Maximum Power Point Tracking on Prototype Design or interface Buck/Boost with Bidirectional Power Flow Capability Develop and Implement Charge Controller with Constant V,I Charging Based off Buck Boost Circuit Order and Obtain then Install Hall Effect Sensors and Shunt Resistors to Measure Current and Voltages of System Decide on Battery Type (Chemistry) through Discussion with Clients Calculate Capacity of Battery from Load and Generation Requirements Obtain and Install Battery on Prototype Monitor V and I Measurements to and from Battery Research Battery Management to Determine Methods for Tracking State of Charge Implement State of Charge Function through Microcontrollers and Communicate this Information with Energy Management System and Charge Controller System Determine Critical Loads Research How to Track Sun, and Time of Day Develop Algorithm to Use Battery SoC, Power Generation, and Consumption Data to Compare Needed Power to Possible Power to Generate DR Signal to Send to Load Management System Elevator Pitch Design Idea Report Feature Set List Await Approval For Contract Idea Midterm Technical Design ReviewA more complete Prototype demonstration • End of Term Report- Complete Documentation of Prototype • Breadboard Proof- Demonstrate a critical element of design • Laboratory Prototype Presentation • Market Review Report and Presentation • Midterm Progress Review- Testing Results Presentation • Deployable Prototype ReviewPresentation • Final Documentation • Final Team Presentation • Team Leader Administrative Duties Total Hours by Matthew Yamasaki: 223 hours • • X. CREATION OF THE DEPLOYABLE PROTOTYPE Using the WBS, and Project Timeline as a guide to develop individual tasks, we were able to work throughout the Fall 2013 semester and design and implement nearly all of the required features for our laboratory prototype. With that phase complete, we then turned to the creation of the Deployable prototype. This phase of the project meant continuing our laboratory prototype by implementing needed system improvements, and conducting in depth testing to ensure that all our features were implemented and functioning correctly. To get us started on this phase, we needed resources, mainly funding, to obtain the necessary components to proceed with the deployable prototype. CpE190/EEE193A SENIOR PROJECT CSUS PROF. TATRO MAY 5th, 2014 A. Deployable Prototype Funding The deployable prototype DC Microgrid that we have implemented in the spring semester was entirely self-funded. The estimated budget for the deployable prototype was originally higher; however, since some of the revisions attempted were not successful, we have not included the extra amount to our total cost. Some of the hardware and software items we added in revising our design are a Real Time Clock to keep track of the time and some current blocking diodes to prevent current loops. This brought our total cost for the semester at about $25. B. Project Publicity and Fundraising Funding is a very important part of addressing this societal problem. With limited financial resources the goal has been to present our project to the media and a grass roots campaign to tell our story to everyone that we have contact with. We have contacted the California State University, Sacramento Public Affairs Department to help us promote our project to 192 media outlets directly. They were very receptive and have helped us tremendously committing to get our story out there. There is a video posted by them and we are currently waiting for the official publication of our interviews with them. The video can be viewed at the following link http://youtu.be/HnKr4GEL028. To secure donations we have setup a site at http://yaakaafrika.org/ under the Solar Project dropdown menu. XI. DEPLOYABLE PROTOTYPE PROJECT SCHEDULE AND MILESTONES Microsoft Project was used to track the project timeline and track significant milestones. The next pages show a 29 summary of the project timeline along with the project milestones. CpE190/EEE193A SENIOR PROJECT CSUS PROF. TATRO MAY 5th, 2014 Figure 18: Project Timeline with Milestones and Other Significant Events for Spring 2014 30 CpE190/EEE193A SENIOR PROJECT CSUS PROF. TATRO MAY 5th, 2014 Figure 19: Project Timeline with Milestones and Other Significant Events for Spring 2014 31 CpE190/EEE193A SENIOR PROJECT CSUS PROF. TATRO MAY 5th, 2014 Figure 20: Project Timeline with Milestones and Other Significant Events for Spring 2014 32 CpE190/EEE193A SENIOR PROJECT CSUS PROF. TATRO MAY 5th, 2014 Figure 21: Project Timeline with Milestones and Other Significant Events for Spring 2014 33 CpE190/EEE193A SENIOR PROJECT CSUS PROF. TATRO MAY 5th, 2014 XII. DEPLOYABLE PROTOTYPE WORK BREAKDOWN STUCTURE Due to the fact that we were able to get almost all of our features implemented in the Fall of 2013 the overall WBS did not change much for our project. The overall flow remained the same as discussed in section VII. Because of this, we began to switch our focus in the Spring of 2014 to implementing the minor improvements to our system that we noticed at the end of the Fall 2013 semester, conducting in depth testing and analysis of our system’s features, and gaining publicity and awareness of our project. This focus resulted in some individual tasks being generated that we grouped into one the five main WBS blocks discussed previously. The main task changes are briefly discussed below. A. System Improvement Tasks At the end of the Fall 2013 semester, after most of our features were implemented we noted that although the features were proven to work, there were some improvements that should be made. These improvements are listed below. • Automate MPPT by using a digitally controllable DC-DC power converter • Automate Charge disconnect switch • Improve Demand Response Algorithms to be more robust and based off of current power usage and predicted future needs • Improve algorithm to better and more accurately measure state of charge of the battery B. Deployable Prototype Testing One of new main tasks for Spring 2014 involved testing our prototype to ensure that it would be ready for deployment. Our testing included testing 34 individual and isolated system components to ensure that they were functioning properly. We isolated and tested the solar panels, the buck and boosts circuits, the battery charging system, and each software algorithm for energy management, demand response, and data acquisition and display. These individual tests included both hardware bench tests and simulation tests. The results of these test and modifications resulting from them will be discussed later. C. Project Publicity and Awareness Another task that we focused on in the Spring 2014 semester was raising awareness for our project and for the TICC. The goal here was to make people aware of what we were doing and to eventually lead to fund raising for actually getting our design installed in Uganda, Africa. Some of the main things we did to raise awareness of our project was giving impromptu demonstrations at CSUS during testing, presenting our work at the poster presentation in Napa CA for the University of Minnesota, and working closely with CSUS Public Affairs giving interviews, doing photo shoots, and making a Youtube video that describes our project. Additionally, we have redesigned our electrical load board to be more aesthetically pleasing by turning it into a cabinet that will be covered and adorned with posters depicting TICC, Uganda, and our work to help them. D. Deployable Prototype WBS Task Hours The tasks for the Spring 2014 semester that resulted from the WBS were grouped into one of the five main blocks that were discussed in the Laboratory Prototype section. These blocks are: Energy Data and Management, Renewable Generation & Electrical Loads, Power CpE190/EEE193A SENIOR PROJECT CSUS PROF. TATRO MAY 5th, 2014 Conditioning & Power Flow, and Energy Storage & Measurement Instrumentation. All system improvements and testing tasks were grouped accordingly into the block where they belong while the Publicity and Awareness tasks were grouped under the block called Project Management. As with the Fall semester this phase of the project required many hours of work and totaled at 920 man-hours of work. The graph below shows all the blocks from our WBS and the total amount of hours put into each block along with the team member assigned to lead that block. Figure 22: Task Hours for Spring 2014 XIII. DEPLOYABLE PROTOYPE TASK ASSIGNMENTS With the Spring 2014 WBS modified and complete, new tasks generated, and the appropriate risk assessment and mitigation strategies in place, we assigned each team member individual tasks. These individual tasks were mainly from the WBS blocks the team member was assigned to with the addition of some miscellaneous tasks. These tasks are listed below with hours worked for each individual. 35 A. Tanya Konrad • Obtain and Install Hardware Real Time Clock for the Raspberry Pi • Develop Algorith to Use Battery SoC, Power Generation, and Consumption Data to Compare Needed Power to Possible Power to Generate DR Signal to Send to Load Management System • GUI - System Status & Alerts • Algorithm SoC Improvement • Software Testing • Upgraded System Testing CpE190/EEE193A SENIOR PROJECT CSUS PROF. TATRO MAY 5th, 2014 • Estimate the Remaining Available system outputs and behavior with Energy Generation for the Day theoretical (Until Next Sunlight) • Estimate the Energy Consumption for the Remainder of the Day (Until • • • • Automated Switch • Search for Charge Controller with Next Sunlight) Controlled inputs to Implement Elevator Pitch Presentation, Revised Microcontroller Automatic MPPT Problem Statement Report and • Device Test Plan Outline Presentation • System Simulation Market Review Report and • Experimental Full System Testing Presentation • Modify Simulink Simulation Model - Midterm Progress Review- Testing Results Presentation Full System Simulation • 24hr Day - Current Season / • Feature Report and Presentation Sacramento Weather - Full System • Deployable Prototype Review- Simulation Presentation • 24hr Day - Spring, Summer, Fall, • Final Documentation • Final Team Presentation • Weekly Progress Report 22 Winter - Uganda Weather - Full • Weekly Progress Report 23 System Simulation • Weekly Progress Report 24 • Weekly Progress Report 25 • Weekly Progress Report 26 • Weekly Progress Report 27 • Weekly Progress Report 28 • Team Leader 3 make lighting loads more visually • Team Lead 3 Outgoing Report appealing and add posters to • Team Eval 3 advertise TICC. • Fundraising and publicity – Video, Winter - Full System Simulation • • Hours worked by Tanya Konrad-216 • Research Algorithm to Implement • • Acquire and Install HAN Devices • Finish Simulink battery model and run simulation to compare real Results and Documentation - Full Rebuild Load Board into Cabinet to Automate MPPT with closed loop control of the output voltage and/or current. • Work with Deborah Frost to design poster and display • Control of MPPT • One Week - Spring, Summer, Fall, System Simulation B. William Loria • 24hr Day - Spring, Summer, Fall, Winter - Full System Simulation Public Affairs Dept 36 Replace Manual Switch with Market Review Report and Presentation • Midterm Progress Review- Testing Results Presentation • Feature Report and Presentation CpE190/EEE193A SENIOR PROJECT CSUS PROF. TATRO MAY 5th, 2014 • Deployable Prototype Review- • Presentation Presentation • Final Documentation • Final Documentation • Final Team Presentation • Final Team Presentation • Team Eval 3 • Weekly Progress Report 29 • Fundraising and publicity • Weekly Progress Report 30 • Weekly Progress Report 31 • Weekly Progress Report 32 Hours worked by William Loria-277 C. Troy Miller • • • Weekly Progress Report 33 Develop Algorithm to Determine • Weekly Progress Report 34 Power Needed to Maintain • Weekly Progress Report 35 Critical Loads throughout Day • Weekly Progress Report 36 Microprocessor Current & • Team Leader 3 Team Lead 4 Voltage Measurements • Outgoing Report Filtering/Timing • Team Eval 3 Component Transient Analysis • Fundraising and publicity – Simulation • • Donation Link with YaakaAfrika PV Characterization Testing Component Transient Analysis Hours worked by Troy Miller-218 Simulation D. Matthew Yamasaki Energy Storage • Add new sensors to measure current Charge/Discharge Testing - input to Buck/MPPT/C.C. and Component Transient Analysis Negative Input from PV. Apply Simulation filters to new Hall Effect Sensors. • Software Testing Test Measurements • Boost Circuit – Power Electronics • Characterization Testing • • Buck Circuit / Charge Controller • • Add new Buck Converter with Characterization Testing Testing and Fully Operational Results and Documentation – Testing • Experimental Isolated Component Testing Market Review Report and • Market Review Report and Presentation Midterm Progress ReviewTesting Results Presentation • for non-critical loads. control feedback capability. Isolated Presentation • Apply automated demand response / MPPT- Power Electronics Full System Simulation • Midterm Progress Review- Testing Results Presentation Feature Report and Presentation • 37 Deployable Prototype Review- Feature Report and Presentation CpE190/EEE193A SENIOR PROJECT CSUS PROF. TATRO MAY 5th, 2014 • Deployable Prototype ReviewPresentation • Final Documentation • Final Team Presentation • Weekly Progress Report 18 • Weekly Progress Report 19 • Weekly Progress Report 20 • Weekly Progress Report 21 • Team Leader 2 • Team Lead 2 Outgoing Report • Team Eval 3 • Fundraising and publicity kickstarter research Hours worked by Matthew Yamasaki-209 XIV. DEPLOYABLE PROTOTYPE RISK MANAGEMENT Just as with the Laboratory Prototype, we needed to do some risk assessment and management for the Spring 2014 for the new tasks that have been developed from the WBS and needed improvements. This section will discuss the assessment and mitigation of risk for deployable prototype during the Spring 2014 term. A. Deployable Prototype After development of the small-scale laboratory prototype, we moved onto the deployable prototype stage. The deployable prototype stage required us to examine how and where the prototype will be used and acclimating it to the conditions where necessary. As ours is a small-scale model, getting this system installed and running in Uganda, Africa will be vastly different from deploying a full-sized system. Shipping costs, local resources and import tax will all be factors surrounding 38 the full scale system. These issues wouldn’t arise for our small-scale system as the “bigger ticket” items can be sourced in a nearby village in Kampala and the smaller devices can be packed in a carry-on bag on the flight over. While performing device testing of the deployable prototype, we noticed an added risk to our system. The laboratory prototype was designed with a diode to control load support. In other words, when the PV can supply enough power to both charge the battery and power all electrical devices connected on the non-critical load bus, the diode prevents the battery from discharging by maintaining a voltage on the output of our battery-connected boost converter that is less than the forward bias voltage of the diode connected to the noncritical load bus in parallel with our PV. Once the power consumed at the noncritical load bus starts to exceed maximum power generation of our PV, the diode becomes forward biased and the battery and the PV both contribute to power these non-critical electrical loads. This is where the issue occurred, since the PV contains large diodes that prevent any current from back feeding into it, the current generated from the battery to load support didn’t loop through our ground and added to the PV current in supplying the buck converter that charges the battery. In order to mitigate the risk associated with this additional current loop, we added another diode that only allows current to flow from the battery to the non-critical electrical loads and blocks any current from feeding back towards the PV and input of the buck converter. Additionally, we had hardware upgrades in mind to swap out the initial buck converter/maximum power point tracker/charge controller for a similar type CpE190/EEE193A SENIOR PROJECT CSUS PROF. TATRO MAY 5th, 2014 converter that was equipped with closed loop control. After running into a situation where one of the new converters wasn’t outputting the proper voltage, we began troubleshooting and accidentally destroyed the board. Our backup plan was in the form of a different converter that was already on order. Once the new DC/DC Buck Converter board arrived, we had the ability to control the maximum power point feature by automating the control of the output voltage and running the perturb and observe method to maximum power point track. A week before our deployable prototype presentation, we were still ironing out some kinks that prevented us from staying on the curve of maximum power for our PV, it was decided that due to limited time and an unknown quantity of required time to complete the automated maximum power point tracking that it was best to go with the old buck converter and manual control since we had already capably reproduced the maximum power point tracking feature with great success. It would appear as though the best plan to assess risk is to keep a backup plan ready at all times and never get married to the hope of one specific design working flawlessly. Most things don’t seem to go according to plan and properly assessing risky situations is beneficial in contributing to the mitigation plan. 39 CpE190/EEE193A SENIOR PROJECT CSUS PROF. TATRO MAY 5TH, 2014 XV. MARKET REVIEW While our DC microgrid design was tailored to TICC and the specific load requirements at the school in Toggo, research was completed to see how such a design fit on the world stage. This was to compare what currently exists, how big is the market for such a design, and how it would be funded. B. Electricity Market Size amongst Asia, Africa, Latin America, and the Middle East. Asia currently has the most residents, in terms or raw numbers, without access to electricity with 809 million people; however, Africa has the highest density of people without electricity. In fact, Africa is the only continent on this list that over time the population size without electricity has increased over the years. Figure 1 shows the population without access to electricity from 2002 through 2008 [5]. The 1.25 billion people without access to modern energy are generally spread 1200 Population without Access to Electricity Developing Asia Population Amount (Millions) 1000 800 South Asia 600 Africa Sub-Saharan Africa 400 China and East Asia 200 North Africa Latin America Middle East 0 2001 2002 2003 2004 2005 Year 2006 2007 2008 2009 Figure 23: Population without access to energy from 2002 through 2008 C. Localized Market Size: Regional Trends, Climate, and Saturation Figure 1 shows the trends of electrification of developing countries from 2002 through 2008 as a whole, but does not 40 account for what types of electrification is taking place in these countries. This implementation of modern energy generally consists of multiple types of energy generation systems including development and installation of power grids, the CpE190/EEE193A SENIOR PROJECT CSUS PROF. TATRO MAY 5TH, 2014 implementation of renewable energy generation, including wind, hydro, and solar, as well as a combination of power grids and renewable energy. For the purposes of this market research we are interested in markets that need, or could benefit from solar energy generation. As such, one important factor is regional climate. By breaking-down the energy data of these nations into regional countries and examining their local climate and energy usage patterns we can get a better estimation of our true market size. 1) Asia Developing Asia includes China, India, Indonesia, Malaysia, Philippines, Singapore, South Korea, Taiwan, Thailand, and Vietnam. From the graph in figure 1 it is clear that there has been great emphasis in recent years on electrification of this nation as it has decreased the amount of people without access to modern energy from just over 1 billion to just over 800 million in the span of 5 years. However, given the vast territory and sheer number of people, Asia still has a long way to go in their quest for electrification. The majority of the 41 electrification in Asia has been in China, Thailand, and Malaysia which each have over 99% electrification rates [6]. However, South Asia, which includes Bangladesh, India, and Pakistan doesn’t have a country with over a 60% electrification rate; this alone accounts for 564 million people without access to modern energy. The Eastern part of Asia, including Cambodia, Indonesia, and Myanmar, total another 100 million people that are in need of electricity. Given the fact that Asia’s climate is ideally suited for solar energy production and China accounts for at least 63% of the world’s solar panel productions it is peculiar that so many in this region are without electricity. China has nearly 100% electrification rate and were among the leaders of installed PV systems last year; however, the rest of Asia and the 664 million people without access to electricity could greatly benefit from solar microgrid installations. Figure 2 shows a solar radiation map of the world detailing yearly average energy that could be harnessed through solar panels [7]. CpE190/EEE193A SENIOR PROJECT CSUS PROF. TATRO MAY 5TH, 2014 Figure 24: Average global solar energy produced throughout the year. Picture from GreenRhino.com According to NREL and Green Rhino Energy, Asia has a yearly average of ௐ approximately 182-285 మ of solar irradiance throughout each day. This means that Asia could potentially generate 1600ௐ 2500 మ per year. This assumes solar panels with 12%-16% efficiency mounted flat. In other words, this energy generation would be more than enough to power all of Indonesia. In fact this ranks them one of the best suited places for solar energy production. 2) Middle East Another region that has great potential for solar energy generation is the Middle East. This region includes: Iraq, Yemen, Saudi Arabia, Syria, United Arab Emirates, Israel, Jordan, Palestine, Lebanon, Oman, Kuwait, Qatar, and Bahrain. The Middle East and North Africa (MENA) control about 57% of the world’s proven oil reserves and 41% of proven Natural Gas reserves [8]. As a result, the Middle East has made dramatic increases in the access to electricity for its inhabitants in recent years 42 and are nearly fully electrified with the exception of Yemen and Iraq. They still have 61.2% and 15% of their population without electricity which amounts to 21 million people. However, even with control of valuable energy producing resources there is still a great push for renewable energy, namely solar, in the Middle East. For example, Saudi Arabia has begun construction on a 10 Megawatt PV parking lot, the largest in the world, and have projected generating 16 GW of solar energy by 2032 [9]. Given the population in Yemen and Iraq that are underserved and the fact that the middle east gets about 3000 solar hours per year, the Middle East still remains a viable market for solar microgids. 3) Latin America Latin America consists of 26 countries including Brazil, Mexico, Columbia, Argentina, Peru and Venezuela. As far as electrification rates South America has one of the best at 92.7% on the list of developing countries. Those that still lack access to electricity are generally concentrated in Peru, Bolivia, Haiti, and Brazil. These CpE190/EEE193A SENIOR PROJECT CSUS PROF. TATRO MAY 5TH, 2014 countries represent a total of 34 million without electricity. However, even in these countries, the lack of access is generally a rural problem as the urban areas have been electrified. Furthermore, Latin America has invested heavily in integrating energy all over and even those countries without access already have plans in place, such as "Luz Para Todos" in Brazil, the "Plan Nacional de Electrification Rural" in Peru, and "Electricidad para Vivir con Dignidad" in Bolivia [6]. Latin America generally has good solar radiation. According to figure 2, with the exception of parts of Chile and Argentina ௐ (only 500 to 800 మ per year), most of the conducive to grid expansions. 4) Africa countries get an average of 1500 to 1700 ௐ మ per year with Brazil and Mexico getting ௐ upwards of 2000 to 2500 మ per year. This makes solar microgrids a very viable option for this region, and in fact, that is what most of the rural electrification plans are calling for. This is mainly due—aside from sunshine and wind—to the fact that the densities of the rural areas are not Africa is one of the world’s largest land mass continents and also has the world’s densest population without electricity and energy standing at about 590 million. North Africa has extremely high rates of electrification with nearly 100% electricity access; however, Sub-Saharan Africa makes up 99.6% of the population without access to electricity. It also happens that the majority of Africa’s population is within the Sub-Saharan region. The graph in figure 1 also shows that Africa is then area where the amount of people without access to electricity has increased over time. In fact, the World Bank projects 645 million Africans to not have access to electricity by 2030 if current trends remain. These continuing trends underscore the political instability in Africa and without political backing the infrastructure gaining access to electricity in rural areas that can keep pace with population growth will be 100.0% 90.0% 80.0% 70.0% 60.0% 50.0% Urban 40.0% Rural 30.0% 20.0% 10.0% 0.0% Africa Asia 43 Figure 25: Rural vs urban electrification rates Latin America Middle East CpE190/EEE193A SENIOR PROJECT CSUS PROF. TATRO MAY 5TH, 2014 next to impossible. International concern, and cooperation with African governments, however, has led to launching many energy programs. Most of these programs—at least funding for these programs—have been used for current grid expansion in urban areas such a Kenya and Ghana despite Africa being rich in natural resources such a solar radiation. The solar radiation in Africa is among the highest in the world. Figure 2 shows that nearly all of Africa is averaging 2500 ௐ మ per year and that the lowest amount approximately 1800 ௐ మ per year in a few places. This would be ideal for solar system installation. Furthermore, due to the dense rural areas that encompass most of Africa, microgrids could potentially be far more beneficial than grid expansion projects and will likely find a large share of the market in Africa. D. Rural vs. Urban Disparity: The Renewable Microgrid Solution Even in developing countries, urban areas tend to be electrified fairly well; it is the rural areas that are often neglected and in danger of being forgotten. For example, Africa has an urban electrification rate of 66.8% compared to 22.7% for rural area; Asia has a disparity of 93.5% to 67.2% and the Middle East and Latin America are not much better coming in at 98.7% vs. 70.2% and 98.5% vs. 70.6%. Figure 3 shows a bar graph comparison. 44 Some of the reasons that this disparity exists are because of funding, politics, and environmental layouts. Most funding for energy for developing nations gets funneled into urban areas because it’s determined that there it could do the most benefit for the nation. For Example, in Asia, China’s, Thailand’s and Malaysia’s urban areas are considered to be technologically important, or support the country’s economy through tourism, or a combination; therefore, in these countries their urban sectors are near 100% electrified. Another reason that there is such gross disparity between rural and urban rates is that politically, and historically, rural areas never held as much power as their urban counterparts. Finally and maybe most importantly, is the fact that rural areas are expansive, and often times dense and doing energy expansion projects, particularly grid expansion is very costly. And, without the proper infrastructures and financing for maintenance these projects would not be very cost efficient either. E. Renewable Microgrids Can Help Rural Areas Gain Access To Electricity Cost, both financially and environmentally, are prohibitive in bringing electricity access to rural areas through grid expansion projects; however, renewable energy microgrids can help mitigate both these costs. Figure 4 shows financial cost estimation for grid expansion in selected countries. CpE190/EEE193A SENIOR PROJECT CSUS PROF. TATRO MAY 5TH, 2014 Cost (US Dollars) per Kilometer Mali Sengal Kenya El Salvador Laos Bangladesh $4,000.00 $6,000.00 $8,000.00 $10,000.00 $12,000.00 $14,000.00 $16,000.00 $18,000.00 $20,000.00 Figure 26: Cost per kilometer to expand grid in selected countries Bangladesh has the lowest cost here at nearly $7,000.00 per kilometer. This cost includes labor, and materials, but it is clear that running lines through expansive rural areas can become very costly very quickly. And, this cost does not include the cost of clearing dense areas; financially, or environmentally. Power Grids are a dirty energy produce. That is, they produce much greenhouse gasses that harm the environment. Scientific American estimated that if underdeveloped nations were granted power grids, we would see a 17% rise in greenhouse and other toxic gasses released into the atmosphere [10]. Not only would this have severe impacts on economic of the world, it would also counter many of the health benefits that these underdeveloped countries would see by gaining access to electricity. 45 Solutions to both the environmental and financial costs of grid expansions are renewable microgrids. By installing microgrids, there is no need to run expansive power lines throughout an entire country. These power grids would be localized to their community. This saves money in materials, and keeps most of the dense vegetation intact which often supports wildlife and the local population. Making these microgrids out of a renewable energy source further saves costs and lessens environmental impacts as the carbon emmissions from renewable sources are drastically lower than electricity generation through combustion such as power grids historically use. The World Bank conducted cost analysis of microgrids that were powered by diesel fuel and ones powered by solar energy with diesel fuel as only as backup. Figure 5 shows the cost of both systems overtime. CpE190/EEE193A SENIOR PROJECT CSUS PROF. TATRO MAY 5TH, 2014 Figure 27: Cost over time of PV microgrids and Diesel microgrids. Courtesy of http://www.ruralelec.org The long term price of a solar microgrid is actually more cost effective than combusting fuel with a breakeven point of about 10 years. Furthermore, the carbon emissions from PV are far lower. Additionally, this price for PV will only lower as time continues while the cost for fossil fuel is sure to increase as resources run lower. Installing a solar microgrid, such as the one we have designed for Toggo International Children’s Center in Uganda Africa would provide many benefits over grid expansion, and could easily be installed in the rural areas of the developing countries discussed which gives a primary market size of 1.275 Billion people globally which account for 85% of the total people without access to electricity. F. Secondary Markets In addition to 1.4 billion that lack any access to electricity there are an additional 1.1 billion people that rely almost solely on combusting fuels and biomass for food and 46 cooking. These people could also use renewable microgrids to cut down on carbon emissions and improve overall health. According to the ‘Clean Cooking Agenda’ study conducted by the IEA, biomass combustion for cooking results in 3.5 premature deaths a year [12]. This issue is the most prevalent in India, and Africa, but can also be applied to electrified countries such as China, where air pollution is heavy. Other smaller secondary markets that would be worth more time and research are off-grid projects for the United States such as disaster relief. During Hurricane Katrina a complete electricity blackout occurred in New Orleans and many were shuttled to the Super Dome, which also had no power. In this confined space, tempers flared, diseases spread, and people perished. All of which could have been mitigated with proper electricity that could have been deployed from a modular microgrid such as ours. CpE190/EEE193A SENIOR PROJECT CSUS PROF. TATRO MAY 5TH, 2014 G. Financing of Energy Access One of the peculiarities and ironies with our market is that underdeveloped countries are inherently poor and they cannot afford the very thing that will aid them the greatest in overcoming their poverty: energy. Therefore, financial assistance must come from outside organizations and governments. One of the largest backers and supporters of expanding energy access is the World Bank. In 2012 the World Bank financed $3.6 billion for renewable energy projects. 84% of this was for power generation projects [13]. From 2007 to 2012 the global finance market for renewable energy reached $49.2 billion. The World Bank accounted for $12.5 billion of this total. While some of these projects went to support other forms of renewable energy one such project that was financed was an off-grid household solar initiative in Bangladesh. $172 million dollar grant was used to support installations of 630,000 solar home installations and other microgrid systems. This is part of the Rural Electrification and Renewable Energy Development Project (RERED). Over 1.4 million solar systems have been installed in rural homes not connected to the grid. Other large scale projects were financed including grid tied and grid supported renewable energy projects. $50 million and $200 million in World Bank financing went to South Africa’s first large scale wind and concentrating solar power plants. Of the $12.5 billion financing since 2007 $875 million has gone directly to solar PV systems. Lending to sub Saharan Africa since 2007 was $2.1 billion [14]. It is clear the financing is available for both large and small scale renewable energy projects and the World Bank expects this market to grow to 300 billion dollars. 47 The global banking establishment also seeks to fund NGOs who are setup to help pave the way for renewable energy adoption. The AFREA is one such organization and their objective is written in their mission statement. “The Africa Renewable Energy and Access program (AFREA) was established in 2009 to help meet energy needs and widen access to energy services in Sub-Saharan African countries in an environmentally responsible way.” One initiative of the AFREA is called Lighting Africa. Lighting Africa helps speed up the adoption of off-grid lighting technologies for households and businesses. They want to reach 250 million people by 2030. Lighting Africa works to certify clean energy mobile lighting systems. They provide the lights along with the knowledge of how to properly use them. Africa Electrification Initiative (AEI) is another group that works to supply information and training for local energy agencies, government ministries, communities, and utilities. They work with practitioners for the design, development and implementation of rural, urban, on and off-grid electrification programs. These initiatives help transfer the needed knowledge to make these renewable energy technologies successful in the regions to spur growth in the local economies. [15] As local economies begin to learn to utilize renewable energy by lengthening productive working time for work and education the economic potential of these regions being to attract investors. Not only is there enough money to fund renewable energy projects there are organizations that are supporting the transfer of knowledge about renewable energy to the developing world. These markets are seen as potential investment CpE190/EEE193A SENIOR PROJECT CSUS PROF. TATRO MAY 5TH, 2014 areas because the growth potential is incredible by of the lack of grid connections. The local markets are already demanding more renewable energy products and systems to supply the needed energy for business, education, and household use. As demand grows so will the need for more powerful systems that remain simple to use. A microgrid that is highly efficient and automatically adjusts to demands while maintaining critical loads and informing the user about its current state could see wide spread adoption especially in remote regions beyond possible grid tie locations. H. Organizations that Contract and Install Energy Expansion Projects With the financing in place, it now remains that the contracts and installation 48 of these energy exapansion projects take place. Many of the projects funded by the World Bank and other NGO’s are often given to local contractors to help boost the area’s economics while granting them access to energy; however, other projects funded by governments and special interests groups are usually contracted with known installers. While not our primary concern as we have a single user project and a client already lined up, we wanted to take a look at some companies that were receiving these contracts and doing the installations. Table I and II list some of the recent energy expansion and electricity access projects in the last couple years throughout underserved nations. CpE190/EEE193A SENIOR PROJECT CSUS PROF. TATRO MAY 5TH, 2014 Table I. List of Energy Expansion Projects by Company, Dollar Amount, Size and Location Contractors Funding Organization Juwi Department of Energy-Republic of South Africa United Nations Industrial Development Organization (UNIDO) United Nations Industrial Development Organization (UNIDO) Sunlabob Renewable Energy Sunlabob Renewable Energy Sunlabob Renewable Energy United Nations Industrial Development Organization (UNIDO) Contract Amount (USD) $118M Size Installation Location 86MW Prieska, South Africa Not Specified (12)-5KW (1)-16KW 76KW Total 53KW Total Sierra Leone, Africa Not Specified Not Specified 20KW Bo, Sierra Leone Kpandebu, Sierra Leone Pujehun, Sierra Leone Liberia Table II. List of Energy Expansion Projects by Company, Dollar Amount, Size and Location Contractors Funding Organization Sunlabob Renewable Energy United Nations Industrial Development Organization (UNIDO) Japan International Cooperation Agency (JICA) Nigerian Government Vodacom Farmers of Vleiland Valley Sunlabob Renewable Energy Foundation Energies pour le Monde ("World Energy Foundation") New Zealand Aid Programme PowerSmart 49 Contract Amount (USD) Not Specified Size Installation Location 15KW Ganta, Liberia $7.84M Not Specified Nigeria, Africa Not Specified Not Specified Vleiland Valley Western Cape, South Africa Ban Houaypha, Luang Prabang, Laos Tokelau (Territory of New Zealand) 6.5KW $6.3M 1.411MW CpE190/EEE193A SENIOR PROJECT CSUS PROF. TATRO MAY 5TH, 2014 As we can see these projected are varied geographically and have a lot of money at stake. However, even though many of the contract amounts were not specified, there is still plenty of money left on the table for a new flexible and smart PV micro grid from a market that is currently over $50 billion and expected to grow significantly. I. Market Review Wrap-up In developing our renewable DC microgrid for TICC, in Uganda Africa we knew that we had a solid product that was flexible and automated; however, in conducting this analysis research we learned just how big of need there was for a product like ours and how much our product could truly help society. A PV microgrid such as ours can help mitigate the tragic effects of poverty that 25% of the world suffers from. Our system can provide electricity which can then be used to boost education levels by providing lighting that allows for night time studying. Additionally, the electricity that we provide can mitigate ill health effects from combusting fuels that people currently use for lighting and cooking. Additionally, as a renewable microgrid, installation in rural areas, which need them the most, will be easier with less adverse effects. By having our system deployed as modular localized systems, there need to clear vegetation is much less which leaves most of the life sustaining landscape intact. Furthermore, our system will avoid most of the carbon emission that are inherent in traditional power grids that generate electricity. This means that most of the health benefits from electricity will not shrink. 50 The need for this type of electricity generating system cannot be overstated. This is evident by the market size. Of the 1.4 billion people without access to energy, 1.275 billion are in rural areas. This is what makes our market size. Additionally, another 1.4 billion people could benefit from converting to solar energy from biomass which are bad for the environment and for the health of the individuals who use them. In order to get these people access to the electricity that they need an estimated 300 billion dollars will be needed. The World Bank has already funded nearly 50 billion dollars, and plans to fund much more. NGO’s and governmental agency are also contributing funding to these projects, viewing them as investment opportunities. Thus, it is clear that this is a huge market with a lot of potential money to be earned. There are already massive efforts and competition; however, a flexible, automated solar energy microgrid is what is needed, and also what is in demand. XVI. USER MANUAL The Team 5 DC Microgrid is a laboratory prototype that demonstrates the feature set of our proposed project. It features a design allowing the user to directly power electrical equipment from the Photo Voltaic (PV) energy while protecting and supporting the PV intermittency with battery energy storage when needed. This allows for better efficiency and reliability by removing extra circuitry between power generation and electrical equipment. The system is equipped with maximum power point tracking to extract the most energy from the PV and send it to the battery charger or to CpE190/EEE193A SENIOR PROJECT CSUS PROF. TATRO MAY 5TH, 2014 the connected electrical equipment based on how much power is being used. The microgrid is actively monitoring voltage and current in the system to track PV energy generation, state of charge of the battery, and connected power demands. This allows the system to intelligently provide a demand response to turn off equipment in order to protect the battery and the equipment that requires power at all times. This is a Direct Current microgrid with the power electronics needed to connect various types of DC based equipment. If a particular type of DC equipment needs a certain voltage rating the system can be equipped with additional DC voltage regulators to support this electrical equipment. If AC power is needed, an AC inverter can be connected to the microgrid to support this kind of equipment. The microgrid comes with a wireless network, web based server, and graphical user interface allowing the user to connect to the microgrid and view current and historical information about its operation. This information is intended to be used by the user to understand their electrical equipment and power consumption as well as to make is easier for the user to maintain the microgrid. Listed below are the nominal ratings and specifications of the microgrid listing the size and power ratings of equipment that can be connected to the microgrid. Solar Panel • Battery 51 100 Watts PV Generation (Vmp=18.5, Imp=5.41) • Deep-Cycle Lead-Acid Battery Chemistry 12V rated 109Ah capacity. Buck Regulator/Charge Controller (Maximum Power Point Tracker) • Buck Topology; Input Voltage:740V; Output Voltage: 12-14.5V; Output Current: 8A Max Boost Regulator with Load Support Diode • • Boost Topology; Input Voltage:1032V; Output Voltage: 16.5V; Output Current: 8A Max 130W Power Diode; Max. Current: 6A Max Embedded System and Data Acquisition Voltage Regulator (Critical system equipment) • Buck Topology; Input Voltage:430V; Output Voltage: 12V; Output Current: 8A Max 100W Electrical Equipment Voltage Regulator (Non-critical equipment) *can be turned off by the system • Buck-Boost Topology; Input Voltage:6-32V; Output Voltage: 12V; Output Current: 15A 150W A. Hardware Setup and Wiring The microgrid prototype must be wired correctly in order to function. First verify that each of the hardware components listed above are included in your system. All sensors must be connected to the correct locations for proper system monitoring. In the event your microgrid is not delivered pre-wired please follow the following pictorial wiring guide in Figure 28. CpE190/EEE193A SENIOR PROJECT CSUS PROF. TATRO MAY 5TH, 2014 when too much electrical equipment is connected or PV generation is too low to support it. D. Maximum Power Point Tracking Figure 28: Hardware Wiring The microgrid supports max power point tracking through the buck regulator circuit. The max power point tracker is setup to support a good range of PV conditions. Turn the constant current potentiometer on the buck regulator to adjust the output current until the max power point is reached. B. Electrical Equipment Connection E. Critical Electrical Equipment You may connect your electrical equipment to the board as desired. It is recommended you connect most of your electrical equipment to the non-critical electrical bus that supports demand response and only the most necessary electrical equipment like refrigeration and security lighting to the critical electrical bus. As a rule of thumb to keep the current draw from the critical electrical bus low, take 70% of the battery capacity of the system divided by 24 hours to give you the estimated number of days per amp drawn the system can run without PV generation. For instance if you have a 100 amp hour battery, take 100*70 divided by 24 hours to give you 3 days of runtime with 1 amp draw and no PV generation. This applies to the critical electrical equipment only. The non-critical electrical equipment will be turned on and off based on the state of charge of the battery and the available PV generation. The microgrid has its own equipment connected to the critical electrical bus. These items include the router, microcontroller, and computer web server. The AC inverter is also connected to the critical electrical bus to support the AC refrigeration unit. C. Charging Switch The charging switch on the microgrid controls the battery charging mechanism. When excess PV generation is available turn the switch on to begin charging the battery. Turn off the switch 52 F. Non-Critical Electrical Equipment The microgrid is setup to supply 12 volt DC electrical equipment. To connect additional equipment to the microgrid, connect the positive and negative wires to the voltage regulator terminals. To connect additional voltage levels, connect the voltage regulator to the non-critical electrical bus and insure it is capable of 16V22V input voltages. G. Software Setup The DC microgrid comes with a wireless router and web server (installed on a Raspberry Pi) to make it easy for the user to see what is happening with the system. The graphical user interface displays graphs of historical information about PV generation, the state of charge the battery, and how much power is used. The user needs to use a Wi-Fi capable device with CpE190/EEE193A SENIOR PROJECT CSUS PROF. TATRO MAY 5TH, 2014 web browser such as a laptop or tablet to view this information. H. Connecting to the Energy Monitor Server widgets, and visualizations needed. For more help and information on Dashboard setup please visit www.emoncms.org/site/docs/dashboards Connect your device to the Wi-Fi network called Team5. This network will not have internet access and is meant to act as an internal network. Network Name(ssid): Team5 Password: johnnyfive Open your web browser and type http://embeddedSystemIPaddress/emoncms (e.g. 192.168.1.252 see image below) Use Username: raspi Figure 30: Energy Monitor Dashboard Use Password: raspberry 6) Viewing Data from Voltage and Current Sensors Viewing raw data from the system requires more advanced computer skills so instructions here are useful for someone with experience with Linux operating systems You can use PuTTY (from a Windows Computer) or a Terminal to SSH into the web server using the following credentials (see image below): Figure 29: Energy Monitor Login Screen 5) Viewing Dashboard You can customize and setup the Dashboard to display the information you need(see Figure 14). To setup the Dashboard you have to be logged into the Emoncms via a web browser. Click on the Dashboard tab and add the text, containers, 53 pi@embeddedSystemIPaddress Username: pi Password: raspberry CpE190/EEE193A SENIOR PROJECT CSUS PROF. TATRO MAY 5TH, 2014 window you can kill the crontab job and you can run the script manually using the following commands: <pi@raspberrypi> sudo ps aux | grep serialtest.py Figure 31: PuTTY Configuration Once you are logged in the date should automatically be set up to the current time, due to the real time clock installed and connected to the raspberry pi. Since the embedded system does not have a real time clock it does not keep the time while is powered off. We use the time un order to run certain algorithms and calculate energy throughout the system, therefore current time is very important. There is a crontab schedule that runs at reboot and sets the time to the current time. In order to make our system more reliable and automatic, there is a root crontab job calling our python script (serialtest.py) to run as soon as the Raspberry Pi (webserver) is powered up. The python scripts are located in home directory of user “pi” The serialtest.py script (running on the raspberry pi) receives serial data from the chipKIT Max32. (More information on chipKIT Max32 and data acquisition can be found under Microcontroller Software paragraph.) The serial data received is parsed, calibrated, and sent to the MYSQL database running on the embedded system (Raspberry Pi). To see the datastream(serial data) from the microcontroller in your terminal 54 This will output the following if the scrip is running: root 1777 1.0 1.1 11188 5784 ? S 23:35 0:01 python /home/pi/serialtest.py To kill the process you need the process ID number which in this case is 1777 (this will be different every time the system is rebooted). Type the following command to kill and run the serialtest.py script manually: <pi@raspberrypi> sudo kill 1777 <pi@raspberrypi> sudo python serialtest.py 7) Connecting to PhpMyAdmin PhpMyAdmin is a handy web interface for managing local MySQL databases, and can make database queries, management and backups easy. To connect to it, open a web browser, and type the embedded system IPaddress /phpmyadmin (e.g. 192.168.1.100/phpmyadmin). Username: root Password: root CpE190/EEE193A SENIOR PROJECT CSUS PROF. TATRO MAY 5TH, 2014 8) Demand Response Scripts we did not cause irreparable damage to our For demonstration purposes the Manual Python script can be run to cycle the non-critical electrical equipment. equipment since we did not have other Automated Demand Response Python script is running in the background at startup. It reads the emoncms2 database for the state of charge of the battery in amp hours. Once the threshold is reached the demand response is triggered turning the electrical equipment off. performance so we proceeded with our 9) Microcontroller Software The microcontroller is a Max32 based on the chipKIT platform by Digilent. The firmware installed reads the voltage references, current sense resistors, and Hall Effect current sensors. It reads seven values, one time per second, from the 10-bit ADC and sends the 0-1023 values for each pin over serial to the Raspberry Pi. reference designs to go off of. The results from our test plan showed acceptable design. The next step was to confirm our results from the load support system. We needed to make sure the PV would still supply its power to the loads with an over loaded situation and the remaining power would be supplied to the battery. The figures below illustrate the simulation of a PV array, battery, and diode with varying load conditions. It shows that we are able to extract max power from the PV and support larger loads with battery support. 10) Troubleshooting – Rebuild from scratch If the SD card fails and it does not reboot, please refer to a guided tutorial reference document. This document is basically a compiled list of steps and taken from Raspberry Pi website, Emoncms, ModMyPi.com, rohankapoor.com, and dingleberrypi.com named SD Card Installation Manual. XVII. DESIGN CONCEPT SIMULATION The bulk of the testing for the laboratory prototype dealt with testing Figure 32: Load Support Simulation with Diode Reverse Biased This figure shows a 6 ohm load individual pieces to insure they will connected to a model of a PV array. All interface as we expect. Since we could not power to the load is being supplied to the find additional references to our particular resistor by the PV so no power from the design of having the PV interface directly battery is wanted or required. As the load with the power electronic regulators, we increases the battery will supply the tested these circuits independently. The main reason for this testing was to insure 55 CpE190/EEE193A SENIOR PROJECT CSUS PROF. TATRO MAY 5TH, 2014 remaining current needed by the load as seen in the next figure. Figure 34: Load Support Simulation with Battery Supply Figure 33: Load Support Simulation with PV @ Max. Power This figure shows the load is set Now the load was set to 3 ohms requiring more current. The max current is still being supplied from PV array but the right when the diode is forward biasing. remaining current required by the load is This determines the voltage at the main bus being supplied by the battery. and max power is still being extracted from the PV array. 56 I. Design Modifications Our initial interface testing showed promising results so we proceeded to assemble the complete design including the PV, buck charger max power point tracker, and boost load support systems. During our initial assembly and testing the system worked as designed when the microgrid was performing the battery charging task. We were able to maximize PV generation and charge the battery and run power to our loads. A problem arose when we tested the load support system by applying larger loads then the PV could support alone. We tracked down a current loop between the output of the boost support to the input of the buck charger that was the input to the boost support system. This current loop was caught by buck circuit short circuit current protection but our design needed a CpE190/EEE193A SENIOR PROJECT CSUS PROF. TATRO MAY 5TH, 2014 modification to eliminate this potentially destructive effect. We determined that the battery charging system and the load support systems are mutually exclusive and we should never be charging the battery and running the load support systems at the same time. We included and isolation switch on the charging circuit and would only turn it on when we had excess power for battery charging. Looking forward to next semester we plan to use an automated system to control the charging circuit based on available energy. When this occurs a lock out system will be put in place insuring these systems remain isolated. XVIII. HARDWARE A. Conceptual Design Plan Our preliminary meetings with the TICC helped us generate our feature set list and we set out to design a system that would meet all these specific goals. Our first step in this process was to layout our design ideas on paper. This first blush was largely idealized which is evident from the original WBS and Design Idea documents. Our original conception was envisioned to be a beefy 500-600 watt photovoltaic system with fully automated MPPT, power flow and energy management with demand response that would engage the consumer and control the (critical) lighting, (critical) refrigeration, office equipment and other loads. To make this idealized system as efficient and flexible as possible we would parallel the solar panel with all power conditioning electronics, battery, and loads. This, in theory, would allow us to provide power to our loads directly from the solar panel with 57 only one power conversion stage (load voltage regulation), when the sunlight was available. Furthermore, using this type of setup, we could bypass our battery when the battery was already full. This greatly extends the battery’s life cycle as we can avoid unnecessary charge and discharge cycles, and avoid the battery blocking the power production from the solar panel when the battery charge is full; these are common issues with other current and widely available photovoltaic systems. As we will see in this documentation, most of these features from our original design idea have been implemented onto our laboratory prototype and those that have not yet been implemented we have a clear path of action to accomplish them well before May 2014. The remainder of this section will discuss the general overview, the hardware, and the software components of the laboratory prototype. CpE190/EEE193A SENIOR PROJECT CSUS PROF. TATRO MAY 5TH, 2014 B. Laboratory Prototype General Power Flow Overview While the features from our set list in our Feature Set Section have all been implemented, the manner of implementation was not always as we originally envisioned. Due to various reasons ranging from resource limitations (time, money, skill, etc.) to safety precautions, some of our original ideas had to be modified in order to be implemented onto our deployable prototype design. However, we have still demonstrated proof of concept with the promised features. Figure 16 shows a block diagram of our current laboratory prototype Figure 35: Block Diagram of Microgrid Power Flow We were able to interface our entire system in a parallel manner as originally envisioned. The basic flow of power in this system starts at the block labeled solar panel and flows to the right. The solar panel provides power, when it’s available from the sun, to our transmission bus which regulates the DC voltage to 12 volts and supplies power to our loads. 58 After the solar panel block, we have a buck regulator circuit. This circuit functions as our MPPT and battery charging circuit. By adjusting the voltage output of the buck regulator between 12 volts and 14 volts (acceptable ranges for charging a 12 volt SLA battery) we can change the impedance seen by the solar panel. When this impedance plus the battery and external loads matches the impedance required for the solar panel to produce maximum power we will have our maximum power point[10][11][12]. The excess energy generated by forcing the solar panel to operate at a maximum point is then used to charge the battery. The battery connects to both a boost circuit, and also our critical load. We connected the critical load bus to the battery for two reasons: The first is so that if anything were to happen to the solar panel, our critical loads could be sustained for a couple days while repairs were made to the solar panel. The second reason is because one of our critical loads is refrigeration, and is AC power; thus, it needs an inverter circuit and it’s usually best practice to connect those directly to the battery to cover the large current spikes inherent in inductive loads. The battery also connects to a boost regulator circuit. This raises the voltage from the 12 volt battery up to the regulated bus voltage for efficient transmission. The diode connected to the boost regulator actually keeps the battery voltage off the bus until it is needed. We set the boost voltage to be 2.5 (two diode voltage drops plus small signal variation room) volts less CpE190/EEE193A SENIOR PROJECT CSUS PROF. TATRO MAY 5TH, 2014 than the known maximum power point voltage of the solar panel; therefore, as long as the sun is shining and the external load requirements are within acceptable limits, the diode prevents any current flow towards the bus. When the sun begins to set, cloud cover, or when the loads exceed acceptable limits, the solar panel voltage will decrease. A decrease of a 2.5 volts or more causes the diode to forward bias and conduct current flow. During preliminary testing at the end of the first semester, we discovered that when the battery diode would forward bias and the load support from the battery occurred we would end up with a current loop where current flowed back toward the panel and into the Buck Regulator. This current would loop to potentially destructive levels unless the charge controller switch was manually thrown to the off position. To prevent this, we installed a second diode shown in figure 16 as current block diode. This has two effects: first, it prevents the current from the battery to travel back towards the solar panel. Second, during battery load support, the current block diode reverse biases which means the solar panel can not send power directly to the loads. However, if the manual disconnect switch remains on, the solar panel will still contribute power by routing it through the battery then to the loads. This is how solar systems are currently typically installed for residential use. This implementation has resulted in a more flexible system that allows power to flow from the solar panel to the loads, routing all the solar panel power to the 59 battery, or disconnecting the panel from the system. The switch between the solar panel bus line and the buck regulator also functions as a high voltage disconnect as well. This switch connects/disconnects the charging circuit from the system. When the external loads are within acceptable limits and the battery can take a charge, this switch is in the on position to connect the charging circuit. When the battery charge is full the switch is turned off to disconnect the charging circuit to prevent any damage to the battery as a result of over-charging. C. Hardware The hardware components that were installed on to the laboratory prototype included those discussed in section 2, that is, solar panel, power conversion circuits, battery, and miscellaneous. Additionally, some other hardware components were implemented which will be discussed are the instrumentation voltage and current sensing circuits. Figure 17 below shows a block diagram model of our hardware. CpE190/EEE193A SENIOR PROJECT CSUS PROF. TATRO MAY 5TH, 2014 we then know that our maximum power will occur when the solar panel produces approximately 18.5 volts as the ܸெ doesn’t change all that much unlike the current production. Figure 18 shows the solar panel installed on our laboratory prototype. Figure 36: Hardware Block Diagram Model 1) Solar Panel The solar panel used for our laboratory prototype is a Ramsond 100 watt mono-crystalline solar panel. The monocrystalline material gives the solar panel a cell efficiency of 17 % and has a longer life span that that of poly-crystalline solar panels. The other essential characteristics of this solar panel are shown in Table I. Table III. Ramsond Solar Panel Characteristics Power 100 W ܸ 22.7 V ܫ௦ 5.55 A ܸெ 18.5 V ܫெ 5.41 A Figure 37: 100 Watt Ramsond solar panel installed on laboratory prototype The solar panel was scaled down from the original 500-600 watt range mainly because of safety and limited resources. The safety concern was having too many amps flowing through our system with its open design. Furthermore, due to limited funding, lowering the wattage and amps of the system allowed us to use the already acquired power electronic circuits which have an average current maximum limit which will be discussed next. 2) Power Conversion Electronics While not noted in the technical data sheet supplied with the solar panel, the ratings given in Table I are usually the rated characteristics under the specific conditions ௐ௧௧௦ of an irradiance of 1000 ௧మ and temperature of 25Ԩ. Using this information, 60 The power conversion electronics consist of the buck regulator, the boost regulator, and the charging circuit disconnect switch. Each will be discussed in detail below. Each of these circuits were CpE190/EEE193A SENIOR PROJECT CSUS PROF. TATRO MAY 5TH, 2014 chosen as a best fit in the face of limited time and funding. Buck Regulator and Charging Disconnect Switch a) The buck circuit used in our laboratory prototype is a DROK 8A constant voltage constant current buck converter. The current limit, voltage inputs, and voltage outputs are listed in Table II Table IV. DROK Buck Converter Specifications Output Current 0.05A-8A Input Voltage 7V-40V Output Voltage 1.25V-36V The operating switching frequency is a fixed 180 kHz and has operating efficiencies up to 90%. Figure 19 shows a photo of the buck circuit with points of interests labeled. Figure 38: DROK Buck circuit used in laboratory prototype In figure 19 we can see the voltage adjustment and current adjustment labels. Using these screws we can set a constant current and constant voltage output by adjusting the duty cycle of the buck circuit. This is used for the charging of the battery. As the battery is low on charge we apply a constant current to charge it and let the voltage float accordingly. As the battery charge increases so does its internal resistance. As the resistance increases the current flow to the battery will decrease. At this point we switch to a constant voltage to finish charging the battery. This is known as Constant Current Constant Voltage charge method. Additionally, by turning the voltage and current adjustment screws, we also track the maximum power point of the solar panel by adjusting the output impedance so that the load equivalent seen by the solar panel is equal to the output impedance of the solar panel as explained above. We 61 CpE190/EEE193A SENIOR PROJECT CSUS PROF. TATRO MAY 5TH, 2014 adjust the output of the buck and then test the power of the solar panel, if the power has raised, we repeat the procedure. If the power decreases, we have passed the max power point and we adjust the buck output back to its previous setting. This is a manual version of the Perturb and Observe method. The boost regulator used in the laboratory prototype is a DROK 150W Power Supply Module. Table III lists the input current, and the voltage input and output ranges. Figure 39 shows the buck regulator installed on our laboratory prototype along with the disconnect switch. Table V. DROK 150 Watt Boost Regulator Specifications Input Current 16A Max Figure 39: Buck Regulator interfaced with Disconnect Switch (in on position) Currently, the charging disconnect switch is a manual throw switch as seen in Figure 39. The switch is wired between the positive solar panel and the buck circuit. Flipping the switch in the direction as shown in Figure 39 connects the buck to the rest of the circuit and allows for MPPT and battery charging. Flipping the switch in the opposite direction disconnects the buck circuit from the system. This is done when load support from the battery through the boost regulator is detected. b) Support 62 Boost Regulator and Diode for Load Output Current 8A Max Input Voltage 10V-32V Output Voltage 10V-46V This boost operates at a fixed 380 kHz switching frequency and has operating efficiencies up to 95%. Figure 40 shows the boost regulator with points of interest labeled. Figure 40: DROK Boost circuit used in laboratory prototype The output voltage adjustment on the boost circuit is used to regulate the CpE190/EEE193A SENIOR PROJECT CSUS PROF. TATRO MAY 5TH, 2014 voltage. We set this value to be around 16.8 volts. This gives us approximately 1 volt below the solar panel’s maximum power voltage of 18.5 volts with some room for changes in the ܸெ of the solar panel due to ambient weather conditions. Figure 41 shows the boost circuit installed on our laboratory prototype and interfaced with the load support diode. Figure 41: Boost Regulator installed on prototype and interfaced with diodes In Figure 22, the diodes connected to the positive output of the boost regulator function to prevent current flow from the boost regulator to the load bus until the load bus voltage from the solar panel falls below the set 16.8 volts from the boost regulator. The voltage from the solar panel will lower automatically if there is not enough sun light, or the load current demands exceed what the panel can produce at it maximum power voltage. If this happens this will cause the diodes to forward bias and allow current to flow from the boost circuit, originating from the battery, to the load bus. c) Battery 63 Energy Storage in the Form of a Some form of energy storage is needed to make the system run more efficiently by mitigating the intermittency of renewable energy. In a standalone system such as ours, energy storage is mandatory in order to provide the client with a useable and flexible system. The addition of a battery as our energy storage element provides a number of benefits. It allows us to operate the solar generation optimally by giving us a place to store excess energy. This excess energy is then preserved until a time when there is not enough sun shine to provide power to the loads. In the event that this occurs (for example, night time), our battery will act as the power source and supply power needed to run all lights, refrigeration, and other equipment. After discussions with the TICC, we opted to go with a sealed lead acid (SLA) battery. The main reason behind this choice is availability of batteries in Uganda, Africa. SLA’s are available to the client and would not present a dire problem if the battery needs to be replaced. The capacity of the battery was chosen based off of the power demands of the equipment that TICC plans to operate as well as enough storage to sustain critical loads for at least two days of no sun light. Figure 42 shows the SLA battery that we implemented on our laboratory prototype. CpE190/EEE193A SENIOR PROJECT CSUS PROF. TATRO MAY 5TH, 2014 Figure 42: Sealed Lead Acid Battery and Variable Power Resistors The battery is wired between the buck regulator and the boost regulator and acts as both a storage for excess energy and a power supply when needed. The scaled down battery implemented on the laboratory prototype shown in Figure 42 is 100 amp hours. This battery serves as our grid and is the basis for the energy management and demand response functions that our system incorporates. By building instrumentation circuits that measure voltage and currents throughout our system, we can know the status of our entire system as it relates to our battery. d) Current and Voltage Measurements The current and voltage measurements are an integral part of the system. The ability to accurately sample voltage and current measurements are the key to providing accurate state of charge measurements for the battery. The state of charge measurements are important in determining when non-critical electrical equipment must be powered down to preserve the battery to provide up to 2 days of battery autonomy. The initial current measurements were sampled using an ACS712 Hall Effect 64 Sensor. These sensors can provide accurate current measurements within specified ranges, typically between 1-3 Amps. While the range of current should suffice for the laboratory prototype, we felt the need to begin working on sensor circuitry for the deployable prototype. For this reason, we sought out a 4-terminal current sense resistor that’s laser trimmed to 1 milliohm. The voltage measurements off the current sense resistor can then be multiplied a thousand to obtain very accurate values of current. The issue with this method is twofold: signal noise and too small of a voltage for our ADC to accurately measure. To rectify this problem, we connected the voltage across the current sense resistor to an instrumentation amplifier with a gain of nearly 500. The results were showed accurate ADC measurements of voltage that were then converted into current with 10% tolerance. This pairing of current sense resistor and instrumentation amplifier was implemented to measure the current flow into and out of the battery and also the DC loads. We implemented the ACS712 Hall Effect Sensor to measure the current from the PV. The voltage measurements were taken using resistive voltage dividers. The value of resistors was chosen to be in the 100kΩ range to minimize power losses. e) Future Work CpE190/EEE193A SENIOR PROJECT CSUS PROF. TATRO MAY 5TH, 2014 system to control the output via the duty cycle with a microcontroller. Doing this, we can automate the Perturb and Observe MPPT algorithm and continuously track max power. XIX. SOFTWARE A. Deployable Prototype General Energy Management Overview Figure 43: Laboratory Prototype, Angled sideview Figure 44: Laboratory Prototype; Front view The major glaring needs for the hardware components are the power conversion electronics. The current setup incorporates manual adjustments for MPPT and charge controlling. These need to be automated. We can do this by purchasing more robust (also more expensive) power electronic circuits. We need these for two reasons: first, we need a more powerful model of a buck and boost system so we can scale up the prototype to 300 watts. Secondly, and more importantly, we need to have an open-loop buck circuit which will allow us to implement a feedback 65 Now that we have gathered the needed information on the voltages, currents, powers, and battery charge of our system we can use this data to create an energy management system. This energy management system is capable of storing the incoming data from the sensors, logging this historical information in a database, displaying it in a graphical user interface for the user, and using this information to make demand response decisions such as shedding loads to prevent complete battery discharge. This makes our microgrid a “Smart Microgrid” as it can adjust itself based on incoming information to increase the reliability and usability of the system. Our microgrid will be able to run without interaction from the user but we have also provided the user with a graphical user interface allowing them to understand their power use in order to make better energy decisions about the kinds of equipment they use and when they use it. B. Software System Overview The software system consists of a Linux based operating system running suite of software to support web based applications. Traditionally this is called a LAMP stack (Linux Apache MySQL PHP) and provides enough features to run an CpE190/EEE193A SENIOR PROJECT CSUS PROF. TATRO MAY 5TH, 2014 open source web application called emonCMS or Energy Monitor Content Management System. The Python scripting language is easy to use and widely supported which is why it was chosen to develop our DAC (Data Acquisition and Control) algorithms. Python acts as the “glue” to connect the various software subsystems together in a cohesive manner. C. Microcontrollers We used a microcontroller based on a processor from Microchip Corporation and part of the chipKIT development platform. It is called the Max32 and is an 84Mhz processor with the ADCs, flash memory, and serial support needed to gather and transmit data to the computer system. The firmware installed reads the analog sensors and sends packets of serial data each second. Figure 45: Python Code Calibration and Storage Flow Chart D. Embedded Computer System The computer system that was chosen for the initial design was the Beagle 66 CpE190/EEE193A SENIOR PROJECT CSUS PROF. TATRO MAY 5TH, 2014 Bone Black platform by Texas Instruments. This platform proved to be difficult to use and was not producing the results we were looking for. We switched our computer system to the Raspberry Pi development platform and while the specifications were not as good, it proved to be predictable and reliable at gathering sensor data, running the webserver, and displaying user data. E. Web Server and Database The webserver and database we used are industry standard open source packages. They were chosen because of previous experience with them and they are required when using the emonCMS application. The Open Energy Monitor intuitive was a great resource to tap into in order to display our energy information Figure 46: Demand Response Flow Chart 67 F. DAC Algorithms Several algorithms were developed to receive our sensor data, calibrate it, and store it in our database. This was the backbone of the energy management system as it provided the tracking mechanism needed to make the necessary energy management decisions. The main control algorithm was coded to read the energy management database at regular intervals and decide to keep the non-critical loads on or turn them off based on the state of charge of the battery. CpE190/EEE193A SENIOR PROJECT CSUS PROF. TATRO MAY 5TH, 2014 occur at 10:00AM local time. The cutoff for generation in the evening has been set to 6:00PM local time. Using the current and voltage measurements from our PV array, we calculate the present power generation for our system. We denote the time on the Raspberry Pi real-time clock and determine how many hours remain until our last point of generation at 6:00PM. The resulting estimation of time in hours is then multiplied by the present power generation to give the user a rough estimate of energy generation until the sun comes out the following day. To account for decreasing irradiance and power as we near 6:00PM local time, we continuously run the script to frequently update the energy generation remaining. The energy generation remaining until next sunlight is then displayed on our graphical user interface and stored on our embedded system, which will later be used to predict energy storage state of charge demand response notifications. Figure 47: Data Acquisition Flow Chart G. Energy Management Algorithms 1) Energy Generation Until Next Sunlight Understanding how much energy our PV array is forecasted to generate over a given interval is crucial for understanding how much power can be consumed and for how long over that given interval. We want to provide the user with feedback relating to estimated energy generation until the next daily occurrence of sunlight. Due to inconsistencies and limited power generation at sunrise, we have referenced our next daily occurrence of sunlight to 68 CpE190/EEE193A SENIOR PROJECT CSUS PROF. TATRO MAY 5TH, 2014 power electrical devices. We compare the energy stored in the battery to a 90% of its rated value to predict a state of charge for the battery. These are one of the values shown on the graphical user interface and stored on the embedded system. The system is continuously performing calculations to display and store the value for energy availability from the battery by multiplying the state of charge by the 90% rated capacity. In addition to the energy generation remaining from our PV, we can now determine a baseline for how much energy is available within our entire system to power electrical devices until next sunlight. 3) Energy Consumption Until Next Sunlight Figure 48: Pseudo Code for Energy Generation 2) Energy Available from our Battery In addition to predicting energy generation, we need an accurate representation of how much energy we can call upon form our battery. While we understand variations in temperature and battery aging contribute to changes in the amount of energy we can draw from our battery, we have tried to account for this decrease by considering an overall efficiency for the battery of 85% and set the limit of energy capacity of our battery to 90% its rated value. In measuring the state of charge of the battery, we perform a method known as coulomb counting while tracking the charging voltage. In this way, we can measure the energy transferred into the battery and estimate we can see 85% of that energy to 69 The last item we need to monitor for complete system autonomy is the predicted amount of energy the system will consume up until we can generate more energy. Keep in mind that we have two separate quantities for consumption, those that are critical and those that are non-critical. We will maintain separation in determining energy consumption, and denote these as critical energy consumption and non-critical energy consumption. We will discuss in detail later why it was important to keep these separate. Using the present power measurements from our critical loads and the Raspberry Pi clock to determine the number of hours until next sunlight (10:00AM), we can multiply the two to get the critical energy consumption until next generation. Likewise, we follow the same steps in determining the non-critical energy consumption. These values are not static, they are constantly updating and based on real-time power consumption of both the critical and non-critical loads. CpE190/EEE193A SENIOR PROJECT CSUS PROF. TATRO MAY 5TH, 2014 Figure 49: Pseudo Code for Energy Consumption Until Next Sunlight Algorithm 4) Demand Response Our problem statement underscores the need to provide reliable electricity to aid health care and education to help members of Toggo International Children’s Center rise out of poverty. It is essential that specific electrical devices have a reliable source of power. These electrical devices include refrigeration for cold-chain medications and ice packs for relieving malaria, security perimeter lighting, and indoor evening lighting. We have started by formulating a baseline for how much energy these critical system components need to be powered until next PV generation. This was achieved by measuring the how much power is being drawn by the critical loads and multiplying by the number of hours until next generation. This value is frequently updated and determines the minimum energy requirements of our system until demand response techniques will need to be implemented to maintain system integrity. 70 By polling the values calculated from the aforementioned algorithms, we have an estimation of how much energy our system can provide until next sunlight. Additionally, we know how much energy is being consumed by each of the critical and non-critical electrical buses. We then use the value for the energy remaining until next sunlight and the critical energy requirement to calculate a value for the battery’s state of charge that we will need to power down other non-critical electrical devices to maintain system autonomy. This value of state of charge is displayed to the user on the graphical user interface given them the flexibility to decide which electrical devices are most important to them at the moment the battery’s state of charge begins to near the demand response state of charge. CpE190/EEE193A SENIOR PROJECT CSUS PROF. TATRO MAY 5TH, 2014 response. Another aspect of the software would be to track the health of the battery by analyzing its charge profile over time and adjusting the available battery capacity to match the actual measured capacity. An alert could be sent to the user when this health is below a certain level to schedule maintenance or replacement. XX. MECHANICAL DESIGN OF DEPLOYABLE PROTOTYPE Our laboratory prototype required a couple of structures in order to be able to effectively demonstrate the design. The main structures that were designed, constructed and implemented were the frames to hold the solar panel and display our lights, monitor and other electrical loads that we powered with our laboratory prototype. Figure 50: Pseudo Code for Demand Response The structure for the solar panel was built using aluminum “L” brackets that H. Software Improvements have holes predrilled throughout the length Currently our demand response algorithms use a simple threshold with hysteresis in order to turn on and off our non-critical loads. We can do much better especially with the power of a database full of the voltage, current, power, and charge over time of the entire system at our fingertips. By taking the rate of change of our battery’s state of charge along with a projected amount of energy remaining for that day we can calculate how far into the future the battery will last. If this is sooner then we want we can decide to turn off the non-critical loads. Other algorithm ideas include using more historical data to influence when we provide demand of the bracket. We used 4 “L” brackets each 71 with a length of 4 feet. Using two brackets we mounted them length wise on the back of the solar panel. The other two brackets were bolted to the end of the first two brackets to create an adjustable modified “A” frame that can open and close. In between the “L” brackets in varying spots 2 feet rods were placed to brace and support the overall frame. All nuts and Bolts used were ¼ inch. The modified “A” frame with the solar panel mounted is shown in Figure 1 which depicts a side view and Figure 2 which shows the back side mounting. CpE190/EEE193A SENIOR PROJECT CSUS PROF. TATRO MAY 5TH, 2014 Figure 51: Side View of Solar Panel Structure more aesthetically appealing view. For this new structure, a cabinet was built to display the lighting and monitors while the inside of the cabinet houses the battery, and all the wires to keep them from being exposed. Figure 53 and figure 54 show the display cabinet as of the time of this writing. This cabinet has the dimensions of 30in X 48in X 12in for the width, length, and depth respectively. The cabinet is also mounted on top of four caster wheels which afford it more mobility. The entry doors to get inside the cabinet is located on the backside and attached with 6 piano hinges. Figure 52: Back Side View of Solar Panel Structure The original display that held our lights, monitor, and other electrical loads was constructed in a very similar way as the solar panel structure. The same “L” brackets were used except this time a 4’ x 3’ plywood board was used to mount the “L” brackets. Also, this structure was a more traditional “A” frame in that it operates and is adjustable in a similar manner to a ladder. However, for the final version of the deployable prototype, a new structure has been assembled to give the electrical loads a 72 Figure 53: Front view of the new load cabinet CpE190/EEE193A SENIOR PROJECT CSUS PROF. TATRO MAY 5TH, 2014 developing a complex system with a rich feature set list that we felt would accomplish meeting the needs of TICC and empowering their education. The basic proof of concept was proven with the rapid prototyping of this microgrid system, however, a deeper and more thorough testing phase is now required to ensure the system functions as intended. During this testing phase we will need to test and vet all features of our system while keeping in mind outside considerations that are unique to TICC which include 1) TICC Load Profile Figure 54: Side view of load cabinet This cabinet will remain mostly as shown in this document with some modifications to the outside appearance. As of the time of this writing, posters depicting TICC, Toggo Village, and team 5 group photos was being designed and printed and XXI. DEPLOYABLE PROTOTYPE HARDWARE TEST PLAN A major portion of Senior Design, especially in the Spring semester, is testing the laboratory/deployable prototype to ensure that all of the implemented features work properly under varying conditions that the system will be subjected to in its final form. With this in mind, we devised this test plan in order to vet our deployable prototype. A. Deesign Element and Testing Purpose and Considerations Taking into account all of TICC’s requirements and constraints led us to 73 Before we built our rapid prototype design we sat down with Pastor Steve, who had flown in from Uganda, to discuss what type of electrical loads the school would like to run and what the hours of operation at the school were. What we learned was that the school had a need to operate typical office equipment such as computers, printers, and fax machines. Additionally, Pastor Steve mentioned the need to have a way to reliably recharge cell phone batteries as these phones were a major part of the villager’s life. Aside from these electrical needs, we learned that the most important loads were security lighting, indoor lighting, and refrigeration equipment. We determined these loads to be critical loads and were necessary for them to always be operational. Therefore, our test plan should prove that these loads will be operational and that the critical loads will be a priority when electricity generation, storage, and consumption are considered. 2) Ugandian Weather Patterns In addition to requiring certain electrical loads, the weather surrounding the TICC will play an important role in our testing. The weather in Uganda is very CpE190/EEE193A SENIOR PROJECT CSUS PROF. TATRO MAY 5TH, 2014 different from Sacramento with Uganda getting roughly 3 times the average rainfall as Sacramento and having an average relative humidity rating of 85%. Uganda, on average, has a remarkably predictable rainfall, sunshine, and temperature rating throughout the year with little variation [1][2][3]; however, they can receive temperature spikes as high as 104 degrees Fahrenheit and as low as 62 degrees Fahrenheit. We are interested in testing these extreme temperatures and humidity and will detail a plan to reach as close to these conditions as possible given the time and equipment we have available to us. However with that said, it will not be necessary to test our system in these same exact conditions (e.g. to run our prototype in the rain) as the system should be installed according to local codes and regulations; rather we will need to simulate the results that this weather pattern would present to our system. For example, random extended hours of little to no sunshine in the middle of the day when there should normally be sunshine would mimic the effects of rainfall on our system. In addition to simulating the results of Uganda’s weather, we will also cross reference data sheets for the individual components that we select for our reference design to ensure they will operate properly in the face of possible wild temperature swings as well as in the high humidity that is present in Uganda. 3) Testing Feature Set List In addition to normal stress testing of the microgrid’s components and system functionality, TICC’s load requirements and Uganda’s weather gives us additional scenarios that are excellent to test to ensure that all the features in our set list work as 74 intended. The rapid prototype was built in the fall and incorporated the following promised features. 1. PV Module Based Renewable Power Generation of approximately 500W. 2. Maximum Power Point Tracking (MPPT) of Generated Power. 3. Energy Storage of around 100Ah with lead acid chemistry chosen for our client’s region 4. Constant Current Constant Voltage Battery Charging Capability. 5. Power Electronics based Conditioning of the DC Bus voltage within acceptable limits from the Energy Storage and PV Array. 6. Power Electronics based Conditioning for DC Loads within acceptable limits. 7. Monitor Current and Voltage at Generation, Battery Storage, and Loads 8. Develop Algorithms to determine State of Charge of the battery and Priority Based Load Control for Demand Response. 9. Local Controllers communicate energy readings with the Embedded System Controller 10. Store Historical System Performance Data on the Embedded System 11. Graphical User Interface showing System Status, History, and Alerts These features have all been tested on a controlled and limited basis during multiple demonstrations of our rapid CpE190/EEE193A SENIOR PROJECT CSUS PROF. TATRO MAY 5TH, 2014 prototype, but using the requirements set forth by the TICC and environment of Uganda as a test bed we can ensure that the system will achieve full intended and long lasting operation in the Toggo Village. For Example, using the fact that rain is not only possible, but likely at any time of year in Uganda and the effect that presents to our system, we can stage a test that supplies sudden random shading to our system to test if our system responds properly. Throughout the remainder of this report we will lay out our plan for the full testing of our system to take as many of the effects that our system will encounter into account. Our testing will be structured in such a manner that we will test individual components in order to characterize them and ensure their interconnectivity with other components to eliminate as many foreseen problems as possible. We will then test the complete system under varying conditions and scenarios that range from typical to extreme conditions. We will set this testing up in a standard controlled engineering process that will start with simulation of individual components and the full systems and then move to experimental testing using the hardware that we built for the rapid prototype. B. Test Plan Structure for Microgrid System Our test plan will consist of standard engineering processes of theoretical, simulation, and experimental calculations and testing. The theoretical calculations have largely been completed during the process of rapid prototyping and some light component simulation and testing has already been executed in order to ensure that we were interfacing components in a manner that ensured user and spectator safety. However, this test plan 75 will officially vet and document those results. Our testing will occur in six stages: • Individual Component Simulation • Complete System Simulation • Isolated Component Testing • Software Testing • Full System Experimental Testing • Upgraded System Experimental Testing C. Individual Component Simulations Simulation is a key component in designing and building a system especially with the level of complexity needed to develop a microgrid. One way to test whether a set of complex systems will work correctly together is by showing an individual complex system will work by itself. Once the operation of one system alone is confirmed then it is reasonable that it will work when connected to another system. Simulation gives an additional check before the physical system is tested. This allows the theory to be tested in an environment that is safer, cheaper, and reasonably models the real system. Simulations can be completed quickly and tuned to match physical parts more closely to add a higher level of confirmation to the real world. There are real time instantaneous simulations as well as longer term simulations. The real time simulations test the system to insure in conforms to the manufacturer’s data sheets and the long term tests incorporate other variables and conditions the system may be subject to. The simulation testing can end when the proper criteria have been met such as the system performance matches the expected performance based on the data sheet as well as meeting the criteria needed to interface with the other systems. The three main systems to be tested are PV generation, power electronics, and energy storage. Each CpE190/EEE193A SENIOR PROJECT CSUS PROF. TATRO MAY 5TH, 2014 will be simulated independently and will provide qualitative and quantitative information to be compared with theoretical analysis and measured values. The PV generation system will be simulated by creating a model of the PV Module and matching it to the datasheet from the manufacturer of the PV module. The model to be used consists of a current source with the short circuit current as its rating shunted by several series connected diodes. The number of diodes with each voltage threshold drop will add to be equal to the open circuit voltage. Shunt and series resisters are added to simulate the losses and also form the characteristic curve of the module. A load resistor is added along with a DC source. When a DC sweep is completed the voltage and current can then be mapped showing the I-V curve. What is expected from this simulation is an I-V curve matching the manufacturers datasheet for a given temperature and irradiance. The max power point should also be confirmed with its characteristic impedance. The simulation model will be adjusted until its open circuit voltage, short circuit current, voltage at max power, and current at max power match the datasheet for this particular PV module The power electronics of the system will be simulated in order to show the desired results of impedance matching between systems. These circuits will act as the glue to keep proper generation, battery charging, and load support. A simplified model for a buck circuit will be simulated to insure it is capable of properly shifting the voltage levels required by the PV and battery storage system. This circuit stores energy in the inductor in order to drop the voltage level and increase the available current. A transistor is used to 76 perform the switching needed to convert the voltage level. The key control element to this circuit is the duty cycle of the switch. By controlling the duty cycle the output voltage or current can be set. Several parameters for the simulation will be chosen based on the existing parts such as inductor and capacitor sizes. The operating frequency will also be set to match existing parts. What is expected from the simulation is the ability to convert voltage levels for a given load and to be able to control the output voltage level by adjusting the duty cycle. Several operating constraints will also be extracted from the simulation including load size and current when the converter begins operating in discontinuous mode. The testing will be complete when the circuit is operating properly and output voltage is able to be controlled by changing the duty cycle. The maximum load will be determined by determining when circuit begins discontinuous mode. This will give quantitative values for the maximum load size. The boost circuit will be tested in a similar manner to the buck circuit. A simplified model will be used to change the output voltage higher than the input by changing the duty cycle on the switch. The second part of the boost circuit test will be the load support simulation. With a model of the PV attached the load will be increased and the load support will be tested. What is expected is the voltage will be adjustable by changing the duty cycle. Also when the load becomes too large the boost circuit should begin to supply the needed excess power. This test will be completed when the voltage level can be changed by adjusting the duty cycle of the switch. The qualitative data to be extracted from the simulation is the proper boost CpE190/EEE193A SENIOR PROJECT CSUS PROF. TATRO MAY 5TH, 2014 output voltage needed to maximize the PV generation right before load support kicks in. While charging a lead-acid battery is well documented we want to provide some simulations of how the battery will respond to charging from the PV. A simulation will be run to show that max power can be extracted from the PV and stored in a battery. The battery will be simulated in Multisim using the non-ideal battery source with a small capacity given. A model of a PV will be used as the charging source and analysis of the power extracted and stored will be analyzed. What is expected from this simulation is to see the battery is capable of capturing the max power produced from the PV module. This will confirm our intentions to use a battery as the variable load to store excess power from the PV. This test will be completed when the proof on concept simulation shows the ability to charge a battery from the PV at max power. D. Isolated Component Testing The Fall semester focused on device functionality testing in the Sacramento climatic environment. Now we will focus on testing our device under climatic conditions specific to Uganda. In order to accomplish this, we will have to create a test bed in which we can create the extreme climatic conditions of Uganda. Temperature, irradiance, humidity, and precipitation will be the factors focused on in the testing. Focusing on temperature, highs can reach upwards of 104 degrees Fahrenheit with a recorded low of 62.6 degrees Fahrenheit in the neighboring capital of Kampala [1][2][3]. Since the current temperature in Sacramento is incapable of reaching the high-end spectrum of extremes needed for the 77 testing, we will setup a confined space and use space heaters to achieve high temperatures at or above 104 degrees Fahrenheit for testing. The low temperature extreme can easily be created since the temperature in Sacramento for this time of year will average around the mid-60’s in degrees Fahrenheit. Fans will be used to supplement where necessary. Irradiance from sunlight isn’t something we have control over, therefore, we propose the setup of an indoor lighting scheme with a high wattage bulb. By adjusting the distance from the PV, we can vary the irradiance input to the PV. The humidity in Uganda is much greater than locally in Sacramento. To ready our device for deployment in Uganda, we must recreate a high humidity environment within our confined test bed. This will be achieved using a humidifier to increase moisture content in the air and a hygrometer to measure this humidity. Precipitation is also a climatic factor in Uganda, but shouldn’t necessarily affect PV generation. However, we are particularly concerned with the construction of the PV itself and will test to ensure its water-tight and won’t affect the cells or the electrical connections. The isolated component testing will take into account the average and extreme climatic conditions of Uganda. We will be testing three different phases of our rapid prototype in insolated tests. The first phase will consist of testing PV panels, the second phase will be the power electronic tests, and the last phase will be the Battery and state of Charge tests. a) PV Panel The first components that we will test are the PV panels. The I-V characteristic curve for a PV shows the maximum power point to exist somewhere between the CpE190/EEE193A SENIOR PROJECT CSUS PROF. TATRO MAY 5TH, 2014 minimum panel voltage and theoretical maximum panel voltage (Open Circuit Voltage). We will begin by testing the PV effects from operating at each of these extremes, obviously, here we won’t be using maximum power point tracking (MPPT). Rather, a variable load will be connected in order to drag the voltage down and pull the voltage high. Given a measured irradiance and temperature input, we can calculate the power we expect the PV to generate. We should see that both the high and low voltage PV output significantly decreases the efficiency of the PV. Moreover, we want to verify the estimated power calculated can be achieved by adjusting the load until the maximum power point of the PV has been reached. Later, we’ll be testing the ability of the MPPT to correct itself amidst undershoot and overshoot conditions. Also, weather can be unpredictable at times, one moment could bring plenty of sunshine and the next could provide cloud cover that fully shades the PV. With the MPPT in place, we will test the effects of going from full irradiance to nearly no irradiance and vice versa. This will seek to verify the importance of the energy storage element in our system. The PV testing will also coincide with the climatic condition testing previously mentioned, that is, under high temperature, low temperature, high irradiance, low irradiance, and high humidity conditions. From tests previously performed on the PV, we would expect very similar results. It is expected that the maximum power point of the panel under most conditions will occur around 18.5 Volts, and this should be true under the conditions tested. Likewise, the power generated at high and low voltage outputs is expected to significantly less than the fully optimized maximum power point 78 measured and theoretically calculated. Because of the way the system’s MPPT is designed to adjust the impedance in any direction, we expect the maximum power point to still be trackable after either undershoot or overshoot occurs. The effects of shading are expected to cause the PV to generate next to no power and validate the necessity of energy storage as a means of mitigating the intermittency inherent in renewable power. Operating at a temperature of 104 degrees Fahrenheit should downgrade the PV’s power output when compared to the minimum operating temperature of 62.6 degrees Fahrenheit. According to [4], drops in efficiency occur once temperatures start climbing past 87 to 91 degrees Fahrenheit. Should an unforeseen circumstance arise where the completion of the original test plan not permit, the contingency plan will be put into motion. Here, we will use high-powered spot lights to simulate irradiance. Event in the event that this is not possible, renewable energy is a market mover in today’s economy. A lot of work and research is being done to accelerate the adoption of renewable energy and primarily PV. We aren’t the only engineers seeking to validate these notions under varying climatic conditions and many others that have come before us have left documentation and test results that we can reference as a measure of testing our own system. For example, the characteristic I-V curve for any 100 Watt mono-crystalline panel should be very close in relation to ours. Likewise the effects of weather should be no different and we will seek to use information from others’ testing to validate our work. Testing will be considered complete once the results have become repeatable CpE190/EEE193A SENIOR PROJECT CSUS PROF. TATRO MAY 5TH, 2014 and reasonable. Once we have ascertained the result is not an outlier, we will proceed on to the next test. Regardless of whether that result validates our expectations, once it becomes repeatable and within reason, we will find the test was thorough enough, move on, and reassess our initial expectations. b) Power Electronics (Charge Controller, Boost Circuit) The power electronics on our system include the buck circuit/charge controller/MPPT and the boost circuit. We will subject these circuits to testing under climatic conditions that won’t prove hazardous outside of their future planned enclosures. For instance, to test these circuits under precipitous and high humidity conditions will only cause them to fail as they don’t have the proper planned enclosures to protect against these types of conditions. We will subject them to a range of temperatures from minimum to maximum and measure the effect temperature has on efficiency and percent difference in expected output voltage. We will also determine the efficiency under normal operating conditions. Lastly, we’ll test the range of acceptable input voltages and output voltages. We will use a benchtop power supply as our input voltage source and connect a measured resistance at the output capable of handling the power output. The expectation for the power electronic circuits is that they will not be affected much by the lower range of temperatures. However, at some higher temperature, we would expect the efficiency to drop off and perhaps a slight difference in the expected output voltage as well. We expect the input voltage to be unaffected by any change in the output voltage. For the 79 buck circuit, the output should always be less than the input voltage. For the boost circuit, the output should always be greater than the input voltage. A contingency plan for the power electronics is not necessary, the resources required for the testing are available and the testing will be completed as described. The testing on the system power electronics will seek out results that are repeatable and within reason. c) Energy Storage (Battery, Capacity, Load Support) The energy storage has a tendency to operate differently under different climatic conditions such as temperature and humidity. We will incorporate the extremes of each in our testing of the battery. The first test on the battery will be to fully charge the battery, hook up our coulomb counter and voltage measurements, and run a full discharge of the battery under average discharge current (Load Profile Specific) to determine the capacity of the battery under normal operating conditions. Since the average temperature in Uganda is in the mid-80’s in degrees Fahrenheit, we will subject the capacity testing of the battery to this ambient temperature as well. Using a humidifier to inject moisture, we will also perform the capacity test under as close to realistic humidity conditions in Uganda as possible. A hygrometer will be used to measure and record the humidity. At the same time, we’ll have recorded the initial energy input to our battery and the energy output to create a rough estimate of our battery’s energy efficiency. We will repeat this test under different discharge current rates, maximum and minimum discharging rates. Viewing our load profile, we will determine what these minimum and maximum discharge rates are and examine CpE190/EEE193A SENIOR PROJECT CSUS PROF. TATRO MAY 5TH, 2014 and record results that depict the performance of the battery under these different discharge rates over the minimum and maximum operating temperatures. The battery is a 12 Volt lead-acid type rated for deep cycle at 109 Amp-hours. We would expect the capacity to be less than 12V*109Ah = 1308 Watt-hours, but not less than 80% of this figure. From [5], it can be expected that temperatures above 77 degrees Fahrenheit will decrease expected life by approximately 50% for each 18 degree Fahrenheit increase in average temperature. Humidity can also decrease the life expectancy of a lead-acid type battery as well and we might expect to see a decrease in capacity after a full discharge at high humidity. For lead-acid type batteries the efficiency is expected to be in the range of 80%, but will also depend on a number of other factors. For normal operation on our system and in climatic conditions specific to Uganda, we would expect to see an efficiency near 80%. Should the original test plan not come to fruition, we will research testing on similar lead-acid type batteries and extrapolate data from their results for similar tests. AS these types of batteries have been around for quite some time, the testing done on these batteries is elaborate and extensive. Finding the necessary test setup and data should be achievable and will be our backup plan. Testing shall conclude when the results of the testing are repeatable and within reason. We will match the results with our expectations and determine the whether they are reasonable. We will then perform repeated tests to validate as well. Our expectations are based on previous research that has already been validated; we would expect our expectations to match closely 80 with the test results and for repeat tests to arrive at the same conclusion. 4) Full System Experimental Testing The experimental testing for the full system will essentially mimic as best we can the full system simulation as explained in section V. We will be looking for the same results as the simulation with a few extra results that simulation alone cannot provide. The goal of this test phase is to combine data results from simulation and isolated component testing with experimental data from a full laboratory prototype testing in order to determine if all our features work properly, if the needs of TICC will be met with this system, and the power efficiency of the system. The first test will be to set up the system at a team member’s house and record a series of three 24-hours of data from the system in order to verify the Simulink model. During these experiments we will run differing load profiles. These load profiles will range from extreme light loads to TICC typical load profile to extreme heavy loads. We will also vary these loads throughout the days and monitor and record the energy generation from the PV panel, the state of Charge of the battery, and the power consumed by the electrical loads. The loads will be programed to microcontroller to enable automatic turn on and turn offs. Additionally, we will observe the behavior of the PV panel in times of low irradiance and at night to see the effects of the battery placing a voltage across the panel without the ability for the panel to generate current and determine if more diode protection is needed. After this test is complete and if the hardware validates the simulation we will CpE190/EEE193A SENIOR PROJECT CSUS PROF. TATRO MAY 5TH, 2014 attempt to run a week long test, if weather allows. The purpose of this test will be to verify the same results as the 24-hours test but with extended use and stress on the system created by continuously running for a week. The load profile for this test will be a variety of typical TICC load profiles and extreme loads. We will also cover the solar panel during this test to simulate extended periods of no sunshine in order to test our energy management and energy storage features. Unfortunately, we do not think we will be able to test our laboratory prototype as is in the same weather conditions that are in Uganda. This is mainly due to the fact that our system is not manufactured and weatherproofed as a fully deployable system would be. Therefore, our climatic testing at this point will be limited to isolated components with very controlled tests. With this being said the above tests should adequately test the effects of Uganda’s climate on our system and when combined with the simulation results, give us a reasonable estimate to how our system will perform in Uganda. One of the more important and asked for results of this testing that cannot be determined from simulation will be the power efficiency of the system. With these prolonged periods of testing will measure the efficiency by tracking power generated and consumed. Furthermore, we will measure the energy stored in the battery from the PV and the energy given by the battery to the loads in order to determine efficiency. Due to the parallel design of our system, we need to track all of the power flow throughout the system as some of the power generated by the PV panel will go directly to the loads and the rest will go to the battery. During times when load 81 support is needed the opposite happens. The panel gives what it can to the loads while the battery makes up the rest. Therefore, we need to measure all these quantities and will have to use this data to calculate the systems power efficiency. The one issue with experimental testing of a photovoltaic microgrid is that the weather during February and March is not always predictable. Therefore as a backup plan, we will use large spotlights to simulate the irradiance from the sun if necessary. This task is more labor and resource intensive as we would have to adjust the brightness, and/ or relative location of the light to our solar panel constantly. As a result, if the experimental testing comes to this contingency plan, a week long test of the microgrid system is unlikely. In this case, we would use our 24hours testing and simulation results to verify working operations in Uganda. 5) Upgraded System Testing We want to construct a 200 watt system that is an upgraded replica of our current laboratory prototype. With this upgraded system we would run the exact same tests as we did with the laboratory prototype described in section VIII. Building this system will allow us to do a couple things. First, we could test the linearity of the system. If we get the same results scaled by 2 then we know the system scales linearly and that our design will be valid for a 1-3 kW system that TICC will require. Second, by boosting the power of our system we move our system up to a power level where we could purchase off the shelf power electronics and other devices. These devices would come factory sealed in casings and will have rated uses for outdoor environments and would allow CpE190/EEE193A SENIOR PROJECT CSUS PROF. TATRO MAY 5TH, 2014 us to test our design in climatic weather states that would more closely mimic the environment in Uganda. 6) Test Plan Time Frame and Resources Needed The test full test plan will be completed by March 17, 2014. In order to complete this test plan within that time frame we will have to parallel some of the testing phases. In fact, most of our test plan can be executed simultaneously. Both sets of simulation can be run at the same time as the isolated component testing and software testing. The full system and upgraded system test will follow. The table below lays out the proposed time line for getting each testing phase done. Table VI. Test Plan Timeline Test Plan Phase Test Length Start Date End Date Team Member Individual Component Simulation 20 hours February 10, 2014 February 17, 2014 Troy Complete System Simulation Isolated Component Testing 40 hours February 10, 2014 Will 40 hours February 10, 2014 February 24, 2014 February 24, 2014 Full System Experimental Testing 120 hours February 24, 2014 March 15, 2014 Will, Matthew, Troy, Tanya Upgraded System Experimental Testing 120 hours February 24, 2014 March 15, 2014 Troy, Tanya, Will, Matthew E. Device Testing Results 1) PV Characterization Testing In order to gain insight into the performance of our PV under varying conditions, we setup a test in Roseville, California and measured maximum power through a 24-hour duration from February 21st 2014 to February 22nd 2014. The irradiance value for neighboring cities in 82 Matthew Sacramento is relatively the same and using the website for National Renewable Energy Laboratory, we were able to find a co-op project with Sacramento Municipal Utility District (SMUD) that provided irradiance data for the Anatolia housing division in Rancho Cordova. This will provide us with reasonably close irradiance data for our testing. The graphs in Figure 1 and 2 show irradiance from 0-1000 W/m^2 on the vertical axis and Pacific Standard Time from CpE190/EEE193A SENIOR PROJECT CSUS PROF. TATRO MAY 5TH, 2014 just before 7:00AM to almost 6:00PM on the horizontal axis. The green plot shows the direct normal irradiance, the red plot shows the global horizontal irradiance and the blue plot shows the diffuse horizontal irradiance. Direct normal irradiance can best be defined as the amount of solar radiation received per unit area by a surface that is always held perpendicular to the rays that come in a straight line from the direction of the sun at its current position in the sky [28]. Alternatively, global horizontal irradiance can best be defined as the total amount of shortwave radiation received from above by a surface horizontal with the ground [29]. Because the PV installation in Uganda will most likely be fixed in position, we performed a PV characterization test with our panel facing south at a tilt angle of about 30 degrees. Thus, the irradiance our panel received will vary somewhere between the red plot and the green plot in the figures below. Figure 55: Solar Irradiance for February 21st in the Anatolia Housing Division in Rancho Cordova, California. Photo Courtesy: nrel.gov Figure 56: Solar Irradiance for February 21st in the Anatolia Housing Division in Rancho Cordova, California. Photo Courtesy: nrel.gov Starting at 12:38PM on the 21st of February and running until 4:48PM, we were able to measure various voltages and currents generated by our PV under different loading conditions. From the data, we were able to ascertain the maximum power point of our PV in about 30 minute intervals. In order to gather the morning hours we had missed on the 21st, we reconvened on the 22nd of February at 8:15AM and ran until 12:01PM, again gathering the voltages and currents under 83 CpE190/EEE193A SENIOR PROJECT CSUS PROF. TATRO MAY 5TH, 2014 different loading conditions; the values for maximum power generation of our PV were calculated from the data. The data gathered was used to plot the PV generation over a diurnal (sunlight) cycle the figure below. PV Generation (Watts) PV Generation Diurnal Cycle 80 70 60 50 40 30 20 10 0 7:40 9:07 10:3312:0013:2614:5216:1917:45 Pacific Standard Time Figure 57: PV Generation Capture February 21 and 22, 2014 The data collected served as proof of what we had already expected. As we near solar noon, the irradiance increases which 84 increases the current our PV can produce. As such, the load impedance needed to drive maximum power decreases the closer we get to maximum irradiance conditions for the day. As we get further away from solar noon, the irradiance drops significantly and so too does the amount of current the PV can generate under loaded conditions. This causes the load impedance to drive maximum power of the PV to increase. Three other plots were generated from the data collected: Current versus Voltage, Power versus Voltage, and Power versus Load Impedance subsequently given in the following three figures. These results are typical for PV generation and validate as close to possible the range and rated values of our Ramsond 100W monocrystalline panel. CpE190/EEE193A SENIOR PROJECT CSUS PROF. TATRO MAY 5TH, 2014 12:38PM 63 Degrees F 6 1:22PM 64 Degrees F 2:00PM 64 Degrees F 5 Panel Current (Amps) 2:30PM 66 Degrees F 3:12PM 66 Degrees F 4 3:48PM 68 Degrees F 4:32PM 68 Degrees F 3 4:48PM 68 Degrees F 8:15AM 59 Degrees F 2 8:48AM 50 Degrees F 9:24AM 52 Degrees F 1 10:02AM 61 Degrees F 10:30AM 62 Degrees F 0 0 5 10 15 20 25 Panel Voltage (Volts) Figure 58: Ramsond 100W Mono-Crystalline Measured I-V Characteristics 85 11:10AM 62 Degrees F 12:01PM 64 Degrees F CpE190/EEE193A SENIOR PROJECT CSUS PROF. TATRO MAY 5TH, 2014 80 12:38PM 63 Degrees F 1:22PM 64 Degrees F 70 2:00PM 64 Degrees F 2:30PM 66 Degrees F 60 3:12PM 66 Degrees F 3:48PM 68 Degrees F Power (Watts) 50 4:32PM 68 Degrees F 40 4:48PM 68 Degrees F 8:15AM 59 Degrees F 30 8:48AM 50 Degrees F 9:24AM 52 Degrees F 20 10:02AM 61 Degrees F 10:30AM 62 Degrees F 10 11:10AM 62 Degrees F 12:01PM 64 Degrees F 0 0 5 10 15 20 25 Panel Voltage (Volts) Figure 59: Ramsond 100W Mono-Crystalline Power Output versus Panel Voltage 86 CpE190/EEE193A SENIOR PROJECT CSUS PROF. TATRO MAY 5TH, 2014 80 8:15AM 8:48AM 70 9:24AM 10:02AM 60 PV Power Output (Watts) 10:30AM 11:10AM 50 12:01PM 40 12:38PM 1:22PM 30 2:00PM 2:30PM 20 3:12PM 3:48PM 10 4:32PM 0 0 2 4 6 8 10 12 14 16 18 PV Load Impedance (Ohms) Figure 60: Ramsond 100W Mono-Crystalline Power Output versus Load Impedance 87 20 4:48PM CpE190/EEE193A SENIOR PROJECT CSUS PROF. TATRO MAY 5TH, 2014 2) Buck Converter/Charge Controller Testing Within our system, the DC/DC Buck Converter serves two main purposes – maximum power point tracking and charge control of the battery. The isolated component testing examined the operation of the buck converter as a reliable charge controller for our battery. The test was performed using a variable voltage output power supply with an amp rating up to 5A as our input rather than a PV. The table below shows the fixed input voltage at the input while the resistive load on the output adjusted to simulate our battery’s impedance. The input current was allowed to float between 0A and 5A, while the input voltage remained fixed around 17.5V since this is where the PV’s maximum power point is most likely to occur in the early Spring at the time of testing. The resistive load was swept between 0 and 5 Ohms, while the output voltage and current from the Buck Converter was measured. The results indicate issues with voltage regulation. The output voltages were 88 selected based on typical battery charging voltages. At the lower end of the spectrum at 13.28V, the output current will continue to increase for charging up to only 3.5A until the voltage regulation destabilizes. While at the higher end of the spectrum at 14.7V, the output current was only adjustable from 0A to 2A before the output voltage destabilized from its regulation point. This draws attention to a potential problem when charging a battery, that is, maintaining voltage regulation to ensure the output voltage of the Buck Converter remains higher than the potential of the battery to prevent any undesired back feed through the converter. Fortunately, our Buck Converter came with built-in diode protection to prevent any back feed. This was tested and verified by dropping of the voltage regulation of the output while connected to a battery. The voltage measurements from the battery and the output of the Buck Converter were at the same potential and no current was measured feeding back into the converter. CpE190/EEE193A SENIOR PROJECT CSUS PROF. TATRO MAY 5TH, 2014 Table VII. Buck Converter/Charge Control Test Results Buck Converter/Charge Controller Testing Fixed Input Voltage=17.695V (0-5Amps) Fixed Input Voltage=17.578V (0-5Amps) Output Voltage Output Current Output Power Output Voltage Output Current Output Power (Volts) (Amps) (Watts) (Volts) (Amps) (Watts) 13.28 1 13.28 14.7 0.8 11.76 13.28 1.25 16.6 14.7 2 29.4 13.28 1.5 19.92 14.62 2.1 30.702 13.28 1.75 23.24 14.57 2.3 33.511 13.28 2 26.56 14.52 2.4 34.848 13.28 2.25 29.88 14.42 3.1 44.702 13.28 2.5 33.2 14.36 3.9 56.004 13.28 2.75 36.52 14.32 4.5 64.44 13.28 3 39.84 14.31 5 71.55 13.28 3.5 46.48 10.95 5 54.75 12.5 3.6 45 7.23 5 36.15 0.4 3.62 1.448 2.9 5 14.5 panel. We were also able to supply charging 3) MPPT Testing current to the battery from 8AM until 6PM In order to test the MPPT capability, when the irradiance was just too low to we performed a complete system level provide adequate power. This enabled us to testing with some electrical devices and a bring the battery from an estimated 50% battery connected. On March 12th 2014, we State of Charge to 95%. The figure below were able to adjust the manual charge shows the data collected from diurnal control voltage output to maximum power testing on March 12th 2014 with some key point track and consistently force up to 83 points highlighted. watts of generation from our 100 watt solar 89 CpE190/EEE193A SENIOR PROJECT CSUS PROF. TATRO MAY 5TH, 2014 Figure 61: Data collected from diurnal testing of 100 watt rapid prototype on March 12th 2014 The key events in the figure above shows the behavior of our system with changing ambient conditions and the response of our system due to MPPT. When students presented cloud cover, we were able to bring the power generation back up through manually adjusting the output voltage of the charge controller to function as MPPT. Additionally, we can see the behavior of the battery charging and load supporting. When the electrical loads decreased and we forced max power generation we can see the current to the battery increase. When at the end of the day and the sun is setting we can see the battery maintain loads as the battery current begins to drain. 90 F. Complete System Testing 1) Sensor Measurement Setup The sensor network for our prototype design includes voltage measurements at the PV, non-critical load bus, critical load bus, and battery. Current measurements throughout the network include the PV current, battery current, critical load current, and non-critical load current. Being able to pinpoint these values at least once per second gives the user more insight into how the system is operating, that is, information about real-time power generation, power consumption, and battery state of charge. This type of information can lead to a greater sense of awareness that adds to the education process discussed earlier to overcome poverty. In addition, automated demand CpE190/EEE193A SENIOR PROJECT CSUS PROF. TATRO MAY 5TH, 2014 response signals are based on a combination of power generation, consumption, or battery state of charge. These demand response signals can shut-off non-critical loads at times of low generation and high demand or at times of low battery state of charge and little to no power generation. The shut-off of non-critical loads ensures reliable power for the most important electrical loads such as refrigeration for cold chain and perimeter security lighting. 2) Sensor Measurement Hardwareand Results The voltage and current measurements discussed are measured as analog values and sent into our microprocessor’s ADC for digital conversion. The software implementation and transformation into useable graphical system data is outside the scope of this section, but extremely relevant to the overall project. Therefore, being able to measure the voltages and currents with precision and accuracy is a critical component in gaining a reliable understanding of how the system is operating or will operate in the future. The voltage measurements for PV, noncritical load bus, critical load bus, and battery all have voltages too high to input into the ADC’s on our microprocessor. The maximum voltage input on the Microchip Max32 is 3.3 Volts. Using voltage dividers, we can cut these voltages down to meet the input requirements of our microprocessor’s ADC’s. The first step was to determine the range of voltages at each of the points of interest. For example, the PV has a rated open-circuit voltage of 22.7 Volts, this means that the minimum ratio of voltage divide will require 3.3V/22.7V , or 0.1454. Choosing resistors based on this ratio and 91 power rating, we have ensured the full range of voltage operation for our PV. Using this same logic we determined the resistor sizes need for the voltage measurements of the battery, critical load bus, and non-critical load bus. After the nominal resistor values were chosen, we performed tests to attain the measured ratio for which the voltage had been broken down by. These values were then programmed into our code to retrieve the actual analog voltages measured. The current measurements throughout the network were taken using two different types of sensors: current sense resistors and Hall Effect sensors. The current sense resistors used are laser trimmed, high-precision 10mΩ resistors. To measure the current, we measure the analog voltage and divide out by the resistance. Measuring millivolts on an ADC such as ours didn’t provide us with accurate or reliable values as the microprocessor ADC is 8-bit with 3.22 mV step sizes. Knowing that we had head room on the ADC, we configured instrumentation amplifiers to boost the filtered outputs of our current sense resistors. The value of gain chosen was again dependent upon the range of values possible. For the PV, the current has a maximum theoretical short circuit output of 5.55 Amps, so the maximum voltage sensed on our current sense resistor will be 55.5 mV. The pins on the instrumentation amplifier IC allow for an external resistor to be connected that sets the gain of the amplifier. We chose to produce a gain of 26 for the PV so the maximum voltage into the microprocessor would be 1.443 Volts. Noise and other disturbances will now have far less effect on the larger signal. This current sense resistor and instrumentation amplifier combination was also used to measure the CpE190/EEE193A SENIOR PROJECT CSUS PROF. TATRO MAY 5TH, 2014 current in and out of the battery to perform a coulomb counting strategy to determine the state of charge of the battery. The downsides to this method are that we would need to begin the algorithm knowing the state of charge of the battery and errors will accumulate over time. The second current measurement device implemented was the Hall Effect sensor. The sensor outputs 66mV for every Amp of current run through the sensor. These sensors come with a reference voltage used to power the device but also to create an offset at the output. This offset is handy in that it allows the user to measure current in both directions. For example, our reference voltage was chosen to be 5 Volts since most of the other devices like the instrumentation amplifiers require the same voltage. The output of the Hall Effect sensor when no current is passing through is 2.5 Volts. Depending on how the sensor has been wired up, for 1 Amp of current passing through, you could measure either 2.566 Volts or 2.434 Volts. Again with the Hall Effect sensors, just like the current sense resistors, we employed capacitive filters to try and limit noise. These analog voltages were fed directly into our microprocessor and code was implemented to retrieve current from voltage using the values discussed. Unfortunately, the results obtained from testing the current and voltage measurements show inconsistency between the value being sent into the ADC and the digital value registered. A strategy to remove the inconsistency between values is discussed in the following section: Revisions Resulting from Testing. G. Complete System Test Results While performing device testing of the complete deployable prototype, we made some interesting findings relating to 92 overall system performance. The laboratory prototype was designed with a diode to control load support. In other words, when the PV can supply enough power to both charge the battery and power all electrical devices connected on the non-critical load bus, the diode prevents the battery from discharging by maintaining a voltage on the output of our battery-connected boost converter that is less than the forward bias voltage of the diode connected to the noncritical load bus in parallel with our PV. Once the power consumed at the noncritical load bus starts to exceed maximum power generation of our PV, the diode becomes forward biased and the battery and the PV both contribute to power these non-critical electrical loads. This is where an issue occurred, since the PV contains large diodes that prevent any current from back feeding into it, the current generated from the battery to load support didn’t loop through our ground and added to the PV current in supplying the buck converter that charges the battery. The strategy to overcome this obstacle will be visited in the follow-up section titled: Revisions Resulting from Testing. H. Revisions Resulting from Testing 1) Current Block Diode Through complete system testing, we ran into a hiccup through our implementation of the load support diode that directs power flow based on the difference in power consumed by our loads and generated from the PV in conjunction with the battery’s boosted output voltage. The issue found in the test results showed that current supplied by the battery to load support was being redirected up the line that connects the PV, buck converter, and non-critical load bus. In order to resolve CpE190/EEE193A SENIOR PROJECT CSUS PROF. TATRO MAY 5TH, 2014 this issue, a diode was placed on this line to prevent the current loop/back feed issue. The figure below shows the placement of our revised microgrid with the new current block diode. XXII. SOFTWARE TEST PLAN This test plan is intended to show how each section of the software on the laboratory prototype was setup and tested. Once all the parts were tested individually the system was put together and tested as a whole. A. Sensor Data Calibration One of the challenges was insuring the data from our sensors correctly represents the actual values of the currents Figure 62: Block Diagram of Microgrid Power Flow 2) Measurements The major improvement to the measurement system was the calibration of the ADC and the software filtering applied. The calibration had the largest effect on sensor reading accuracy and improvement when the measurements were corrected for offset, gain, and quantization error. An additional software change was the inclusion of a software mode filter. The main advantage of this filter was to filter out the outlier values that would occasionally arrive from the ADC. The mode filter worked by sampling the ADC at its maximum sampling rate for twenty samples. These samples were sorted from high to low and the top and bottom five values were discarded. The remaining ten samples were averaged and the value was returned by the filter. This produced good results and provided a reliable and clean sensor reading that was converted to digital form and sent to the energy management system. 93 and voltages throughout the system. This test should show us how to apply the correct calibration coefficients in our code to make the energy readings we store in the database as accurate as possible. • Setup sensor circuits with DC bench power supply with known resistive loads. • Set power supply to a known voltage and measure with external digital multimeters • Let microcontroller sample sensors and read data on the terminal of the computer system. • Calculate and apply calibration coefficients so incoming sensor data correctly represents actual circuit values. CpE190/EEE193A SENIOR PROJECT CSUS PROF. TATRO MAY 5TH, 2014 B. Sensor Calibration Results The calibration tests were successful gathered for this test along with the adjustment made to the measured values. in allowing the actual values of voltages and currents to be properly represented in our system. The code below shows our calibration results. vpv = ((float(dataArray[0].strip())-1000) * 3.3/1023)*8.2864 ipv = ((float(dataArray[1].strip())-1027) * 3.3/1023)*3.03*1.5 vbatt = (float(dataArray[2].strip())-1000) * 3.3/1023*5.522 ibatt = ((((float(dataArray[3].strip())-1000) * 3.3/1023)-1.65)*50) vbus = ((float(dataArray[4].strip())-1000) * 3.3/1023)*8.2864 inc = (((float(dataArray[5].strip())-1000) * 3.3/1023)-2.5)*15.1515 ic = (((float(dataArray[6].strip())-1000) * 3.3/1023)-2.5)*15.1515 C. Data Acquisition System Testing White box testing was completed on the microcontroller by performing the calibration procedures to arrive at the offset error and gain error coefficients and known signal testing to properly measure quantization error. The process used to identify the offset error was completed by hooking up a power supply voltage to an ADC pin starting at zero and increasing until the ADC value of 1 is achieved. A DMM is used to accurately measure the voltage of the supply at the pin and is compared to the theoretical voltage that should make the ADC read a value of 1. The 10-bit ADC uses levels 0-1023 and with a 3.3V reference the first level should appear at 3.22mV. This Max32 did not reach a level of 1 until the voltage was 11mV. An offset of +2 was chosen as it fit the dataset to the ideal ADC. Figure 5 shows the data 94 Figure 63: ADC Offset Error The gain error occurs when the full range of ADC levels occurs before or after the voltage reference is reached. The goal of this adjustment is to scale the ADC levels appropriately so the final ADC level is reached exactly at the voltage reference. Offset error must be adjusted first before gain error and the dynamic range will be reduced if there is an offset. To complete this adjustment the power supply and DMM is used again but at the top of the measurement scale. The voltage is raised until the newly offset error adjusted ADC level reaches the highest level of 1023. This voltage becomes the numerator and the reference voltage 3.3 becomes the denominator to create the gain error coefficient. Our Max32 gain error equals 0.9955. Figure 6 shows the gain error data along with the adjusted values to the ideal ADC steps. CpE190/EEE193A SENIOR PROJECT CSUS PROF. TATRO MAY 5TH, 2014 Figure 64: Offset and Gain Error Quantization error is simply the fact of having only 1024 levels to describe the voltage range from 0-3.3 volts. The theoretical quantization error is one half of the LSB measurement. In our example half of 4.88mV is 2.44mV error at any given point. If a 12-bit ADC was used the total steps increases to 4095 with resolution and error reduced to 1.22mV and .61mV. This is meaningful for our Hall Effect sensors that measure .066mV per amp letting us measure from 37mA increments to 9mA increments. The quantization error is improved through a process called oversampling and decimation. To move up the resolution by 2 bits a total of 16 samples are taken at a specified frequency in this case 200kHz. Most of the signals I am measuring can be considered DC so the Nyquist sampling theorem has been met. The 16 samples are summed and the total is bit shifted twice which is the decimation of the signal. The result is now a number between 0 and 4094. Results of this process are shown in Figure 7 along with a line of an ideal 12 bit ADC and an ideal 10 bit ADC for comparison. The highest error in my sample set was 0.5% error. Figure 65: Quantization Error D. Demand Response Test Plan The demand response algorithm is programmed to read the database at regular intervals and decide if loads need to be turned off or not. Since we cannot change the state of charge on the battery instantly a test bench script was created to simulate the threshold values needed to trigger the demand response. Below are the demand response test bench results showing the algorithm is working properly under these threshold conditions. E. Demand Response Test Bench Code checkSimpleSoCThreshold() print('setting SOC to 40') cms.setBatteryStateOfCharge(40) checkSimpleSoCThreshold() print('setting SOC to 60') cms.setBatteryStateOfCharge(60) checkSimpleSoCThreshold() print('Turning Off Test Mode') cms.turnOffTestMode() checkSimpleSoCThreshold() F. Demand Response Test Bench Results python emoncms.py Loads (0) off (1) on: 1 95 CpE190/EEE193A SENIOR PROJECT CSUS PROF. TATRO MAY 5TH, 2014 Battery SoC: 50.6 setting SOC to 40 Loads (0) off (1) on: 1 Battery SoC: 40 shedding loads loads are off setting SOC to 60 Loads (0) off (1) on: 0 Battery SoC: 60 turning on loads loads are on Turning Off Test Mode Loads (0) off (1) on: 1 Battery SoC: 50.6 G. Content Management System Input Testing The last remaining test needed for our system is to test the input system on the CMS. This was tested by creating a test python script that will trigger the input API with known values. These known values can be checked for accuracy and the graphical user interface can be setup properly. The following code was used to trigger the API and send data into the database. while 1: vpv=18 ipv=5 vbatt=12.4 ibatt=4 vbus=18 inc=1 ic=1 bCharge=68 url = "http://127.0.0.1/emoncms/input/post.json?n ode=8&csv="+str(vpv)+","+str(ipv)+","+str(vb att)+","+str(ibatt)+","+str(vbus)+","+str(inc)+", "+str(ic)+","+str(bCharge)+"&apikey=507ee7e c14130b874b02c241b5$ 96 result = urllib2.urlopen(url) time.sleep(1) H. Whole System Software Testing Once the measurements are in digital form the hard part is complete with the remaining task of transmitting the data to the server and storing the data in the database. A USB cable is used along with the serial protocol to send a string of data containing the ADC values of the analog sensors. This string is created by concatenating the “.” character to start the string. Each ADC sensor value is then space delimited and terminated with the newline “\n” character. The python script listens on the serial line and waits for the newline character. Once it arrives the string is stripped of its formatting characters and parsed into a data array. This data array is converted to the real world voltages and currents through calibration coefficients as specified through the various sensor datasheets. A simple web API is called to feed in the numbers into the database where they are stored and used in the energy management system. The python scripts that receive, parse, calibrate and feed the measurements collected throughout the entire DC microgrid did not require much testing. Once they were written and operational the database was checked to insure data coming in was stored in the proper place. I. Embedded systems We have tested the embedded system to ensure that proper functionality is achieved. Part of the test included testing the Raspberry Pi as an individual component and as an embedded part of our system. I have tested the software installed and the schedules that I set up on it. One of the main issues was to ensure that the CpE190/EEE193A SENIOR PROJECT CSUS PROF. TATRO MAY 5TH, 2014 embedded system is started and works properly without human intervention. The results were successful and the embedded system is functioning as desired. J. Database We have tested the database to ensure that the proper functionality is achieved. The test included comparing the data sent from the embedded system to the data that is being stored into the database. Desired functionally was achieved. K. Graphical User Interface We have tested the Emoncms framework and compared the data that was sent from the embedded system to the open source web-app and the data is the same. Also, we have calculated and compared the input of the data after applying a process to the feed data to make sure that the accuracy is not compromised and the data is the same. In addition, we have compared the data on the displayed in the dashboards to the data stored into the database and this data is the same as well. Desired functionally was achieved. Below are three figures that represent the testing of the Dashboards we have implemented. Figure 8 below shows the dashboard called PV System. Figure 9 below shows the dashboard called Battery Data. Figure 10 below shows the dashboard called PV System. Figure 11 below shows the dashboard called Critical and Non Critical Currents. 97 Figure 66: PV System Figure 67: Battery Data CpE190/EEE193A SENIOR PROJECT CSUS PROF. TATRO MAY 5TH, 2014 Figure 68: Bus Voltage and Battery State of Charge Figure 69: Critical and Non-Critical Currents L. Time Zone Syncronization We have tested the embedded system, Real Time Clock, MySQL- database, and phpMyAdmin in order to ensure that the time is stored into the Real Time Clock, that is transferred to the Raspberry Pi is the same as the current Time Zone. The results were what we have expected. M. Revisions to Software Testing One of the challenges of our device is going to be insuring the data from our sensors correctly represents the actual values of the currents and voltages throughout the system. This test should show us how to apply the correct calibration coefficients in our code to make 98 the energy readings we store in the database as accurate as possible. Since we are using a chipKit Max32 and the ADC pins we have to calibrate each pin to make sure the values correspond to the actual data coming in. The test plan will include setup sensor circuits with DC bench power supply with known resistive loads, set power supply to a known voltage and measure with external digital multimeters, let microcontroller sample sensors and read data on the terminal of the computer system, calculate and apply calibration coefficients so incoming sensor data correctly represents actual circuit values. The limits that we will encounter here will be the fact that the analog data is converted to digital data using 12bit ADC which is 0-2047 values and therefore some of the data will be lost, but it should suffice for our project. The calibration has to be done for each individual pin. The calibration of the pins has to be tested before and after the system has been shutdown and brought up. The expected results here should be that the pins should remain calibrated while the system is down for several days. The method of testing will be to setup a power supply that will generate a known voltage. With a Digital Multimiter the voltage will be measured and compared to the know voltage supplied by the power supply. The microcontroller (ChipKit32) will acquire measurements of voltage every second. The incoming data from each pin will be calibrated to represent the correct values. The expected results from these tests are the proper calibration coefficients are obtained that provide the most accurate readings from the sensors. These calibrations will have to be able to remain accurate after the system is shutdown and turned back on with the sensor values matching external CpE190/EEE193A SENIOR PROJECT CSUS PROF. TATRO MAY 5TH, 2014 sensor readings. If the coefficients do not properly represent the current and voltage values after a shutdown then the error will be calculated to determine a range of accuracy for the sensors. This test will be completed when our sensor readings properly match the physical system even after a shutdown. The state of charge of the battery is a particular value that needs carful calibration. Since we are using coulomb counting to determine how full the battery is, the current measurements need to be accurate. To test the state of charge the voltage of the battery will be checked and an approximate value for the state of charge will be chosen and stored in the database. The battery charger will be turned on and the state of charge will be accumulated. By checking the battery voltage and current it will be known when the battery is full. Once this occurs we will check the state of charge accumulated by the sensors and adjust accordingly. The test what will be perform will include measuring the current and voltage going to and from the battery for a fixed time and compare the results with the state of charge algorithm results stored in the database. The expected results are a properly calibrated state of charge that will adjust as current flows in and out of the battery. If this state of charge method does not prove to be accurate then the voltage approximation method will be used to determine the state of charge. The demand response algorithm is programmed to read the database at regular intervals and decide if loads need to be turned off or not. Since we cannot change the state of charge on the battery instantly a test bench script was created to simulate the threshold values needed to trigger the demand response. A demand response test 99 bench will be written to simulate the changes in the state of charge. The system will respond and the results will be obtained showing proper function of the algorithm. The test will be performed several times with different values to make sure the proper functionality. Testing will be complete when the test bench properly changes the state of charge and the loads are shed in the correct time. The last remaining test needed for our system is to test the input system on the CMS. This will be tested by creating a test python script that will trigger the input API with known values. These known values can be checked for accuracy and the graphical user interface can be setup properly. This testing will be complete when the graphical user interface shows the incoming test data properly with the correct units. The sun prediction system will become an input to the load shedding algorithm by knowing how much sun will remain for a particular day. This will be completed using a real time clock and adjusting it to the proper time. Based on the time of day an estimated sun remaining will be calculated with a script. If there is more sun time available for that day then loads will be allowed to remain online longer then if there was less sun time available. The test will be performed at times we deem critical to ensure that the algorithm functions as expected. The expected results are a functional real time clock that can be set and hold its value after a power cycle. The test script will also be able to determine the time of day when queried. The testing will be complete when a test script is able to properly extract the time of day and use the remaining hours of sunlight to decide if loads will remain on. CpE190/EEE193A SENIOR PROJECT CSUS PROF. TATRO MAY 5TH, 2014 XXIII. CONCLUSION World Poverty is a major problem in the twenty-first century. There is no formula or equation that can be used to solve it and its effects are felt for generations on the people of this world. Many try to escape its grasp but fail due to lack of resources and the problem only perpetuates. Studies have shown direct links between energy access and the level of poverty because energy can open opportunity to help people rise out of poverty. Education has also been shown to be effective against poverty by opening doors to employment and entrepreneurship that did not previously exist. The village of Toggo and the village’s school, Toggo International Children’s Center, is one such place where poverty and opportunity intersect. The school is at a crossroads and its ability to offer opportunity to the children it serves is being hampered by the lack of reliable energy generation. By creating a DC microgrid reference design to provide reliable energy generation and battery storage through an optimized energy management system we have created a tool that provides access to energy and aids in education which strengthens the two biggest tools to fight poverty. Our DC microgrid uses renewable energy in the form of a PV array to harvest energy from the sun. By utilizing maximum power point tracking techniques our system insures the maximum possible energy is harvested for a given time and ambient condition. This energy is simultaneously sent to power local electrical equipment and any excess energy is stored in a battery through a battery charger via system integration of DC power converters. The battery not only helps mitigate the inherent 100 intermittency of the renewable energy generation, but also acts as the source of power for the microgrid during times when the sun is not shining. An energy management system tracks the power flow through voltage and current sensors located throughout the system. A microcontroller reads the sensors and sends them to a computer system for cataloging. Algorithms are used in the computer to calculate needed energy and track the state of the energy storage system. This energy management system can now respond to the demands placed on it and turn off non critical loads to ensure enough power will be available for the more critical loads. This paper has discussed the hardware and software aspects of the DC microgrid design as detailed and demonstrated by the laboratory prototype. The hardware was built with off the shelf parts and power converters interfaced in such a way as to act as a complete power system. The hardware was tested on a component level as well as a system level showing the designed functionality of power generation, storage and consumption. The software systems were detailed including the microcontroller analog to digital conversion and computer system algorithms. Software testing was completed on each software system to ensure proper calibration for accurate measurements. Algorithms were tested showing the ability to track available power and projected energy consumption on the microgrid system. During our market review research it was shown that the need for such an energy system was not only needed to aid much of the world’s 1.4 billion people that live under the poverty line but that it was also in demand. The microgrid approach CpE190/EEE193A SENIOR PROJECT CSUS PROF. TATRO MAY 5TH, 2014 using renewable energy is one of the most viable methods to supply energy while mitigating harmful effects to the environment. Our DC microgrid is designed to be flexible enough to handle the common tasks of supplying reliable power to its users while simplifying the need for user interaction to maintain that reliability. Our design took the specific needs of TICC in mind to insure the school can operate with reliable power. We can expect our design to be an aid not only for TICC but for others in similar situations to aid in education and healthcare through reliable energy generation. 101 CpE190/EEE193A SENIOR PROJECT CSUS PROF. TATRO MAY 5TH, 2014 [Online] available at REFERENCES [1] Anup Shaw, Globalissues.org [online], available at http://www.globalissues.org/article/26/poverty-factsNathaniel Gronewold, “One-Quarter of World’s Population Lacks Electricity” [online Journal], Scientific American, 2009 available at www.scientificamerican.com [3] EIA, US Energy Information Administration [online], available at education and poverty” 2009 University Autonoma de Barcelona. Available at www.sapsuab.files.wordpress.com/2009 United Nations Foundation, UN.org What We Do: achieving universal energy access, [online] available at http://www.unfoundation.org/what-wedo/issues/energy-and-climate/clean-energydevelopment.html Katherine Tweed, Peru will Provide Solar Power to Half a Million Poor Households, IEEE Spectrum [online] 2013, available at http://spectrum.ieee.org/energywise/energy/renewables /peru-will-provide-solar-power-to-500000-poorhouseholds/?utm_source=techalert&utm_medium=ema il&utm_campaign=080113 [8] Katherine Tweed, Japan Will Help Kenya Unlock its Geothermal Potential, IEEE Spectrum [online] 2013 available at https://www.spectrum.ieee.org/energywise/energy/ren ewables/japan-will-help-kenya-unlock-its-geothermalpotential [9] Bill Sweet, Obama’s $7Billion for African Electricity, IEEE Spectrum [online] 2013, available at [10] Dr. Jaber Abu-Qahouq, Travis Grant, et al. “mppt: a maximum power point tracking photovoltaic system”, [online],bryan.buckly., University of Alabama, available at http://bama.ua.edu/~bwbuckley/projects/mppt.html [11] A.Pradeep Kumar Yadav, S.Thirumaliah, G.Haritha, Market Review References [online] Available at : http://www.3tier.com/en/support/solar-prospectingtools/what-direct-normal-irradiance-solar-prospecting/ [29] 3TIER (2014), What is global horizontal irradiance? [online] Available at : http://www.3tier.com/en/support/solar-prospecting- “Comparison of MPPT Algorithms for DC-DC tools/what-global-horizontal-irradiance-solar- Converters Based PV Systems” International Journal of prospecting/ Advanced Research in Electrical, Electronics and Instrumentation Engineering Vol. 1, Issue 1, July 2012 102 http://www.ti.com/lit/an/slyt478/slyt478.pdf [28] 3TIER (2014), What is direct normal irradiance? Aina Tarabini, Judith Jacovkis, “Poverty Reduction Strategy Papers: analyzing the hegemonic link between [7] Instruments, [online] available at smarter-grid/obamas-7-billion-for-african-electricity May 2005, available at http://worldbank.org [6] tracking for pulsed-load applications”, Texas http://spectrum.ieee.org/energywise/energy/the- Jamal Saghir, Energy Working Note, Energy and Poverty: Myths, Links, and Policy Issues [5] [12] Chris Glaser, “Easy solar-panel maximum-power-point [13] Anup Shaw, Globalissues.org [online], available at http://www.globalissues.org/article/26/poverty-factsand-stats [14] EIA, US Energy Information Administration [online], available at http://www/eia.gov/todayinenergy/detail.cfm?id=10491 [15] Jamal Saghir, Energy Working Note, Energy and Poverty: Myths, Links, and Policy Issues May 2005, available at http://worldbank.org [16] Aina Tarabini, Judith Jacovkis, “Poverty Reduction Strategy Papers: analyzing the hegemonic link between education and poverty” 2009 University Autonoma de Barcelona. Available at www.sapsuab.files.wordpress.com/2009 [17] http://www.worldenergyoutlook.org/resources/energy development/energyaccessprojectionsto2030/ [18] http://www.ruralelec.org/energy_access_in_the.0.html? &L=0%2Ficontent.php%3Fid%3DU%2F%27%2F%27R% 20AttackeR%3F [19] http://en.wikipedia.org/wiki/Insolation [20] http://web.worldbank.org/WBSITE/EXTERNAL/COUN TRIES/MENAEXT/0,,contentMDK:22307440~pagePK:14 6736~piPK:146830~theSitePK:256299,00.html [21] http://en.sma-sunny.com/2013/09/06/saudi-arabia-thelargest-pv-module-covered-parking-lot-in-the-world/ [22] http://www.scientificamerican.com/article/world-useless-energy-oil-prices/ [23] http://www.ruralelec.org/fileadmin/DATA/Documents/ 06_Publications/Position_papers/ARE_Publication__Green_light_for_renewables_in_Developing_countries .pdf [24] http://www.worldbank.org/en/topic/energy/overview [25] http://go.worldbank.org/9NWE2YV410 [26] http://www.lightingafrica.org/ [27] http://go.worldbank.org/WCEDP90SZ0 http://www/eia.gov/todayinenergy/detail.cfm?id=10491 [4] %20MPPT%20Algorithms%20for%20DCDC%20Converters%20Based%20PV%20Systems.pdf and-stats [2] http://www.ijareeie.com/upload/july/Comparison%20of CpE190/EEE193A SENIOR PROJECT CSUS PROF. TATRO MAY 5TH, 2014 GLOSSARY ADC – Analog to Digital Converter AEI - Africa Electrification Initiative AFREA - Africa Renewable Energy Access DAC - Data Acquisition and Control Emoncms - Energy Monitor Content Management System IEA - International Energy Agency JICA - Japan International Cooperation Agency LAMP – Linux, Apache, MySQL, PHP MPPT - Maximum Power Point Tracking NGO - Non-governmental organization PV - Photovoltaic RERED – Rural Electrification and Renewable Energy Development Project SLA - Sealed Lead Acid TICC - Toggo International Children’s Center UNIDO - United Nations Industrial Development Organization WBS – Work Breakdown Structure 103 CpE190/EEE193A SENIOR PROJECT CSUS PROF. TATRO MAY 5TH, 2014 APPENDIX In this section we list several items including vendors who have supported our efforts, the important data sheets for the devices that are critical to our laboratory prototype, and the resumes of each member of our team. A. Vendor Support and Industry Contacts There were several industry contacts that we made and who have in some way contributed to our project’s success. In no particular order, these contacts are Susan Wheeler from SMUD, Jeff Berkheimer from SMUD, and Lunar Onovakpuri from SMA, America. Susan is the Workforce Planning and Education Relations Strategist for SMUD. She was instrumental in helping us to find and engineer at SMUD who could serve as a technical advisor for our project. Jeff Berkheimer is the SMUD engineer that Susan put us in contact with. While we have not had a chance to personally meet with Jeff, his willingness toassist us by reviewing our design will hugely important in the upcoming semester, and are appreciation for this cannot be overstated. Lunar is a another industry engineer who has given us advice on our laboratory prototype. His help with the MPPT, and load support features of our design is greatly appreciated. To show our appreciation to these individuals we will be sending them thank you letters. Our letters for each are shown below. Susan Wheeler Thank You Letter 104 Dear Susan, Your efforts in finding us a qualified engineer to assist us as a technical advisor has and will continue to be a huge help to our team. A good amount of our microgrid design success is due to your efforts. On behalf of Sacramento State University and Senior Design, we would like to thank you very much! We look forward to our continued partnership with working with both you and SMUD. Sincerely, Fall 2013-Spring 2014 Team 5 Will, Matt, Troy, and Tanya Jeff Berkheimer Thank You Letter Dear Jeff, Your willingness to come on board as our team’s technical advisor and to take time out of your busy schedule to assist us in reviewing our technical design has meant a great deal to us. While we have not yet had the chance to meet with you and show you what we have come up with so far, we know that in the next upcoming phase of our design process your input will provide us with invaluable feedback and be a large contributor to our success. On behalf of Sacramento State University and Senior Design, we would like to sincerely thank you and say that we look forward to working with you in the future. Sincerely, Fall 2013-Spring 2014 Team 5 Will, Matt, Troy and Tanya Lunar Onovakpuri Thank You Letter Dear Lunar, Your advice regarding our senior design maximum power point tracking feature as well as your advice and input regarding the CpE190/EEE193A SENIOR PROJECT CSUS PROF. TATRO MAY 5TH, 2014 load support feature was a huge help in making our microgrid prototype a success. We also appreciate your information regarding industry trends and other precautions to look for such as power induced degradation of our solar panels. Working with you has been a pleasure and we look forward to our continued partnership together. On behalf of Sacramento State University and Senior Design, we would like to thank you! Sincerely, Fall 2013-Spring 2014 Team 5 Will, Tanya, Troy, and Matt B. • • • • • • • Input DC 10-32V Output DC 17.5V Output current: 8A Max Working frequency: 380KHz Capacitances:2x 470uF/35V(input) ; 2x 330uF/50V(output) Operating temperature: -40°c to +85°c Microgrid Buck Voltage Regulator for Computer System Power Supply • Data Sheets/ Specifications and Information for Critical Devices in our System Power Electronic Converters • Microgrid Electrical Equipment Boost Support DC Voltage Regulator • • • • • • • • • • • 105 Module properties: 150W boost nonisolated module Module properties: 120W buck nonisolated module Input DC 4-30V Output DC 12V Output current: 10A Max Working frequency: 150KHz Operating temperature: -40°c to +85°c Microgrid Buck Boost Voltage Regulator for Electrical Equipment CpE190/EEE193A SENIOR PROJECT CSUS PROF. TATRO MAY 5TH, 2014 • Microgrid Buck Battery Charger Max Power Point Tracker • Module properties: 120W buck nonisolated module • Input DC 7-40V • Output DC 12-14.4V • Output current: 8A Max • Working frequency: 180KHz • Operating temperature: -40°c to +85°c Microcontrollers • • • • • • • 106 Module properties: 150W buck boost non-isolated module Input DC 6-32V Output DC 12V Output current: 13A Max Operating temperature: -40°c to +85°c CpE190/EEE193A SENIOR PROJECT CSUS PROF. TATRO MAY 5TH, 2014 107 CpE190/EEE193A SENIOR PROJECT CSUS PROF. TATRO MAY 5TH, 2014 Solar Panel 108 CpE190/EEE193A SENIOR PROJECT CSUS PROF. TATRO MAY 5TH, 2014 C. Team 5 Resumes 109 CpE190/EEE193A SENIOR PROJECT CSUS PROF. TATRO MAY 5TH, 2014 110 CpE190/EEE193A SENIOR PROJECT CSUS PROF. TATRO MAY 5TH, 2014 111 CpE190/EEE193A SENIOR PROJECT CSUS PROF. TATRO MAY 5TH, 2014 112