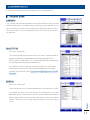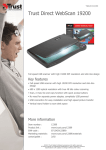
1
Congratulations on the purchase of your Webscan barcode verifier! With this system, you can reach a new level of quality control. This manual will guide you in using your Webscan barcode verifier and in fully understanding the available features. It will also assist you in understanding the verification results shown on the display and printed reports. TABLE OF CONTENTS Revision 1.0.04 Congratulations on the purchase of your TruCheck Rover™ barcode verifier! With this system, you can reach a new level of barcode quality assurance. The Webscan TruCheck™ family of laser and CCD imager based barcode verifiers evaluate 1D and 2D barcodes and grade them according to international and industry standards established by ANSI, ISO/IEC, CEN, GS1 and other organizations. The Webscan TruCheck™ Family includes both PC based verifiers, such as the TruCheck Laser USB™, TruCheck Optima™ and TruCheck Omni™ series as well as the portable TruCheck Rover™ products. This User Manual covers the TruCheck Rover™ group of portable 1D/2D barcode verifiers. The TruCheck™ system is as easy to use as it is powerful. The main features of the system are: Accurate barcode verification according to global standards CCD imager with integrated illumination Repeatable and accurate results Calibrated and traceable to NIST standards Intuitive user interface Detailed reporting Storage of verification results for immediate printing or delayed batch printing Export of reports in Adobe™ .pdf file format Consistent results independent of operator training or skill This manual will guide you in using the TruCheck Rover barcode verifier and in fully understanding the available features. In addition, it will assist you in understanding the verification results shown on the display and printed reports. TruCheck and TruCheck Rover are trademarks of Webscan Inc. Adobe is a trademark of Adobe corporation. Check the verifier package for the following items. TruCheck Rover™ Verifier Power Supply with Micro USB cable connector USB data cable User manual Webscan Calibration Card, or one of several available Calibration Cards (sold separately, see the note below) If any of the above items are missing, please contact Webscan. (Contact information can be found in the “if you need service” section near the end of the manual.) NOTE: A calibration card is required for proper operation of the TruCheck Rover™ barcode verifier, so be sure that you have one before using the barcode verifier for the first time. Before we begin, you may need to calibrate your verifier. For more information on calibration, please refer to the calibration chapter on page 15. Notice the blue “Go Live” button on the screen. When clicked, the camera will capture live images, which will be shown in the middle of the screen. Place the imager over the symbol to verify, using the "cross-hair" as a guide. NOTE: The white "Start" button on the imager will do the same thing as pressing the blue “Go Live” button on the screen. If more than one code is in the field of view, you can draw a box around the code you want to verify. For more information, please see . You will notice that the “Go Live” button now says “Verify” as shown in the picture to the right. The image on the screen will show whatever is in the field of view of the imager. When the barcode is positioned correctly, click on that button (or the white “Start” button) again to begin the verification. (The "Go Live" button will change to "Abort" if you wish to cancel the verification). NOTE: After a certain period of time, the camera will be turned off to conserve battery power. If this happens, press the "Go Live" button to initialize the imager again. When the verification is complete, the main screen will show a static image of the symbol verified. The bottom box contains a summary of the result of your barcode evaluation in a color-coded table. This table contains three sections: The data, the application standard Pass/Fail result, and the overall quality grade. Note that if you have application standard set to "Pass Grade N/A", then the application criterial section will be omitted and the data box will be larger. Each of the three sections in the summary of results is color-coded: Green for pass or a grade of A or B Yellow for a grade of C Red for a fail or grade of D or F NOTE: A data format error will result in the data section being colored red and the application criteria to fail and also will be shown in red, while the quality grade may be shown in green or yellow depending upon the quality grade. Pressing on any of the sections of the summary results brings you to a detail screen. Pressing on the overall grade brings you to the “Quality” tab of the detail screen. Pressing on the data section brings you to the “Data” tab. Pressing on the application criteria brings you to the “General” tab. The “Details” screen contains several tabs which you can move between by tapping on the tab title. More information describing the contents of the detailed information shown in each tab can be found in section . Press the back button and let’s take another look at the home screen. The home screen also displays the battery capacity, located in the upper right hand corner. In the upper left hand corner there is a "gear" symbol that will open the settings window. For more information on settings refer to section Next to the settings button there is a “Rotate” button. This will rotate the orientation of display (reversing the top and bottom of the screen) to make it more convenient if the unit is positioned upside-down for better placement on a code. Next to the “Rotate” button is the “Shut Down” button. For directions on using the “Shut Down” button see section There are two buttons located on the bottom of the screen. One that says, “All Results”, and the other that says “Print”. The print feature will only work if you have a supported printer connected. For more information on the “All Results” button, see section Specifying regions in the live image may be required for the following reasons: Multiple codes in the field of view Defining a section of a linear code If the code is off center In order to define a region, the box next to “Use Selected Area” must be checked. Next, position your finger where you want the region to start, and begin drawing a box with your finger. Remove your finger from the screen when you are done. When "Use Selected Area" is checked, a region is always in use, but be careful because it may be difficult to see if it is drawn very small. You can always redraw a region, or turn off "Use Selected Area" to go back to using the whole screen as your region. The region will be deselected when you uncheck the “Use Selected Area” button. For linear (1D) barcodes, the region may be drawn inside the barcode or extending around the barcode. For 2D matrix symbols and linear stacked symbols, the region should be drawn surrounding the entire code. The verifier will need the entire finder pattern, including quiet zones within the selection to properly grade the code. Region inside a linear code. Region surrounding a code. We will use a UPC-A symbol as an example when verifying linear barcodes. First, select the “Settings” button (looks like a gear) to make sure 1D verification is enabled as described on page 17. Once you are in the settings window, look for the “Symbologies” button in the upper left hand corner. Next, select “Enable 1D (Linear)” If you are verifying one of the specifically listed 1D codes, please select the box next to the symbol types you will be verifying. Common 1D symbologies, such as UPC/EAN, Code 128 and Code 39 are always enabled so there is no enable button for those symbologies. Press the “Save” button to return to the main settings screen. From there you can hit the “Close” button to return to the main window. Press the “Go Live” button on your user interface or the white “Start” button on the center of the verifier, whichever you prefer. When “Live”, you will see an image on the display. Position the red target shown on the main screen in the center of the barcode. You can optionally select a region; this will need to be drawn through the UPC code. See for more information on how to properly select a region. Next, press the “Verify” button on the screen or press the white “Start” button. After verification, the main screen will show a static image of the symbol verified. The bottom box contains a summary of the result of your barcode evaluation in a color-coded table. This table contains three sections: the data, the application standard Pass/Fail result, and the overall quality grade. Note that if you have application standard set to "Pass Grade N/A", then the application criterial section will be omitted and the data box will be larger instead. Each of the three sections in the summary of results are color-coded: Green for Pass or a Grade of A or B Yellow for a Grade of C Red for a Fail or Grade of D or F NOTE: A data format error will result in the data section being colored red and the application criteria to Fail and also will be shown in red, while the quality grade may be shown in green or yellow depending upon the quality grade. Pressing any of the sections of the summary results brings you to a detail screen. Pressing the overall grade brings you to the “Quality” tab. Pressing on the data section brings you to the “Data” tab. Pressing on the application criteria brings you to the “General” tab. The details screen contains several tabs which you can move between by tapping on the tab title. More information describing the contents of the detailed information shown in each tab can be found in section . This section refers to 2D Matrix symbologies such as Aztec Code, Data Matrix, or QR Code. To verify a 2D symbol, first click on the “Settings” button (looks like a gear) to make sure the type of symbol you will be verifying is selected. Once you are in the settings window look for the “Symbologies” button in the upper left hand corner. Select the box(es) next to the symbol types you will be verifying. Then press the “Save” button to return to the main settings screen. From there you can press the “Close” button to return to the main window. Once there you should see the “Go Live” button again. Press the “Go Live” button and a center target will appear. Center your symbol in the screen with the target in the middle of the code. NOTE: If multiple codes are present, you will need to draw a region around the desired symbol. The region must be drawn around the outside perimeter of the code including quiet zones. More information on properly defining regions is explained in section on page 8. Once you have made your region selection (if required), press the “Verify” button or press the white “Start” button on the verifier to begin verification. After verification, the main screen shows a static image of the symbol verified. The bottom box contains a summary of the result of your barcode evaluation in a color-coded table. This table contains three sections: The data, the application standard Pass/Fail result, and the overall quality grade. Note that if you have application standard set to "Pass Grade N/A", then the application criterial section will be omitted and the data box will be larger instead. Each of the three sections in the summary of results are color-coded: Green for Pass or a Grade of A or B Yellow for a Grade of C Red for a Fail or Grade of D or F NOTE: A data format error will result in the data section being colored red and the application criteria to fail and also will be shown in red, while the quality grade may be shown in green or yellow depending upon the quality grade. Pressing on any of the sections of the summary results brings you to a detail screen. Pressing on the overall grade brings you to the “Quality” tab. Pressing on the data section brings you to the “Data” tab. Pressing on the application criteria brings you to the “General” tab. Within the details screen you can press any of the tabs to move between the tabs mentioned above and/or the other tabs. More information describing the contents of the detailed information shown in each tab can be found in section . In this section, we will review the results reported for your verified barcodes. The “Summary” tab shows the application criteria (if selected) Pass or Fail, the overall grade, the data content of the symbol and the symbology (type of barcode). You can get to this tab from the main screen by clicking on the application criteria section in the summary results. Once in the detail results screen, you can click on this tab from any other tab. Click on the “Quality” tab. The measured quality parameters are shown in this section, including individual parameters defined by the applicable barcode grading standard (such as ISO/IEC 15415 or 15416) that is in use. The particular parameters will depend on the symbology and quality grading standard in use. For example, the screen shown here contains the grades of an A grade Data Matrix symbol according to ISO 15415. Detailed explanation on the grading standards can be found in section . Click on the “General” tab. This section will show you the general characteristics of the barcode you verified. For example, the screen shown here contains the characteristics of the same Data Matrix symbol. Here we can see that the vertical bar width growth (BWG) is slightly negative, while the horizontal bar width growth is even more negative, and the X dimension of this symbol is approximately 19.8 MIL (.0198 inch) or 0.5mm. Click on the “Data” tab. When viewing this tab, all of the data content of the symbol is shown. Detail depends on symbology and application standards selected. When the application standard is set to GS1, the data will be parsed and checked for conformance to GS1 data rules, and each AI field will be shown on its own line. The data detail may be very long for some barcodes, such as GS1 Coupons or some 2D symbols with many data fields. You can scroll down using the scroll bar on the right side of the screen if the length of the data detail exceeds the height of the screen. Click on the “Image” tab. This tab will allow you to customize the appearance of the image of the symbol that was just verified. This tab is meant to aid in the diagnostics of the code. You can display the image in black and white, or even as a "blurred" image resulting from processing the original image with the aperture. You can turn on or off the "real grid" (result of reference decode algorithm), ideal grid (evenly spaced grid used for evaluating the parameter "Grid Non-uniformity”), and the color coded circles which indicate the modulation of each cell in a 2D symbol. There are many ways to print reports. The detailed results screen contains a "Print" button at the bottom which will send the results to an attached supported printer. There is also a “Print” button on the main verification screen, so you can print without going into the detailed results screen. You can also enable "Auto Print" in the “Report Options” of the “Settings” menu, as described on page 20. The contents (amount of detail) of the printed report can be customized in the “Report Options” for 1D and 2D symbols as described on pages 19 and 20. Reports can also be formatted as Adobe™ PDF files and exported. This can be done from the "All Results" database as described in the section. Directly printing Adobe™ PDF reports is not supported in the TruCheck Rover™ at this time. You can "batch print" results from verifications that you performed earlier using the “All Results” section as described in This screen will display a data base of your past verification results and give you the ability to view, export, and print those results. 7.1 FILTER The “Filter” feature will sort through your results so that you can pick which results you view and which ones you do not. You can select to view verifications that have not yet been printed or exported or hide verifications that have not yet been printed or exported. You can also select everything or unselect your previous selections in this window. 7.2 EXPORT The “Export” feature will allow you to select the way the selected verification results are exported to the connected computer. You have the option to export all of the results into one PDF or into individual PDF files. 7.3 PRINT Pressing the “Print” button will print a summary report of the selected results. 7.4 DETAIL The “Detail” button will show the selected result in the more details format giving you access to the “Summary”, “Quality”, “General”, and “Data” tabs. If multiple results are selected the system will choose the last result selected and pull up those detailed results. 7.5 PRINT NEW The “Print New” button will print all new verification results that haven’t been printed yet. 7.6 SETTINGS The “Settings” menu (accessed by pressing the gear icon at the botton of the “All Results” section) allows you to customize what result information is shown in this "All Results" table. You are also given the ability to control the amount of rows displayed, as well as set the system to always hide either printed and/or exported results. Your TruCheck™ verifier is a precision optical electronic instrument. Periodic calibration is necessary to account for changes in the environment. Ambient light and temperature are typical environmental conditions that frequently change. Electrical components also drift (change characteristics) over time and this can affect the accuracy of measurements made by the TruCheck™ verifier. Webscan recommends that you calibrate on a monthly basis; this is noted next to the calibration reminder. Calibrating your verifier with a proper calibration card ensures that your results are accurate and traceable to NIST standards. Please locate your calibration card for the next steps in this process. A Webscan Calibration Card comes standard with the TruCheck Rover™ verifiers. However, GS1 Calibration cards are sold separately. In most cases, your sales representative should have explained the different card options and one should be included in your packaging. NOTE: Calibration cards have an expiration date listed on the card. It is very important to only calibrate your unit with a valid card. If you would like to order a calibration card for your unit, please contact [email protected] or call 303.485.6811. The following calibration cards are available from Webscan. More information on the different calibration card options can be found on our website at: www.webscaninc.com/resources/calibration-cards. Part Number Description 4899 3MIL Calibration and Conformance Symbol (UPC/EAN) 1556 6MIL Calibration and Conformance Symbol (UPC/EAN) 4744 GS1 Data Matrix Calibration and Conformance Symbol 5136 Webscan Calibration Symbol 1. Note the Rmin/Rmax values logged on your calibration card. If using a linear one-dimensional calibration symbol on a GS1 calibration and conformance symbol, locate the “Calibrated Conformance Standard” sheet that was included with your calibration target. 2. Next click on the “Settings” icon shaped like a gear. 3. Press the “Calibrate” button in the System Settings section towards the bottom of the screen. 4. Select the bullet appropriate to the type of symbol (Data Matrix or UPC) that you will be using to calibrate. Note that Webscan calibration cards contain both types and you can choose either one. 5. Next enter the Rmax and Rmin values in the respective textboxes. These values can be found by using the chart on page 1 of your “ Calibration Conformance Standard-ANSI Print Quality Analysis” sheet GS1 linear Calibrated Conformance symbols. On the GS1 Data Matrix Calibrated Conformance standard and on the Webscan calibration card, these are logged directly on the card. 6. You may set a calibration reminder interval at this time if desired. 7. Click on “Calibrate.” The system is now being calibrated. This may take a few seconds. NOTE: The report included with some GS1 calibration cards (notably the 6 MIL UPC/EAN card) gives all the values in tenths. i.e. 69 represents the number 6.9. The TruCheck Rover™ accepts whole numbers only so you must round this value to the nearest integer. For the previous example of 6.9, you would enter 7. Likewise, the value 824 represents 82.4 so you would enter 82. Once the Rmin and Rmax values are entered during the initial calibration, they will be stored in the system for future use. 8. At the end of the calibration process, the calibration screen will show “Calibration Successful”. If this is not the case, repeat calibtration or contact Webscan technical support for assistance at [email protected] or +1 (303) 485-6811. 9. Check that the calibration settings are within range by verifying the calibrated symbol and confirming the results. Results are displayed in the “Quality Parameters” tab on the User Interface. Beside the SC (Symbol Contrast) grade, RL/RD (Reflectance Light element/ Reflectance Dark element) values are displayed and should be equivalent or within tolerance to the Rmax/Rmin values logged in at calibration. The Rmax value should match within 4 and Rmin should match within 2. Note that these tolerances are not percentage of the value, but are used as whole numbers. For example, a target calibration value of 85 would match within the required tolerance if Rmax is reported with a value between 81 and 89. Pressing the “Settings” icon (looks like a gear) from the main screen will bring you to the main “Settings” screen which is really a menu of different sections of available settings. The different available settings sections are: Verification Scan Options: Symbologies, Applications, Decode Options, Report Options User Information: User and Job Details System Settings: Calibrate, Database, Advanced, Update 9.2.1 SYMBOLOGY SETTINGS Select the appropriate box for the type of symbol you are verifying. For best results, deselect all boxes for code types you are not verifying. Common 1D linear symbologies are automatically enabled and do not show up on the “Symbologies” screen. 1D (LINEAR) SYMBOLOGY SETTINGS OPTIONS In addition to having the option to select a less common 1D symbol you can also select the appropriate aperture size for the symbol that is to be verified. 2D SYMBOLOGY SETTINGS OPTIONS One or more symbologies can be selected, but it is recommended for best performance that only the symbologies used in the desired application be selected. For example, selecting QR Code when you are not actually verifying such symbols will slow down the process. APERTURE This is the synthetic aperture size the system will use to process the raw image into the reference (blurred) image. Aperture size has a significant effect on the grade. Larger aperture sizes will "filter" out small imperfections in printing but will also be less sensitive to small elements in the barcode. Conversely, smaller apertures will result in higher resolution but may be negatively impacted by small defects in printing. The correct aperture size to use should befined in an application specification, quality specification, or both. If you are unsure, we recommend that you select "Auto Ap." Auto Aperture- Selecting “Auto Aperture” will almost always result in the correct aperture size being used according to your application settings. The aperture will be selected automatically depending upon the symbol type and its X dimension to adhere to the most common industry-wide application standards. Auto 80% uses a test aperture 80% of the size of the barcode’s X dimension. Other specific aperture sizes, common to many industry standards, such as "5 MIL" or "10 MIL" may be selected by pressing the corresponding button. 9.2.3 APPLICATION STANDARDS GS1- Selecting the GS1 Application standard will use GS1 rules to select the aperture size if "Auto Ap." is selected in the “Symbology” settings. It will also check the data content of the barcode to confirm that it meets the rules for GS1 data formats. The application Pass/Fail will depend upon the quality grade of ‘C’ or better and the data format passing with no errors. The data parsing details of GS1 data strings will be displayed on the “Data Detail” tab of the detailed results screen and also on the printed reports. GS1-Auto- The barcode will be checked for a GS1 symbology (for example, whether it contains a Function 1 character encoded as the first character) and only then apply the GS1 application standard rules. GS1-Always- The barcode will always be tested according to GS1 rules, and a non-GS1 symbology (such as a Code 128 symbol without a F1 character at the beginning) will fail. MIL-STD 130 (UID)- This application standard will check for compliance with UID requirements of MIL-STD 130 including required grade and properly formatted data. The minimum grade depends upon the grading standard in use and the data can be formatted using DI's, TEI's or AI's using ISO/IEC 15434 format rules. Pass Grade- Establishes the minimum acceptable grade for the user’s application. When activated, this displays a new field on the main screen that not only displays the grade, but turns red if the grade received is lower than the minimum set, and green if the grade is higher. This is useful for providing an at-a-glance acceptance or failure. (A-F or 0.0-4.0). Selecting N/A will omit the application criteria from the main screen. HIBCC- Enables barcode data parsing in accordance with the Health Industry Bar Code Council standard. 9.2.4 DECODE OPTIONS 1D LINEAR OPTIONS I25/ITF14- Controls the "decodability" algorithm used to grade I25 barcodes. When evaluating per ANSI/ISO I25 standard, choose I25, but you should select ITF14 when evaluating ITF14 symbols according to GS1 criteria. UPC Sup- Used to evaluate UPC Supplemental symbol extensions. Options include none (default), Auto, 2-digit, and 5-digit. Choose “Auto” to let the software detect when a supplemental is present. Image Mode- This option is used to verify barcodes that are either inverted (white on black) or pre-press (such as film). Options are Normal, Pre-Press Negative, Pre-Press Positive, or Inverted Image. 2D OPTIONS QR Code Options: ISO-18004 Compliant- Verifies QR code in strict adherence to the ISO-18004 specification. Adjust for Substrates- Uses a one module quiet zone to threshold the light space elements. This is beneficial for QR Codes printed on films or plastic where the internal spaces cannot achieve the reflectance levels of a four module quiet zone. This helps a printer determine print quality without modulation degradation due to substrate. Mobile QR (Reduced QZ) – Only one module quiet zone is tested. Printers can check print quality ignoring artwork that interferes with the 4 module quiet zone specified in ISO18004. Dot Peen- Use this option for barcodes created with the dot peening process, which is a process where dots are peened onto a metal surface. This helps connect the dots in the decode process. Invert Image- For images printed white on black. X-Dimension Range- Utilized with the AIM-DPM quality standard to define the range of X dimensions used to decode a symbol, also used as stick size range when utilizing the DOT PEEN option. Applications standards configure the verifier to grade according to an individual entities’ rules for what criteria is to be used to grade the codes and whether or not the encoded data meets the data formats for the application. 2D applications standards currently implemented are the GS1 rules and the US DOD UID mandate. 9.2.5 REPORT OPTIONS This setting allows you to customize the type of information printed on your reports. 1D (LINEAR) OPTIONS Quality Parameters- The individual parameter grades for each scan will be included in the printed (or exported PDF) report. Codewords- Reports on the codewords for PDF-417, MPDF, CC-A, CC-B, and CC-C symbols. ECC Details- Report will include information about the error correction process for symbologies that include Reed-Solomon error correction. 2D OPTIONS ASCII Values- Turns on the reporting of the encoded ASCII values. Values are reported on the verification reports as well as in the “Data Detail” tab. ISO-15415- Reports and Displays in accordance with the International Standards Organization Barcode Quality test specification for two-dimensional symbols. Selecting this standard allows for the selection of ISO 15415 reporting options: AIM-DPM- Select this if you want to utilize the AIM-DPM verification standard. This can be selected with or without the Dot Peen selection. Quality Parameters- The individual parameter values defined in the application grading standard will be included in the printed (or exported PDF) report. Codewords- Reports on the codewords for all 2D symbols. ECC Details- Report will include information about the error correction process. AS-9132- Reports and Displays in accordance with the SAE AS9132 quality requirement standard for part marking Data Matrix code. This option is only selectable when Data Matrix is chosen in the Symbologies. AIM:ISO (ISO 16022:2000) – Reports and Displays in accordance with the Quality section of the obsolete ISO/IEC 16022 specification for Data Matrix from the year 2000. ( Note that ISO/IEC 16022 has been revised to require ISO/IEC 15415 as the basis of quality grading). GENERAL Auto Print- When this feature is selected, reports will automatically be sent to a connected supported printer as soon as verification completes. 9.3 USER INFORMATION “User Information” can be found in the “Options” menu under “User Information”. This option will give you the ability to track who performs the verification and exactly what is being verified. This feature is not supported in the TruCheck Rover™ at this time. The user will always be Default User. 9.3.1 USER INFO User information can be listed on reports. This window will allow you to create user profiles. This feature is still being developed by our software engineers and will be available soon. 9.3.2 JOB DETAILS Job details will allow you to label each batch of barcodes you verify and what products or packaging they relate to. It will also give you the ability to attach a start and end time to the verification batch. This feature is not supported in the TruCheck Rover™ at this time. The job name will always be Default Job. 9.4 SYSTEM SETTINGS These settings are related to the TruCheck Rover’s internal settings as opposed to the verification settings that were just covered. 9.4.1 CALIBRATE See section for more information on how to calibrate your verifier. Please also locate your calibration card before you begin the calibration process. 9.4.2 DATABASE The TruCheck Rover™ stores all results within a database, so that results can be accessed after all verifications are completed. By utilizing a database, the Rover allows you to print or export verification reports on demand. The database is limited to the space allowed on the Rover but can be cleared and reset whenever needed. 9.4.3 ADVANCED Advanced settings enable you to make initial setup that should not be changed routinely. The printer type may be chosen to correspond to either a thermal receipt printer or a dot-matrix receipt printer. The Touch Screen setting is used to "calibrate" the position of the touch sensitive screen to the displayed image. The Battery section is used to control the low-battery cutoff value. These areas of Advanced settings should be used only by Webscan personell or by users who are in contact with Webscan Tech Support. 9.4.3.2 SYSTEM INFO The system options screen will allow you to set the current time and date. It also gives the option to set a camera timeout time frame and enable an automatic sleep mode. For added security, a login timeout may also be added in this screen (not currently supported). 9.4.3.3 VIEW LOG This feature may be useful to Webscan Tech Support. 9.4.3.4 VERSION INFO This feature can be accessed by going to the “Settings” menu and selectings the “Advanced Settings” button, next select the “Version” button. This screen will show you your current version of software and its release date. 9.4.3.5 ADVANCE CONFIG These settings are intended to be used when troubleshooting with a Webscan representative and are password protected. 9.4.3.6 TOUCH SCREEN This button will lead you to a calibration screen that will allow you to recalibrate the touch screen. Once you press the “Touch screen” button, the calibration process will begin when the “Calibrate” button is selected. The next screen is a dark window with a small target; you will want to hit as closely to the center of the target as possible. The target will move five times, and each time you will want to try and hit the center of the target. Once all five targets have been selected, the system will load the new calibration settings and take you back to the main screen. 9.4.3.7 BATTERY This window will allow you to alter the min and voltage on the battery as well as the minimum camera voltage. It also gives you the ability to enable a battery usage log. These settings should not be modified without Webscan Tech Support instructions. 9.4.4 UPDATE See section for more information on how to update the software on the TruCheck Rover™. Software Updates are available online at www.webscaninc.com under the resources tab. Select “Software Update Request” and fill out the request form. You can also contact Webscan Customer Service to request the upgrade by e-mail, [email protected]. We recommend joining our mailing list or following us on Facebook or Twitter to receive update notifications. http://www.facebook.com/webscaninc http://www.twitter.com/webscaninc Once you fill out the request form, you will receive an e-mail containing a link to download the software update. After downloading the software update file from this link, you will need to plug your TruCheck Rover™ into your computer using the USB data cord provided. Next, press on the settings button (shaped like a gear). A screen will appear with several settings options; please select the “Update” button. See the figures above for reference. The next screen will review the update process and list two options: “OK” or “Cancel”. Do not click on “OK” yet. The Rover will appear in Windows Explorer as a removable disk. If a window appears on your computer asking to scan the removable disk, select “Continue without scanning.” Drag or copy the tcrover_update.dat file to the removable disk. Now select the “OK” button on the Rover. You will see a progress bar showing the software being copied to the Rover. When it finishes, a screen will pop up stating that the software was updated. Select the “OK” button. You now need to restart the Rover to make the update effective. You should do this by powering off the Rover and then back on. To shut down the TruCheck Rover™, please tap the “Shut Down” button located at the bottom right hand corner of the main screen. Three larger buttons will pop up giving you the option to put the unit in a sleep mode, power off the unit or to cancel the command. Sleep mode will put the verifier in a state of hibernation; it will consume less battery power than usual and will have a black screen as if it is powered down. However, it will still be partially on and can be put back into a state of full power by pressing the white “Start” button. If the “Power Off” button is selected the unit will be turned off completely. Simply press and hold down the white “Start” button to restart the unit. The ANSI parameters section lists each of the nine ANSI parameters and gives a summary of the measurements based on all scans taken. Each parameter is completely explained below. Note that some of these parameters are average values over all of the scans, and the averages may skew or alter the apparent results. For a rigorous review of the ANSI process given on each of your codes, you should check the ANSI Matrix for each code which is described in the next section. This section may be very helpful in situations where the barcode cannot even be read. Therefore, the descriptions of each parameter below will explain what is measured in the case where a code is read and not read. When a code is not read, the scan is analyzed for apparent quiet zones, and the bars and spaces in between are used for the ANSI analysis. 1. EDGE: Edge Determination Checks that each edge between bar and space can be detected and no false bars or spaces appear due to “splitting” of bars or ink splattered into spaces. If at least one scan results in a decoded barcode, the EDGE value is the number of bars and spaces, not including quiet zones, in the code. If no scans result in a decoded barcode then the EDGE value shown is the number of bars and spaces found between quiet zones (or apparent quiet zones) on the scan on which the most bars and spaces were found. The Scan Reflectance Profile graph can also be very helpful in analyzing a code that cannot be decoded. 2. Rl/RD: Minimum Reflectance Checks that the darkness of the bars is sufficient. Strictly speaking, the amount of light reflected by the bars (bar reflectance) must be less than half the light reflected by the spaces (space reflectance). The values shown are the light reflectance and the dark element reflectance separated by a slash. The light reflectance is the maximum reflectivity found in the scan (lightest or best space), and the dark reflectivity is the minimum reflectivity found in the scan (darkest or best bar). The requirement is for the minimum reflectivity to be no more than half the maximum reflectivity. If this requirement is met, the grade will be A, otherwise it will be F. 3. SC: Symbol Contrast Measures the contrast between the brightest space and darkest bar. The result is assigned a letter grade of A, B, C, D or F, with A being the highest contrast. The contrast is the difference between the maximum reflectivity (lightest or best space) and the minimum reflectivity (darkest or best bar). Note that Symbol Contrast is the difference between light and dark, and Rl/Rd above checks the ratio of these values. A > 70 B 55-70 C 40-55 D 20-40 F <20 4. MinEC: Minimum Edge Contrast Checks that the contrast between adjacent bars and spaces is high enough. When a barcode is scanned, a reading device must locate the edges between each bar and space. If the difference in the light and dark elements is not significant, this may not be achieved. Note that MinEC finds the worst-case contrast difference between each bar to space transition, whereas Symbol Contrast finds the best-case difference at any point across the barcode. 5. MOD: Modulation Checks the edge contrast as a fraction of the overall or best case contrast measured in Symbol Contrast. Modulation is an important measure of minimum edge contrast since most barcode reading devices employ “adaptive thresholding circuits” of some type that are sensitive to a symbol’s contrast in order to detect transitions between bars and spaces. If all bars and spaces were the same brightness, the minimum edge contrast would be equivalent to symbol contrast. In this case, Modulation would be 100 percent. If some spaces are less bright than the brightest one, modulation will be some fraction of the overall contrast. Modulation therefore measures the amount of available contrast that is manifested in the worst-case bar to space transition. The percentage is assigned a letter grade. Excessive ink spread or bar growth can result in low modulation because very narrow spaces appear to be filled in by the encroaching bars in the Scan Reflectance Profile. If you have read down to here, you deserve a reward! Call Webscan at 1877-WEBSCAN for your FREE gift. 6. Def: Defects The worst-case change in reflectance within a single bar or space is a defect. The largest difference in reflectivity found in a single bar or space is measured as a percentage of the Symbol Contrast and assigned a letter grade. Defects normally measure breakups or voids within bars, ink spots in spaces, or even the grain of a substrate in spaces. This very serious issue for scanners was not directly addressed by traditional verification techniques. 7. DCD: Decode The widths of each bar and space are measured and used to interpret the data content of the barcode according to a specific mathematical formula appropriate for the barcode type. If the barcode cannot be decoded according to the formula, the accuracy of the bar and space widths are inadequate. The printout shows the number of scans decoded over the number of scans taken, e.g. 8/10 means 8 out of 10 scans decoded. 8. DEC: Decodability Determines how accurate the bar and space widths are and how easily the widths can be determined. A perfectly accurate barcode will have 100 percent decodability, but decodability as low as 25 percent is often acceptable. Decodability is always measured in terms of the formula used to interpret the bar and space widths into the data content of the barcode. In order to read barcodes, thresholds between element widths are normally established according to prescribed “decode algorithms”. Decodability is normally the percentage of the overall tolerance range for a bar or space width that is not used up by inaccuracies. See Appendix B for an example. 9. QZ: Quiet Zone This refers to a dedicated amount of blank space on the left and right of the barcode. Each symbology specifies a minimum quiet zone. For example, UPC-A barcodes should have at least a nine module quiet zone on each side, whereas an EAN-13 barcode permits legal quiet zones to be as small as seven modules. 1. UEC (Unused Error Correction): This is the percentage of error correction capability that is available for further incorrect modules. The assignment of grade is according to the following table: UEC % > 62 > 50 (but less than 62) > 37 (but less than 50) > 25 (but less than 37) < 25 Grade A B C D F 2. SC (Symbol Contrast): This is the difference in reflectivity between the brightest module and the darkest module. The assignment of grade is according to the following table: SC % > 70 > 55 > 40 > 20 < 20 (but less than 70) (but less than 55) (but less than 40) Grade A B C D F 3. MOD and RM (Modulation): This is a grade based on the amount of variability in reflectivity of the modules. A multi-step process is used to get the modulation grade. First the reflectivity of each module is compared to the global threshold and the overall Symbol Contrast according to the following formula: MOD = 2 * (abs(R - GT)) / SC The Global Threshold GT is the midpoint between the reflectance of the brightest module and the reflectance of the darkest module. Next, the grade level for each module is determined from the MOD value according to the following table: MOD % > 50 > 40 > 30 > 20 < 20 (but less than 50) (but less than 40) (but less than 30) Grade A B C D F Finally, the value of the grade for the MOD parameter will be the highest modulation level for which the modules meeting that level will result in an Unused Error Correction grade of that level or higher. 4. ANU (Axial Non-uniformity): This is the amount of “out of square” a symbol is, or in other words a measure of the overall aspect ratio of the symbol. ANU % ≤6 <8 (but more than 6) < 10 (but less than 8) < 12 (but less than 10) > 12 Grade A B C D F 5. GNU (Grid Non-uniformity): This is the worst case distance between the calculated center of a module and the ideal location for the center of the module based on perfectly evenly spaced modules. The calculated center of the module is determined using the clock tracks. The value is reported as a percentage of a module size. GNU % ≤ 38 < 50 (but less than 38) < 63 (but less than 50) < 75 (but less than 63) > 75 Grade A B C D F 6. FPD (Fixed Pattern Damage): This is the overall grade for all the fixed pattern components. This grade is equal to the lowest grade of all the components listed below. The following is a list of components of the finder pattern. 7. LLS (Left ‘L’ Side): This is a grade based on imperfections in the left ‘L’ side of the finder pattern. There are two checks required to pass. The first requires gaps to be three modules or less and that gaps are separated by stretches of at least four correct modules. The second assigns a grade based on the overall percentage of correct modules according to the following table: % of incorrect modules 0 <9 (but more than 0) < 13 (but more than 9) < 17 (but more than 13) > 17 Grade A B C D F The grade is the highest modulation level in which the first (gap test) passes and the correct module percentage results in a grade of that level or higher. 8. BLS (Bottom ‘L’ Side): This is a grade based on imperfections in the bottom ‘L’ side of the finder pattern (see Left ‘L’ Side). 9. LQZ (Left Quiet Zone): This is a grade based on imperfections in the quiet zone, which is a one-module area to the left of the left ‘L’ side. The grade is based on the percentage of modules, which are correct using the same grading table as for the ‘L’ sides. 10. BQZ (Bottom Quiet Zone): This is a grade based on imperfections in the quiet zone, which is a one-module area below the bottom ‘L’ side. 11. TQZ (Top Quiet Zone): This is a grade based on imperfections in the quiet zone, which is a one-module area above the top clock track. a. ULQZ (Upper Left Quiet Zone): This is the top quiet zone above the upper left quadrant (Used only for 2 and 4 quadrant symbols, this is the grade based on the segment of the quiet zone above the top clock track of the left quadrant). b. URQZ (Upper Right Quiet Zone): This is the top quiet zone above the upper right quadrant (Used only for 2 and 4 quadrant symbols, this is the grade based on the segment of the quiet zone above the top clock track of the right quadrant). 12. RQZ (Right Quiet Zone): This is a grade based on imperfections in the quiet zone, which is a one-module area to the right of the Right Clock Track. a. RUQZ (Right Quiet Zone to the right of the upper right quadrant): Only for 2 and 4 quadrant symbols, this is the grade based on the segment of the quiet zone to the right of the upper right quadrant. b. RLQZ (Right Quiet Zone to the right of the lower right quadrant): Only for 4 quadrant symbols, this is the grade based on the segment of the quiet zone to the right of the lower left quadrant. 13. TTR (Top Transition Ratio): This is a grade based on imperfections in the top clock track, with relation to its adjoining quiet zone. The ratio is the number of transitions, from light to dark or dark to light, in the quiet zone divided by the number of transitions in the clock track. Since the number of transitions in the quiet zone should be zero, the ideal value for this parameter is zero. However, a small number of transitions can be tolerated as long as the ratio remains relatively low. As the number of teeth in the clock track increases (larger symbols) more transitions in the quiet zone can be tolerated. Also, more transitions in the clock track (which are really imperfections) will tend to improve this measurement. The grading scheme for this transition ratio is: Transition Ratio % <6 <8 (but more than 6) < 10 (but more than 8) < 12 (but more than 10) > 12 Grade A B C D F The value of the grade will be the highest modulation level for which the ratio gives a grade from the above table of that modulation level or higher. a. ULQTTR (Transition ratio for Upper Left Quadrant Top Clock Track): Only for 4 quadrant symbols, this is the grade based on the clock track segment at the top of the upper left quadrant. For a 2 quadrant symbol, this will be labeled LQTTR. b. URQTTR (Transition ratio for Upper Right Quadrant Top Clock Track): Only for 4 quadrant symbols, this is the grade based on the clock track segment at the top of the upper right quadrant. For a 2 quadrant symbol this will be labeled RQTTR. c. LLQTTR (Transition ratio for Lower Left Quadrant Top Clock Track): Only for 4 quadrant symbols, this is the grade based on the clock track segment at the top of the lower left quadrant. d. LRQTTR (Transition ratio for Lower Right Quadrant Top Clock Track): Only for 2 and 4 quadrant symbols, this is the grade based on the clock track segment at the top of the lower right quadrant. 14. RTR (Right Transition Ratio): Transition ratio (see Top Transition Ratio) for the right clock track in relation to the right quiet zone. a. ULQRTR (Transition ratio for Upper Left Quadrant Right Clock Track): Only for 2 and 4 quadrant symbols, this is the grade based on the clock track segment to the right of the upper left quadrant. For a 2 quadrant symbol, this will be labeled LQRTR. b. URQRTR (Transition ratio for Upper Right Quadrant Right Clock Track): Only for 2 and 4 quadrant symbols, this is the grade based on the clock track segment to the right of the upper right quadrant. For 2 quadrant symbols, this will be labeled RQRTR. c. LLQRTR (Transition ratio for Lower Left Quadrant Right Clock Track): Only for 4 quadrant symbols, this is the grade based on the clock track segment to the right of the lower left quadrant. d. LRQRTR (Transition ratio for Lower Right Quadrant Right Clock Track): Only for 4 quadrant symbols, this is the grade based on the clock track segment to the right of the lower right quadrant. 15. TCT (Top Clock Track): This is a grade based on imperfections in the top clock track. Some imperfections in the clock track can be tolerated. However, the rule that must be maintained for a passing grade is that three out of every five modules (on a consecutively rolling window of five modules) must be correct. The value of the grade will be the highest modulation level for which this test passes. a. ULQTCT (Top Clock Track for Upper Left Quadrant): Only for 2 and 4 quadrant symbols, this is the grade based on the clock track segment at the top of the upper left quadrant. For 2 quadrant symbols, this will be labeled LQTCT. b. URQTCT (Top Clock Track for Upper Right Quadrant): Only for 2 and 4 quadrant symbols, this is the grade based on the clock track segment at the top of the upper right quadrant. For 2 quadrant symbols, this will be labeled RQTCT. c. LLQTCT (Top Clock Track for Lower Left Quadrant): Only for 4 quadrant symbols, this is the grade based on the clock track segment at the top of the lower left quadrant. d. LRQTCT (Top Clock Track for Lower Right Quadrant): Only for 4 quadrant symbols, this is the grade based on the clock track segment at the top of the lower right quadrant. 16. RCT (Right Clock Track): This is a grade based on imperfection in the right clock track (see Top Clock Track). a. ULQRCT (Right Clock Track for Upper Left Quadrant): Only for 2 and 4 quadrant symbols, this is the grade based on the clock track segment to the right of the upper left quadrant. For 2 quadrant symbols, this will be labeled LQRCT. b. URQRCT (Right Clock Track for Upper Right Quadrant): Only for 2 and 4 quadrant symbols, this is the grade based on the clock track segment to the right of the upper right quadrant. For 2 quadrant symbols, this will be labeled RQRCT. c. LLQRCT (Right Clock Track for Lower Left Quadrant): Only for 4 quadrant symbols, this is the grade based on the clock track segment to the right of the lower left quadrant. d. LRQRCT (Right Clock Track for Lower Right Quadrant): Only for 4 quadrant symbols, this is the grade based on the clock track segment to the right of the lower right quadrant. 17. AG (Average Grade of Damage across many parts of the Finder Pattern): This is a grade that considers the accumulated effect of damage to several parts of the finder pattern. Five values are averaged together. One of these is the lowest of all the grades associated with all the clock track segments, namely TCT, TTR, TQZ and RCT, RTR, RQZ. The other four are LLS, BLS, LQZ, and BQZ. The average must fall in the range of 0.0 through 4.0 and is given a grade according to the following: Ave Grade Grade Equals 4.0 3.5 (but less than 4.0) 3.0 (but less than 3.5) 2.5 (but less than 3.0) < 2.5 A B C D F NOTE: The effect of the AG parameter is to lower the overall grade of symbols, which have several individual parameters at or near the same level. For instance, with enough B grades in individual parameters, the overall grade may come out as a C grade rather than a B. The AIM-DPM method of grading data matrix symbols modifies the process of ISO-15415 and is more appropriate for direct part marking applications. This standard was developed to be more representative of the scanning performance of modern readers that in some cases are specifically designed for these demanding applications. In this method, the image brightness is adjusted to produce an image of the symbol that fills most or all of the dynamic range of the imager, resulting in an image that is easier to see. Additionally, the threshold between dark and light is calculated from the statistics of the image brightness histogram. Thus, the measurements calculated by AIM-DPM differ from those of ISO 15415 significantly. Some of the parameters reported in ISO 15415 are changed so drastically that in order to remove the possibility of confusion between these two methods, the parameters have been renamed. These parameters are: AIM-DPM Parameter Name ISO 15415 Parameter Name CC (Cell Contrast) SC (Symbol Contrast) CM (Cell Modulation) MOD (Modulation) DD (Distributed Damage) AG (Average Grade) MR (Minimum Reflectance) Not necessary since SC is measured on an absolute scale Summary of Change(s) Made relative to light background Threshold calculated from statistics rather than the maximum and minimum reflectance. Grading scale range set to Mean of distribution, rather than maximum and minimum reflectance Modulation overlay uses only A, B, and F levels instead of A, B, C, D, and F. An absolute limit on SC of 5% added to temper the relative nature of CC. All of the Fixed Pattern Damage grading (other than AG shown above) are not renamed, but are functionally different since the global threshold and modulation grading scale are different. In general, symbols will obtain a significantly higher grade according to AIM-DPM than ISO 15415. Therefore, grading according to AIM-DPM is appropriate only when called for in an application specification. Another significant difference is the allowance for a variety of illumination options. These include the four-sided 45˚ light that is the default for ISO 15415. Additionally allowed are: 30˚ lighting from four sides, 30˚ from two sides (which can be either North/South or East/West), and 90˚diffuse on-axis lighting. The light source that is used is reported using a notation that includes the angle, and a letter (Q for 4, T for two). AIM-DPM also varies the size of the aperture until the symbol is decoded, and then the grading is repeated with two different aperture sizes (50% and 80%) and the better of the two grades is reported as the final grade. The parameters, which are new or significantly modified for AIM-DPM, are explained below: 1. CC (Cell Contrast): This is the relative contrast value between bars and spaces, taken from the means of the light and dark element, CC = (Lmean - Dmean) / Lmean. CC % ≥ 30% ≥ 25% ≥ 20% ≥ 15% < 15% Grade 4 3 2 1 0 2. CMOD (Cell Modulation): Similar to MOD in ISO 15415, this parameter measures the deviation in the reflectivity of dark and light elements. A range for each group (light and dark) is created from the global threshold to the mean reflectance of the elements. Each module is graded along this range, then error correction capability is considered to “discount” the effect of one or a few elements with low values, and a final grade for this parameter is computed. 3. DDG (Distributed Damage Grade): Similar to AG in ISO 15415, this parameter takes into account the effect of multiple segments of the fixed pattern having imperfections. Where multiple segments have a low grade, the effect of this “distributed damage” is reflected in a lower grade for DDG than the lowest of the individual segments. 4. MR (Minimum Reflectance): This is a requirement for at least 5% reflectance difference between light and dark elements, as a restraint on the purely relative CC parameter. 5. Decode: Decode grade A or F depending upon whether the reference decode algorithm succeeds in decoding the symbol with the required final aperture size. 1. Distortion Angle (DA): The angle between the left side and the bottom side of the ‘L’ finder pattern should be 90 degrees. The distortion angle is the deviation from 90 degrees exhibited by the ‘L’ in this symbol. A distortion angle of 7 degrees or less will pass, while a larger distortion angle will fail. 2. Cell Fill (Size): The size of the cells must be printed at least 60% of the cell spacing, and no more than 105% of the cell spacing. 3. Ovality: For dot peen symbols (where the cells are allowed to be round) the cells should be circular. As a measure of ovality, the ratio of the widest diameter to the smallest diameter is checked and must be less than 20% different in order to Pass. 4. Center Offset: The center of each cell must not be offset from its correct grid location by more than 20% of the cell spacing in order to Pass. 5. Symbol Contrast: Symbol contrast should be at least 20% to Pass. ISO 16022 Parameters: Decode (DCD), Symbol Contrast (SC), Bar Width Growth (BWG), Axial Non-Uniformity (ANU), Unused Error Correction (UEC) DCD: Indicates whether the symbol was decoded by the reference decode algorithm. Symbol Contrast: Represents the difference between reflectance of light and dark elements. BWG: Represents the bar width growth as defined in ISO 16022. ANU: Represents Axial Non-Uniformity which represents non-square aspect ratio of the modules in the symbol. UEC: Represents Unused Error Correction, which indicates the amount of error correction used out of the budget for error correction available in the symbol. PCS, MRD, SC, MinEC and MOD – Ways of Quantifying Contrast PCS, Print Contrast Signal, is an older and largely no longer used measure of contrast. Contrast is intended to quantify the difference between the bars and the spaces in reflectance. PCS is defined mathematically as: PCS = (Rmax-Rmin) / Rmax In other words, the percentage of the light background accounted for by the difference between the bars and spaces. This measure was defined as a measure of perceived contrast by the human eye, long before and outside the context of measuring barcode contrast. Notice that the measurement is made relative to the brightness of the background. The fact that it is relative to the background means that the darker (worse) the background color is, the higher (supposedly better) the value of PCS. This may correspond with the way people view things, but not really how scanners work. Rather, scanners are sensitive to the absolute difference between the reflectance of bars and spaces. Scanners are especially sensitive to variations in contrast within the same scan. Another measurement, called MRD (minimum reflectance difference) quantifies the minimum difference anywhere across the barcode. MRD considers the brightest (worst) bar and the darkest (worst) space anywhere in the barcode. These worst case bar and space need not be adjacent to one another. NOTE: ANSI grading system defines yet a different way of measuring contrast: SC (symbol contrast) and MinEC (Minimum Edge Contrast.) SC is the difference between the brightest (best) space and darkest (best) bar. Minimum Edge Contrast is the smallest difference occurring between adjacent bars and spaces (across a single edge). MOD (Modulation) is simply the ratio between MinEC and SC, in other words, the percentage of available contrast that is manifest in the worst-case edge. Bar Width Growth Bar Width Growth is a measure of ink spread. The measurement of bar width growth is different on each symbology, and requires at least one successful decode of the symbol for measurement. Generally, bar width growth is taken on groups of bars and spaces and sometimes large groups. This results in stable results when bar width growth is uniform, but does not catch isolated cases of a single bar widening or shrinking. In fact, it is possible to have a very low (good) reading of bar width growth when in fact a large number of even all the bars and spaces are incorrectly grown or reduced, as these may tend to cancel each other out. Such bar width inaccuracies will normally be detected by low grades of Decodability. Once the results have been reviewed, and all desired reports have been printed, press “Go Live” to return to the state where new symbols can be presented, and the selected regions can again be modified. This device complies with Part 15 of the FCC rules. Operation is subject to the following two conditions: (1) this device may not cause harmful interference, and (2) this device must accept any interference received, including interference that may cause undesired operation. Besides periodic calibration, your Webscan system requires a minimum amount of care and maintenance. In a very dusty environment, it is necessary to clean the window surface from time to time. It is recommended that you use a soft cloth, similar to the type used on eye glasses or camera lenses. Warm water may be used along with a gentle cloth. Slowly wipe up and down making sure to clean the entire width of the window. Accuracy of the optical parameter measurements are to ISO15426 (Barcode Verifier Conformance Specifications), as follows: The arithmetic mean of the measurements on 10 scans on a Primary Reference Test Symbol shall be within, Decodability: +8%, Rmin: +3%, Rmax: +5%, Defect: +8%, Modulation: +12% (not specified in ISO15426, but our specified tolerance) NOTE: The units of the tolerance are percentage of 100%; in other words, reported units, not percentage of the reading. Example: For a Test Symbol with decodability of 88%, a reading in the range 80% through 96% is within these tolerances. In most cases, measurements are more accurate than those stated above. a. Final Quality Grade: Scale of 0.0 to 4.0, to a resolution of 0.1. b. Individual Parameters: Reported on a scale of 0 to 100 with resolution of 1. The resolution of measurement is not an indication of accuracy. Refer to of ISO/IEC 15426-1 and ISO/IEC 15426-2. All TruCheck™ models have a means of calibrating reflectance values against reference reflectance calibration samples. Two calibration points are used, one near the high reflectance end of the range and the other near the low reflectance end of the range. The reflectance calibration target specified by Webscan is the GS1 Calibrated Conformance Standard. This NIST traceable standard is a product of GS1, and is available through Webscan, Inc. or from GS1 directly. The calibration procedure specified by Webscan, Inc. is documented in the section earlier in this manual. Temperature 0-40° C, Humidity: 5% - 95% non-condensing The following pages contain compliance certificates for existing model numbers of TruCheck™ barcode verifiers as of the time of publishing of this manual. Contact Webscan if your model is not listed. Webscan certifies that the following product models: TruCheck Rover Series: Model #TC-501 Comply with GS1 system requirements for EAN/UPC Symbology, UCC/EAN-128 Symbology, ITF-14 Symbology, GS1 DataBar Symbology and GS1 Composite Symbology and GS1 Data Matrix. And furthermore, with the following applicable ISO/IEC standards: ISO 15415 ISO 15416 ISO 15426-1 and 15426-2 for Data Matrix (ISO/IEC 16023) ECC-200 (up to 48x48 matrix size) QR Code (ISO/IEC 18004) Aztec Code (ISO/IEC 24778) PDF 417 (ISO/IEC 15438). Evidence of compliance with the aforementioned standards and traceability to National Institute of Standards and Technology (NIST) is provided through the use of GS1 Certified Calibrated Conformance Standards which are manufactured to exacting specifications and test for conformance to ISO 15426 parts 1 and 2. Webscan tests each unit for conformity within specified tolerances per ISO 15426 parts 1 and 2. Some barcode symbologies (especially 2D symbologies) can encode ASCII characters that are unprintable and therefore difficult to represent in the printed reports. A special pattern is used to represent these characters using a consistent notation of two letters, which represents the ASCII code, surrounded by brackets. The codes are as follows: ASCII Code Value (decimal) ASCII Code name Special Pattern Used 0 NULL <NU> 1 SOH <SH> 2 STX <ST> 3 ETX <ET> 4 EOT <EO> 5 ENQ <EN> 6 ACK <AC> 7 BEL <BE> 8 BS <BS> 9 HT <HT> 10 LF <LF> 11 VT <VT> 12 FF <FF> 13 CR <CR> 14 SO <SO> 15 SI <SI> 16 DLE <DL> 17 DC1 <D1> 18 DC2 <D2> 19 DC3 <D3> 20 DC4 <D4> 21 NAK <NK> 22 SYN <SY> 23 ETB <EB> 24 CAN <CA> 25 EM <EM> 26 SUB <SU> 27 ESC <ES> 28 FS <FS> 29 GS <GS> 30 RS <RS> 31 US <US> NOTE: The special patterns always consist of two letters, even though the name of the ASCII code sometimes contains more than two characters (example EOT, BEL, etc.). This is to preserve regular column spacing in the printed reports and to make it easier to parse the data strings. This section contains information about specific symbologies and points out specific parameters that will be reported particular to that symbology. UPC/EAN is a family of linear barcodes used at point of sale. The structure of a UPC/EAN barcode consists of leading guard bars, central guard bars and trailing guard bars. The data characters consist of 4 elements comprising 7 unit modules, which encode digits 0-9. UPC codes encode 12 digits and EAN codes encode 13 digits. The first digit in an EAN barcode determines the GS1 country code of the country that the company is based. It is customary to report the size of a UPC/EAN symbol in terms of magnification, not by X dimension. Therefore, when UPC/EAN symbols are verified, the general information section will contain a parameter called "Magnification". (Note: A 100% Magnification UPC symbol has an X dimension of 13 MILS, or .013 inch). Code 128 is a very common and popular linear symbology. It has been adapted for use with the GS1 system, and barcodes utilizing the GS1 format of Code 128 are known as either UCC/EAN-128 or now GS1-128. A GS1-128 barcode contains a Function-1 character immediately after the start character. The structure of a Code 128 barcode consists of a start character, variable number of data characters, a check digit character and a stop character. Each character consists of 6 elements (3 bars and 2 spaces) comprising 11 modules, except the stop character which contains an extra bar at the end which serves to close off the last space of the stop character. Data is encoded in one of three character sets (referred to as character Set A, B and C), allowing for double density numeric encodation as well as encoding all possible ASCII characters (ASCII values 0 through 127). Code 128 is embodied in many application specifications, including barcode GS1-128 symbology (formerly UCC/EAN-128). The Code 128 symbology can encode data using three different "character sets" or more specifically, mappings beween symbol characters and data characters known as Character Set A, Character Set B, and Character Set C. The Data Detail Tab will show the encodation of Code 128 symbols, displaying each symbol character and the corresponding data encoded. The particular Start Character that was used, control characters that switch between character sets, check digit, and stop characters are all shown. The data encoded uses the two-character notation for unprintable ASCII characters defined in 14.2 ASCII Code Representation. For Code 128, the element widths will contain a summary showing minimum, average, and maximum values for one, two, three, and four module bars and spaces separately, as well as the measured elements’ widths and deviations from nominal. W E B S C A N Code 39 is a discrete two-width symbology composed of characters containing nine elements, three of these nine being wide elements. The wide elements are a fixed multiple of the narrow element width. The multiple should be in the range of 2 to 3. This multiple and called "Ratio" and is reported in General Characteristics. The TruCheck™ also supports TLC 39. TLC 39 is a variant of Code 39 created to support a linked composite component for Telecom applications. Interleaved 2 of 5 is a continuous two-width barcode symbology. ITF 14 is a GS1 form of I 2 of 5, and the TruCheck USB™ software will evaluate symbols encoded according to selected standards, either I 2 of 5 standard, or GS1 – ITF14. In order to select which standard is applied, there is a drop down menu box in the decode options of the settings window. Since Interleaved 2 of 5 is a two-width symbology, Ratio will be reported in General Characteristics. 0 1 2 3 4 5 Code 93 is a linear symbology composed of characters made up of six elements fit into 9 modules. W E B S C A N Pharmacode symbols (also known as "Laetus Pharmacode" are linear symbols that contain no start/stop characters. By default, the TruCheck™ verifier will not detect Pharmacode symbols, so if Pharmacode symbols are to be verified, there is an option in the “type of code” section of the settings menu that must be checked. It is recommended that you activate this setting only when needed, because stray marks and other types of symbols can sometimes have the proper spacing to qualify as a valid Pharmacode symbol. This issue can be avoided by turning off Pharmacode whenever Pharmacode symbols are not being verified. Due to the lack of any start character or other means to determine the forward direction of the symbol, a Pharmacode symbol can read differently in each direction. Therefore, the data in a Pharmacode symbol is reported twice, in both the data field of the main screen, as well as the data detail tab. An “F”, expressing the data as interpreted by a foreword scan, indicates the first. The second is indicated by an “R”, indicating the data as interpreted by a reverse scan. 0 1 2 3 4 5 MSI and Plessey codes are continuous binary symbologies in which data is encoded by groups of 4 bars and four spaces. Each bar/space pair represents a one or zero based on whether the bar or space is wide while the other is opposite. Groups of four such "bits" form a character. There is a check digit at the end, which can be displayed or removed from the data on the report depending on a settings choice. The design of PDF 417 provides for the symbol being “line scan-able”. First, each row is composed of self-clocking characters, much the same way as an ordinary linear barcode. The ’417′ in the name of the symbology comes from the structure of each character. It is 8 elements (4 bars and 4 spaces) arranged within 17 unit modules. (The ‘PDF’ part of the name stands for ‘portable data file’ and suggests that the data capacity of the symbol is large enough to represent all of the data associated with the item that the label is on, as opposed to a number that refers to a record in a non-portable data file (such as a price look table) in a computer data base. Each row can be read in a way that is similar to the process of reading a linear barcode. However, each row further contains a special character at each end (adjacent to the start and stop characters) which identify the row number within the symbol for this row. There is also other information in these special characters, including the total number of rows and the total number of columns in the symbol. In this way, a scan of a PDF 417 symbol can yield part of the decode information of the symbol which can be combined with other scans (of the other rows) to result in a complete decode. Thus PDF 417, like other multi-row stacked symbologies are “line scan-able”. For PDF 417, the number of rows and columns (in the data section, not including the row indicator columns) will be given in the General Characteristics section, along with Error Correction information, such as Error Correction Level (which can be 0 through 8), Error Correction budget, number of errors and erasures. In addition, the scanreflectance-profile grade for the start and stop characters is given in General Characteristics for each in tracing the cause of the final grade. General Characteristics will also contain the Aspect Ration which is the row height divided by the module size. (Thus, a symbol with row height that is 3X will have aspect ratio of 3). Also, a Compact PDF 417 symbol (one with its right row indicator and stop character) will be noted in General Characteristics. GS1 DataBar is a linear symbology that can be printed in multi-row stacked forms in many cases. Even GS1 symbols that have only 1 linear component should be treated 0 0 0 0 0 0 0 0 0 0 1 2 3 6 as stacked symbols for the purposes of setting up a scan region. GS1 DataBar must be enabled in the “type of code” section of the settings menu. The “# of scans” option in the settings menu has no effect on GS1 DataBar symbols; the appropriate number of scans will be decoded according to the technical specifications, and is typically ten per row, or composite section of the overall code. The reporting for RSS symbols is different than other symbologies when there is more than one component. Each component has its own grade. The grade of each component will affect the grade for the whole symbol, where the overall symbol grade is the lowest grade scored by any of its components. It is important to note that there is a special flag inside the data of RSS codes that identifies the presence of a secondary component. If this flag is set when there is no composite component found, the grade for the symbol is reported as F even if all other parameters receive high grades. This is reported as “link flag set, but composite component not found” in the primary report. The report will contain "Link Flag On" or "Link Flag Off". The report will also indicate whether the symbol is printed in one row or is "stacked". QR Code, or Quick Response Code, is capable of encoding Japanese Kanji characters and is widely used in Asia. It contains easy to decode finder patterns, alignment patterns and clock tracks. A small amount of version information is specified by a group of modules surrounding the finder patterns, such as the size of the matrix and the selected level of error correction. QR Code symbols can have varying amounts of error correction, allowing a tradeoff between symbol size and error correction capability to be made when the symbol is created. The general characteristics section will include information specific to QR Code, including the error correction mode and the masking pattern. The Data Matrix symbology is probably the most common 2D Matrix. It allows for the highest density of data per module, especially for small symbols, so data matrix grading is essential. The finder pattern consists of solid left and bottom sides, which form an “L” pattern and a horizontal and vertical clock track on opposite sides of the “L”. The clock track tells the number of modules in the matrix and is used to decode the grid on which the modules are placed. There is no version information encoded explicitly within the Data Matrix symbology; all the information about the symbol size, encoding and error correction is determined from the size of the matrix. The matrix size shown in the general description section of the report will give the size of the matrix including the L patterns and clock tracks, and the size of the inner matrix of data encoding modules in parenthesis. Aztec Code is a 2D symbol with a bull’s-eye pattern at the center to locate the code. The orientation marks at the corners of the code allow the code to be read if rotated in any direction. With an Aztec Code reader, the amount of Reed-Solomon error correction is between 20% and 40% of the data in the code. Like other 2D Matrix symbologies, the size of the Aztec Code depends on the amount of data contained within the code. If you need service for your TruCheck system, please call Webscan Technical Support at (303) 485-6811 or email [email protected]. Please be near the TruCheck system when you call and have your calibration card available. You may be instructed by Webscan to calibrate the system or to go into the Advanced Menu in an effort to find and/or fix the problem. If factory service is required for the system, you will be given an RMA # (Return Material Authorization Number) that Webscan will use to track and record service activity. You do not need to ship your power supply unless instructed. Please reference your RMA number on your PO and shipping documents. The address to send equipment to is: Webscan Inc. Attn: RMA#_______ (put in your assigned RMA#) 1341 Sherman Drive - Unit D Longmont, CO 80501 Tel (303) 485-6811 If you are having trouble with your Webscan system, please check a few basic things. 1. Turn the system off, then on. See if this corrects the problem. 2. Make sure the system is not in negative mode, unless you are in fact trying to verify a negative. 3. Calibrate the unit. After calibration, verify the calibration barcode. See if the values given by the system match the values for the calibration card. 4. Make sure the red cross on your monitor is located within the barcode symbol. 5. Make sure that you do not have "Use Selected Region" enabled, or that if you do, your region is drawn in a way that surrounds the whole symbol and does not "cut it off". 5. Make sure the battery is charged up sufficiently or that you are connected to an external power source. If these actions do not correct the problem, please call Webscan Technical support as described below. Phone: 877.WEBSCAN or 303.485.6811 Email: [email protected] NOTE: It is often helpful to save diagnostic information using the “Database” feature in the Advanced menu for email to [email protected]. Webscan tech support can guide you in using this feature. The Webscan Barcode Seminar is a comprehensive learning course in barcode technology aimed at packaging engineers, graphics artists, and other professionals involved in the production of barcoded packaging. Whether you are new to barcoding or have been involved for years, if you want to truly understand the inner workings of barcodes, especially the newer symbologies such as GS1 DataBar (formerly RSS14), Data Matrix, Composite Symbology, and PDF 417, this seminar is for you! Taking you from the most basic concepts of barcode technology all the way through to the most advanced topics such as the actual methods used to scan, decode and verify all types of barcodes, you will become an expert and a resource to your company. The course is broken into two main parts. The first, “Basic Concepts”, begins by introducing the basic elements that barcodes are composed of. A vocabulary of barcode terms is developed as the course progresses. The fundamental methodology used to verify barcodes is explained in detail. Also, the structure of common barcode symbologies such as Code 39, Interleaved 2 of 5, and Code 128 are explained in detail, including the mathematical methods used to decode them. The UPC or Universal Product Code is also fully explained along with several variations of the basic UPC symbology such as UPC-E, EAN-13 and EAN-8. The use of special encodation such as GS1/UCC/EAN-128 with Function 1 characters and Application Identifiers (AI’s) is also described. The second part of the course consists of advanced topics such as new 2D symbologies. The new GS1 DataBar and GS1 Composite Symbology family is explained fully, from the goals it seeks to achieve to the various formats allowed. Each of the GS1 DataBar formats, such as GS1 DataBar Limited, GS1 DataBar Stacked, GS1 DataBar with Composite, and many others are fully described, including character structure, check digit calculations, and data content. Data Matrix (ECC200) and PDF 417 are also fully described including structure, decoding methods and quality verification. The quality verification described follows the ISO15415 specification. Attendees will come away from this seminar with an understanding of the relationships between symbologies and the benefits of different symbologies as well as the challenges presented by each symbology to those involved in producing or scanning the codes. Attendees will be able to decipher truth from fiction in the marketing claims of vendors when in the process of evaluating products and be able to troubleshoot problems with barcode printing or scanning systems after implementation. The seminar can be customized to focus more on certain topics of special interest to the intended audience and less on other topics. This seminar is not about the end use of barcodes such as in retail settings or warehouses. Although it is about the core technology of barcodes used in these settings, this course does not go beyond printing and reading the barcodes. This is also not about how to use any specific hardware or software. For information about arranging for the Webscan Barcode Seminar to be presented at your company, including pricing, please contact Webscan toll free at 877-WEBSCAN. Webscan Validation Overview & Objective Pharmaceutical and medical device manufacturers are very concerned about quality in the manufacturing and packaging of their products as part of their public health responsibilities. FDA regulations and guidance in addition to internal quality and professionalism standards drive part of the concern. Webscan fully supports our customers in their quest for best achievable quality in manufacturing practices. The FDA has issued many documents offering guidance on computer software validation principles generally directed to medical devices. More specifically "General Principles of Software Validation; Final Guidance for Industry and FDA Staff” was issued on January 11, 2002. It is Webscan’s goal to be fully compliant with FDA guidance on validation principles. The Webscan validation protocol is designed to help ensure the highest quality standards are being met and are following the previously mentioned guidance. This validation protocol is expected to be used in combination with the customer's own quality systems to assure themselves and FDA inspectors that their manufacturing practices meet quality and health standards. Please contact Webscan for more information if Validation applies to you.