1
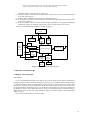
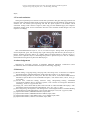
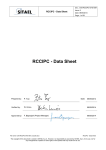
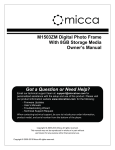
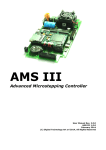
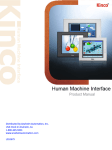
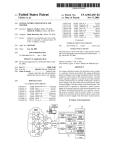
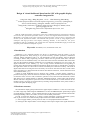
Design of virtual dashboard based on the SOC with graphic display controller integrated in Tong Guo-xiang, Wang Jing-zhao, Li Yi,Zhu Zhen-ning, Shen Meng Design of virtual dashboard based on the SOC with graphic display controller integrated in 1 Tong Guo-xiang, 2 Wang Jing-zhao, 3 Li Yi,4 Zhu Zhen-ning,5Shen Meng School of Optical-Electrical and Computer Engineering, University of Shanghai for Science and Technology, Shanghai, 200093, China, [email protected] 3 Shanghai Key Laboratory of Modern Optical System, Shanghai, 200093, China, [email protected] 4,5 ShangHai Jingxi Electronics Information System Co.,.Ltd. 1,2,3 Abstract With the rapid development of automotive electronics, traditional analogue instruments techniques can not meet the requirements of modern vehicles, so, there exists digital virtual instruments. A virtual dashboard is presented in this paper which integrated electronic rearview mirror, navigation and location system, information monitor, entertainment and operation records by using digital process techniques and high precision color display technology. Besides, it has small size, low power consumption and easy installation. The virtual meter has uniformly divided dial, high precision and non-jitter pointer indication and quick response. Keywords: Embedded system, Virtual dash board, SoC 1. Introduction Instrument is very important interface for drivers to communicate with the vehicle, it is the important guarantee for safety driving as it provides necessary operation parameters, malfunction warming, mileage information and so on. The instruments’ location and display must be designed according to human body engineering and their outline must be graceful. With more and more electronic devices are installed in luxury cars, there exists more and more information that need to deal with, and the traditional analogue instruments can not fulfill the requirements any more, hence, the digital instruments are the tendency [1][2]. Lots of large software manufacturers are beginning to research in this filed and design intelligent information display panel with car manufacturers, and bring this application which was first used in aviation and military into automotive industry. This kind of digital virtual meters are being tested in some luxury cars of Rover and Chevrolet. But, to make virtual meters the whole car’s information hub and realize man-machine interaction, it needs much hard work and continued efforts [3] [4] [5]. A kind of virtual dashboard based on Fujitsu’s SOC (ARM9 + Graphic display controller) is presented in this paper, and it has functions as follows: display control of car’s status information, such as electronic meter, rearview video, tachometer, operation record, alarm and turn instructions, and the dash board can be ordered flexibly by demands; multimedia function, vehicle audio and navigation function which are integrated in system and can be controlled intensively to realize multi-use of one machine. Drivers can easily use each function by touching correspond button on the panel, besides, it can real time update the display pages. 2. Hardware structure The information display panel presented in this paper adopted “JADE-LC” as the core control chip. It’s a SOC single chip which integrates ARM926EJ-S as CPU and MB86296(GDC produced by Fujitsu) as graphic display controller, thus it will take the place of the previous system structure which needs two chips(including a MCU and a GDC) for lower cost and better performance. In order to realize the function as a vehicle’s virtual instruments composite information system, GDC is placed as the core module and the peripheral function modules should include: (1) Power supply module: provide power for GDC core and peripheral function modules; (2) Analogue video input module: convert analogue video input to digital video signal and transfer International Journal of Digital Content Technology and its Applications(JDCTA) Volume6,Number6,April 2012 doi:10.4156/jdcta.vol6.issue6.21 175 Design of virtual dashboard based on the SOC with graphic display controller integrated in Tong Guo-xiang, Wang Jing-zhao, Li Yi,Zhu Zhen-ning, Shen Meng the digital signal to main chip, that is “JADE-LC”; (3) CAN drive module: communicate with the outside of the system, receive the status information of car and control signals; (4) UART module: communicate with the devices outside the system; (5) Touch panel drive module: control touch panel and transfer the input information of touch panel to main chip “JADE-LC”; (6) LCD drive module: drive LCD and is used for display information of each page, including the information of meter, air condition, multi-media, DVD, navigation and rearview mirror. The structure block diagram of hardware is shown as figure 1. outside system device Power module DVD GPS module CAN drive module DDR2 module UART module GDC main module FLASH module Video input module Touch panel drive module LCD drive module Touch panel LCD Figure 1. Hardware structure block diagram 2. Software control principle 2.1 Display control principle 2.1.1 Layers Layer is the fundamental element of the display page, and on which several objects, including text list object, image list object, animation list object, SVG object, vector graphics object and video object, can be placed. Fujitsu’s GDC provided a display window with up to 6 layers (L0 to L5), and each page has 6 layers. All the layers can be displayed overlaid. The overlay sequence of the L0 to L5 layers can be changed arbitrarily. Particularly, layer L1 is specified as video display layer. The overlay position for the hardware cursors is above/below the L0 layer. Source pixel and target pixel is mixed according to Alpha mixture vector on each layer, and ordered by setting Z coordinate sequence, at last formed the pages we saw[6] [7]. The six layers window display is shown as below: 176 Design of virtual dashboard based on the SOC with graphic display controller integrated in Tong Guo-xiang, Wang Jing-zhao, Li Yi,Zhu Zhen-ning, Shen Meng Figure 2. Six layers window display 2.1.2 Layer display control principle The image data was placed in the logic parallel two dimensional space of the graphic buffer. There are six logic graphic buffers correspond to six layers, and are mapped to display position through parameter OA (Origin Address), W (Stride), H (Height), DA (Display address) and (DX, DY (Display position)). MB86296 scans the logical graphics space as if the entire space is rolled over in both the horizontal and vertical directions. Using this function, if the display frame crosses the border of the logical graphics space, the part outside the border is assumed covered with the other side of the logical graphics space. The expression of the X and Y coordinates in the frame and their corresponding linear addresses (in bytes) is shown as below[7]. A(x,y) = x * bpp/8 + 64wy (bpp = 8 or 16) (1) The origin of the displayed coordinates has to be within the frame. To be more specific, the parameters are subject to the following constraints: 0 <DX < w * 64 * 8/bpp (bpp = 8 or 16) (2) 0 <DY < H (3) DX, DY, and DA have to indicate the same point within the frame. In short, the following relationship must be satisfied. DA = OA + DX * bpp/8 + 64w * DY (bpp = 8 or 16) (4) 2.1.3 Video display control principle Among the six layers, layer L1 is specified as video display, it can display YCbCr format video signal. The YCbCr signal will be transformed to RGB signal and displayed on LCD by configuring correspond registers. The conversion between YCbCr and RGB is realized by algorithm shown below: R Y G A Cb 128 b B Cr 128 aij Among which, following registers[8]: a11 whereA a21 a31 is 11 bits signed real, a12 a22 a32 a13 b1 a23 , b b2 a33 b3 bi is 9 bits signed real. aij and bi can be set in the L1YCR 0(a12 , a11 ), L1YCR1(b1 , a13 ) L1YCG 0(a22 , a 21 ), L1YCG1(b2 , a23 ) L1YCB0(a32 , a 31 ), L1YCB1(b3 , a33 ) It is possible to control brightness, contrast, hue, color saturation by changing the matrix parameters. 177 Design of virtual dashboard based on the SOC with graphic display controller integrated in Tong Guo-xiang, Wang Jing-zhao, Li Yi,Zhu Zhen-ning, Shen Meng 2.2 Software design 2.2.1 General software design The composite information display panel communicates with the main controller module by CAN, and the display information is sent by main controller module. The operation flow of the whole system is: the touch key of the composite information display panel sends request information to the main controller module, and the main controller module judges the current status, then respond request sent by display panel, that is, send the page switching command or display information accordingly to the display panel, at last, the panel displays the information sent by the main controller module. Besides, some display contents need real-time update, therefore, the main controller module send real-time information to display panel with regular time interval, after receiving these information the display panel updates the current status information and display it. The state graph of software operation is shown as figure 3. waiting key press request meter send message regularly multimedia display refresh request speedometer tachometer fuel-meter water-thermo meter page swift request send message regularly navigation display refresh request current album current song current singer air condition send message regularly display refresh request current temperature Figure 3. Software operation state graph 2.2.2 Control of the meter’s pointer The pointer of the virtual meter presented in this paper is represented by triangle. All kinds of triangles can be set by using GDC image library. Call the draw triangle function from GDC library and set the two dimensional coordinates of the triangle’s three vertexes as the passed parameters, then a required triangle will be created[7]. To realize the rotation of the pointer, an algorithm is adopted, that is, draw the triangle again at the place where it tends to rotate and clear the original triangle. Specifically, we need to calculate the angle which the triangle will be turned round, next, the three vertexes’ coordinates value of the triangle should be calculated according to the angle mentioned in the last step, finally, call the draw triangle function again so that we can get a rotation pointer. As shown in figure 5 (horizontal axis is Y axis, vertical axis is X axis), P0, P1 and P2 represent the three vertexes respectively, and coordinate (cx, cy) represents the center of the meter, L1 represents the distance from the center of the meter to the start of the pointer, and L0 represents the distance from the center of the meter to the end of the pointer. Then, the coordinates of the three vertexes P0, P1 and P2 can be calculated by: P[0].x = cx - ((sin_d * L0) / 0x10000) ; P[0].y = cy + ((cos_d * L0) / 0x10000) ; (5) P[1].x = cx - ((sin_d * L1) / 0x10000) + dx0; 178 Design of virtual dashboard based on the SOC with graphic display controller integrated in Tong Guo-xiang, Wang Jing-zhao, Li Yi,Zhu Zhen-ning, Shen Meng (6) P[1].y = cy + ((cos_d * L1) / 0x10000) + dy0; P[2].x = cx - ((sin_d * L1) / 0x10000) + dx1; P[2].y = cy + ((cos_d * L1) / 0x10000) + dy1; (7) Firstly, a sine table should be defined as there must use sine function, the sin_table() corresponds to the sine value (0~1) from 0 angle to 90 angle, and for convenient calculation, all the value of the sin_table() are multiplied by FFFFH, hence, when calculating the value of the coordinates, 0x10000 should be divided by to get the actual value. In addition, an approximate algorithm is adopted in calculating the coordinates of P1 and P2, that is, calculate the midpoint coordinate in between the P1 and P2, then, add the offsets dx and dy. These offsets are deferential value calculated based on the 45 angel boundary. Figure.4 Pointer’s vectogram The main control software flow chart of the meter’s pointer is shown as below: start initiate hardware GHC project has been loaded? N Y timer has been setted? Y initiate project N unload project initiate meter set parameters draw meter and bar Figure 5. Pointer’s software flow chart 5 main GHC API functions are used during the drawing of the meter [8] [9]: GhcPrimitiveList_FanModeDraw():This function draws a 2D primitive drawing with Fan mode; GhcObjectList_clearParticularArea():This function clears the selected object list, and fills the area by transparent color or specified color; GhcObjectList_SetDimension():This function sets a new dimension for the object; GhcObjectList_drawAt():This function draws the on the layer; GhcObjectList_getPosition():This function returns the top-left corner coordination of the selected 179 Design of virtual dashboard based on the SOC with graphic display controller integrated in Tong Guo-xiang, Wang Jing-zhao, Li Yi,Zhu Zhen-ning, Shen Meng object; 3. Test and conclusion Testing and experiment proves that the virtual meter presented in this paper has high precision and non-jitter pointer indicating and has quick response also, meets the relevant standards, so that deserving extensive use. The whole system operating well and has quick response to the modules switch commands. Testing result is shown as figure 6 (there only gives the dashboard page), the composite information display panel receives information from the main controller module though CAN, and responses accordingly. Figure 6. Testing result This virtual dashboard uses layer L1, L3, L4, L5 of the six layers. Among which, the speed meter, current temperature, gears, left cornering lamp, right cornering lamp and ODO are placed at layer L1; buttons, including navigation button, air condition button and media button are placed at layer L3; pointer vector is placed at layer L4 and background picture is placed at layer L5. The air condition, multi-media and navigation are placed on different pages. 4. Acknowledgements Supported by Innovation Program of Shanghai Municipal Education Commission (Grant No.12YZ094), and we would like to thank to Fujitsu for technology supporting. 5. References [1] Wan-fu Zheng, Long-ping Zhong, Jian-qing Chen, Wen-xiang Chen, “A Research on Graphical Interfacial Display of Digital Dashboard”, IEEE Signal Processing [C], pp. 829-834, 2009. [2] Miao-hua Huang, Zhi-jun Xu, Hou-yu Yu, Zhe-wen Tian, Bo Li, “Car-mounted Multi-function Information System Based on the Embedded Computer”, Auto Electric Parts, Vol.10, No.6, pp. 35-39, 2006.. [3] Yen-Lin chen, Chuan-Yen Chiang, Wen-Yew Liang, Cheng-Huang Chuang, “Embedded Vision-based Nighttime Driver Assistance System”, JCIT: Journal of Convergence Information Technology, Vol.6, No.2, pp. 283-292, 2011. [4] YiQing Liu, “FPGA based Side-by-Side Video Decoder for Diamond DMD 3D Display”, IJEI: International Journal of Engineering and Industries, Vol. 2, No. 2, pp. 1-7, 2011. [5] Xiao-ming Cheng, Yu-tong Zhao, “The Testing Device of Steering Performance of Mobile Shifting System Based on Virtual Instruments”, Drive System Technique, Vol.32, N0. 4, pp.32-35, 2003. [6] Fujitsu Semiconductor, MB86R01 Datasheet, Japan, 2008. [7] Fujitsu Semiconductor, MB86R01 Hardware Manual, Japan, 2008. [8] Fujitsu Semiconductor, GDC HMI Creator V2 User Manual, Japan, 2008. [9] Fujitsu Semiconductor, GHCV2 User Manual, Japan, 2008. 180