1
SurveyPro4
User Guide
Apian SurveyPro 4.0 User Guide
© 2007 Apian Software, Inc. All Rights Reserved.
SurveyPro 4.0 User Guide
Document updated:
January 15, 2007
Apian Software, SurveyHost®, SurveyPro4, SurveyPro, Survey Pro®,
DirectCollect4, DirectCollect®, KeyCollect4, KeyCollect®, NetCollect,
NetCollect4, Net.Collect®, and QuestionWeb are trademarks of Apian
Software, Inc.
Companies, names, and data used in examples herein are fictitious unless
otherwise noted. Information in this document is subject to change without notice.
All other product and company names mentioned herein are the trademarks of their respective owners.
Disclaimer
This documentation is meant for use under an Apian SurveyPro license
agreement. Use outside this agreement is not covered under any explicit
or implied warranties.
Apian Software, Inc.
115 N 85th Street
Suite 204
Seattle, WA 98103
www.apian.com
January 15, 2007
ii
Table of Contents
Chapter 1
REFERENCE
Getting Started
1
Using this Guide . . . . . . . . . . . . . . . . . . . . . . . . . . . . . . . . . . . . . . . . . . . . . .
Additional Resources . . . . . . . . . . . . . . . . . . . . . . . . . . . . . . . . . . . . . . .
Installing SurveyPro . . . . . . . . . . . . . . . . . . . . . . . . . . . . . . . . . . . . . . . . . . .
Opening SurveyPro 2.0 Files . . . . . . . . . . . . . . . . . . . . . . . . . . . . . . . . . . . .
2
2
3
3
Key SurveyPro Concepts
5
Chapter 2
REFERENCE
Read This and Avoid Headaches . . . . . . . . . . . . . . . . . . . . . . . . . . . . . . . . 6
Project Planning . . . . . . . . . . . . . . . . . . . . . . . . . . . . . . . . . . . . . . . . . . . . . . 7
Survey Project Files . . . . . . . . . . . . . . . . . . . . . . . . . . . . . . . . . . . . . . . . . . . 8
NetCollect for Web Surveys . . . . . . . . . . . . . . . . . . . . . . . . . . . . . . . . . 9
Respondent EMailer . . . . . . . . . . . . . . . . . . . . . . . . . . . . . . . . . . . . . . . 9
DirectCollect for Kiosks . . . . . . . . . . . . . . . . . . . . . . . . . . . . . . . . . . . . . 9
KeyCollect for Data Entry . . . . . . . . . . . . . . . . . . . . . . . . . . . . . . . . . . 10
Protecting your Projects . . . . . . . . . . . . . . . . . . . . . . . . . . . . . . . . . . . . . . 10
Table of Contents
January 15, 2007
iii
Apian SurveyPro 4.0 User Guide
Chapter 3
REFERENCE
Documents in SurveyPro
12
Understanding Questionnaire and Report Documents . . . . . . . . . . . . . .
Document Editing Screen . . . . . . . . . . . . . . . . . . . . . . . . . . . . . . . . . . . . .
Object Tree . . . . . . . . . . . . . . . . . . . . . . . . . . . . . . . . . . . . . . . . . . . . .
Document Editing Menus . . . . . . . . . . . . . . . . . . . . . . . . . . . . . . . . . . . . .
File Menu . . . . . . . . . . . . . . . . . . . . . . . . . . . . . . . . . . . . . . . . . . . . . . .
Edit Menu . . . . . . . . . . . . . . . . . . . . . . . . . . . . . . . . . . . . . . . . . . . . . . .
View Menu . . . . . . . . . . . . . . . . . . . . . . . . . . . . . . . . . . . . . . . . . . . . . .
Insert Menu . . . . . . . . . . . . . . . . . . . . . . . . . . . . . . . . . . . . . . . . . . . . .
Document Menu . . . . . . . . . . . . . . . . . . . . . . . . . . . . . . . . . . . . . . . . .
Database Menu . . . . . . . . . . . . . . . . . . . . . . . . . . . . . . . . . . . . . . . . . .
Tools Menu . . . . . . . . . . . . . . . . . . . . . . . . . . . . . . . . . . . . . . . . . . . . .
Window Menu . . . . . . . . . . . . . . . . . . . . . . . . . . . . . . . . . . . . . . . . . . .
Help Menu . . . . . . . . . . . . . . . . . . . . . . . . . . . . . . . . . . . . . . . . . . . . . .
Managing Documents . . . . . . . . . . . . . . . . . . . . . . . . . . . . . . . . . . . . . . . .
Spell Check . . . . . . . . . . . . . . . . . . . . . . . . . . . . . . . . . . . . . . . . . . . . . . . . .
File History . . . . . . . . . . . . . . . . . . . . . . . . . . . . . . . . . . . . . . . . . . . . . . . .
Options Dialog . . . . . . . . . . . . . . . . . . . . . . . . . . . . . . . . . . . . . . . . . . . . . .
Publish Logs . . . . . . . . . . . . . . . . . . . . . . . . . . . . . . . . . . . . . . . . . . . . . . . .
13
14
15
16
17
17
18
19
20
21
22
22
22
23
23
25
26
28
Chapter 4
REFERENCE
Document Layouts
29
Document Properties . . . . . . . . . . . . . . . . . . . . . . . . . . . . . . . . . . . . . . . .
General Tab for Questionnaires . . . . . . . . . . . . . . . . . . . . . . . . . . . . .
General Tab for Reports . . . . . . . . . . . . . . . . . . . . . . . . . . . . . . . . . . .
Title Tab for Paper Documents . . . . . . . . . . . . . . . . . . . . . . . . . . . . .
Logo Graphic Tab . . . . . . . . . . . . . . . . . . . . . . . . . . . . . . . . . . . . . . . .
Footer and Header Tabs for Paper Documents . . . . . . . . . . . . . . . .
Layout Tab for Paper Questionnaires . . . . . . . . . . . . . . . . . . . . . . . .
Layout Tab for Reports . . . . . . . . . . . . . . . . . . . . . . . . . . . . . . . . . . . .
Autonumber Tab . . . . . . . . . . . . . . . . . . . . . . . . . . . . . . . . . . . . . . . . .
Working with Tiles . . . . . . . . . . . . . . . . . . . . . . . . . . . . . . . . . . . . . . . . . . .
Text Formatting . . . . . . . . . . . . . . . . . . . . . . . . . . . . . . . . . . . . . . . . . . . . .
Text Style Dialog . . . . . . . . . . . . . . . . . . . . . . . . . . . . . . . . . . . . . . . . .
Text Palette . . . . . . . . . . . . . . . . . . . . . . . . . . . . . . . . . . . . . . . . . . . . .
Graphics . . . . . . . . . . . . . . . . . . . . . . . . . . . . . . . . . . . . . . . . . . . . . . . . . . .
Graphic Dialog . . . . . . . . . . . . . . . . . . . . . . . . . . . . . . . . . . . . . . . . . . .
Anchor Graphic Dialog . . . . . . . . . . . . . . . . . . . . . . . . . . . . . . . . . . . .
Page Breaks & Columns . . . . . . . . . . . . . . . . . . . . . . . . . . . . . . . . . . . . . .
Breaks Dialog . . . . . . . . . . . . . . . . . . . . . . . . . . . . . . . . . . . . . . . . . . . .
Table of Contents
January 15, 2007
30
31
32
33
34
35
36
37
38
39
42
43
44
45
46
49
50
50
iv
Apian SurveyPro 4.0 User Guide
Chapter 5
REFERENCE
Questions, Grids and Scales
52
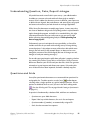
Understanding Question, Data, Report Linkages . . . . . . . . . . . . . . . . . .
Questions and Grids . . . . . . . . . . . . . . . . . . . . . . . . . . . . . . . . . . . . . . . . . .
Question Dialog . . . . . . . . . . . . . . . . . . . . . . . . . . . . . . . . . . . . . . . . . . . . .
Question Tab . . . . . . . . . . . . . . . . . . . . . . . . . . . . . . . . . . . . . . . . . . . .
Scaled Entry Tab . . . . . . . . . . . . . . . . . . . . . . . . . . . . . . . . . . . . . . . . .
Advanced Options Tab . . . . . . . . . . . . . . . . . . . . . . . . . . . . . . . . . . . .
Dimensions Tab . . . . . . . . . . . . . . . . . . . . . . . . . . . . . . . . . . . . . . . . . .
Question Grid Dialog . . . . . . . . . . . . . . . . . . . . . . . . . . . . . . . . . . . . . . . . .
General Tab . . . . . . . . . . . . . . . . . . . . . . . . . . . . . . . . . . . . . . . . . . . . .
Quick Set Tab . . . . . . . . . . . . . . . . . . . . . . . . . . . . . . . . . . . . . . . . . . . .
Rows Tab (Advanced Setup) . . . . . . . . . . . . . . . . . . . . . . . . . . . . . . . .
Columns Tab (Advanced Setup) . . . . . . . . . . . . . . . . . . . . . . . . . . . . .
Answer Entries Tab (Advanced Setup) . . . . . . . . . . . . . . . . . . . . . . .
Layout Tab (Advanced Setup) . . . . . . . . . . . . . . . . . . . . . . . . . . . . . .
Report Labels Tab (Advanced Setup) . . . . . . . . . . . . . . . . . . . . . . . .
Merge into Question Grid . . . . . . . . . . . . . . . . . . . . . . . . . . . . . . . . . . . . .
Split Question Grid . . . . . . . . . . . . . . . . . . . . . . . . . . . . . . . . . . . . . . . . . . .
Selecting Scales . . . . . . . . . . . . . . . . . . . . . . . . . . . . . . . . . . . . . . . . . . . . .
Scale Dialog . . . . . . . . . . . . . . . . . . . . . . . . . . . . . . . . . . . . . . . . . . . . . . . .
Checkboxes . . . . . . . . . . . . . . . . . . . . . . . . . . . . . . . . . . . . . . . . . . . . .
Dates/Times . . . . . . . . . . . . . . . . . . . . . . . . . . . . . . . . . . . . . . . . . . . .
Pattern . . . . . . . . . . . . . . . . . . . . . . . . . . . . . . . . . . . . . . . . . . . . . . . . .
Ratings . . . . . . . . . . . . . . . . . . . . . . . . . . . . . . . . . . . . . . . . . . . . . . . . .
Numbers . . . . . . . . . . . . . . . . . . . . . . . . . . . . . . . . . . . . . . . . . . . . . . . .
Force Rank . . . . . . . . . . . . . . . . . . . . . . . . . . . . . . . . . . . . . . . . . . . . . .
53
53
55
56
57
58
59
60
60
61
62
63
64
65
66
67
68
69
72
73
74
75
77
77
78
Chapter 6
REFERENCE
Questionnaires
80
Designing for Specific Media . . . . . . . . . . . . . . . . . . . . . . . . . . . . . . . . . . .
Skips and Branches Dialog . . . . . . . . . . . . . . . . . . . . . . . . . . . . . . . . . . . .
Multiple Questionnaire Documents . . . . . . . . . . . . . . . . . . . . . . . . . . . . .
Passwords . . . . . . . . . . . . . . . . . . . . . . . . . . . . . . . . . . . . . . . . . . . . . . . . . .
Make PIN File Dialog . . . . . . . . . . . . . . . . . . . . . . . . . . . . . . . . . . . . .
Alternative access restrictions . . . . . . . . . . . . . . . . . . . . . . . . . . . . . .
Publishing Questionnaires . . . . . . . . . . . . . . . . . . . . . . . . . . . . . . . . . . . . .
KeyCollect Publish Dialog . . . . . . . . . . . . . . . . . . . . . . . . . . . . . . . . . .
Publish Logs . . . . . . . . . . . . . . . . . . . . . . . . . . . . . . . . . . . . . . . . . . . . .
Table of Contents
January 15, 2007
81
82
83
86
88
88
89
89
90
v
Apian SurveyPro 4.0 User Guide
Chapter 7
TUTORIAL
Creating a Questionnaire
91
Chapter 8
TUTORIAL
Building Complex Question Grids
102
SurveyPro’s Database
110
Chapter 9
REFERENCE
Working with the Database . . . . . . . . . . . . . . . . . . . . . . . . . . . . . . . . . . .
Database Fundamentals . . . . . . . . . . . . . . . . . . . . . . . . . . . . . . . . . . . . .
Answer Entry Screen . . . . . . . . . . . . . . . . . . . . . . . . . . . . . . . . . . . . . . . .
Answer Entry Menus . . . . . . . . . . . . . . . . . . . . . . . . . . . . . . . . . . . . . . . .
File Menu . . . . . . . . . . . . . . . . . . . . . . . . . . . . . . . . . . . . . . . . . . . . . .
Edit Menu . . . . . . . . . . . . . . . . . . . . . . . . . . . . . . . . . . . . . . . . . . . . . .
View Menu . . . . . . . . . . . . . . . . . . . . . . . . . . . . . . . . . . . . . . . . . . . . .
Form Menu . . . . . . . . . . . . . . . . . . . . . . . . . . . . . . . . . . . . . . . . . . . . .
Database Menu . . . . . . . . . . . . . . . . . . . . . . . . . . . . . . . . . . . . . . . . .
Tools Menu . . . . . . . . . . . . . . . . . . . . . . . . . . . . . . . . . . . . . . . . . . . .
Data Collection Options . . . . . . . . . . . . . . . . . . . . . . . . . . . . . . . . . . . . .
Protect Answers . . . . . . . . . . . . . . . . . . . . . . . . . . . . . . . . . . . . . . . . . . . .
Print with Data . . . . . . . . . . . . . . . . . . . . . . . . . . . . . . . . . . . . . . . . . . . . .
Fill Passwords . . . . . . . . . . . . . . . . . . . . . . . . . . . . . . . . . . . . . . . . . . . . . .
111
111
112
113
114
114
115
115
116
116
117
118
118
119
Chapter 10
REFERENCE
Entering and Editing Data
120
Data Entry in SurveyPro . . . . . . . . . . . . . . . . . . . . . . . . . . . . . . . . . . . . .
Entering data by scale type . . . . . . . . . . . . . . . . . . . . . . . . . . . . . . . .
Data Cleaning . . . . . . . . . . . . . . . . . . . . . . . . . . . . . . . . . . . . . . . . . . . . . .
Postcoding . . . . . . . . . . . . . . . . . . . . . . . . . . . . . . . . . . . . . . . . . . . . .
Data Cleaning Dialog . . . . . . . . . . . . . . . . . . . . . . . . . . . . . . . . . . . . . . . .
Mass Delete . . . . . . . . . . . . . . . . . . . . . . . . . . . . . . . . . . . . . . . . . . . . . . .
Mass Replace . . . . . . . . . . . . . . . . . . . . . . . . . . . . . . . . . . . . . . . . . . . . . .
Answer Replace . . . . . . . . . . . . . . . . . . . . . . . . . . . . . . . . . . . . . . . . . . . .
Questionnaire for New Forms . . . . . . . . . . . . . . . . . . . . . . . . . . . . . . . . .
Table of Contents
January 15, 2007
121
122
123
125
126
128
129
130
131
vi
Apian SurveyPro 4.0 User Guide
Chapter 11
TUTORIAL
Working in Answer Entry
132
Import and Export
141
Chapter 12
REFERENCE
Import/Export Fundamentals . . . . . . . . . . . . . . . . . . . . . . . . . . . . . . . . .
Import Dialog . . . . . . . . . . . . . . . . . . . . . . . . . . . . . . . . . . . . . . . . . . . . . .
General Tab for SurveyPro Family Files . . . . . . . . . . . . . . . . . . . . .
General Tab for Comma/Tab Delimited ASCII . . . . . . . . . . . . . . .
General Tab for Access MDB and SQL Databases . . . . . . . . . . . . .
Field Matchup Tab . . . . . . . . . . . . . . . . . . . . . . . . . . . . . . . . . . . . . . .
Key Tab . . . . . . . . . . . . . . . . . . . . . . . . . . . . . . . . . . . . . . . . . . . . . . . .
Data Cleaning Tab . . . . . . . . . . . . . . . . . . . . . . . . . . . . . . . . . . . . . . .
Batch Import Dialog . . . . . . . . . . . . . . . . . . . . . . . . . . . . . . . . . . . . . . . . .
Import Log Files . . . . . . . . . . . . . . . . . . . . . . . . . . . . . . . . . . . . . . . . . . . .
Export Dialog . . . . . . . . . . . . . . . . . . . . . . . . . . . . . . . . . . . . . . . . . . . . . .
General Tab for SurveyPro ST3, STL and SDE . . . . . . . . . . . . . . . .
General Tab for Comma/Tab Delimited ASCII . . . . . . . . . . . . . . .
General Tab for Microsoft Access MDB . . . . . . . . . . . . . . . . . . . . .
Field Selection Tab . . . . . . . . . . . . . . . . . . . . . . . . . . . . . . . . . . . . . .
General Tab for SQL Databases . . . . . . . . . . . . . . . . . . . . . . . . . . . .
Field Matchup Tab for SQL Databases . . . . . . . . . . . . . . . . . . . . . .
Key and Scale Label Maps Tab for SQL Databases . . . . . . . . . . . .
Export Log Files . . . . . . . . . . . . . . . . . . . . . . . . . . . . . . . . . . . . . . . . . . . .
SQL Connection Dialog . . . . . . . . . . . . . . . . . . . . . . . . . . . . . . . . . . . . . .
Field Name Sets . . . . . . . . . . . . . . . . . . . . . . . . . . . . . . . . . . . . . . . . . . . .
Scale Value Mapping for Import and Export . . . . . . . . . . . . . . . . . . . . .
Table of Contents
January 15, 2007
142
144
146
147
148
149
151
153
155
157
159
160
162
163
164
165
166
167
168
169
170
171
vii
Apian SurveyPro 4.0 User Guide
Chapter 13
TUTORIAL
Importing Data
172
Figures
183
Chapter 14
REFERENCE
Understanding Report Elements in SurveyPro . . . . . . . . . . . . . . . . . . .
Using Figures Effectively . . . . . . . . . . . . . . . . . . . . . . . . . . . . . . . . . . . . .
Figure Dialogs . . . . . . . . . . . . . . . . . . . . . . . . . . . . . . . . . . . . . . . . . . . . . .
General Tab . . . . . . . . . . . . . . . . . . . . . . . . . . . . . . . . . . . . . . . . . . . .
For Question(s) Tab . . . . . . . . . . . . . . . . . . . . . . . . . . . . . . . . . . . . . .
For Statistics Tab . . . . . . . . . . . . . . . . . . . . . . . . . . . . . . . . . . . . . . . .
By Crosstab/Filter Tab . . . . . . . . . . . . . . . . . . . . . . . . . . . . . . . . . . .
Layout Tab . . . . . . . . . . . . . . . . . . . . . . . . . . . . . . . . . . . . . . . . . . . . .
Title-Caption Tab . . . . . . . . . . . . . . . . . . . . . . . . . . . . . . . . . . . . . . . .
Text Figures . . . . . . . . . . . . . . . . . . . . . . . . . . . . . . . . . . . . . . . . . . . .
Tables . . . . . . . . . . . . . . . . . . . . . . . . . . . . . . . . . . . . . . . . . . . . . . . . .
Table + Bars . . . . . . . . . . . . . . . . . . . . . . . . . . . . . . . . . . . . . . . . . . . .
Bar Chart . . . . . . . . . . . . . . . . . . . . . . . . . . . . . . . . . . . . . . . . . . . . . .
Pie Chart . . . . . . . . . . . . . . . . . . . . . . . . . . . . . . . . . . . . . . . . . . . . . . .
Stacked Bars . . . . . . . . . . . . . . . . . . . . . . . . . . . . . . . . . . . . . . . . . . . .
Line Chart . . . . . . . . . . . . . . . . . . . . . . . . . . . . . . . . . . . . . . . . . . . . . .
Compare Groups Pairs . . . . . . . . . . . . . . . . . . . . . . . . . . . . . . . . . . .
Data Table Figure . . . . . . . . . . . . . . . . . . . . . . . . . . . . . . . . . . . . . . .
Stub List Dialog . . . . . . . . . . . . . . . . . . . . . . . . . . . . . . . . . . . . . . . . . . . .
Clone Figures Dialog . . . . . . . . . . . . . . . . . . . . . . . . . . . . . . . . . . . . . . . .
Statistics in SurveyPro . . . . . . . . . . . . . . . . . . . . . . . . . . . . . . . . . . . . . . .
Table of Contents
January 15, 2007
184
185
187
187
188
189
190
191
192
193
193
194
195
196
198
199
201
204
206
206
207
viii
Apian SurveyPro 4.0 User Guide
Chapter 15
REFERENCE
Analysis Components
210
Slicing, Dicing, and Rearranging Data . . . . . . . . . . . . . . . . . . . . . . . . . .
Form Select Filters . . . . . . . . . . . . . . . . . . . . . . . . . . . . . . . . . . . . . . . . . .
Form Select Filter Dialog . . . . . . . . . . . . . . . . . . . . . . . . . . . . . . . . . . . . .
Sample Weights Dialog . . . . . . . . . . . . . . . . . . . . . . . . . . . . . . . . . . . . . .
Modifiers & Rescales . . . . . . . . . . . . . . . . . . . . . . . . . . . . . . . . . . . . . . . .
Rescale Dialog . . . . . . . . . . . . . . . . . . . . . . . . . . . . . . . . . . . . . . . . . . . . .
Written Answers Tab . . . . . . . . . . . . . . . . . . . . . . . . . . . . . . . . . . . . .
Number Inputs Tab . . . . . . . . . . . . . . . . . . . . . . . . . . . . . . . . . . . . . .
Date-Time Inputs Tab . . . . . . . . . . . . . . . . . . . . . . . . . . . . . . . . . . . .
Answer Mapping Tab . . . . . . . . . . . . . . . . . . . . . . . . . . . . . . . . . . . .
Output Bins Tab . . . . . . . . . . . . . . . . . . . . . . . . . . . . . . . . . . . . . . . . .
Crosstabs & Banners . . . . . . . . . . . . . . . . . . . . . . . . . . . . . . . . . . . . . . . .
Banner Dialog . . . . . . . . . . . . . . . . . . . . . . . . . . . . . . . . . . . . . . . . . . . . . .
Question Groups & Scores . . . . . . . . . . . . . . . . . . . . . . . . . . . . . . . . . . .
Question Groups Dialog . . . . . . . . . . . . . . . . . . . . . . . . . . . . . . . . . . . . .
Select Items Tab . . . . . . . . . . . . . . . . . . . . . . . . . . . . . . . . . . . . . . . .
Edit Items Tab . . . . . . . . . . . . . . . . . . . . . . . . . . . . . . . . . . . . . . . . . .
Points Tab . . . . . . . . . . . . . . . . . . . . . . . . . . . . . . . . . . . . . . . . . . . . .
Weighting Tab . . . . . . . . . . . . . . . . . . . . . . . . . . . . . . . . . . . . . . . . . .
Output Bins Tab . . . . . . . . . . . . . . . . . . . . . . . . . . . . . . . . . . . . . . . . .
Report On . . . . . . . . . . . . . . . . . . . . . . . . . . . . . . . . . . . . . . . . . . . . . . . . .
Report On Dialog . . . . . . . . . . . . . . . . . . . . . . . . . . . . . . . . . . . . . . . . . . .
211
212
213
215
216
217
217
219
219
220
222
223
225
228
232
232
233
234
236
237
238
240
Chapter 16
REFERENCE
Reports
242
Executive Summary Automatic Report . . . . . . . . . . . . . . . . . . . . . . . . .
Data Table Automatic Report . . . . . . . . . . . . . . . . . . . . . . . . . . . . . . . . .
Automatic Report Document Properties Dialog . . . . . . . . . . . . . . . . . .
Executive Summary Tab . . . . . . . . . . . . . . . . . . . . . . . . . . . . . . . . . .
Data Table Tab . . . . . . . . . . . . . . . . . . . . . . . . . . . . . . . . . . . . . . . . .
Title Tab . . . . . . . . . . . . . . . . . . . . . . . . . . . . . . . . . . . . . . . . . . . . . . .
Report Labels Dialog . . . . . . . . . . . . . . . . . . . . . . . . . . . . . . . . . . . . . . . .
Graph Color Fills . . . . . . . . . . . . . . . . . . . . . . . . . . . . . . . . . . . . . . . . . . .
Publishing Reports . . . . . . . . . . . . . . . . . . . . . . . . . . . . . . . . . . . . . . . . . .
Web HTML Reports . . . . . . . . . . . . . . . . . . . . . . . . . . . . . . . . . . . . .
Printable Images . . . . . . . . . . . . . . . . . . . . . . . . . . . . . . . . . . . . . . . .
Table of Contents
January 15, 2007
243
244
245
245
246
248
248
250
251
251
252
ix
Apian SurveyPro 4.0 User Guide
Chapter 17
TUTORIAL
Creating a Report
253
Breaking Data Down
268
License Agreements
282
Chapter 18
TUTORIAL
Appendix A
Single User License . . . . . . . . . . . . . . . . . . . . . . . . . . . . . . . . . . . . . . . . . 283
Workgroup (Multi-user) Site License . . . . . . . . . . . . . . . . . . . . . . . . . . . 285
NetCollect Server Application . . . . . . . . . . . . . . . . . . . . . . . . . . . . . . . . . 288
Index
Table of Contents
January 15, 2007
291
x
Chapter 1
Getting Started
REFERENCE
Chapter Contents:
Using this Guide . . . . . . . . . . . . . . . . . . . . . . . . . . . . . . . . . . . . 2
Additional Resources . . . . . . . . . . . . . . . . . . . . . . . . . . . . 2
Installing SurveyPro . . . . . . . . . . . . . . . . . . . . . . . . . . . . . . . . . 3
Opening SurveyPro 2.0 Files . . . . . . . . . . . . . . . . . . . . . . . . . . . 3
Chapter 1 - Getting Started
January 15, 2007
1
Apian SurveyPro 4.0 User Guide
Using this Guide
Each of the chapters is identified as “Reference” or “Tutorial.” Reference
chapters introduce new terms, provide advice on the best use of a particular feature, and document the dialog controls. Tutorial sections walk you
through setting up a particular feature. Tutorials can usually be completed
out of order—any assumptions about your knowledge will be identified at
their start. You’ll find the reference and tutorial chapters are grouped in
three sections: questionnaires, data collection, and analysis.
This guide includes complete information on working with paper questionnaires and reports. You’ll find functions specific to Web surveys in the
NetCollect User Guide, keyed data entry on remote systems in the KeyCollect User Guide, and kiosk/LAN surveys in the DirectCollect User
Guides.
Additional Resources
Guided Tours
These are quick videos that walk you through the main features of SurveyPro and acquaint you with how some of the tools operate.
http://apian.com/software/surveypro/tour/
Discussion List and
Newsletter
Apian provides a free discussion list for users to ask questions about
SurveyPro and survey research in general. You can opt for either an email or Web-based interface.
We also recommend signing up for the Apian newsletter to stay posted on
product updates and workshops, and for the tips from our Support team.
http://apian.com/support/forum/
Knowledge Base
This is a searchable resource for how-to questions and problem-solving.
http://apian.com/support/knowledgebase/
Technical Support
All new orders and upgrades come with a period of free support. Annual
support contracts may be purchased by phone at (800) 237-4565 or
online.
http://apian.com/support/
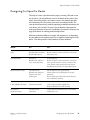
Coaching and Training
(206) 547-8392
Apian offers public workshops, on-site corporate training, and one-on-one
telephone coaching.
http://apian.com/training/
Chapter 1 - Getting Started
January 15, 2007
Using this Guide
2
Apian SurveyPro 4.0 User Guide
Downloads
Updates (patches) to Apian Software products are provided for you to
download free of charge.
http://apian.com/downloads/
Installing SurveyPro
SurveyPro’s installation is a straightforward process, similar to other Windows applications.
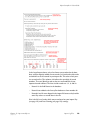
1. Download the Install program according to instructions in your download email (or get it from the CD if you requested one)
2. Run the Install program and follow the instructions
3. Make sure to have your SurveyPro 4.0 serial number available because the
installation will require it.
Installing KeyCollect, Respondent EMailer, or NetCollect Server Application
The installation programs for these supporting applications are placed on
your hard drive while installing SurveyPro. You do not need to install
SurveyPro itself on a system that only needs one of these modules.
The KeyCollect and Respondent EMailer installations are also very standard. For the NetCollect server scripts, you will need to refer to either the
NetCollect User Guide or the server setup excerpt guide for details on
server permissions.
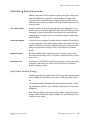
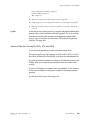
Opening SurveyPro 2.0 Files
Before opening your version 2.0 files, be sure you have finished all your
data entry and imported all your Collect data files. Once you convert the
file to version 4.0, you can re-publish any KeyCollect or NetCollect surveys which you are continuing to use (see page 89).
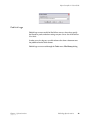
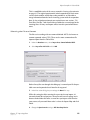
When you open a SurveyPro 2.0 file, you'll be prompted to identify the
type of 4.0 Written Answer scale you want for each open-ended question.
If you're unsure of the structure you need, the safest approach is
Unique/Long which allows up to 10,000 characters, and then later you
can change the scale to a shorter countable Written Answer.
In addition, question tiles which were stacked up to appear as grids in version 2.0 will be combined into a single tile Question Grid. These can be
broken back into individual tiles via the Edit menu, Split Grid command.
Chapter 1 - Getting Started
January 15, 2007
Installing SurveyPro
3
Apian SurveyPro 4.0 User Guide
Chapter 1 - Getting Started
January 15, 2007
Opening SurveyPro 2.0 Files
4
Chapter 2
Key SurveyPro Concepts
REFERENCE
Chapter Contents:
Read This and Avoid Headaches . . . . . . . . . . . . . . . . . . . . . . . 6
Project Planning . . . . . . . . . . . . . . . . . . . . . . . . . . . . . . . . . . . 7
Survey Project Files . . . . . . . . . . . . . . . . . . . . . . . . . . . . . . . . . 8
NetCollect for Web Surveys . . . . . . . . . . . . . . . . . . . . . . . . 9
Respondent EMailer . . . . . . . . . . . . . . . . . . . . . . . . . . . . . 9
DirectCollect for Kiosks . . . . . . . . . . . . . . . . . . . . . . . . . . 9
KeyCollect for Data Entry . . . . . . . . . . . . . . . . . . . . . . . . 10
Protecting your Projects . . . . . . . . . . . . . . . . . . . . . . . . . . . . 10
Chapter 2 - Key SurveyPro Concepts
January 15, 2007
5
Apian SurveyPro 4.0 User Guide
Read This and Avoid Headaches
We know many of you hate to read documentation, but some of the following information will save you time, and some can prevent major problems with your project.
1. Your SP4 file is your whole project
One file includes your questionnaires, database and reports. Any data
which you want to compare, such as different departments, should be in
the same SP4, but separate projects should be in separate files.
2. SurveyPro is object-oriented surveying
You've probably heard the term “object-oriented”—all it means is that
something is constructed from a number of smaller building blocks. For
documents, the objects are “tiles” arranged in a flow down a page. Question tiles consist of the question text and two more objects, the Scale and
Text Styles. SurveyPro's objects are named items, so once you define one
it can be used again and again. Then if you need to edit it later, you
change it once and everything using it is updated.
3. Questionnaires are more than just page layouts
SurveyPro's questionnaire designer may behave like a page layout program, but behind the scenes it's creating a database based on your question structures. So, if you get creative and start putting underscores
“____” in for entry blanks, you're not creating a place for the data to go
later.
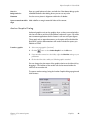
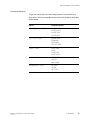
4. Get to know the pencil buttons
Within the SurveyPro dialogs you'll see several types of controls used
over and over, always with the same function.
Insert
Modify
Delete
Duplicate
Add at end
Some or all of these buttons appear whenever a named object is used in a
dialog. Named objects include Text Styles, Scales, and Form Selects.
Insert is used to add a new object, modify edits the object (updating all
tiles referencing/using it), and delete removes it. Duplicate allows you to
create a new object starting with the settings of the currently selected
item. The plus button adds a new item to the end of a list, such as a question grid or banner definition.
Chapter 2 - Key SurveyPro Concepts
January 15, 2007
Read This and Avoid Headaches
6
Apian SurveyPro 4.0 User Guide
5. Collect = survey distribution and data collection
Within SurveyPro you’ll see references to Collect modules. These are
used to handle the distribution and data collection for surveys:
•
NetCollect for Web surveys (see page 9)
•
DirectCollect for independent executable surveys for kiosks, LANs
and telephone interviews (see page 9)
•
KeyCollect for additional paper survey data entry stations (see page
10)
6. If it feels like you're working too hard, you probably are
SurveyPro has a great deal of power, but sometimes all its features aren't
obvious. If you end up doing something which takes a lot of steps, or feels
like it's a lot of work, contact Technical Support or try the SurveyTalk discussion list (see page 2) for an easier approach.
Project Planning
SurveyPro was designed to gracefully accommodate the editing and evolution involved in conducting surveys. However, a little planning at the
beginning of your project can prevent headaches later.
While you create your survey, be sure to consider the following issues:
•
What decision am I making?
•
Who are the respondents?
•
What are the most effective media to reach them?
•
Will I need multiple languages?
•
What types of analysis do I need to make my decision?
•
Does the survey include all the questions I need to break down the
data?
•
Do the questions have the correct scales for entry and analysis?
(Scales are data structures such as a number or date, single or
multiple answer checkbox.)
Every one of these issues needs to be resolved before the questionnaire is
tested with sample respondents, much less distributed. One of the most
common support scenarios is a user attempting to analyze their results,
only to discover that their questionnaire structure will not produce the
statistics they need. While most problems can be corrected, some cannot,
Chapter 2 - Key SurveyPro Concepts
January 15, 2007
Project Planning
7
Apian SurveyPro 4.0 User Guide
so a little planning time is invaluable. If you have any questions about
your questionnaire, Apian technical support is happy to check its structure.
Survey Project Files
SurveyPro’s tightly integrated SP4 files contain all the elements of a
project: questionnaires, database, and reports. A single project can contain multiple questionnaire and report documents, but should only include
questionnaires and data which are analyzed together. There’s no limit in
SurveyPro on the size of your database, or the number of projects you can
create.
There are two tools you can use for viewing the contents and status of
your file: the object tree (see page 15) and the File History dialog (see
page 25).
In addition to SurveyPro, you’ll come across several Collect modules.
SurveyPro includes paper questionnaire design, database, and analysis.
The Collect programs are used to deploy surveys and collect data for nonpaper surveys.
Whether you select paper, Web or screen—or a combination of media—
SurveyPro creates surveys, collects data, and generates reports in essentially the same manner. Of course there are differences in the details, for
example skips and branching are a transparent experience via the Web or
computer, but are clumsy via paper. Likewise, some of the paper layout
options are unavailable for Web and screen-based surveys. However,
these differences are more in the respondent experience than in the operation of SurveyPro.
Chapter 2 - Key SurveyPro Concepts
January 15, 2007
Survey Project Files
8
Apian SurveyPro 4.0 User Guide
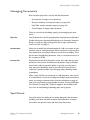
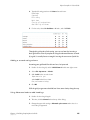
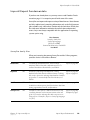
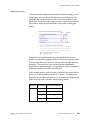
NetCollect for Web Surveys
NetCollect refers to Web surveys and the scripts you will install on your
Web server to process the surveys, check passwords, branch, etc. NetCollect has two modes: ASP and Perl (set in Document Properties).
Version
Features
Documentation
ASP
The primary mode, with a rich set of
NetCollect4UserGuide.pdf
features including randomization, forced SurveyPro’s Help menu
sum tests, forward and back, and CSSbased layouts. May be used on your own
Windows Web server and on
QuestionWeb.com.
Perl
Offers fewer features than the ASP mode, NetCollectPerlbut allows you to execute surveys on Unix QuickRef.PDF
and Linux Web servers.
NetCollect+Perl.PDF
User Guides are located in the Documentation folder under your SurveyPro program installation.
Respondent EMailer
The Respondent EMailer is an accessory program where you build a database of respondent information including:
•
E-mail address
•
Name
•
Password
•
Additional merge fields such as department, etc.
This is used to e-mail invitations and reminders for NetCollect Web surveys. It can also provide a pipe-in file for pre-loading information in your
Web survey.
DirectCollect for Kiosks
DirectCollect is for the design and distribution of screen based surveys.
Applications of these self-contained surveys are varied, and can include email, LAN, kiosk, or telephone and personal interviews.
Chapter 2 - Key SurveyPro Concepts
January 15, 2007
Survey Project Files
9
Apian SurveyPro 4.0 User Guide
DirectCollect is documented separately in three user guides which you’ll
find in the Documentation folder under your SurveyPro installation:
•
Tutorial Guide
•
Designer's Guide
•
Interviewer's Guide
KeyCollect for Data Entry
KeyCollect is designed for multi-user keyed data entry, whether you need
additional users at one location or wish to distribute data entry to the survey collection points. The functionality is identical to the Answer Entry
mode in SurveyPro (see page 121), except for a special Verify feature
which allows for double-entry when you need complete accuracy.
KeyCollect is installed as a separate program from SurveyPro, and has its
own User Guide and Help system. Your SurveyPro serial number will
unlock 10 user seats per KeyCollect installation. If you need more than 10
seats at a site, simply install additional copies of KeyCollect (total seats is
unlimited).
Protecting your Projects
SurveyPro includes several features to protect your projects,:
•
Optional automatic save, can be set from 5-60 minutes. Turn on the
saves in the Tools, Options dialog.
•
Automatic save in Answer Entry (the data entry screen) every time
you edit a form in the database. Data is saved to a separate file, which
is then merged into the main SP4 file when you leave Answer Entry.
•
Automatic creation of a backup file (BAK), which is the last version
you saved. If you ever make a serious error, exit SurveyPro without
saving, then File, Open the BAK copy of your file.
•
Questionnaire locking when you publish a document (to the Web,
kiosk, etc.). This ensures it will not be edited accidentally and become
incompatible with your data files. Documents are unlocked under the
Edit menu.
•
Password protection of the questionnaires, database, and/or reports.
Set passwords in the Tools, Options dialog.
Chapter 2 - Key SurveyPro Concepts
January 15, 2007
Protecting your Projects
10
Apian SurveyPro 4.0 User Guide
•
Warning messages on changes which affect the database, such as
modifying the structure of a scale or deleting a question which
contains responses.
However, none of this is a substitute for a formal backup policy!
You will see a reminder to backup your data before SurveyPro performs
certain functions, but it’s always a good idea to regularly copy files to CD,
tape, floppy, or a LAN disk. If you’re going to be experimenting with a file,
use Save As to create a working copy.
Chapter 2 - Key SurveyPro Concepts
January 15, 2007
Protecting your Projects
11
Chapter 3
Documents in SurveyPro
REFERENCE
Chapter Contents:
Understanding Questionnaire and Report Documents . . . . . . 13
Document Editing Screen . . . . . . . . . . . . . . . . . . . . . . . . . . . . 14
Object Tree . . . . . . . . . . . . . . . . . . . . . . . . . . . . . . . . . . . 15
Document Editing Menus . . . . . . . . . . . . . . . . . . . . . . . . . . . . 16
File Menu . . . . . . . . . . . . . . . . . . . . . . . . . . . . . . . . . . . . 17
Edit Menu . . . . . . . . . . . . . . . . . . . . . . . . . . . . . . . . . . . . 17
View Menu . . . . . . . . . . . . . . . . . . . . . . . . . . . . . . . . . . . . 18
Insert Menu . . . . . . . . . . . . . . . . . . . . . . . . . . . . . . . . . . . 19
Document Menu . . . . . . . . . . . . . . . . . . . . . . . . . . . . . . . 20
Database Menu . . . . . . . . . . . . . . . . . . . . . . . . . . . . . . . . 21
Tools Menu . . . . . . . . . . . . . . . . . . . . . . . . . . . . . . . . . . . 22
Window Menu . . . . . . . . . . . . . . . . . . . . . . . . . . . . . . . . . 22
Help Menu . . . . . . . . . . . . . . . . . . . . . . . . . . . . . . . . . . . . 22
Managing Documents . . . . . . . . . . . . . . . . . . . . . . . . . . . . . . 23
Spell Check . . . . . . . . . . . . . . . . . . . . . . . . . . . . . . . . . . . . . . 23
File History . . . . . . . . . . . . . . . . . . . . . . . . . . . . . . . . . . . . . . 25
Options Dialog . . . . . . . . . . . . . . . . . . . . . . . . . . . . . . . . . . . . 26
Publish Logs . . . . . . . . . . . . . . . . . . . . . . . . . . . . . . . . . . . . . 28
Chapter 3 - Documents in SurveyPro
January 15, 2007
12
Apian SurveyPro 4.0 User Guide
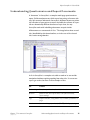
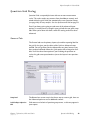
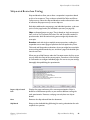
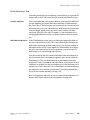
Understanding Questionnaire and Report Documents
A “document” in SurveyPro is a complete multi-page questionnaire or
report. Unlike word processors which create long strings of content with
very little structure underneath, SurveyPro’s document layouts are primarily reflections of your project structure. And while the contents of a question are dramatically different than those of a pie chart, the way
SurveyPro works with in building a document are quite similar.
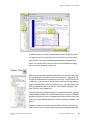
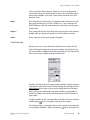
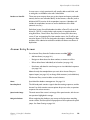
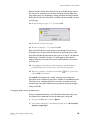
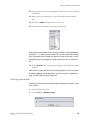
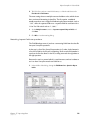
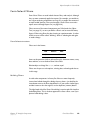
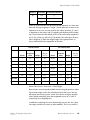
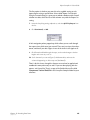
All documents are constructed of “tiles.” The image below shows several
tiles, identifiable by their dotted outlines, or in the case of the selected
tiles, heavier orange borders:
A tile in SurveyPro is a complete unit, able to stand on its own and be
manipulated without requiring anything from other tiles. It’s a new concept to get used to, but here are four examples of tiles:
Tile
Contains
Text heading
Text, font specification, tile width, indentation
Question
Question text, short report label, scale (data structure),
layout settings
Logo
Graphic filename, sizing dimensions, tile width, placement on
page
Bar chart
Questions being reported, style (2D/3D), labeling style, legend
Chapter 3 - Documents in SurveyPro
January 15, 2007
Understanding Questionnaire and Report Documents
13
Apian SurveyPro 4.0 User Guide
You’ll become acquainted with tiles quickly enough as you begin to work
with SurveyPro, because everything is contained in a tile, from the smallest rule line to a multi-page table.
While each tile does stand on its own, they also have ties to the Components you’ll find in the Object Tree on page 15. Tiles in both your questionnaires and reports may reference the same Text Style to format their
text, and several questions may share the same checkbox scale.
You can have many documents in a single project file. Examples of using
multiple questionnaire documents would be conducting both paper and
Web versions of a survey, or having your questionnaire evolve over time
and maintaining the older versions intact. Multiple reports are often used
for detailed versus overview perspectives, or reporting on verbatims independently of quantitative data. Remember that elements shared among
documents remain connected, so if you edit a Scale or Form Select one
place, all instances are updated.
This chapter covers the aspects of documents which are common to both
questionnaires and reports. See also Questionnaires on page 80 and Reports
on page 242.
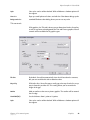
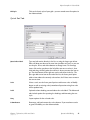
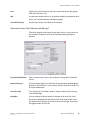
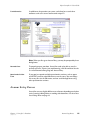
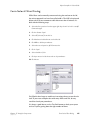
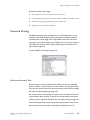
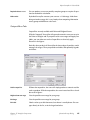
Document Editing Screen
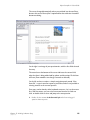
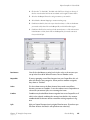
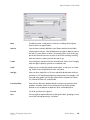
The main SurveyPro screen is broken into four primary areas:
Menus
The full set of tools for working with SurveyPro. (See page 16.)
Toolbars
Quick access to common functions.
Object tree
Shows all elements present in the file, and indicates which are in use. Elements can be edited by double-clicking, and right click offers other
options (see page 15).
Documents
Open questionnaires and reports for this project file. The tabs at the bottom of the screen show all documents within the file which are open; others can be reached through the Document menu's Open Document.
Chapter 3 - Documents in SurveyPro
January 15, 2007
Document Editing Screen
14
Apian SurveyPro 4.0 User Guide
In addition there are several common dialog controls such as the pencil
(see page 6) which you may want to review if you're new to SurveyPro.
Note that this is the screen for editing questionnaire and report documents—the Answer Entry screen for data entry and database management is covered separately on page 112.
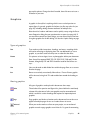
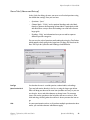
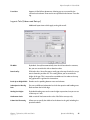
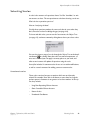
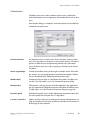
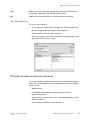
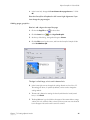
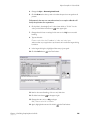
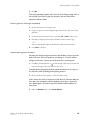
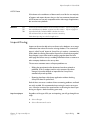
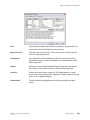
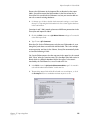
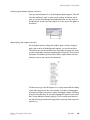
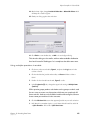
Object Tree
While your questionnaire and report documents are the visual representation of your project, the Object Tree is the structural. It’s toggled on and
off with the toolbar button or under the View menu. The tree can also be
“undocked” so you can move it around your screen by clicking and dragging the horizontal bars at the top. Within the tree, you’ll find folders and
items grouped under four main sections: Questionnaires, Reports, Database Questions and Components.
The Questionnaires and Reports folders are organized similarly, each containing additional folders for each document you have created. Individual
documents, like the one you see expanded at the top of the tree to the left,
list the tiles contained in the document. (Tiles are questions, graphics, and
figures.)
Database Questions is the master list of fields in the file. If your file contains only one survey, it will be almost identical to the questionnaire doc-
Chapter 3 - Documents in SurveyPro
January 15, 2007
Document Editing Screen
15
Apian SurveyPro 4.0 User Guide
ument folder. However, if your file contains several questionnaires, or has
evolved over time, the Database Questions folder will be a super-set of
any one questionnaire.
The last main folder, Components, contains the reusable building blocks
which make working with SurveyPro so much easier. When you start a
new file, the Scales and Text Styles will be pre-loaded with components,
ready for your use in constructing surveys. Since the remaining components are based on the data you will collect, their folders are empty in
new files.
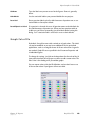
In addition to this organization, color coding tells you how a tile or component is being used. A filled box means it’s in use in your file, while a colored outline indicates it’s in use in the selected tile(s). Empty boxes
indicate tiles or components which exist in the project, but which are not
currently in use.
For the most part, SurveyPro’s tree works similarly to those in other applications:
•
To expand or contract portions of the tree, click the plus and minus
buttons next to the folders.
•
Click on an item to select it, and with tiles, jump to its location.
•
Double-click on an item to edit it, or in the case of “Add New,” to
insert a new object.
•
Right-click to access shortcuts to common commands.
Document Editing Menus
SurveyPro uses two slightly different sets of menus depending on whether
you're editing documents or the database. In addition, menu items will
change slightly depending on whether one is working in a paper survey,
Web survey, or report. See also Answer Entry Menus on page 113.
Chapter 3 - Documents in SurveyPro
January 15, 2007
Document Editing Menus
16
Apian SurveyPro 4.0 User Guide
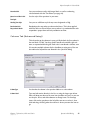
File Menu
This includes common Windows file functions, such as print, save, and
most recent files.
New
Ctrl+N
Creates a new empty SurveyPro project file.
Open
Ctrl+O
Opens a SurveyPro SP4 file. Can also be used to open a backup BAK copy, version
3.0 SP3 file, version 2.0 SVA file, or survey tag language STL/ST3 file.
Save
Ctrl+S
Saves the current file.
Save As
Saves the current file to a new name and/or location.
Page Setup
Jumps to the Document | Properties dialog for setting margins, layout
preferences, and other elements specific to that questionnaire or report.
Print Preview
Shows the document with no tile outlines. Pages in preview mode cannot be
modified, so select the preview menu item again to turn it off or go to the Edit
menu and select Inline or Page Graphic tiles to resume editing.
Print
Ctrl+P
Brings up the Windows system print dialog.
Print Setup
Windows dialog for selecting your printer and setting options. This is also where
you set the paper page size.
File List
Lists the SurveyPro files most recently accessed by your system.
Exit
Alt+F4
Closes the current file (prompting to save changes), and exits SurveyPro.
Edit Menu
Cut, copy, paste, as well as SurveyPro specific functions for changing editing modes and locking documents.
Undo
Ctrl+Z
Redo
Undoes up to 5 prior actions.
Undoes the last Undo.
Cut
Ctrl+X
Copy
Ctrl+C
Paste
Ctrl+V
Standard Windows functions for cutting, copying or pasting the selected tile or
text. This can be used to copy and paste text or tiles between SurveyPro and
other applications, as well as within or between SurveyPro projects.
Chapter 3 - Documents in SurveyPro
January 15, 2007
Document Editing Menus
17
Apian SurveyPro 4.0 User Guide
Paste Same
Questions
Enabled in the Options dialog (see page 26) and used in Web surveys. Inserts a
copy of a question tile within one questionnaire which has the same Q number as
the original. See the NetCollect User Guide’s Dynamic Questions chapter.
Modify
Enter
Brings up the relevant editing dialog for the selected tile(s). When modifying
multiple tiles only the common values may be changed.
Delete
Del
Deletes the selected tile from the document. If it's a question tile with data, the
field will remain in the database until you delete it from the data fields list in
the tree.
Inline
Question
Tiles
Toggles between editing inline tiles which flow down the body of the page, and
page graphic tiles which are fixed to a location on a specific page (unless
anchored to an inline tile).
Page Graphic
Tiles
Anchor
Graphic
When you have a page graphic selected you can anchor it to an in-line tile so
they will move in sync. See page 49.
Merge Into
Grid
Merges two similar grids or sets of questions together. Questions must use the
same scale. See page 67.
Split Grid
Splits one large grid into two or more tiles. See page 68.
Report
Labels
Changes the figure labels for questions, as well as the statistical labels such as
“Counts.” See page 248.
Lock Changes
Protects the questionnaires, database, and reports from accidental changes.
When you publish questionnaires you will be prompted to lock the surveys, so
that the data files will match the questionnaire when you import. See also the
Options Dialog on page 26 for password protection.
View Menu
Preferences for which screen elements to display and how.
Zoom
Adjusts the display size of the document.
Object Tree
Displays or hides the tree which appears by default on the left side of the
screen.
Document Tabs
Displays or hides the tabs at the bottom of the document editing screen which
are used to toggle among open questionnaires and reports.
Chapter 3 - Documents in SurveyPro
January 15, 2007
Document Editing Menus
18
Apian SurveyPro 4.0 User Guide
Toolbar
Displays or hides the toolbar.
Status Bar
Displays or hides the status bar at the bottom of the SurveyPro window.
Open Document
Lists the documents in the current SurveyPro file which can be opened for
editing.
Insert Menu
While a few items in this menu apply to all document types, many vary
depending on whether you have a questionnaire or report as the active
document.
The Insert button
drops down a list of the most common selections.
Common Elements:
Inline Text/Graphic
Adds text headings, comments, or images within the tile flow of questions or
figures. See page 45.
Page Text/Graphic
The contents of the tile are identical to the inline text/images, but instead the
tile is on the page graphic layer and fixed to a location on the page unless you
anchor the graphic to an in-line tile (see page 49). This item is disabled when
working in NetCollect documents.
Text Style
Similar to styles in word processors, Text Styles in SurveyPro are named styles
for questions, scales, headings, and other types of information. Text Styles can
be overridden for an individual tile or a few characters. See page 42.
Breaks
Ctrl+B Inserts page and column breaks within the tile flow. See page 50.
Questionnaire
Adds a new questionnaire document within the open SurveyPro file. Applications
include multiple media (paper and Web), or surveys which evolve over time. See
page 83.
Report
Adds another report document to the open SurveyPro file. Each report can
contain multiple figure tiles (just like surveys contain multiple question tiles),
so examples of report types are overhead slides, summaries, detailed crosstabs, subgroup analysis, etc.
Questionnaire Elements:
Question
All questions which will have data associated with them should be added using
Question or Grid of Questions. See page 55.
Grid of Questions
Grids are a set of related items in a compact table format. This can include grids
of open-ended or numeric data. See page 60.
Chapter 3 - Documents in SurveyPro
January 15, 2007
Document Editing Menus
19
Apian SurveyPro 4.0 User Guide
Scale
Scales are the data structures associated with questions. These are named
items, so a scale can be created once and then used by many questions. See
page 72.
Report Elements:
Figure
Inserts a new figure above the current selection. The type of figure is specified
in the first tab. See page 187.
Clone Figures
Allows you to quickly replicate figures for multiple questions in your survey. See
page 206.
Form Select Filter
Adds a named filter for use in working with sub-sets of the database. This also
appears when questionnaires are selected. See page 213.
Rescale
Creates a layer you can apply to a scale for label changes, regrouping, value
changes, etc. Each scale can have multiple rescales defined, and they're named
objects which can be reused in many figures. See page 217.
Banner
A banner is a set of cross-tab specifications, used for complex settings which
will be reused in multiple figures. See page 225.
Question Group
Each question grid column automatically creates a Question Group which can be
analyzed as a single unit, but you can also create new groups which are sub- or
super-sets, or with different orders. See page 232.
Graph Color Fills
Projects may contain several sets of color fills, which can be applied both at
Document Properties and in individual figure dialogs. See page 250.
Document Menu
Management functions for the open file's questionnaires and reports.
Properties
Opens the Document Properties dialog where you can set preferences for
medium, margins, numbering, headers and footers, etc. Many settings are
specific to the medium, and whether the document is a questionnaire or report.
See page 30.
Skip Patterns
Sets rules for skips and branches in a survey. See page 82.
Publish
Questionnaire
The Publish command takes your SurveyPro questionnaire and packages it up for
distribution. If you don't see an option you expect, check your Document
Properties to make sure the medium is correct. See page 89.
Report On
This is like a filter or cross-tabulation at the document level. You specify a
question or Banner and the report is replicated for each answer in the question
or banner point. See page 238.
Chapter 3 - Documents in SurveyPro
January 15, 2007
Document Editing Menus
20
Apian SurveyPro 4.0 User Guide
Publish
Report
Exports either a report document as an HTML page, or a set of images for
placement in other applications. The printable images can be saved as a higher
resolution than you can get via copying and pasting tiles from SurveyPro to
another program. See page 251.
New Questionnaire
Adds a new questionnaire document within the open SurveyPro file. Applications
include multiple media (paper and Web), or surveys which evolve over time. See
page 83.
New Report
Adds another report document to the open SurveyPro file. Each report can
contain multiple figure tiles (just like surveys contain multiple question tiles),
so examples of report types are overhead slides, summaries, detailed crosstabs, subgroup analysis, etc.
Copy Document
Creates a new questionnaire or report which is a copy of the currently selected
document. For questionnaires, any questions which are shared between
documents will collect in the same database field. See page 83.
Delete Document
Permanently removes a questionnaire or report from the current file. Note that
this will not remove questions containing data or sub-elements such as scales.
See also Mass Delete on page 128.
Open Document
Lists the documents in the open SurveyPro file which can be opened for editing.
Database Menu
Access to the Answer Entry screens as well as import and export.
Answer Entry F8
Switches from the document editing mode into Answer Entry, where you can
view, edit, and add individual records. See page 111.
Import from
Adds data to your survey file, either as new forms or updating existing forms.
Note that the fields into which you are importing (created by scaled questions)
must already exist. See page 144.
Batch Import
Allows you to import multiple Collect data files at once. See page 155.
Export to
Creates a data file of selected forms and questions for transfer to another
application. See page 159.
Chapter 3 - Documents in SurveyPro
January 15, 2007
Document Editing Menus
21
Apian SurveyPro 4.0 User Guide
Tools Menu
Utilities and preferences for working in SurveyPro.
Spell Check
F7
Checks spelling in the current document, including sub-elements such as scales
and figure labels. See page 23.
Spelling
Options
Allows you to control what the spell checker should ignore, edit your custom
dictionary, and activate the legal and medical supplements.
File History
Displays the current status of your file as well as publish, import, and export
activity through its history. See page 25.
Make PIN File
Creates a SurveyPro compatible PIN file for password or field checking. Could be
generated by SurveyPro or a conversion of an ASCII file. See page 88.
Options
Preferences for both the current file and for your system. See page 26.
Window Menu
List of open documents and tools for arranging them.
Cascade
Stacks up all the open documents so you can see the title bar of each one.
Tile
Arranges the open documents on the screen so that you can see each one.
Arrange Icons
Aligns the icons of documents which are open but minimized along the bottom
of the screen.
Help Menu
Contents or Index
Jumps to the contents of the Help system.
About SurveyPro
Displays the version, serial number, license, and legal notices.
Chapter 3 - Documents in SurveyPro
January 15, 2007
Document Editing Menus
22
Apian SurveyPro 4.0 User Guide
Managing Documents
New SurveyPro project files start out with four documents:
•
Questionnaire: an empty survey document
•
Executive Summary: an automatic report (see page 243)
•
Data Table: another automatic report (see page 244)
•
Custom Report: an empty report document
There are several tools for adding, opening, and managing your documents:
Object Tree
Lists all documents in the file, grouped under Questionnaires and Reports.
Double-clicking on a document folder brings up its Document Properties
dialog (see page 30). Right-clicking allows you to copy a document or
insert a new one. See page 15.
Document Menu
Allows you to modify the document properties, add a new report or questionnaire, copy an existing document, delete a document, or open a document which exists in the project file but is not currently on display. This is
also the menu for publishing documents, such as screen-based surveys to
file, or reports to HTML.
Document Tabs
Displayed at the base of the document screen, these tabs show the open
documents. You can also switch between documents using the Window
menu, but the tabs are generally quicker. In general, you only want to
keep your active documents open to save time on file open and save
(especially if your file includes a few 200 page reports detailing 10,000
respondents).
While a single SP4 file may contain up to 1,000 documents, most consist
of 4-10 documents. If you start working with multiple questionnaire documents, we strongly recommend you review the information on page 83.
And, if you are generating a large number of reports, you may find Report
On a lifesaver (see page 238). Technical support is also available to discuss issues of consolidating or breaking apart survey projects.
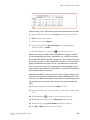
Spell Check
SurveyPro checks the spelling of everything displayed in the document,
including scale labels and other elements in questionnaires. In reports,
this includes the question names and form select filter names.
Chapter 3 - Documents in SurveyPro
January 15, 2007
Managing Documents
23
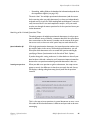
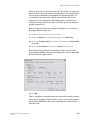
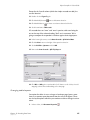
Apian SurveyPro 4.0 User Guide
The Options dialog is where you decide what you want the spell checker
to ignore, whether it's e-mail addresses or specific words you add to your
dictionary. By default, all the words you add in the spell check dialog go
into your system's custom dictionary (which you need to create to enable
the Add button), but you can also exchange dictionaries with co-workers
for sharing industry-specific terms.
If you know of a set of words you'll need to use, or would like to edit the
words you've added, select the custom dictionary you want to modify and
click Edit. You can type in this dialog as a simple list, adding, changing, or
removing entries.
Chapter 3 - Documents in SurveyPro
January 15, 2007
Spell Check
24
Apian SurveyPro 4.0 User Guide
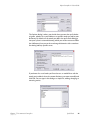
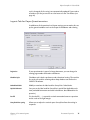
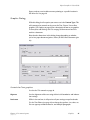
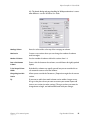
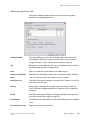
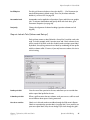
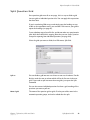
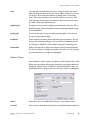
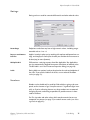
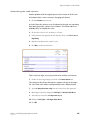
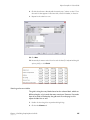
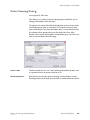
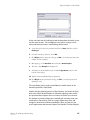
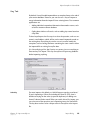
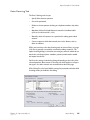
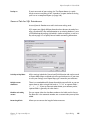
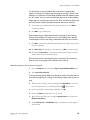
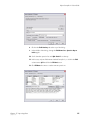
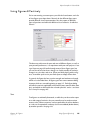
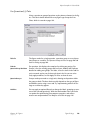
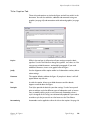
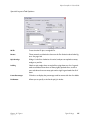
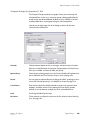
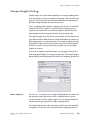
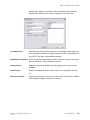
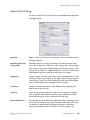
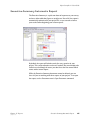
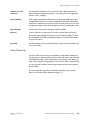
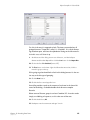
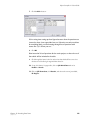
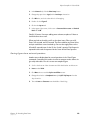
File History
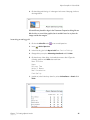
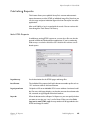
File History is a great tool for checking the current status of your file, as
well as digging through old log files to see what you've done in the past.
The top panel displays the contents of your file, with the number of questions in questionnaires, records in the database, and figures in reports.
Below that is a history of the file, including whether it was converted from
an earlier version or started in 4.0.
At the bottom you can disable the dialog from popping up automatically
when you open the current file.
Project tab
On the first tab is a summary of the project, with the name and location,
contents, and a history of its creation. This screen appears when you open
files (unless you turn it off), and is a convenient snapshot after major
transactions such as import and mass delete. At the bottom of the dialog
is an option to not open document windows, which can be a way to
quickly open large files, then individually opening questionnaires or
reports through the Document menu.
Import, Export and
Publishing tabs
Every time data is imported or exported, or a document published (such
as to HTML), a log is generated. Logs are stored in these tabs until
cleared, and act as confirmation, reference, and troubleshooter. The logs
do not take much space, so we recommend keeping them in the file. See
Publish Logs on page 28, Import Log Files on page 157, and Export Log Files
on page 168.
Chapter 3 - Documents in SurveyPro
January 15, 2007
File History
25
Apian SurveyPro 4.0 User Guide
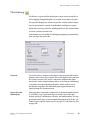
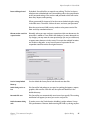
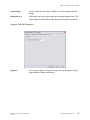
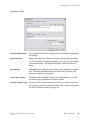
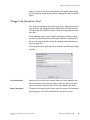
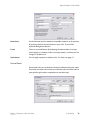
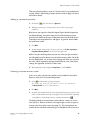
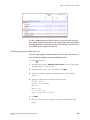
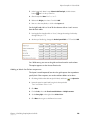
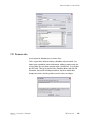
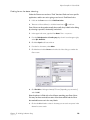
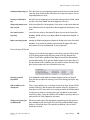
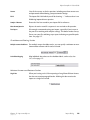
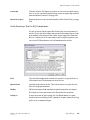
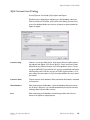
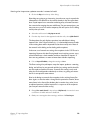
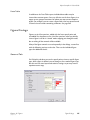
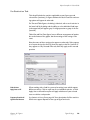
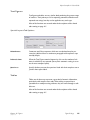
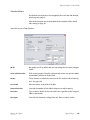
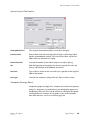
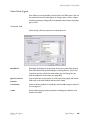
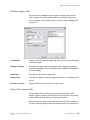
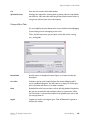
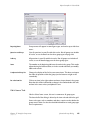
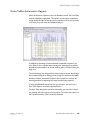
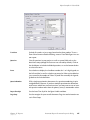
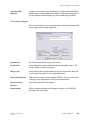
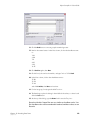
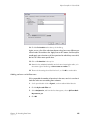
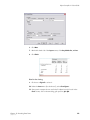
Options Dialog
Most of the options apply to the file currently open. They are retained
during Save and Save As operations.
Data Q# and Report
numbering
If you have multiple questionnaire documents, you can select the question
numbers referenced in reports.
Automatically delete
questions
Behind your questionnaire(s) is a master database which normally
matches your survey's content. By default, SurveyPro deletes questions
which do not contain data when they are removed from all questionnaires, but you can turn off this option to keep the question for future use.
Use the object tree to manage questions in your project (see page 15).
Ask tile insert rules
When you have multiple questionnaire documents, inserting new questions involves a prompt for whether you want to add the tile to all questionnaires or just that one survey. At the bottom of that prompt dialog is
an option to stop asking—this setting turns the prompt back on.
Do not require Enter key
To speed data entry, you can have SurveyPro automatically drop to the
next question after entering an answer to single-digit scales.
Auto-increment
Select a question to automatically increment as you enter new forms. The
question must have a number scale.
Go to next form
After the last field is entered on a survey, Tab will take you to a new form
when this is enabled.
Date/Time on new forms
Switch the format for SurveyPro's internal date/time stamp from American to European.
Chapter 3 - Documents in SurveyPro
January 15, 2007
Options Dialog
26
Apian SurveyPro 4.0 User Guide
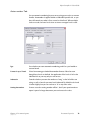
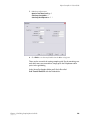
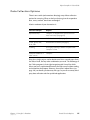
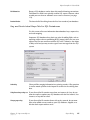
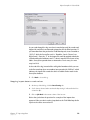
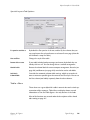
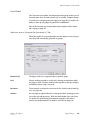
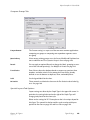
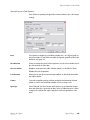
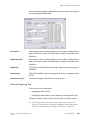
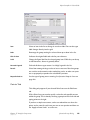
Password Change Control
By default, SurveyPro files are open for any editing. The first level password prevents unauthorized users from making edits to the questionnaire
or the password settings. You can then add passwords which will restrict
data entry/import, and reporting.
When a protected file is opened, it has these areas locked using the setting
in the Edit menu. To unlock, click on the area, and enter your password.
Note that your internal LAN security can be used to protect entire files
from access by unauthorized users.
Allow more than one tile in
a questionnaire
Normally, when you copy and paste a question within one document, the
pasted tile is added as a new field in the database. In some advanced survey designs, you may want the same question (by Q#, not just visible text)
to appear more than once in the survey. Be certain the multiple locations
are exclusive skip paths, as any later instance of a question for one
respondent would overwrite the original instance.
Session Startup Default
Directory
Sets the default for SurveyPro to look for and save data files.
Switch during session to
last
Has SurveyPro look wherever you were last working for imports, exports,
graphics, and new files. With this off, SurveyPro will look first in the
default directory.
Automatic file save
Has SurveyPro save automatically at an interval you specify. The warning
notification will appear just once per session, not per file.
Enable document editing
undo
If you do not use the Undo function, disabling it might enhance SurveyPro's performance. However, before turning off Undo, try closing any doc-
Chapter 3 - Documents in SurveyPro
January 15, 2007
Options Dialog
27
Apian SurveyPro 4.0 User Guide
uments you’re not actively editing as this also speeds file changes. With a
newer system with sufficient RAM, you will rarely need to turn off Undo.
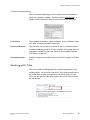
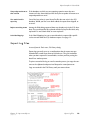
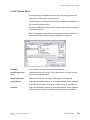
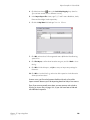
Publish Logs
Publish logs are most useful for NetCollect surveys, where they specify
the filenames, paths, administrator passwords, and other settings for the
surveys.
In other cases, the logs are a useful reference for when a document was
last published and to which format.
Publish logs are accessed through the Tools menu, File History dialog.
Chapter 3 - Documents in SurveyPro
January 15, 2007
Publish Logs
28
REFERENCE
Chapter Contents:
Chapter 4 - Document Layouts
January 15, 2007
Chapter 4
Document Layouts
Document Properties . . . . . . . . . . . . . . . . . . . . . . . . . . . . . . . 30
General Tab for Questionnaires . . . . . . . . . . . . . . . . . . . . 31
General Tab for Reports . . . . . . . . . . . . . . . . . . . . . . . . . . 32
Title Tab for Paper Documents . . . . . . . . . . . . . . . . . . . . 33
Logo Graphic Tab . . . . . . . . . . . . . . . . . . . . . . . . . . . . . . . 34
Footer and Header Tabs for Paper Documents . . . . . . . . . 35
Layout Tab for Paper Questionnaires . . . . . . . . . . . . . . . . 36
Layout Tab for Reports . . . . . . . . . . . . . . . . . . . . . . . . . . 37
Autonumber Tab . . . . . . . . . . . . . . . . . . . . . . . . . . . . . . . 38
Working with Tiles . . . . . . . . . . . . . . . . . . . . . . . . . . . . . . . . . 39
Text Formatting . . . . . . . . . . . . . . . . . . . . . . . . . . . . . . . . . . . 42
Text Style Dialog . . . . . . . . . . . . . . . . . . . . . . . . . . . . . . . 43
Text Palette . . . . . . . . . . . . . . . . . . . . . . . . . . . . . . . . . . 44
Graphics . . . . . . . . . . . . . . . . . . . . . . . . . . . . . . . . . . . . . . . . 45
Graphic Dialog . . . . . . . . . . . . . . . . . . . . . . . . . . . . . . . . 46
Anchor Graphic Dialog . . . . . . . . . . . . . . . . . . . . . . . . . . 49
Page Breaks & Columns . . . . . . . . . . . . . . . . . . . . . . . . . . . . . 50
Breaks Dialog . . . . . . . . . . . . . . . . . . . . . . . . . . . . . . . . . 50
29
Apian SurveyPro 4.0 User Guide
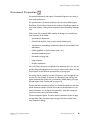
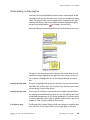
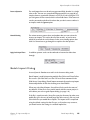
Document Properties
For both questionnaires and reports, Document Properties sets many of
your layout preferences.
For questionnaires, Document Properties also sets the medium (paper,
NetCollect, DirectCollect). Because this can have a significant impact on
your layout options, setting it first can prevent time-consuming redesigns
later.
While some of the controls differ slightly, the dialog sets essentially the
same elements for all media:
•
Questionnaire dimensions
•
General look and feel, such as colors and checkbox styles
•
Translation or customizing of automatic labels for Other blanks, NAs,
and buttons
•
Default graph fill set (colors for pie charts, etc.)
•
Automatic numbering style
•
Passwords (see page 86)
•
Logos and titles
•
Headers and footers
Since all of these elements are applied at the document level, it’s easy to
quickly change the appearance of a survey or report, and to have very different layouts for the different questionnaires in your project.
All settings that are made in Document Properties carry through the survey process. For example, if you turn on a password, your settings will
appear automatically in both the Questionnaire Publish dialog (see page
89) and Import Data Cleaning tab (see page 153).
See the NetCollect and DirectCollect User Guides for details on their Document Properties options. Several of the tabs are described here as “for
Paper Documents” or “for Paper Questionnaires” when the settings are
specific to surveys for a particular medium.
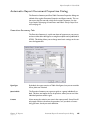
The two automatic reports, Executive Summary Automatic Report on page
243 and Data Table Automatic Report on page 244, have custom Document Properties dialogs.
Chapter 4 - Document Layouts
January 15, 2007
Document Properties
30
Apian SurveyPro 4.0 User Guide
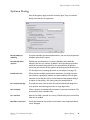
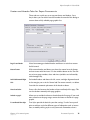
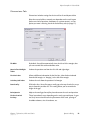
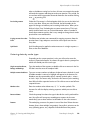
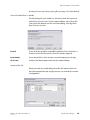
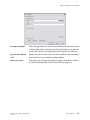
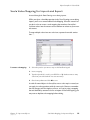
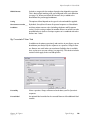
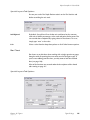
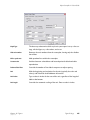
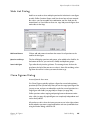
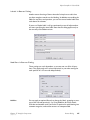
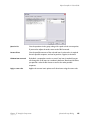
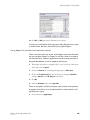
General Tab for Questionnaires
Settings to this tab should be made first as they ripple through the rest of
the dialog. Paper surveys are also used for scannable forms, just set the
checkbox style in the Layout tab.
Document Name
Document names are for internal reference only in dialogs and lists, and
will not be printed on questionnaires or reports.
Questionnaire Medium
The medium setting ripples through many layout and input controls, so
we recommend setting it early. If you need to create a survey in multiple
media, finalize the content in one version then use Document | Copy
Document to create a duplicate, then change the medium on the new version. Then adjust the layout in each medium.
Page Setup
Sets the margins for your overall document—individual sections can be
overridden through the Insert, Breaks dialog. Page size and orientation are
set in Print Setup.
Chapter 4 - Document Layouts
January 15, 2007
Document Properties
31
Apian SurveyPro 4.0 User Guide
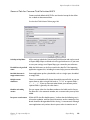
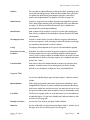
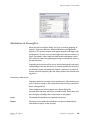
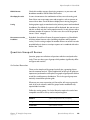
General Tab for Reports
Unlike questionnaires, reports can be published to assorted media
(including HTML), even when Paper is selected. See also Automatic Report
Document Properties Dialog on page 245.
Document Name
Document names are for internal reference only in dialogs and lists, and
will not be printed on questionnaires or reports.
Graph Color Fill Set
The set of colors used to fill pie charts and bar graphs can be set at the
document level, as well as overridden at the figure level. See page 250.
Type of Report
Your report can be formatted for paper, or large format for use with projectors. See Publishing Reports on page 251.
Digits after decimal
Override the default number of decimal places for counts, percentages,
and statistics such as the standard deviation.
Page Setup
Sets the margins for your overall document. Page size and orientation are
set in Print Setup.
Chapter 4 - Document Layouts
January 15, 2007
Document Properties
32
Apian SurveyPro 4.0 User Guide
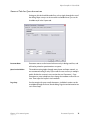
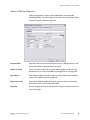
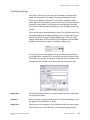
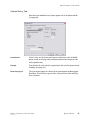
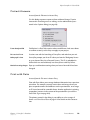
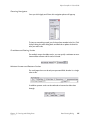
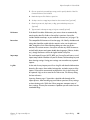
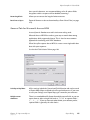
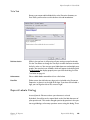
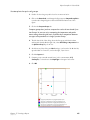
Title Tab for Paper Documents
Quickly add a title to the top of your document with this tab. If you need
more control over the placement, you can convert the tile to a regular
page graphic or insert one manually.
Place Title on Page 1
While in the text box, it will preview all your settings except line breaks.
Use the Text Palette to change the typeface, size, color, etc. You can type
up to 2000 characters, and multiple paragraphs.
Enhancements
Places a border around the title. Additional options are available if you
convert the title to a regular graphic tile.
Place Title vs. Logo
Either centers the title below any logo you’ve included using Document
Properties, or places it to the right of the logo. If you have not included a
logo, you can align the title to left, center or right.
Chapter 4 - Document Layouts
January 15, 2007
Document Properties
33
Apian SurveyPro 4.0 User Guide
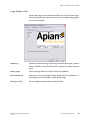
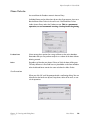
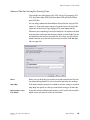
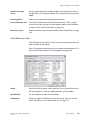
Logo Graphic Tab
Quickly add a logo to your document with this tab. If you need more control over the placement, you can convert the tile to a regular page graphic
or insert one manually.
Preview logo
Provides a peek at the image. Note that you should always print your document or publish it to the final format for a completely accurate representation.
Get Logo Image
Select the image from a file or paste it from the clipboard.
Show at percent size
Allows you to resize the image. Bitmaps should only be resized down, as
increasing their size will produce a poor-quality image.
Place Logo vs. Title
Sets the graphic's location within the specified tile.
Chapter 4 - Document Layouts
January 15, 2007
Document Properties
34
Apian SurveyPro 4.0 User Guide
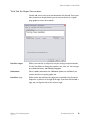
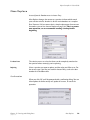
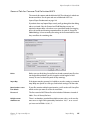
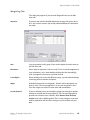
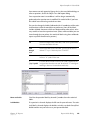
Footer and Header Tabs for Paper Documents
These tabs are a quick way to set up your footers and headers. Once
they're done, you can either leave them under the control of this dialog or
convert them to fully editable page graphic tiles.
Page Footer/Header
Select from among pre-loaded headers and footers or switch to custom
for full control.
Custom Format
With custom headers and footers you have free control over the format
and can create multi-line items. Use the variables button on the Text Palette to insert page numbers, dates and times (variables are indicated by
strike through text).
Left Side/Centered/Right
Side
Pre-loaded headers and footers for left, center, and right alignment based
on the margins you set in the General tab. For custom controls, see below.
Overrides the automatic placement of the header or footer.
Line above/below
Draws a fine line between the header or footer and body of the page. This
can also be done manually with page graphics.
Include on page 1
Allows you to exclude the footer or header from the first page. If you need
more control over the page usage convert the footer or header to a page
graphic.
Footer/Header Text Style
Text Styles provide the basis for your font settings. Use the Insert pencil
point to add new styles for different types of information such as instructions, or modify existing styles to suit your needs. Remember, when a
Chapter 4 - Document Layouts
January 15, 2007
Document Properties
35
Apian SurveyPro 4.0 User Guide
style is changed, all tiles using it are automatically updated. If you need to
override a style for just one tile or a few letters use the Text Palette (see
page 44).
Layout Tab for Paper Questionnaires
In addition to all the question-level layout settings you can make, this sets
up the general attributes such as the shape of checkboxes and coloring.
Pagination
If your questionnaire is part of a longer document, you can change the
starting page number for headers and footers.
Checkbox Style
Checkbox style is both a preference and a functional setting. The two thin
line styles are used for scanning where drop shadows can confuse the
OMR/OCR software.
Other Blank labels
Modify or translate the label used for SurveyPro's Other blanks.
Explicit No Answer
Lets you set the label used for SurveyPro's special Not Applicable scale
item (excluded from means and other calculations, but tabulated for frequencies).
Dot Fill
Use the dot fill (.......) to provide a visual connection between a question
and its scale at the right margin.
Entry blank line spacing
Allows you to adjust the vertical space SurveyPro allows for writing in
responses.
Chapter 4 - Document Layouts
January 15, 2007
Document Properties
36
Apian SurveyPro 4.0 User Guide
Entry box height
Sets the height of write-in boxes. Width is set in the individual question
dialogs.
Banding tint colors
Within grids, you can tint alternating rows to help distinguish items. This
is particularly useful for Web surveys where you cannot use the dot fill.
Layout Tab for Reports
Pagination
If your report is part of a longer document, you can change the starting
page number for headers and footers.
Chapter 4 - Document Layouts
January 15, 2007
Document Properties
37
Apian SurveyPro 4.0 User Guide
Autonumber Tab
Set up automatic numbering for your survey using preset styles or custom
formats. Autonumber is applied within an individual question tile, so you
have full control over what is first, second, or third level. When multiple
levels are used, the lower levels reset as soon as an upper level is used.
Type
Sets whether you want automatic numbering, and if so a pre-loaded or
custom format.
Formats for up to 3 levels
Select from among pre-loaded Autonumber formats. Note that even
though three levels are defined, the application of the levels is left to the
individual tile so you may only use one or two.
Indentation
Controls whether you want the number to “hang” to the left of the text
string, as well as how far you want levels indented. By default levels 2 and
3 indent slightly, but you can set that to “0” or any other value.
Starting Autonumbers
In most cases the starting number will be 1, but if your questionnaire or
report is part of a longer document you can increase the value.
Chapter 4 - Document Layouts
January 15, 2007
Document Properties
38
Apian SurveyPro 4.0 User Guide
Custom Autonumbering
With custom autonumbering you can customize the text and format to
match your corporate standards. Text shown with a strike through is a
variable which will be replaced by the actual value in your document.
1 I i A a buttons
Insert variables for numbers, uppercase Roman, lowercase Roman, uppercase alpha, and lowercase alpha respectively.
First/Second/Third level
Type the extra text you want in your format, then use the buttons above
to add the numbering variables. Be sure to include a few trailing spaces to
separate the number from your text. Fonts can be overridden using the
Text Palette (see page 44).
Show cumulative levels
Includes the upper level numbers and text in each tile. Applies to all three
levels.
Working with Tiles
Tiles are SurveyPro’s building blocks for constructing documents, and
include graphics, text, questions, and charts. They can be placed either in
the column flow, or fixed to a location on one or more pages. In most
cases, tiles will span the width of the column, but you can also lay them
out side-by-side:
Chapter 4 - Document Layouts
January 15, 2007
Working with Tiles
39
Apian SurveyPro 4.0 User Guide
Editing Tiles
Your primary tool for editing tiles is the pencil:
Insert
Adds a new tile above the current selection. To add a tile at the end of a
document, click the blue bar to select it (turning it orange) and then insert.
If you are want to add tiles side-by-side as for an address, first shorten a
tile, then click the vertical blue bar and insert a tile to its left. Right-click
can also be used to insert tiles.
Modify
Brings up the graphic, question or figure dialog to edit the tile’s settings.
Double-clicking on a tile, pressing Enter when a tile is selected, and rightclick menu can also be used to access the tile’s editing dialog.
Delete
Removes the tile from the current document. If it is a question tile which
exists in more than one document or contains data, you will have to
delete it from the Object Tree’s Database Questions section to completely
remove it and the responses associated with it from the file. The Delete
key can also be used to remove selected tiles.
Editing multiple tiles
Inline vs.
Page tiles
In some cases, you can edit several tiles at once. To select a series of tiles
in a flow, click on the first one, hold Shift down, and click on the last. Nonsequential tiles can be selected with Ctrl+click. When you click Modify
and the editing dialog appears, you will be able to edit settings common
to all selected tiles.
Inline tiles are manipulated in a separate mode from page tiles. To switch
modes, use the inline, page, and preview toolbar buttons. If you cannot
switch out of preview mode, it means the document has been locked
under the Edit menu to prevent changes. Tiles cannot be converted from
page to inline or vice-versa. Note: NetCollect surveys can only use inline
tiles.
Moving tiles
In the upper-left corner of selected tiles (orange outline), there is a small
square which is the move handle. When you place your mouse pointer
over the square, it changes to a hand. For inline tiles, click and drag the
tile, releasing when you see a red insertion bar where you want it to move
to. Page graphics can be moved anywhere on a page. Cut and paste can
also be used to relocate tiles.
Resizing
Tiles can be resized in width and height with the mouse or numerically
through the dimensions settings in their graphic/question/figure dialog.
With a mouse, move your pointer over the right or bottom edge, until you
see a double-headed arrow. Then click and drag to the desired size. You
may notice that as you change a tile’s width, the height changes also,
reflecting the line wraps at each width. There’s a minimum height and
Chapter 4 - Document Layouts
January 15, 2007
Working with Tiles
40
Apian SurveyPro 4.0 User Guide
width for each tile, which you may be able to adjust by changing layout
and font settings in the editing dialog.
Cut
Copy
Paste
As with other Windows programs, Cut removes tiles to the clipboard,
Copy places a copy on the clipboard, and Paste inserts the tiles back in.
When you copy and paste tiles within SurveyPro, it keeps track of all the
elements including scales, fonts, etc. Pasting tiles into other applications,
such as Microsoft Office, will insert plain text or a graphic depending on
the application and tile type.
You can also paste text into SurveyPro when you’re in a question, grid,
text graphic, or figure tile’s editing dialog. In addition to the usual Ctrl+v
paste, when the Text Palette is visible (see page 44) a Paste Unformatted
option is available to insert plain text.
Question tiles in a multiple questionnaire document files have some special issues—see Multiple Questionnaire Documents on page 83 for details.
Tile Names & IDs
Within your SurveyPro file, tiles are identified in the following ways:
•
The Object Tree groups tiles under the document(s) in which they are
used. Question tiles are also listed under Database Questions.
•
Tile number, such as T4, identifies its place in that questionnaire or
report. This is used primarily as a reference in the Object Tree (see
page 15).
•
Question number, such as Q7 or a range Q45-53 for a grid. Q numbers
are their IDs, so you’ll see them used in the object tree, dialogs, and
data files.
•
Internal question number, a unique ID which, unlike the Q number,
will not change or be assigned to another question.
•
Autonumber, the question or figure number you set up with the tile
definition (activated in Document Properties). When you create
report figures, you may be given the option to number questions in
the figure by their autonumber or Q number.
•
Name, required for questions and grids, optional for figures. Names
are used both for reference in the Object Tree and dialog lists as well
as for display in documents. Question names are sometimes referred
to as Report Labels in dialogs.
When working with a single questionnaire document, the distinctions
between these different identifiers are much less important because your
Chapter 4 - Document Layouts
January 15, 2007
Working with Tiles
41
Apian SurveyPro 4.0 User Guide
questions will be organized similarly throughout the project file. However,
in multiple questionnaire document files, the correspondence between Q
numbers and the order of a survey may decrease. For all projects, taking a
moment to type a clear, descriptive name will eliminate having to hunt for
tiles and correct labeling later.
Text Formatting
Each element of text within a tile, such as the caption and labels in a figure, has a Text Style associated with it. The Text Style is a named component which defines the font, size, emphasis and color of the text. This Text
Style can be shared among many tiles, and when it is edited, all tiles using
it will be updated at once.
In addition to this style, you can override the font settings for a letter, a
word, or an entire string of text. Overrides are made by selecting the characters you want to change, and then clicking the control you want to
change in the Text Palette.
Attributes set by Text Styles and the Text Palette are:
Typeface
The typeface can be a specific TrueType font, or you can select “Best
Sans Serif ” (like Arial) or “Best Serif ” (like Times Roman). These two
options are recommended for NetCollect and DirectCollect forms
because you cannot ensure respondents will have a specific font.
Size
Font sizes are specified in points (1/72 of an inch), but the dialog also indicates the size at which it will publish to HTML.
Emphasis
Bold, italic and underline. Note that long strings of Italic are difficult to
read on-screen for NetCollect and DirectCollect forms, and underline can
be confused with links on the Web.
Color
Common color selections are offered in the mini palette, or you can click
Other to select a custom color.
While SurveyPro’s dialogs and screens do preview your font settings, we
always recommend viewing the document in its final published form—
printed, published to HTML, published to screen—before finalizing your
choices.
Chapter 4 - Document Layouts
January 15, 2007
Text Formatting
42
Apian SurveyPro 4.0 User Guide
Text Style Dialog
SurveyPro's Text Styles are an easy way to maintain a consistent look
within your documents. New projects come pre-loaded with 12 styles
which are the defaults for questions, scales, figures, and other components. While you cannot delete or rename these styles, you can edit them
to match your document's style. Note that even though the pre-loaded
Text Styles may be named for their default use, you can apply them to any
element.
Text Styles may be inserted through the Object Tree and Insert menu, but
the quickest approach to adding and editing styles is right where you use
them. In the question, figure or graphic dialogs, you’ll select your style
through a drop-down list. Next to that list are Duplicate, Insert and Modify buttons which take you directly to adding or editing styles.
Since Text Styles are named objects, when you change them one place,
every application is updated. So, if you need a one-time override, use the
Text Palette (see page 50), and if you need another style, just add one. Just
remember they're reusable, so you don't need one style per question!
Editing Style 1
The internal ID of the Text Style, a unique number since SurveyPro allows
you to repeat the name.
Style Name
Reference name used for the drop-down lists in SurveyPro dialogs. It will
not appear on any documents or output.
TrueType Face
Allows you to select among the TrueType fonts installed on your system.
The “Best Sans Serif ” and “Best Serif ” are primarily designed for Net-
Chapter 4 - Document Layouts
January 15, 2007
Text Formatting
43
Apian SurveyPro 4.0 User Guide
Collect and DirectCollect projects, where the survey is completed on a
system whose fonts you cannot control. In these cases, SurveyPro will use
the best font available. “Sans Serif ” refers to fonts like Arial, and “Serif ”
fonts like Times.
Height
Size of the font you will be using. 10-12 points tends to be the most readable range for body type. The note “HTML size” is just a reference for
HTML designers, who may want to know how the points are being translated to code.
Emphasis
Style settings for the Text Style. Note that if you only want a few words to
be bold, italic, or colored, you should use the Text Palette overrides.
Preview
Shows a preview of how your settings will appear.
Text Palette
Whenever you are in a text field which allows these overrides, the Text
Palette will appear. Simply select the text to change, and click in the palette to make edits. In addition to the font formatting, the Text Palette also
allows you to insert variables and special characters.
Variables are wild cards such as page numbers which SurveyPro automatically updates with the final values. Inside a dialog they will appear with a
strike through, but as soon as you close the dialog and look at the document, you’ll see the substituted value. Most variables are applicable to
headers and footers, but you may also find them useful for comments in
your reports.
To add a variable, click in a text box where you’d like it inserted, click the
variable button
on the text palette, and select the variable.
The character map is a convenient way to insert special accented characters or symbols and bullets. When you click the
button, SurveyPro will
Chapter 4 - Document Layouts
January 15, 2007
Text Formatting
44
Apian SurveyPro 4.0 User Guide
pop up this palette. Change the font if needed, then click once to insert a
character in your text.
Graphics
A graphic in SurveyPro is anything which is not a scaled question or
report figure. In general, graphic tiles behave just like any other tile (see
page 39), including editing common attributes of multiple tiles.
Note that titles, headers and footers can be quickly set up using the Document Properties dialog for your questionnaire or report (see page 30). If
you need finer control over their design, you can convert those elements
to regular graphic tiles for full editing. See also the Graphic Dialog on page
46.
Types of graphics
Text
Text can be used for instructions, headings, and notes—anything which
will not be collecting or displaying data. You can add borders to a text
graphic, so you don’t need to overlay text on a box for that effect.
Picture
Use pictures to insert logos, icons, or photographs within your document
flow. SurveyPro supports BMP, TIF, GIF, JPEG, PCX, DIB and TGA file
formats, though only GIF and JPEG should be used for NetCollect surveys.
Line
Lines can be used to add divider lines within the page flow, or as accents
fixed to the page.
Box
Boxes are used only occasionally. More often, a Text or Picture graphic
will be inserted, using their Tile tab to add a box around the heading or
logo.
Placing graphics
All types of graphics can be placed in documents three ways:
Inline
These behave like question and figure tiles, placed within the main body
column of the document. Inline text graphics may be autonumbered,
which is useful for section headings and captions to imported picture
graphics.
Page
Page graphics are fixed to a location on the document, but can be set to
appear on multiple pages for use as a header, footer or accent.
Anchored
When you need to make a call-out on your project, use an anchored
graphic to attach a page graphic to an inline tile. It’s great for annotating
Chapter 4 - Document Layouts
January 15, 2007
Graphics
45
Apian SurveyPro 4.0 User Guide
figures, and can even include an arrow pointing to a specific location in
the inline tile. See page 49.
Graphic Dialog
With this dialog, the first option you want to set is the Content Type. This
will rearrange the controls on the screen for Text, Picture, Line or Box
graphics. See Graphics on page 45 for a description of how to use graphics
in SurveyPro, and Working with Tiles on page 39 for more on how tiles
work in a document.
Note that the dimensions in this dialog change depending on whether
you’re in a paper document (points, inches) or NetCollect document (pixels).
Controls for Text graphics
See also the Tile controls on page 48.
Alignment
Sets the alignment of the text string within its tile boundaries and indentation settings.
Text Content
While in the text box, it will preview all your settings except line breaks.
Use the Text Palette (see page 44) to change the typeface, size, color, etc.
You can type up to 2000 characters, and multiple paragraphs.
Chapter 4 - Document Layouts
January 15, 2007
Graphics
46
Apian SurveyPro 4.0 User Guide
Layout
Text graphics can be rotated in 90 degree increments.
Length of text
By default, the text will fill the width of the tile, but you can use this setting
to specify a shorter length.
Indentation
Set indentation for the left margin, as well as special indentation for the
first line.
Autonumbering
Autonumber can be applied to all question, figure, and inline text graphic
tiles. To activate Autonumber and specify what each level does, see Document Properties on page 30.
Text Style
Text Style for the inline text. Use the Insert pencil point to add new styles
for different types of information such as instructions, or modify existing
styles to suit your needs. See Text Formatting on page 42.
Controls for Picture graphics
See also the Tile controls on page 48.
Get Picture
Select the image from a file or paste it from the clipboard.
Preview at 100%
Provides a peek at the image. Note that you should always print your document or publish it to the final format for a completely accurate representation.
Sizing
Allows you to resize the image. Bitmaps should only be resized down, as
increasing their size will produce a poor-quality image.
Controls for Line graphics
See also the Tile controls on page 48.
Width
Set the thickness from 1 point to 18 points.
Length
Sets the length of the line within your tile.
Style
Line styles can be solid or dashed.
Color
Pops up a small palette of colors, and with the Other button brings up the
standard Windows color dialog where you can set any color.
Direction
Insert a vertical or horizontal line. For other angles, use a picture graphic.
Controls for Box graphics
See also the Tile controls on page 48.
Border
Adds an outline to box graphic’s tile edge.
Line Width (Pts)
Set the thickness from 1 point to 18 points.
Chapter 4 - Document Layouts
January 15, 2007
Graphics
47
Apian SurveyPro 4.0 User Guide
Style
Line styles can be solid or dashed. With solid boxes a shadow option will
also appear.
Line color
Background color
Pops up a small palette of colors, and with the Other button brings up the
standard Windows color dialog where you can set any color.
Tile controls
With graphics, the Tile tab is where you set dimensions for the tile outline,
as well as any boxes or backgrounds for Text and Picture graphics. Not all
controls will be available for all graphic types.
Tile Size
By default, SurveyPro automatically sizes the tile based on the contents,
but you can override this with an absolute value.
Gap at Top
With inline tiles, SurveyPro puts a small gap at the top of each tile to separate it from the previous tile. This setting allows you to override the
height of the gap.
Outline
Adds an outline to the text or picture graphic. The outline will be around
the tile edge.
Line Width (Pts)
Set the thickness from 1 point to 18 points.
Style
Line styles can be solid or dashed. With solid boxes a shadow option will
also appear.
Chapter 4 - Document Layouts
January 15, 2007
Graphics
48
Apian SurveyPro 4.0 User Guide
Line color
Background color
Pops up a small palette of colors, and with the Other button brings up the
standard Windows color dialog where you can set any color.
Placement
Sets the text or picture's alignment within the tile border.
Space contents from visible Adds a buffer or margin around all sides of the content.
edges
Anchor Graphic Dialog
Anchored graphics exist on the graphics layer, so they can overlap inline
tiles, but are tied to an inline tile and follow it wherever it goes. One of the
most common applications for this feature is call-outs on report figures.
These apply only to paper documents, so the option will be disabled for
NetCollect surveys and annotations will not be included in reports you
Publish to HTML.
To anchor a graphic:
1. Select one page graphic (at a time)
2. Click the
button or select Anchor Graphic from the Edit menu
3. If you want the connection to be visible, adjust the Show line settings to your
preferences
4. Click on the inline tile to which you'd like the graphic attached
You can change the placement of the graphic relative to the inline tile by
dragging it. The location of the anchor can also be moved within the
inline tile or to another tile.
To remove anchor settings, bring the Anchor Graphic dialog up again and
click Remove.
Chapter 4 - Document Layouts
January 15, 2007
Graphics
49
Apian SurveyPro 4.0 User Guide
Page Breaks & Columns
Depending on your layout, there are several tools you may use to adjust
the inline tile flow:
Page size & margins Set in the Document Properties dialog (see page 30), the “page” size may
be in inches for a paper report, or pixels for a Web survey. Margins are
also set in this dialog, and settings can be used to create page sizes
smaller than your printer offers.
Columns
The number of columns can be changed from one to three and back at
any point in the survey. In the Edit, Breaks dialog select New Section and
specify the number of columns. By default, columns have equal width, but
that can be changed to custom widths in the Breaks dialog.
Note: If you want to add a short multi-column section within a longer survey, first go to the place where you want to resume your normal layout
and insert a New Section (no other settings). Then go to where you want
the multi-column section to begin, and add another section break with its
changed settings.
For Web surveys, multi-column layouts are generally not recommended.
If you do use them, make sure the section is small enough that it fits on
the screen without scrolling—even for respondents with small monitors.
Side-by-side tiles
If you want just a few tiles side-by-side, you can resize individual tiles and
manually arrange them. Common applications of this type of layout are
city/state/zip blocks, or any time you have a series of short questions and
want to reduce white space. For details, see Working with Tiles on page 39.
If you’re aligning a large number of question tiles, you may want to complete Building Complex Question Grids on page 102 as well.
Page breaks
The Insert menu’s Breaks dialog allows you to insert simple page and column breaks as well as more complex layouts. To remove a break, simply
select the tile following the break and turn off the custom break settings.
Breaks Dialog
Accessed from the Insert menu.
All breaks are inserted just before the selected tile. To clear a break
select that tile again, go to the Breaks dialog, and uncheck the options you
want to turn off.
These are the options for paper questionnaires. Paper reports only allow
single column layouts, though you can place tiles side by side (see page
Chapter 4 - Document Layouts
January 15, 2007
Page Breaks & Columns
50
Apian SurveyPro 4.0 User Guide
39). The breaks dialog and page handling for Web questionnaires is somewhat different—see the NetCollect User Guide.
New Page/Column
Starts the selected tile at the top of the next page or column.
New Section
Creates a new section where you can change the number of columns
and/or margins.
Number of Columns
Sets the number of columns within this section, from 1-4.
Draw a Line Between
Columns
Draws a thin line between the columns, a useful feature for tightly-packed
layouts.
To Set Unequal Column
Widths
By default the columns are equally spaced, but you can override this to
set custom for some or all of the columns.
Change Margins within
Section
Allows you to override the Document | Properties margins for the current
section.
Tip
If you want to add a short multi-column section within a longer survey,
first go to the place where you want to resume your normal layout and
insert a new section (no other settings). Then go to where you want the
changed area to begin, and add another break with your changes.
Chapter 4 - Document Layouts
January 15, 2007
Page Breaks & Columns
51
Chapter 5
Questions, Grids and Scales
REFERENCE
Chapter Contents:
Understanding Question, Data, Report Linkages . . . . . . . . . . 53
Questions and Grids . . . . . . . . . . . . . . . . . . . . . . . . . . . . . . . . 53
Question Dialog . . . . . . . . . . . . . . . . . . . . . . . . . . . . . . . . . . . 55
Question Tab . . . . . . . . . . . . . . . . . . . . . . . . . . . . . . . . . . 56
Scaled Entry Tab . . . . . . . . . . . . . . . . . . . . . . . . . . . . . . . 57
Advanced Options Tab . . . . . . . . . . . . . . . . . . . . . . . . . . . 58
Dimensions Tab . . . . . . . . . . . . . . . . . . . . . . . . . . . . . . . . 59
Question Grid Dialog . . . . . . . . . . . . . . . . . . . . . . . . . . . . . . . 60
General Tab . . . . . . . . . . . . . . . . . . . . . . . . . . . . . . . . . . . 60
Quick Set Tab . . . . . . . . . . . . . . . . . . . . . . . . . . . . . . . . . 61
Rows Tab (Advanced Setup) . . . . . . . . . . . . . . . . . . . . . . 62
Columns Tab (Advanced Setup) . . . . . . . . . . . . . . . . . . . . 63
Answer Entries Tab (Advanced Setup) . . . . . . . . . . . . . . . 64
Layout Tab (Advanced Setup) . . . . . . . . . . . . . . . . . . . . . 65
Report Labels Tab (Advanced Setup) . . . . . . . . . . . . . . . 66
Merge into Question Grid . . . . . . . . . . . . . . . . . . . . . . . . . . . . 67
Split Question Grid . . . . . . . . . . . . . . . . . . . . . . . . . . . . . . . . . 68
Selecting Scales . . . . . . . . . . . . . . . . . . . . . . . . . . . . . . . . . . 69
Scale Dialog . . . . . . . . . . . . . . . . . . . . . . . . . . . . . . . . . . . . . 72
Checkboxes . . . . . . . . . . . . . . . . . . . . . . . . . . . . . . . . . . . 73
Dates/Times . . . . . . . . . . . . . . . . . . . . . . . . . . . . . . . . . . 74
Pattern . . . . . . . . . . . . . . . . . . . . . . . . . . . . . . . . . . . . . . 75
Ratings . . . . . . . . . . . . . . . . . . . . . . . . . . . . . . . . . . . . . . 77
Numbers . . . . . . . . . . . . . . . . . . . . . . . . . . . . . . . . . . . . . 77
Force Rank . . . . . . . . . . . . . . . . . . . . . . . . . . . . . . . . . . . 78
Chapter 5 - Questions, Grids and Scales
January 15, 2007
52
Apian SurveyPro 4.0 User Guide
Understanding Question, Data, Report Linkages
All you did was make a small edit in your survey—you added another
checkbox to a custom scale and switched it from single to multiple
answer. All of a sudden the data entry screen is different, your report was
re-built with new legends, bars and columns, and some figures are grayed
out because the statistics you had selected are no longer applicable.
While SurveyPro documents resemble page layouts, in many ways they
are closer to database design tools. Everything you do in a questionnaire
ripples through the program, and while it’s a wonderful thing, this tight
interconnection means that you really want to get your survey right
before collecting data and beginning analysis. A little planning can
have a huge payoff !
Unfortunately you can’t anticipate for every possibility, so SurveyPro
includes tools that let you work with evolving surveys in long-running
research projects. It also adapts to many of the other edits which come
along in the real world. In the example above, no data was lost even
though the structure of the field changed. (Not not all changes are safe,
though, so heed your warning messages.)
Important:
Do not edit your questionnaires while data collection is ongoing, whether
via scanning, KeyCollect, DirectCollect, or NetCollect. Doing so creates
differences between your SP4 file and your data files, which can generate
mismatches in your imports and distort your reports. Only make edits
once all data files have been imported, and make a backup copy first.
Questions and Grids
SurveyPro questionnaire documents are constructed from question tiles
and graphic tiles. To add a question, use the Insert
toolbar button,
selecting either a single question or a grid of multiple questions. If these
options are disabled, check to see if you are in the inline editing mode
. (See also Working with Tiles on page 39 and Creating a Questionnaire
on page 91.)
A question is fundamentally a database field, with four core attributes:
•
Question text, up to 2000 characters
•
Report Label, up to 200 characters, for use in lists and reports
•
Question number (Q number), an automatically assigned ID
•
Scale, the data structure for responses
Chapter 5 - Questions, Grids and Scales
January 15, 2007
Understanding Question, Data, Report Linkages
53
Apian SurveyPro 4.0 User Guide
In addition, there are layout settings for the tile dimensions, scale, indents,
and fonts—all of which are tile-specific to accommodate questionnaire
documents for different audiences or applications.
New users often make the mistake of treating SurveyPro like a page layout program instead of a database application. Unfortunately, layout is not
a reliable gauge of a question’s contents, as you can see from these questions with identical layouts but completely different data structures:
In practice, users wanting a blank for a question will often specify a Written Answer, or even use underscores “____.” Unfortunately, that doesn’t
allow SurveyPro to enforce formatting on entry or import, or to manipulate the data properly in reports. So, when you’re setting up your survey,
be sure to choose the correct scale structure, not just the right layout. See
Selecting Scales on page 69 for more.
Question Grids
Grids let you quickly set up a number of related questions that you can
treat as a single tile for editing and layout.
When you define a grid, you’ll enter question text for rows, and select
scales for columns. Any scale can be used for grids, so you can do anything from a simple Yes/No checkbox column to detailed tables asking for
dozens of data points.
Chapter 5 - Questions, Grids and Scales
January 15, 2007
Questions and Grids
54
Apian SurveyPro 4.0 User Guide
Each row/scale combination produces a distinct question. In the example
above there are six questions, but if you added another column with an
importance scale, you would have twelve fields which could be analyzed
independently or as part of a group. SurveyPro automatically creates
question groups (see page 228) from each scale column as a starting point
for your analysis.
As a survey evolves, or expands to include multiple questionnaire documents (see page 83), some rows and columns may no longer be applicable
to your survey. Because the grids are a single unit, you can’t remove individual items without deleting your data or affecting all uses of the grid.
However, both question rows and scale columns can be selectively hidden
or revealed as needed—all without disturbing a single response in your
database.
The grid dialog has two modes: Normal one-screen setup and Advanced
option screens. The basic mode is all you’ll need for many grids, since it
allows up to two scales and includes basic layout features. Even if you
know you’ll need the advanced settings, it’s often fastest to rough in the
grid using the basic mode, then switch to advanced.
Creating a Questionnaire on page 91 inserts a grid, and Building Complex
Question Grids on page 102 walks through the advanced settings to give
you a good feel for your options. The Help system includes detailed information on specific grid dialog controls.
Question Dialog
The Question and Question Grid (see page 60) dialogs are used to add
anything which will collect data. For elements such as titles, subheads,
and instructions, use an inline text graphic (see page 45).
When you first insert a question, the dialog will be in “wizard” mode stepping you through each tab. When editing an existing question, all four tabs
will be visible.
Chapter 5 - Questions, Grids and Scales
January 15, 2007
Question Dialog
55
Apian SurveyPro 4.0 User Guide
Question Tab
Left/Center/Right/Justify
Sets the alignment of the text string within its tile boundaries and indentation settings.
Questionnaire Text
While in the text box, it will preview all your settings except line breaks.
Use the Text Palette to change the typeface, size, color, etc. You can type
up to 2000 characters, and multiple paragraphs. This field can be left
empty.
Autonumbering
Autonumber can be applied to all question, figure, and inline text graphic
tiles. To activate Autonumber and specify what each level does, go to
Document Properties (see page 30).
Label for Report Figures
The report label is used both in figures and in drop-down lists, so while
you can have up to 200 characters, shorter is better.
Text Style for Question Text
Sets the base style for the question text (scales are set separately). Note
that if you only want a few words to be bold, italic, or colored, you should
use the Text Palette overrides (see page 44).
Chapter 5 - Questions, Grids and Scales
January 15, 2007
Question Dialog
56
Apian SurveyPro 4.0 User Guide
Scaled Entry Tab
Note that some additional scale layout options are in the Advanced tab
(see page 58).
Scale Selection
Select a scale, use the Insert pencil point to add a new scale, or Modify
button to edit an existing scale (remember all questions using that scale
will be updated too).
Text Style
Text Style for the scale, which is separate from the style for questions and
headings. (See page 42.)
Answer Entry Layout
The scale layout options are driven by the questionnaire medium (paper,
NetCollect, DirectCollect), type of scale, and your Place Scale and Entry
Style selections.
Chapter 5 - Questions, Grids and Scales
January 15, 2007
Question Dialog
57
Apian SurveyPro 4.0 User Guide
Advanced Options Tab
This tab has additional options for the scale, and which ones appear
depends on its underlying structure.
Checkbox Tile Order
Lists the checkboxes in your scale, by default in the same order as the
scale definition. While you can type over the labels in this area, those
changes will not be saved—edit the scale instead (see page 69).
Hide
When you have an unordered scale, you can hide boxes that have data in
the database but which are no longer used.
Break
Mark to override the column breaks in checkbox layouts.
Other Box and Blank Full
Width
By default the Other blank extends across all columns of your checkbox
scale. Turn off to have the Other blank in only one column.
NetCollect n/a box
Override the Document Properties setting for the n/a option. See the NetCollect User Guide for more.
Ordering
Reverse (flip), randomize, or manually reorder the answers within the
scale. The options available depends on whether the scale is ordered or
unordered.
Dot Fill
Override the Document Properties setting for dot fill between questions
and scales placed to their right (see page 36).
Boxes Checked
Set minimum and maximum boxes allowed for multiple answer checkbox
scales.
Respondent must answer
Requires an answer to the question.
Chapter 5 - Questions, Grids and Scales
January 15, 2007
Question Dialog
58
Apian SurveyPro 4.0 User Guide
Dimensions Tab
Dimensions includes settings for the size of the tile and layout within.
Note that several of these controls are dependent on the scale layout
(below or to left of question, checkboxes vs. written answer), so if an
option you want is missing, check the Scaled Entry tab (see page 57).
Tile Width
By default, SurveyPro automatically sizes the tile to fit the margins, but
you can override this with an absolute value.
Question Text Left/Right
Indent
Indents the question text from the tile’s left and right edges.
First Line Indent
Allows a different indentation for the first line, either further indented
from the left margin, or “hanging” to the left of the margin.
Scale Entry Left Indent
Indents the scale from the question's left margin.
Down from Top
With inline tiles, SurveyPro puts a small gap at the top of each tile to separate it from the previous tile. This setting allows you to override the
height of the gap.
Below Question
Adjusts the small gap SurveyPro places between the scale and question.
First Box from Left
Box Steps
These layout details vary depending on the scale type and layout. In general, they are used to fine-tune the placement of the scale, spacing of
checkbox columns, size of text boxes, etc.
Chapter 5 - Questions, Grids and Scales
January 15, 2007
Question Dialog
59
Apian SurveyPro 4.0 User Guide
Question Grid Dialog
Question Grids set up multiple items with one or more measurement
scales. The scales can be any structure, from checkbox to numeric, and
mixed within the grid. Grids also automatically create Question Groups
(see page 228), for easy analysis. See also Questions and Grids on page 53.
Even if you know you're going to need some of the advanced layout
options, it's usually fastest to rough in your grid with the two quick setup
tabs. When you're done with them, switch the setting on the first tab to
advanced.
General Tab
The General tab sets the primary layout style and the reporting label for
the grid. It also gives you the choice of the Quick or Advanced setup
method. You can go from Quick to Advanced at any time, but once you
have used an Advanced feature the Quick option will no longer be available. You’ll also have fewer options if you’re editing the questions or
scales of a grid across questionnaires (versus the layout in one questionnaire).
Setup Level
The Normal one screen setup is the fastest way to create a grid, then use
the Advanced option to access additional controls.
Label for Report Question
Grid
Grid names are the basis of question group names, so this may appear in
your reports.
Chapter 5 - Questions, Grids and Scales
January 15, 2007
Question Grid Dialog
60
Apian SurveyPro 4.0 User Guide
Grid Style
This sets the basic style of your grid—you can control some finer points in
the Advanced tabs.
Quick Set Tab
Question Row Labels
Type and edit entries directly in the list, or using the larger type-in box.
Enter will drop you down to the next item (or add a new one), or you can
use the plus, insert, and delete buttons to change items. To rearrange
items, click on the gray box at the left of the row once to select it, then
click and drag, releasing when the red line is where you want the item to
go. The three buttons to the right are used to edit items in the list. The
plus sign adds a new item at the end of the list; the Insert pencil point
adds an item above the currently selected one; the Delete eraser removes
the current item.
Scale
Select a scale, use the Insert pencil point to add a new scale, or Modify
button to edit an existing scale (remember all questions using that scale
will be updated too).
Label
Optional column heading centered above the scale labels. The Advanced
tabs include options for repeating the headings and formatting the text
style.
Entry
Layout options for the selected scale.
Column Buttons
Rearrange, add, and remove the scale columns. If you need more scales
or greater flexibility, use the Advanced tabs.
Chapter 5 - Questions, Grids and Scales
January 15, 2007
Question Grid Dialog
61
Apian SurveyPro 4.0 User Guide
Rows Tab (Advanced Setup)
In the Quick Set dialog, the rows you enter are all scaled questions using
the default font settings. Here you can have:
•
Questions: “Ques.”
•
Column labels: “C-Lbls,” are the optional headings and scale labels
from the Columns tab. Repeating column labels is particularly useful
with NetCollect surveys where the headings can scroll off-screen on
larger grids.
•
Headings: “Hdg,” are informational text you can add to separate
different question categories.
You can vary the style of questions and headings by using the Text Palette
which appears when typing in the larger box (see page 44). Note that the
Base Text Style for Questions and Headings can be different.
Row Type
Set whether the row is a scaled question, column labels, or headings.
Questionnaire Label
Type and edit entries directly in the list, or using the larger type-in box.
Enter will drop you down to the next item (or add a new one), or you can
use the plus, insert, and delete buttons to change items. To rearrange
items, click on the gray box at the left of the row once to select it, then
click and drag, releasing when the red line is where you want the item to
go.
Hide
As your questionnaire evolves, or if you have multiple questionnaire documents, you can hide elements which do not apply.
Chapter 5 - Questions, Grids and Scales
January 15, 2007
Question Grid Dialog
62
Apian SurveyPro 4.0 User Guide
Extended edit
Lets you work more easily with longer labels, as well as enhancing
selected words with the Text Palette (see page 44).
Question and Row Label
Text Style
Sets the style of the questions in your rows.
Heading Text Style
Lets you set a different style for any rows designated as Hdg.
Randomize Each
Respondent’s Order
Randomizes the row order to reduce order biases. This is best applied
with NetCollect or DirectCollect surveys where it is randomized for each
respondent—paper forms will only randomize on Print.
Columns Tab (Advanced Setup)
This tab stacks up the columns in your grid. By default, the first column is
the row labels “R-Lbls,” but they can be moved to the middle, right column, or repeated within the grid. Each scale is considered a column, even
if it contains multiple columns for the checkbox or rating entry. You can
also add scales beyond the two allowed in the Quick Set dialog.
Column Type
Set whether the column is the question labels or a scale column.
Column Label
Type and edit entries directly in the list, or using the larger type-in box.
Enter will drop you down to the next item (or add a new one), or you can
use the plus, insert, and delete buttons to change items. To rearrange
items, click on the gray box at the left of the row once to select it, then
click and drag, releasing when the red line is where you want the item to
go.
Chapter 5 - Questions, Grids and Scales
January 15, 2007
Question Grid Dialog
63
Apian SurveyPro 4.0 User Guide
Scale
Displays the scale for the row. Select the scale from the list that appears
when you click in the cell.
Hide
As your questionnaire evolves, or if you have multiple questionnaire documents, you can hide elements which do not apply.
Scale Label Text Style
Sets the style of your scale labels in the columns.
Answer Entries Tab (Advanced Setup)
This tab is devoted to the layout of your grid’s scales. Be sure you've set
the Document Properties to the correct medium before getting too
detailed.
Scaled Column(s) Defined
Every element in this screen is driven by the item you have selected in
this list.
Answer Entry Layout
The scale layout options are driven by the questionnaire medium (paper,
NetCollect, DirectCollect), scale structure, and the selection in the first set
of layout radio buttons.
Scale’s Text Style
Text Style for the scale labels, which is separate from the style for questions and headings.
Entry Order
Lets you choose the layout order for elements in the scale: Per Scale,
Reversed, or Randomized. Note that the Per Scale layout of the scale is
normally from the first box at the left to the last at the right. Reversed is
the opposite order of Per Scale.
Chapter 5 - Questions, Grids and Scales
January 15, 2007
Question Grid Dialog
64
Apian SurveyPro 4.0 User Guide
Forced Sum
Appears in NetCollect documents, allowing you to set a total for the
selected scale column. Error notices are specified in the Answer Tests dialog.
Layout Tab (Advanced Setup)
Additional layout items which apply to the grid overall.
Tile Width
By default, SurveyPro automatically sizes the tile based on the contents,
but you can override this with an absolute value.
Down from Top
With inline tiles, SurveyPro puts a small gap at the top of each tile to separate it from the previous tile. This setting allows you to override the
height of the gap. This is most often overridden to 0 in order to close up
the gap between a grid and its instructions.
Border Space Height/Width
Borders are the padding between rows and columns.
Indent Question/Heading
Rows
You can set different indentation levels for the question and heading rows.
Both are from the left tile edge.
Heading Row Heights
By default heading rows are the same height as questions, but you can set
a value up to 1 inch.
Line Between Scales
Adds a vertical line between the scales. NetCollect surveys only.
Column Label Formatting
Allows you to specify the width of each column in the grid, including the
question column.
Chapter 5 - Questions, Grids and Scales
January 15, 2007
Question Grid Dialog
65
Apian SurveyPro 4.0 User Guide
Dot Fill Options
For this grid, choose whether to leave the dot fill (.....) Per Document (to
match the document's default setup), Force On (no matter what the
default is), or Force Off. See page 36.
Autonumber Levels
Autonumber can be applied to all question, figure, and inline text graphic
tiles. To activate Autonumber and specify what each level does, go to
Document Properties (see page 38).
Text Justify
Change the alignment of column headings (question columns are left
aligned).
Report Labels Tab (Advanced Setup)
Each grid row creates a data field with a SurveyPro Q code for each scale
used, so in this example, with 5 question rows and 2 scale columns, there
will be a total of 10 fields, each one of which needs a unique report label.
By default, SurveyPro generates these labels by combining the row prefix
with the column suffix. Of course, if you only have one column, this isn't a
critical setting.
Row Report Labels
Lists the text of the question in the row, and allows you to override that
with a report label prefix for the row.
Column Report Labels
When a grid has more than one column, each you can set a suffix to each
row to indicate what aspect is being measured.
Note about overrides
Labels set in this tab can be overridden through the Edit menu’s Report
Labels on a question-by-question basis (see page 248). Once you have set
your own report labels, they do not change if you later change the grid’s
Chapter 5 - Questions, Grids and Scales
January 15, 2007
Question Grid Dialog
66
Apian SurveyPro 4.0 User Guide
labeling. You can re-set them to the defaults in the Report Labels dialog.
See also Question Groups on page 228 for changing the labels in specific
figures.
Merge into Question Grid
This can be used to merge one or more grids into a single grid, or one or
more questions into a grid (particularly helpful with SurveyPro 2.0 files).
The advantage of this function is that it can be used with questions that
have data.
Create a backup copy of your file before making these changes, and do
not make any questionnaire edits while data collection is ongoing. Note
that you can create Question Groups for reporting from individual questions (see page 228).
Select the questions or grids you want to combine, then Edit menu, Merge
into Grid.
Into Scaled Columns
In most cases, this will be one column. However, if your individual question tiles alternate scales you can specify a dual scale grid. If your questions contain data, make sure they end up in the columns you expect.
Name of merged grid
The name of the question grid. Used as part of the name in the automatic
question groups, and can be edited after the new grid is created.
Chapter 5 - Questions, Grids and Scales
January 15, 2007
Merge into Question Grid
67
Apian SurveyPro 4.0 User Guide
Split Question Grid
Since question grids must fit on one page, this is a way to divide a grid
into two grids or individual question tiles. You can apply this to questions
that have data.
If you’re conducting Web surveys and simply want the headings to stay
visible as the respondent scrolls, you can add C-Lbls rows to your grid to
repeat the headings (see page 62).
Create a backup copy of your file first, and do not make any questionnaire
edits while data collection is ongoing. Note that you can create Question
Groups for reporting from individual questions (see page 228).
Select the grids you want to divide, then Edit menu, Split Grid.
Split on
You can divide a grid into two sets of rows or two sets of columns. For this
division, mark the row or column which will be the first one in the new
grid. If you need to split into more than two grids, just repeat the Split
command.
You can also extract individual question tiles from a grid, marking all the
questions you want to pull out.
Name of grids
The name of the question grid or grids. Used as part of the name in the
automatic question groups, and can be edited after the split.
Chapter 5 - Questions, Grids and Scales
January 15, 2007
Split Question Grid
68
Apian SurveyPro 4.0 User Guide
Selecting Scales
A scale is the structure of a question, from a Yes/No “checkbox,” to written answers, to dates. The two questions to ask when selecting a scale are:
What’s the best respondent experience?
How am I analyzing this data?
Usually these questions produce the same scale, but in cases when they
don’t, Rescales are there to bridge the gap (see page 216).
To insert and edit scales, you can use the Insert menu, the Object Tree
(see page 15), and most commonly, dialog boxes where you select scales:
You can also insert a copy of a scale through the Object Tree or the duplicate button
in a dialog. Note that scales are named components, so
once one is defined you can apply it as many places as you need, and
edits to one instance will update all questions using the scale.
SurveyPro includes 32 common scales for use as-is or with modifications,
as well as several structures for adding your own custom scales.
Unordered scales
These scales consist of answers or options which are not inherently
related. For example, New York is not better or worse than Los Angeles,
and one person's comment is not greater or less than another. In SurveyPro, they include:
•
Long Non-Repeating Written Answers
•
Short Countable Written Answers
•
Pattern Scales
•
Unordered Checkboxes
Chapter 5 - Questions, Grids and Scales
January 15, 2007
Selecting Scales
69
Apian SurveyPro 4.0 User Guide
Ordered scales
Ordered scales consist of items which have an inherent relationship, such
as Excellent/Good/Fair/Poor, -3 to 3, or dates. Often, the spacing
between the options is consistent (the fourth option has twice the value of
the second), though that is not required. SurveyPro’s ordered scales are:
•
Ranking Scales
•
Ordered Checkboxes
•
Rating Scales
•
Date/Time Scales
•
Number Scales
Most of the scales will quickly become familiar, especially if you complete
a few tutorials. This table’s detailed breakdown is primarily for your reference and for troubleshooting. For an explanation of the analysis terms,
see Statistics in SurveyPro on page 207.
Long Non-Repeating Written Answers
Applications
Comments, essays, and other unique long responses. Can also be used for
shorter items, such as the respondent's name or address, which you do not
expect to be repeated.
Layouts
Write-in blanks or type-in boxes.
Analysis
Bulleted lists. You can use Rescales to extract keywords, but that it is more
effective to add a short written answer scale and manually postcode responses
into categories (see page 125).
Short Countable Written Answers
Applications
Departments, products, locations, and other items where you expect
respondents to repeat answers. The Multiple Answer version of this scale is used
when respondents may provide several answers to the question, such as
products they use. These scales may be paired with a long comment to postcode
a respondent's comment.
Layouts
Write-in blanks or type-in boxes
Analysis
Counts and percentages. May also be used in crosstabs and Form Selects to
analyze sub-groups (see page 212). For best results, countable written answers
should be “cleaned” during entry or import (see page 123) so SurveyPro has
consistent responses to tabulate.
Chapter 5 - Questions, Grids and Scales
January 15, 2007
Selecting Scales
70
Apian SurveyPro 4.0 User Guide
Pattern Scales
Applications
Telephone numbers, social security numbers, Zip codes, IDs.
Layouts
Write or type-in blanks, pattern boxes, bubble grids, barcodes.
Analysis
Same as written answers—the type of written answer is specified in the pattern
scale definition.
Unordered Checkboxes
Applications
Products, locations, interests, services. Unordered checkboxes can accept
single or multiple answers, and may include an Other blank for less frequently
used responses.
Layouts
Checkboxes, drop-down lists, or write-in blanks.
Analysis
Counts, percents, confidence interval cross-tabs, chi-square. “Other”
responses are tabulated with the checkboxes by default.
Ranking Scales
Applications
Relative importance of items being evaluated, such as features, issues,
services. Does not provide information on how much more important one item is
than another. Note some features, such as using each number only once, are
only enforced in grids.
Layouts
Checkboxes, write-in blanks, circle-the-answer, drop-down lists.
Analysis
Counts, percents, mean, weighted mean, median, top/bottom boxes, crosstabs, chi-square.
Ordered Checkboxes
Applications
Excellence, importance, agreement/Likerts.
Layouts
Checkboxes, circle-the-answer, write-in blanks, drop-down lists.
Analysis
Counts, percents, mean, weighted mean, standard error of the mean, median,
top/bottom boxes, cross-tabs, chi-square.
Rating Scales
Applications
Excellence, importance, agreement, Stapels, semantic differentials. Only
allows labels at ends and midpoint.
Layouts
Checkboxes, circle-the-number, rulers, drop-down lists, write-in blanks.
Analysis
Same as ordered checkbox.
Chapter 5 - Questions, Grids and Scales
January 15, 2007
Selecting Scales
71
Apian SurveyPro 4.0 User Guide
Date/Time & Number Scales
Applications
Birth date, time of visit, income, age, and other values which will be used in
calculations. A pattern can be applied to enforce a custom format of the
response.
Not for use with IDs, SSNs, Zip codes, or telephone numbers (use pattern or
written answer).
Layouts
Write or type-in blanks, pattern boxes, bubble grids.
Analysis
Everything, though some actions such as crosstabs require responses be binned
into groups through the Figure dialog or a Rescale.
Scale Dialog
Because SurveyPro structures its questionnaires and database from the
scale definition, it impacts:
•
Layout options
•
Respondent experience for DirectCollect and NetCollect surveys
•
Data import and entry
•
Analysis options
There are a wide range of Tech Support reporting calls where the first
step is to go back to the scales of the questions involved, so an investment
in getting your scales right is well worth the time. In fact, Tech Support is
more than happy to check subscribers’ questionnaires for structural
issues—before you distribute copies to everyone.
If you're new to surveying, start with Selecting Scales on page 69 to learn
about the impact they have on your reports. Experienced researchers may
want to review Modifiers & Rescales on page 216 and Postcoding on page
125 for some of the advanced manipulations you can perform.
Common Elements
Name
By default, SurveyPro puts the question label in for your scale name, but it
can be anything. The name is just for reference in dialogs, so shorter is
better.
Type
The scale type can have a significant impact on your layout options, data
input, and analysis, so if you're not sure which one you need see Selecting
Scales on page 69.
Chapter 5 - Questions, Grids and Scales
January 15, 2007
Scale Dialog
72
Apian SurveyPro 4.0 User Guide
Checkboxes
Checkbox scales are the most common custom scales, used for both
ordered information such as importance, and unordered lists such as locations.
Note that this dialog is a composite, with some options only available for
unordered or ordered scales.
Box Statistical Values
An unordered scale is used for scales such as locations, names, or products, where one option is not better or worse than the others. The other 3
options are different ways of approaching ordered scales (like importance), and their values are used in reporting to calculate means and set
axis labels.
Answers Single/Multiple
Unordered checkbox scales can be single or multiple answer. With multiple answers, you can specify minimum and maximum numbers of boxes
that can be marked while Publishing some document types.
Add Other Blank
Unordered scales can have an Other blank which adds a checkbox and
text box. The Other label is set in the Document Properties dialog.
Add Explicit N/A
Differentiates a missing response from Not Applicable. Not Applicables
are also automatically dropped from mean calculations of ordered scales.
The NA label is set in the Document Properties dialog (see page 36).
Automatic Legends
By default SurveyPro uses a simple alphanumeric legend for reports, but
you can override this with your own 1-2 digit labels.
Sorts Box 1 as Best/First
Applies in analysis when you're working with top box and bottom box settings, and simply tells SurveyPro whether you consider the first answer to
be best (top) or worst (bottom).
Chapter 5 - Questions, Grids and Scales
January 15, 2007
Scale Dialog
73
Apian SurveyPro 4.0 User Guide
Label
Type and edit entries directly in the list, or using the larger type-in box.
Enter will drop you down to the next item (or add a new one), or you can
use the plus, insert, and delete buttons to change items. To rearrange
items, click on the gray box at the left of the row once to select it, then
click and drag, releasing when the red line is where you want the item to
go. Labels can be up to 200 characters.
Hdg (Heading)
Unordered scales can have headings intermixed with scale items. This is
useful for longer scales and multiple answers containing multiple categories of information.
Lgd (Legend)
To activate this type-in area, turn off automatic legends. You can enter
one or two alphanumeric digits.
Val (Values)
Values used for calculating means and other analysis functions. You can
activate this column by turning on Set Own Values. In addition, you can
use Rescales to modify the values without editing the underlying scale.
Extended Edit
While in the text box, it will preview all your settings except line breaks.
Use the Text Palette to change the typeface, size, color, etc. You can type
up to 200 characters in a single line/paragraph.
Dates/Times
Dates and times can be in almost any format, and the format can be modified at any time without affecting the data (unless you change whether it's
looking for a date or time). SurveyPro is somewhat flexible on entry, recognizing variations as long as they are in the same order or unambiguous.
Answers
Date/time scales can include both measures, or just a date or time.
Format(s)
Select from the drop-down lists the formats you'd like for dates and times.
Chapter 5 - Questions, Grids and Scales
January 15, 2007
Scale Dialog
74
Apian SurveyPro 4.0 User Guide
Answer Limits
Set the minimum and/or maximum acceptable responses to the question
by entering values in the same format as your scale. These will be
enforced during data collection.
Enable Pattern
You can apply a pattern to a date scale. See the next section.
Pattern
Pattern scales are saved internally as written answers, but screened on
collection to match a set format. Once input and reformatted by SurveyPro, the information stored is exactly what you see on the screen. Before
you define your own pattern, check the scale list as the most common
ones are pre-defined in SurveyPro.
The pattern codes are similar to Microsoft Access' input masks, with
some enhancements for greater flexibility of input.
Pattern Hints
Reference of pattern characters.
Fixed Answer Pattern
Type-in box for the pattern.
Test Answer
Type an answer you think should or should not be accepted, and click the
Test Answer button. An message will appear saying if the entry was OK,
or if there was a mismatch at a character number.
Answers
Patterns are based on written answers, and these options correspond to
the 3 types. The first two options can be autopostcoded (tabulated) by
SurveyPro, and are useful for Zip, organization, and similar codes, while
the third assumes values are unique or seldom repeated. Uniqueness will
not be enforced unless the question is set as a password field.
Chapter 5 - Questions, Grids and Scales
January 15, 2007
Scale Dialog
75
Apian SurveyPro 4.0 User Guide
Example Patterns
To get you started, here are some sample patterns (several built in to
SurveyPro). The first acceptable answer listed is the format in which data
will be stored.
Pattern
Acceptable Answers
^(~000~{)-. }^ ~000~{-. }~0000
(206) 555-1212
206-555-1212
206 555-1212
206.555 1212
000~^-~00~^-~0000
555-88-1234
555881234
555 88 1234
555 - 88 - 1234
00000~^-~9999
98103-1234
98103
98103 1234
98103 - 1234
>LLLL~^\#~009999
ABCD#123456
abcd 12
aBcD # 1234
{\A\a}{\X\x}~^-~0000
AX-1234
ax1234
aX - 1234
Chapter 5 - Questions, Grids and Scales
January 15, 2007
Scale Dialog
76
Apian SurveyPro 4.0 User Guide
Ratings
Rating scales are used for semantic differentials and other ordered scales.
Answer Range
Endpoints can be from any low to high numeric values, including ranges
around 0 such as -3 to +3.
Reports sort minimum as
best/first
Applies in analysis when you're working with top box and bottom box settings, and simply tells SurveyPro whether you consider the first answer to
be best (top) or worst (bottom).
Add Explicit N/A
Differentiates a missing response from Not Applicable. Not Applicables
are also automatically dropped from mean calculations of ordered scales.
The NA label is set in the Document Properties dialog (see page 36).
Labels
Rating labels are optional, and can be placed at the ends and midpoint of
the scale. If you need to label all the levels, use an ordered Checkbox
scale (see page 73).
Numbers
Number scales should only be used for fields which are going to be computed, such as income or age. SurveyPro stores 6-7 significant digits internally, so if you're collecting data on very large numbers we recommend
changing the units, and asking respondents to provide answers in thousands or millions.
For IDs, zip codes and other values which may be numeric but are not
computed, use pattern (see page 75) or written answer scales (see Selecting Scales on page 69.)
Chapter 5 - Questions, Grids and Scales
January 15, 2007
Scale Dialog
77
Apian SurveyPro 4.0 User Guide
Answer Limits
Set the minimum and/or maximum acceptable responses to the question
by entering values in the same format as your scale. These will be
enforced during data collection.
Format
There are assorted formats for displaying the numeric data (it’s always
stored simply as a number). When a currency format is selected, you can
change the symbol used.
Enable Pattern
You can apply a pattern to number scales. See Pattern on page 75.
Force Rank
Forced rank scales are used almost exclusively with question grids, where
SurveyPro can enforce the answer tests. Note that you can have 8 items in
your question grid, and ask respondents to rank their top 3.
Chapter 5 - Questions, Grids and Scales
January 15, 2007
Scale Dialog
78
Apian SurveyPro 4.0 User Guide
Number to be Ranked Best
Set the number of ranking levels with the up and down arrows.
Allow ties
By checking this you will allow respondents to mark 1, 2, 2, 3 and similar
entries. This can be a good option with paper surveys where the answers
cannot be enforced when the respondent is completing the survey.
Allow skipping levels
Allows respondents to mark “1, 2, 4” and similar entries. As with allowing
ties, this can be a good setting for paper surveys.
Require all levels be
answered
Enforces the completion of each ranking level.
Add Explicit N/A
Differentiates a missing response from Not Applicable. Not Applicables
are also automatically dropped from mean calculations of ordered scales.
The NA label is set in the Document Properties dialog (see page 36).
Automatic box vote values
Turn this off to set custom values in the Points column.
Automatic Legends
By default SurveyPro uses a simple alphanumeric legend for reports, but
you can override this with your own 1-2 digit labels.
Label
If you need to add or remove ranking levels, adjust it at the left. Type
labels directly in the list, or using the larger box below. Labels can be up
to 200 characters.
Lgd (Legend)
To activate this type-in area, turn off automatic legends. You can enter
one or two alphanumeric digits.
Pts (Points)
Values used for calculating means and other analysis functions. You can
activate this column by turning off Automatic box vote values. In addition,
you can use Rescales to modify the values without editing the underlying
scale.
Extended Edit
While in the text box, it will preview all your settings except line breaks.
Use the Text Palette to change the typeface, size, color, etc. You can type
up to 200 characters in a single line/paragraph.
Chapter 5 - Questions, Grids and Scales
January 15, 2007
Scale Dialog
79
REFERENCE
Chapter Contents:
Chapter 6 - Questionnaires
January 15, 2007
Chapter 6
Questionnaires
Designing for Specific Media . . . . . . . . . . . . . . . . . . . . . . . . . 81
Skips and Branches Dialog . . . . . . . . . . . . . . . . . . . . . . . . . . . 82
Multiple Questionnaire Documents . . . . . . . . . . . . . . . . . . . . 83
Passwords . . . . . . . . . . . . . . . . . . . . . . . . . . . . . . . . . . . . . . . 86
Make PIN File Dialog . . . . . . . . . . . . . . . . . . . . . . . . . . . . 88
Alternative access restrictions . . . . . . . . . . . . . . . . . . . . 88
Publishing Questionnaires . . . . . . . . . . . . . . . . . . . . . . . . . . . 89
KeyCollect Publish Dialog . . . . . . . . . . . . . . . . . . . . . . . . 89
Publish Logs . . . . . . . . . . . . . . . . . . . . . . . . . . . . . . . . . . 90
80
Apian SurveyPro 4.0 User Guide
Designing for Specific Media
The steps to create a questionnaire for paper, scanning, Web and screen
are the same—the only differences are in the details of the content and
layout. SurveyPro projects can contain surveys with multiple questionnaire documents for cases when you need to use multiple media. The
same question (based on Q number) appearing in multiple documents will
save data to just one field. Of course you can break the data apart for
analysis by document if you wish. See Multiple Questionnaire Documents on
page 83 for details on working with linked questions.
Different media have different strengths and weaknesses, so depending
on your audience one medium may have a significant advantage over the
others. This table provides a brief summary of their attributes.
Medium
Pros
Cons
Paper surveys for keyed
entry
Anonymous
Reaches widest audience
Most flexible layouts
Slow turnaround
Answer format not enforced at time of response
Data entry costs
Scanned surveys
Anonymous
Reaches wide audience
Fast, automated entry
Slow turnaround
Answer format not enforced at time of response
Start-up investment in scanner, software, time
Some systems require particular form layouts
Handwritten responses still require keyed entry
NetCollect Web surveys
Fast turnaround
Reaches wide audience
Industry-standard
technologies
Less anonymous (real or perceived)
Potential ballot box stuffing without unique
passwords
Uncontrolled respondent environment (layouts
flex on different systems)
DirectCollect
E-mail/LAN/Kiosk surveys
Fast turnaround
Interactive interface
Less confidential (real or perceived)
Some e-mail systems block EXE files
Requires Windows 95/98/NT/2000/XP
DirectCollect
telephone surveys
Fast turnaround
Interactive
Long/complex surveys difficult for respondents
Interviewer costs
Chapter 6 - Questionnaires
January 15, 2007
Designing for Specific Media
81
Apian SurveyPro 4.0 User Guide
Skips and Branches Dialog
Skips and branches allow you to direct a respondent’s experience based
on his or her responses. They are best used with NetCollect and DirectCollect surveys, where the skips and branches can be enforced at the time
of collection, but paper surveys can use skips too.
Both skips and branches target pages, not individual questions, so be sure
you've set the page breaks you need before you start (see page 50).
Skips are forward jumps to a page. They're based on single answer questions, such as Yes/Uncertain/No, where Yes and Uncertain continue in
question order, while No and a missing answer might skip ahead to the
next topic.
Branches work with single or multiple answer questions, sending the
respondent one or more pages of questions for each option they select.
This works well for product evaluations, where you might have a multiple
answer asking which brands they use, and then a page with detailed questions for each one.
When you go to Skip Patterns under the Document menu, the first screen
you see shows the status of the current project. From there, click Set Skips
or Set Branches to configure individual pages. Be sure to test your settings
thoroughly after publishing the questionnaire.
Pages to skip or branch
from
Displays the pages and status of the current questionnaire. Skips &
branches are document-specific, so you can have different settings for
each questionnaire. However, each page can only have one skip or
branch.
None
Removes the skip or branch from the document.
Skip/Branch
Brings up the detailed dialog (following) for setting a destination for each
response to a question.
Chapter 6 - Questionnaires
January 15, 2007
Skips and Branches Dialog
82
Apian SurveyPro 4.0 User Guide
GoTo
Brings up a simpler dialog for jumping ahead everyone who arrives at a
survey page, regardless of what they mark for answers.
Edit
Modifies an existing Skip, Branch or GoTo definition on the page.
Set Skips/Branches
To set up a skip or branch:
•
Select a question from the list in the upper-left. Valid questions from
the current page and all prior pages will be displayed.
•
Decide whether or not to require an answer.
•
Click on a response in the left list, then click on its target pages on the
right (Shift+click to select a range).
Multiple Questionnaire Documents
SurveyPro’s multiple questionnaire documents are designed for projects
where you’re analyzing data from several related survey versions. Applications include:
Chapter 6 - Questionnaires
January 15, 2007
•
Multiple media
•
Longitudinal studies and other ongoing surveys where the
questionnaire evolves
•
Long and short versions of a survey, or overlapping question sets for
different audiences
•
Distinct layouts for different clients, brands, etc.
Multiple Questionnaire Documents
83
Apian SurveyPro 4.0 User Guide
•
Postcoding, adding fields to the database for information beyond what
the respondent supplies (see page 125)
The main “don’t” for multiple questionnaire documents (and the reason
for the warning when you add a document) is to have two independently
analyzed surveys in one file. While nothing bad would happen, it unnecessarily increases the file size and complicates analysis, since you would
need to sort through the master question list for the questions from a particular document.
Working with Linked Question Tiles
The whole purpose of multiple questionnaire documents is to have questions in different surveys linked to a common data field. SurveyPro bases
these connections on the internal Q number, not the content of the question text or scale, so there are a few special ways to work with the tiles.
Question Numbers Q#
With single questionnaire documents, the internal question numbers simply track the order in the survey. With multiple questionnaires, you tell
SurveyPro which document to use to control the question ordering by
specifying a Master Questionnaire in the first tab of Tools, Options.
If you do change this setting, make sure it’s either before or after all your
data has been collected—otherwise you’ll encounter import mismatches
between the new question numbering and older documents’ data sets.
Inserting new questions
When you add a new question or grid to a document, the setup screens
appear as usual—the difference is that when you reach the end, SurveyPro displays a dialog asking how many places you’d like the question
inserted:
This is a fast way to insert questions in several documents at once—even
if the order of the other documents is different and you need to do some
rearranging.
Chapter 6 - Questionnaires
January 15, 2007
Multiple Questionnaire Documents
84
Apian SurveyPro 4.0 User Guide
Moving tiles within a
document
Rearranging linked question tiles is just like working with unlinked tiles.
Drag and drop, or cut and paste to the new location.
Copying and pasting
between documents
If you have a question in one survey document which you also want in
another, copy it from the first document, and paste it into the second.
Breaking the link on a
question
Sometimes you want to use a linked question as a template for a new
field, but first you need to break the link so you can freely edit the tile. To
do this, copy and paste the tile within one document. When the second
instance is pasted, it will be with all the same settings, but a new Q number unique to that tile.
Editing linked questions
Because the question text, report label and scale are integral to the question definition, an individual tile can only edit layout attributes. When you
bring up the editing dialog for a question or grid, you’ll be given the following options in the lower-left corner of the first tab:
•
Selected questionnaire only, which allows you to edit the text styles,
scale layout, and tile dimensions such as width and indentation.
•
All documents of the same media, same as above but applies changes
to several surveys at once.
•
All questionnaires, which allows all settings to be edited.
Surveys in Multiple Languages
SurveyPro considers the question text and scale labels part of the field
definition, so they have to be identical in all questionnaires.
The technique for working with multiple language versions is to finalize
your “master” survey in one language (usually the language you will use
for reports). When that’s done, save your SP4 project to a new file and
translate the questionnaire in the copy.
All data should be entered or imported into the master project file for
common analysis. This includes open-ended responses in different languages. You may want to add a question which identifies the language
version the respondent used.
NetCollect and Chinese,
Japanese, Arabic, ...
Chapter 6 - Questionnaires
January 15, 2007
You can create “double-byte” surveys when working with NetCollect’s
HTML output. While SurveyPro uses only the ANSI character set’s
accented letters, you can translate its HTML files after export to doublebyte character languages. Data files may be imported for analysis of
checkbox, rating and numeric data. Written answers cannot be analyzed
in SurveyPro without translation (they appear as a series of random
accented characters), but they will export cleanly to comma delimited
Multiple Questionnaire Documents
85
Apian SurveyPro 4.0 User Guide
ASCII files for analysis in MS Access and other applications which will
properly encode the double-byte characters.
Impacts on the rest of the project
As with everything else in questionnaires, multiple survey documents
affect other aspects of your project.
Answer Entry
When you enter the Answer Entry screen you’ll be asked which questionnaire you’d like to use for entering new forms. This can be changed midsession using Edit, New Form Questionnaire.
Import
As with Answer Entry, Import needs to know the document into which
you want new records placed. This setting is made on the first screen.
(Collect data files remember the document which created them.)
Analysis
By default, analysis is made to the entire database. However, you can set
up Form Select Filters (see page 212) to analyze results from one or more
questionnaires.
Passwords
Passwords can be a double-edged sword in surveying. On the positive
side, they ensure respondents are qualified, and in some cases, that there
is only one submission per respondent. Unfortunately they also reduce
the real and perceived anonymity of the project and may increase the
administration costs. If a survey is particularly sensitive (such as
employee evaluations), the use of unique passwords often requires the
buffer of a consultant or third-party hosting service such as Apian SurveyHost.
Passwords are most applicable for NetCollect and DirectCollect surveys.
SurveyPro supports two main password modes:
•
Single value, with or without case sensitivity
•
File of multiple values, allowing either one or many submissions per
password
When checking against a file, the most common application of multiple
use passwords is to segment the respondent base. Different passwords
can be issued to individual departments or customer segments, identifying their group while maintaining individual anonymity.
Chapter 6 - Questionnaires
January 15, 2007
Passwords
86
Apian SurveyPro 4.0 User Guide
Generating password PIN files
Whether you supply a list of values (such as employee IDs, e-mail
addresses, or department codes) or have SurveyPro create a set, it needs
to be converted to a PIN format. PIN files are specially structured and
sorted for fast checks and marking of used values.
Valid passwords are alphanumeric, with some special characters such as
“@,” “-,” and “_” allowed, but no spaces.
SurveyPro generated passwords are 4 or 5-letter alphanumeric values, or
longer pure numeric values. One advantage of using the 4 and 5-letter
PIN values is that NetCollect and DirectCollect will automatically substitute for several common typing errors, such as “O” for “0.” These PINs
are also generated from a large supply, so there is a low probability of randomly typing a valid password.
Whether you are generating a PIN file from scratch or converting your
own file, the utility to use is Make PIN File under the Tools menu. Make
sure you generate enough passwords for your full respondent population,
including some spares for testing.
Seeding a database with passwords
While the Make PIN File utility generates an external PIN file, there’s
another option for generating PINs within a database. The primary application for this tool is mail merges, such as printing paper surveys with a
unique barcode, or creating a list of passwords and e-mail addresses for a
mass mailing.
Fill Passwords is located under the Database menu when you’re in
Answer Entry. When you specify a question that uses one of the Apian
PIN scales, it will add a unique password to forms which do not already
have one. Before running Fill Passwords, you will need to have entered or
imported the forms you would like filled.
Then, to generate an external PIN file for administering your survey, use
the Make PIN File utility.
Specifying a question as a password
For NetCollect and DirectCollect surveys, you can quickly add a password
using the Document Properties dialog. On the Welcome tab there’s a
checkbox for “Enable Password,” which allows you to select an existing
question or add a new one.
Chapter 6 - Questionnaires
January 15, 2007
Passwords
87
Apian SurveyPro 4.0 User Guide
Then when you Publish the document, you specify the type of password
check (single, multiple, unique) you’d like to use.
Screening and cleaning
Data cleaning tools exist both in the Import dialog and in the Data Cleaning dialog under the Answer Entry Tools menu. If the survey was published with password settings, they will be pre-set in the cleaning dialog.
Or, if no password has been set (or you need to change it), you can do so
at this time.
Paper survey password screens are performed both at import and in the
Data Cleaning dialog.
Make PIN File Dialog
As passwords are most frequently used in Web surveys, configuring logins
and creating PIN password files are covered in the NetCollect User Guide
and Help system.
Alternative access restrictions
Depending on your project’s media, respondent base, etc., you may find
an alternative access restriction method more effective than a SurveyPro
password.
LAN or Web security
Use your existing server security to restrict access to NetCollect or
DirectCollect projects. This can work particularly well on Intranets where
extensive user-based security is already in place.
Must Answer Pattern Scale
Add a question to the survey which uses a pattern scale, such as a the one
used by your customer IDs, and set it as a Must Answer question. This is
similar to checking against a password file, but can be used when you
don’t have access to the values.
Cookies (Web only)
This is the loosest way to restrict access, and should only be used in narrow circumstances. Cookies place a small file on the server which says
something like “respondent completed survey.” This is a browser-specific
setting, so if a computer is shared it will block additional respondents. At
the same time, cookies can also be refused or deleted by the respondent,
so in spite of the block they may return many times.
Chapter 6 - Questionnaires
January 15, 2007
Passwords
88
Apian SurveyPro 4.0 User Guide
Publishing Questionnaires
Publish is the point at which a document leaves SurveyPro’s design environment and becomes accessible to a wider audience. Settings in the
Document menu’s Publish dialogs are highly medium-specific to accommodate features as diverse as Web server script locations and interviewer
start-up screens.
Text to Clipboard/File
Send the contents of the entire questionnaire to the clipboard or a text
document for use in another application. This does not include any of the
formatting, so if you’re interested in a mechanism for electronically distributing copies of a paper survey we recommend using the Adobe Acrobat PDF format.
DirectCollect Template
Creates the survey template file which will be used with the DirectCollect
run-time application. Some of the settings made at this point are the distribution method (e-mail, kiosk, telephone interviewer), and answer tests
with your custom error messages. See the DirectCollect User Guide for
details.
KeyCollect Template
KeyCollect Publish is the simplest because it’s creating a mirror of the
SurveyPro Answer Entry screen—all you do is specify a filename. See the
next section.
NetCollect File Set
Generates a set of HTML files for the questionnaire, as well as the configuration file used to drive the scripts. See the NetCollect User Guide for
details, including a tutorial.
KeyCollect Publish Dialog
This dialog specifies the location of the SDT (survey data template) which
will be used by the KeyCollect user to create a SDE (survey data entry)
file.
The template contains information for all questionnaire versions, including the question structures, skips, and other enforcements you may have
configured.
Note: After you publish, your questionnaires will be “locked” to prevent
changes which would create import problems. Use the Edit Menu, Lock
Changes item to unlock.
Chapter 6 - Questionnaires
January 15, 2007
Publishing Questionnaires
89
Apian SurveyPro 4.0 User Guide
Publish Logs
Publish logs are most useful for NetCollect surveys, where they specify
the filenames, paths, and other settings on your server. See the NetCollect
User Guide.
In other cases, the logs are a useful reference for when a document was
last published and to which format.
Publish logs are accessed through the Tools menu, File History dialog.
Chapter 6 - Questionnaires
January 15, 2007
Publishing Questionnaires
90
Chapter 7
Creating a Questionnaire
TUTORIAL
This first lesson walks you through the core questionnaire design features
in the creation of a one-page survey.
In this tutorial you’ll learn how to:
Set up a title and footer in Document Properties
Place a logo on the page
Add questions
Insert a basic question grid
Create scales
Add text comments, headings, etc.
Format text
In addition to this tutorial, there’s a lesson about building more complex
question grids on page 102. The NetCollect and DirectCollect guides also
cover questionnaire features for the Web and screen, but assume you’re
familiar with the fundamentals of questions and scales covered in this lesson.
Tutorial Notes
General
You can save your file and take a break any time you’re in the
main document screen.
Tutorial Files
Are in your SurveyPro Samples folder, by default under:
C:\Program Files\Apian Software\SurveyPro 40\
Hotel Ombreux, an older hotel which currently serves tourists, is attempting to upgrade its image, facilities, and services to attract business and
luxury travelers. Based on past comments, they know that room service
has problems, so they’re beginning their surveying with that department.
Note, while this tutorial works with a paper form, what you learn will
translate to your Web and screen based surveys.
Chapter 7 - Creating a Questionnaire
January 15, 2007
91
Apian SurveyPro 4.0 User Guide
When you have completed the lesson, your survey should look like this
example.
1. Start SurveyPro, log in, and if the window isn’t filling the screen, maximize it.
2. Save your file as YourName Questionnaire Tutorial.SP4.
The screen should be showing an empty new questionnaire, with additional tabs at the bottom for the Executive Summary, Data Table and Custom reports. At the left you may see a tree containing all the information
about the current project, so right now it’s empty except for the preloaded scales and text styles under Components.
Chapter 7 - Creating a Questionnaire
January 15, 2007
92
Apian SurveyPro 4.0 User Guide
Editing Document Properties
Let’s quickly add a title and footer through the Document Properties dialog:
1. Click the Document Properties toolbar button
menu, Properties.
or go to the Document
2. Let’s change the name from “Questionnaire” to something more descriptive—
in the first field on the General tab, type Room Service Survey.
We want this to be a small form, so we’re going to convince a letter size
piece of paper it’s smaller. When it goes to the printer, they will trim it
down to size, 8.5” x 5.5”
3. Change the page setup dimensions to:
Top 0.75
Left 0.5
Right 3.5
Bottom 3.5
4. At the top of the dialog, click the Title tab and turn on Place Title on Page 1.
There’s nothing on this tab which cannot be done manually with in-line
graphics tiles, but Document Properties is usually the fastest approach.
Titles created in this manner must be edited in the Document Properties
dialog, unless you click the “Convert” option at the bottom which will
allow free-form editing.
5. Type the title Room Service Survey and for Place Title To select Right.
6. Click the Footer tab, and change it to Select from Standards. Take a quick
look through the options which are pre-loaded (all three lists are identical).
7. For this project a different footer makes more sense, so change the setting to
Custom.
The type-in boxes may include text with some words formatted in a strike
through. This indicates a variable, which is inserted using the Text Palette
floating on top of the Document Properties dialog. Just place your insertion point where you want the variable, click the button
to drop down
a list of numbering and other options, and select the variable you want.
Because this is a single page survey, we actually want some simple, static
text in the footer.
8. Clear any existing text, and type in the Centered section:
Seattle, Washington
Chapter 7 - Creating a Questionnaire
January 15, 2007
93
Apian SurveyPro 4.0 User Guide
9. In the lower-left, change the Footer distance above page bottom to 3. Click
OK.
Note that SurveyPro will update the left/center/right alignments if you
later change the page margins.
Adding page graphics
Now let’s add a logo to the top of the page.
1. Click on the Page Tile mode
2. Click the Insert button
in the toolbar.
, select Page Text/Graphic.
3. At the top of the dialog, change the tile type to Picture.
4. Click the File button for the source, and from the SurveyPro Samples folder
select HotelOmbreux.JPG.
The logo is a little large, so let’s scale it down a little.
5. In the lower-right corner, change both scaling dimensions from 100 to 40.
The setting just above, on percent by default, can be used to change the
scaling method.
6. The next tab is dimension settings for the tile, which we don’t really need
here, so click Finish.
7. The Hotel Ombreux logo should be in the center of the screen with an orange
outline (if it isn’t outlined, click to select it). Move your mouse over the small
box in the upper-left corner until it turns into a hand.
Chapter 7 - Creating a Questionnaire
January 15, 2007
94
Apian SurveyPro 4.0 User Guide
8. Click and drag until the logo is in the upper-left corner of the page, similar to
the image below:
We could have placed the logo in the Document Properties dialog like we
did the title, or as an inline graphic, but it wouldn’t have let us place the
image outside the margins.
Inserting a rating grid
1. Click on the Inline Tile mode
2. Insert
so we can add questions.
a Grid of Questions.
3. In the first tab, give it the Report Label Room Service Ratings.
4. Change the layout style to Alternating tinted bands and Click Next.
5. Click at the top of the dialog, in the white box next to Row 1. Type the
following questions with Enter after each item:
Menu Selection
Hours
Delivery Time
Waiter’s Manner
Meal Presentation
Food Quality
6. Just below, in the Scale drop-down list, select S9: Excellence -- 4 levels. Click
Finish.
Chapter 7 - Creating a Questionnaire
January 15, 2007
95
Apian SurveyPro 4.0 User Guide
That was relatively painless, wasn’t it? Of course there’s a great deal more
to grids, which is why Building Complex Question Grids on page 102 delves
into all their details.
Adding a comment question
1. Click Insert
again, this time for a Question.
2. The big box at the top is for the question text, in this case just type
Comments?
Note that as you typed, the Label for Report Figures below the question
text followed along. SurveyPro copies the first 200 characters of your
question text (which can be up to 2,000 characters) into this field for use
in the object tree, drop-down lists, and figures. In general, shorter labels
are much more useful.
3. Click Next.
4. As with the grid, we’re going to select a scale—choose 3: Non-repeating or
Long Memo Written Answer from the list in the upper-left.
While it may be confusing when you start out, when you get to analysis
you’ll be glad SurveyPro doesn’t treat all written answers alike. For details
on scale applications, see Selecting Scales on page 69. When you selected
the scale, a brief explanation also appeared below the scale. Your layout
settings also appeared, and we’ll set those now:
5. On the right hand side, change the Entry Lines to 4. Click Finish.
Creating a custom answer scale
So far, we’ve only selected scales which were pre-loaded in SurveyPro.
However, often you’ll need something unique.
1. Insert
another question, giving it the text:
Are there any services you would like to see enhanced?
and Report label Service Enhancements.
2. Click Next.
3. SurveyPro has remembered your scale setting from the previous question, but
in this case we need a new scale. In the upper-left, above the Non-repeating
or Long Memo scale showing in the list, click the Insert button .
The dialog picked up your question’s report label as a name, so we can
leave that as-is. Next to the name, at the upper-right, are the six types of
custom scales SurveyPro creates (see page 72). This setting drives the
controls for the remainder of the dialog, so it should be the first item set in
Chapter 7 - Creating a Questionnaire
January 15, 2007
96
Apian SurveyPro 4.0 User Guide
creating a new scale. New scales always default to Checkbox as that’s the
most common custom scale.
4. On the left hand side, change the Answers setting from Single to Multiple.
5. Turn on Add Other Blank just below, which will add both a checkbox labeled
Other (or your override from Document Properties) and a text field to collect
the responses.
6. On the right hand side, click in the white box next to row 1, just like we did
with grids.
7. Type the following labels, with Enter after each one:
Hours
Food selection
Night before breakfast ordering
Beverage selection
As you typed in the grid, the text was mirrored in the larger box below.
This box is convenient when you have long labels (text can be up to 200
characters), and is also used for overriding the formatting with bold, italic,
etc.
It would probably make more sense to have the second and fourth items
next to each other, so let’s rearrange them:
8. Click once on the gray number 3 next to the breakfast item to select it.
9. Click on the number 3 again, but hold and drag the item upward until you see
a red line between items 1 and 2, then release.
10. Click OK, and click Finish to close the Question dialog.
When you have responses in your database, it’s critical that you rearrange
scale items in this manner so SurveyPro can track which data goes with
which item. If instead we had manually swapped label text for the items,
or added a new item where we wanted to move the breakfast question
and deleted the old one, data would have been lost. Of course this project
has no data yet, so maintaining its integrity isn’t an issue, but it’s good to
get into the habit. The same principles apply to rearranging question tiles
(see page 39).
Adding instructions and editing Text Styles
1. Click Insert
, this time for an Inline Text/Graphic.
2. Type Optional information: in the text box.
Chapter 7 - Creating a Questionnaire
January 15, 2007
97
Apian SurveyPro 4.0 User Guide
The current Text Style is too close to questions and scales, but changing it
to italic would set it apart. We could override the formatting using the
Text Palette which appeared when you started typing, but there are going
to be two other text graphics in this survey so we might as well change
the Text Style.
3. In the lower-right corner, next to the Text Style drop-down list, click Modify
.
4. Reduce the Height to 11 points, and turn on Italic. The preview box should
reflect the changes.
5. Click OK, and click OK again to close the graphic dialog.
Asking a name
Just two more quick questions and a little copy/paste to go!
1. Insert
a Question with text Name:
2. Click Next, and again select scale 3, Non-repeating Written (although
responses will be short, we won’t be tabulating them).
3. On the right-hand side, change the Place Scale setting To right of question.
4. Click Finish.
5. Insert
a second Question with text Check #:
6. Click Next, then Finish.
While the hotel is planning on using different paper colors to identify
feedback for the different meals, if the customer provides the check # they
will be able to pull in details about that order’s staff, selection, and time—
as well as the customer’s other orders and feedback. Importing Data on
page 172 uses this scenario to demonstrate an import merge.
Copying and pasting tiles
Now let’s quickly add a few more headings by copying the one we already
created.
1. Click once on the “Optional information:” text graphic in your survey to
select it.
2. Copy the tile, either through the toolbar button
Ctrl+c, or right-click menu.
, keyboard shortcut
3. Click on the blue bar at the end of the survey and paste using the toolbar
Ctrl+v, or right-click menu.
Chapter 7 - Creating a Questionnaire
January 15, 2007
,
98
Apian SurveyPro 4.0 User Guide
4. Click on the grid (with the blue shading), and paste
again.
5. Double-click on the copy you placed above the grid to open its editing
dialog.
6. Highlight the text, and change it to:
Please take a few moments to let us know about your
experience.
Survey envelopes may be left on the room service tray or
placed in the box at the Concierge desk.
7. Click OK.
8. Double-click on the copy of the text graphic you placed at the end of the
survey.
9. Highlight the text, and change it text to
Thank you for your time!
10. And let’s add a little emphasis, so highlight the text you just typed and click
the Bold button in the Text Palette floating to the side of the main dialog.
11. Click the Tile tab at the top of the dialog.
12. In the upper-right corner, change Gap at Top to 0.25 to separate it a little
more from the previous question. Click OK.
You can also adjust the gap by dragging the bottom of a tile down (see
page 39), but if you’re adjusting the space for multiple tiles this gives you a
bit more precision.
Well, that was it! Your survey should look like the one on page 92, and if it
doesn’t you may want to open the sample file Questionnaire Tutorial
End.SP4 to compare your file.
From here, you could continue with Building Complex Question Grids on
page 102, or skip ahead to Working in Answer Entry on page 132 to start
working with the database.
Chapter 7 - Creating a Questionnaire
January 15, 2007
99
Apian SurveyPro 4.0 User Guide
Chapter 7 - Creating a Questionnaire
January 15, 2007
100
Apian SurveyPro 4.0 User Guide
Chapter 7 - Creating a Questionnaire
January 15, 2007
101
Chapter 8
Building Complex Question Grids
TUTORIAL
Question grids are sets of related questions which are analyzed together.
Creating a Questionnaire on page 91 inserted a basic grid, but this lesson
plays with the more advanced settings.
In this tutorial you’ll learn how to:
Use the one-screen setup dialog
Customize layouts and headings using the advanced dialog settings
Create a table of write-in boxes
Tutorial Notes
General
You can save your file and take a break any time you’re in the
main document screen.
Tutorial Files
Are in your SurveyPro Samples folder, by default under:
C:\Program Files\Apian Software\SurveyPro 40\
Note: While this lesson is designed for a paper form, the concepts are fully
applicable to NetCollect and DirectCollect surveys. For screen-based surveys you will often need to use more compact layouts than paper, though.
1. Start SurveyPro, log in, and if the window isn’t filling the screen, maximize it.
2. Save your file as YourName Grid Tutorial.SP4.
Inserting a rating grid
1. Insert
, Grid of Questions.
2. In the Label field, type Evaluations, and click Next.
3. At the top of the dialog, click in the white box for the first Question Row
Label.
Chapter 8 - Building Complex Question Grids
January 15, 2007
102
Apian SurveyPro 4.0 User Guide
4. Type the following questions with Enter after each item:
Knowledge
Courtesy
Efficiency
Wait time
Clarity of instructions
Availability of forms
5. For the scale, select S9: Excellence -- 4 levels, and click Finish.
Though this grid needs a little tuning, you can see how fast inserting a
basic grid can be. Even if you plan on using the advanced features to modify a grid, it’s usually fastest to rough it in using the two-screen Quick Set.
Adding a second rating column
Assuming your grid looks like this one here, let’s proceed:
1. Double-click on the grid, and click Add Column 2 in the lower-right corner.
2. Select S18: Importance -- 4 levels.
3. Add a Label for the second column
Importance to you
and a Label for the first column
Our performance today.
4. Click OK.
Well the grid just got more detailed, but it lost some clarity along the way.
Using Advanced tabs to add headings
1. Double-click on the grid again.
2. This time, click the General tab at the top of the dialog.
3. Change the upper-left setting to Advanced option screens and notice a lot
more tabs just appeared.
Chapter 8 - Building Complex Question Grids
January 15, 2007
103
Apian SurveyPro 4.0 User Guide
4. Change the Style to Alternating tinted bands.
5. Click the Rows tab at the top and notice that the questions we typed are all
present.
Unfortunately the rows are somewhat mixed, so a couple subheads will
clarify the questions for respondents.
6. Click on Row 2, Knowledge (row 1 is the column labels or “C-Lbls” for the
scale), and click the Insert button at the upper-right.
7. Change the radio button setting for this new row 2 to Hdg for an unscaled
heading.
8. Type as the label:
Please rate the staff member(s) who assisted you:
and note that as you type in the row, the text is mirrored in the larger editing
box below.
9. In the larger editing box, highlight all the text you just typed.
10. Click the Italic button
in the Text Palette.
11. Now for the second heading, click on row 6, Wait time
12. Click the insert button
at the upper-right.
13. Change the new row 6 to a Hdg, and type:
And please rate this branch:
14. Again, highlight the text and click italic
Chapter 8 - Building Complex Question Grids
January 15, 2007
in the Text Palette.
104
Apian SurveyPro 4.0 User Guide
Streamlining the scale columns
Another problem with the original layout was the clutter of all the scale
and column labels, so the next step is changing their format.
1. Click the Columns tab at the top.
As in the Rows tab, you have a set of columns for the grid: one containing
Row labels (questions), and two scale columns. The column labels are
probably fine if we simplify the scales.
2. Click on the scale for row 2: Excellence -- 4 levels.
3. In the new area that appeared at the lower left, select scale 12: 1 Low to 5
High Rating.
4. Repeat for the Importance column’s scale.
5. Click OK to see the revised version.
That’s a little too tight, so let’s play a little more with the scale layouts.
6. Double-click on the grid again, and click on the Answer Entries tab.
The settings in this tab are driven by the column selection at the upper
left, since each scale column could potentially have a different layout.
7. Select Sc: Our performance today from the column list at the upper-left.
8. On the right-hand side, change the Label Style to Vertical Labels Above.
9. Select the second column, Sc: Importance to you.
10. Change its Label Style to 45-degree labels Above.
11. Click OK.
Chapter 8 - Building Complex Question Grids
January 15, 2007
105
Apian SurveyPro 4.0 User Guide
It’s not a combination you’re likely to use for a real survey, but this gives
you a look at another feature for this style of grid. Both these styles appear
for paper documents, but will be missing from the dialogs for Web surveys
since HTML doesn’t support rotated text.
Creating a grid of number entries
The other type of grid is sometimes referred to as a table, and consists of
write-in fields for numbers, text, dates and other scales.
1. Insert
a new Grid.
2. Switch the dialog mode to Advanced options screens—you won’t see the tabs
change because it’s in wizard mode.
3. Name the grid Employee time breakdowns. Click Next.
4. At the top of the Rows screen, click in the white box for row 2, the first
question.
5. Type the following questions with Enter after each item:
Billable hours
General correspondence
Meetings
Web surfing
Filling out forms
Other (please specify below)
6. Click Next.
7. We want a column for every work day, so type labels for Monday through
Friday.
Chapter 8 - Building Complex Question Grids
January 15, 2007
106
Apian SurveyPro 4.0 User Guide
8. Click in the cell next to Monday which currently says “<select a scale>.” From
the scale list that appears in the lower-left, select 21: Number, no fraction.
9. Repeat for the other four rows.
10. Click Next.
11. We actually do want a write-in box for each of these (it’s why we left the grid
style so plain), so click Finish.
Setting column widths
The grid is sizing the entry blanks based on the column labels, which are
different lengths, so let’s make that more consistent. However, if we make
them all as wide as Wednesday, the grid won’t fit on the page so let’s
adjust the label size as well.
1. Double-click on the grid to reopen the editing dialog.
2. Click on the Columns tab.
Chapter 8 - Building Complex Question Grids
January 15, 2007
107
Apian SurveyPro 4.0 User Guide
3. In the lower-left, where it says Column Label Text Style, click the Insert
button next to its drop-down list.
4. Give the style the Name Scale size 9.
5. Reduce the Height point size to 9 and click OK.
6. Now on to the entry blank, so click on the Layout tab.
On the right-hand side is a list of all the columns with an “auto” next to
them for their width.
7. Leaving the first item Row Lbls on “auto,” change the settings for Monday
through Friday to 0.75.
8. At the top of the dialog, change the Border Space Width to 0.05 and click OK.
On a Web survey, you can set the grid to a forced sum for each column.
The option appears on the Answer Entries tab.
Adding a blank for Other responses
The layout is much improved, but since the grid requests the respondents
specify their Other response, we need to add one before we’re done:
1. Click the grid below the table we just finished, and Insert
a new Question.
2. Leave the question text blank, but give it the report label
Time breakdown Other text
3. Click Next.
4. For the Scale, choose 2: Short Countable Written -- Multiple answers.
5. Set the Entry Style on the right side to Write-in box.
6. Click Next twice to get to the Dimensions screen.
Chapter 8 - Building Complex Question Grids
January 15, 2007
108
Apian SurveyPro 4.0 User Guide
7. Make three adjustments:
Question Text: Down from Top = 0
Scale Entry: Entry Width = 2
Scale Entry: Below Question = 0.1
8. Click Finish to see the entry blank below the Other rating item.
Those are the essentials of creating complex grids. For the remaining controls which were not covered here, simply press the Help button when
you’re in the grid dialog.
In the SurveyPro Samples folder you’ll find a file called
Grid Tutorial End.SP4 with the finished tiles.
Chapter 8 - Building Complex Question Grids
January 15, 2007
109
REFERENCE
Chapter Contents:
Chapter 9 - SurveyPro’s Database
January 15, 2007
Chapter 9
SurveyPro’s Database
Working with the Database . . . . . . . . . . . . . . . . . . . . . . . . . 111
Database Fundamentals . . . . . . . . . . . . . . . . . . . . . . . . . . . 111
Answer Entry Screen . . . . . . . . . . . . . . . . . . . . . . . . . . . . . . . 112
Answer Entry Menus . . . . . . . . . . . . . . . . . . . . . . . . . . . . . . . 113
File Menu . . . . . . . . . . . . . . . . . . . . . . . . . . . . . . . . . . . 114
Edit Menu . . . . . . . . . . . . . . . . . . . . . . . . . . . . . . . . . . . 114
View Menu . . . . . . . . . . . . . . . . . . . . . . . . . . . . . . . . . . . 115
Form Menu . . . . . . . . . . . . . . . . . . . . . . . . . . . . . . . . . . 115
Database Menu . . . . . . . . . . . . . . . . . . . . . . . . . . . . . . . 116
Tools Menu . . . . . . . . . . . . . . . . . . . . . . . . . . . . . . . . . . 116
Protect Answers . . . . . . . . . . . . . . . . . . . . . . . . . . . . . . . . . . 118
Print with Data . . . . . . . . . . . . . . . . . . . . . . . . . . . . . . . . . . 118
Fill Passwords . . . . . . . . . . . . . . . . . . . . . . . . . . . . . . . . . . . 119
110
Apian SurveyPro 4.0 User Guide
Working with the Database
Working with SurveyPro’s database may involve:
•
Entering forms directly into the program
•
Importing data from a Collect add-on or another source
•
Deleting individual or selected forms
•
Replacing responses in a question for selected forms
•
Correcting formatting
•
Screening for passwords
•
Removing duplicate records
•
Printing surveys with data filled in (mail merge)
•
Exporting data for use in another application
With the exception of import and export, all these functions are performed in SurveyPro’s Answer Entry mode. When you launch SurveyPro,
you’re in the main or document editing mode, an environment that is optimized for creating questionnaires and reports. Answer Entry is optimized
for adding new forms, searching for forms based on a variety of criteria,
and changing responses.
The Answer Entry screen is broken down into two main sections: the
questionnaire and the data entry controls. Each survey entered or
imported is represented as a filled in questionnaire in the database—just
as it appears in the design screen. On the left hand side, there are a typein box where you enter responses, and a reference list of acceptable
answers or existing data (depending on the question type).
Database Fundamentals
If you're new to databases, here are some concepts and terms which will
help you understand SurveyPro.
Form = Record =
Respondent
In your SurveyPro file, each respondent (unless they've answered several
times) is represented by one form in the database. That respondent's form
includes all the information they've submitted.
Field = Question
When you're designing your survey, each question you add creates a field
in the database. This field definition includes information on the values it
can accept, such as numeric, date, written, or multiple answer checkbox.
Chapter 9 - SurveyPro’s Database
January 15, 2007
Working with the Database
111
Apian SurveyPro 4.0 User Guide
In some cases, a single question tile will actually add several fields, such
as with grids, or checkbox scales with Other blanks.
Database vs. Data File
These two terms crop up when you get into import and export, and unfortunately the lines are somewhat blurry. In that context, a data file (such as
delimited ASCII) consists of the respondents' answers. A database will
include the respondents' answers as well as definitions of the fields
(numeric, text, etc.).
Form ID
Each form in your SurveyPro database includes a Form ID such as 9c4603cm-1fc. This ID is created when each response is completed when
using NetCollect, DirectCollect, KeyCollect, or SurveyPro's data entry
screen. If you are importing files from another source, the ID will be generated on import. The IDs are designed to be unique, combining the date
and time of the submission with other variables for almost no chance of
duplication.
Answer Entry Screen
Go to Answer Entry from the Database menu or toolbar
to:
•
Add new forms (see page 121)
•
Navigate to forms based on form number, an answer, or a filter
•
Edit or delete forms individually or in batches (see page 123)
•
Print forms with data for a mail merge or to view individual responses
(see page 118)
About the only data manipulations you can't do in Answer Entry are
import/export (see page 141) or change field structures (scale definition).
The Answer Entry screen includes several elements:
Menus
Specialized for database management. See page 113.
Data Entry Panel
The left-hand panel contains a type-in box for entering responses, and the
Answer List which contains answer options for pre-set scales, or previous
responses for written answers.
Questionnaire Image
The main area of the screen is an image of the questionnaire, with the current question highlighted in orange.
Navigation Palettes
When navigating the database, you can opt to find questions matching
certain criteria, and SurveyPro will pop up one of these palettes for quick
jumps. See Data Cleaning on page 123.
Chapter 9 - SurveyPro’s Database
January 15, 2007
Answer Entry Screen
112
Apian SurveyPro 4.0 User Guide
Form Information
In addition to the questions you create, each form has several other
attributes such as the source and internal unique ID.
Note: When you first go to Answer Entry, you may be prompted by these
dialog boxes:
Automatic Save
To properly protect your data, SurveyPro needs to be able to save frequently to the file. If you're just experimenting, click No and then Save As
to a new filename before going into Answer Entry.
Questionnaire for New
Forms
If your project contains multiple questionnaire versions, such as paper
and HTML, you'll be asked which one to use for entry. You can change
this at any time via the Edit menu, and can scroll through forms using
other questionnaire versions.
Answer Entry Menus
SurveyPro uses two slightly different sets of menus depending on whether
you're entering/editing forms or working with documents. See also Document Editing Menus on page 16.
Chapter 9 - SurveyPro’s Database
January 15, 2007
Answer Entry Menus
113
Apian SurveyPro 4.0 User Guide
File Menu
Common Windows file functions, such as print, save, and most recent
files.
Save
Ctrl+S Saves the current file.
Print with Data
Ctrl+P Allows you to print the forms filled in with all or some of the data. This is useful
for “mail merges” of address information or ID barcodes, or for looking at
individual responses in the context of the survey. See page 118.
Print Setup
Windows dialog for selecting your printer and setting options. This is also where
you set the paper page size.
Quit Answer Entry
Ctrl+F4 Returns you to the document editing screens.
Exit SurveyPro
Alt+F4 Closes the current file (prompting to save changes), and exits SurveyPro.
Edit Menu
Cut, copy, paste, and other functions.
Cut
Copy
Paste
Delete
Ctrl+X Standard Windows functions for cutting, copying, pasting, or deleting the
Ctrl+C selected text. This can be used to copy and paste text between SurveyPro and
Ctrl+V other applications, as well as within or between SurveyPro projects.
Del
Clear Answer
Ctrl+
Del
Copy Last Form's
Answer
F7
Copy Last Form
Clears the current answer.
Copies either the answer from the same question in the previous form, or the
entire contents of the last form—in either case, overwriting the current answers.
If you are doing this frequently to copy session or batched answers, you can also
Ctrl+F7 use the View menu's Preload Answers to add answers in each new form.
Protect Answers
Prevents accidental changes to forms in the database. See page 118.
New Form
Questionnaire
In a multiple questionnaire project, changes the document used for adding
forms to the database. See page 131.
Chapter 9 - SurveyPro’s Database
January 15, 2007
Answer Entry Menus
114
Apian SurveyPro 4.0 User Guide
View Menu
Preferences for which screen elements to display and how.
Zoom
Adjusts the display size of the document.
Preload Answers
Preloads some of the answers in new forms for batch entry of responses. When
you switch to the Preload mode the screen looks normal except that the form
number will say “PRELOAD.” Enter whichever answers you want to preset (during
entry answers can be changed for exceptions). Select the Forms, Preload menu
item again to switch back to normal entry. See also the Edit menu's Copy Last
Form's Answer and Copy Last Form.
Form Menu
Navigate among forms.
Next Form
F10
Last Form
F9
Find Form
Select
Find Same
Answers
Find
Duplicates
Step forward and back through the forms. When you reach the last form, F10 will
add a new one.
A set of tools for navigating and cleaning the forms and the database. Each one
pops up a small palette which lists forms matching a Form Select, the response
of the current question, or is a duplicate. Within the palettes, click on a form
number to jump to that record, or Refresh to update the list when you make
changes to your criteria or the data. See also Data Cleaning on page 123.
Delete Form
Ctrl+
F11
Void Form
Ctrl+
F12
With Delete, the form is completely removes, which renumbers the forms after it
in the database. Void leaves a placeholder to maintain form numbering, but
also eliminates the form's data. See also Mass Delete on page 128.
Chapter 9 - SurveyPro’s Database
January 15, 2007
Answer Entry Menus
115
Apian SurveyPro 4.0 User Guide
Database Menu
Functions for changing many forms at once.
Mass Delete
Deletes forms matching a Form Select, within a range of form numbers, or for
the entire database. See page 128.
Mass Replace
Replaces the response to a question based on a Form Select, within a range of
form numbers, or for the entire database. See page 129.
Answer Replace
Replaces one particular answer to a question with another—a quick way to
consistently code short written answers. See page 130.
Fill Passwords
Seeds forms in the database with a password value, for use with mail merges or
other notifications. See page 119.
Tools Menu
Utilities and preferences.
Spell Check
F7
Checks spelling for responses in the current question, form or the entire
database. See page 23.
Spelling Options
Allows you to control what the spell checker should ignore, edit your custom
dictionary, and activate the legal and medical supplements.
Refresh Answer
Lists
Forces an update of the Answer list in the left panel. To speed performance,
SurveyPro updates this list with new entries instantly, but only removes
deletions on Refresh or Save.
Data Cleaning
Similar to the import cleaning screen, this allows you to clean the contents of
your database, checking for required fields and pattern matches. See page 126.
File History
Displays the current status of your file as well as publish, import, and export
activity through its history. See page 25.
Make PIN File
Creates a SurveyPro compatible PIN file for password or field checking. Could be
generated by SurveyPro or a conversion of an ASCII file. See page 88.
Options
Preferences for both the current file and for your system. See page 26.
Chapter 9 - SurveyPro’s Database
January 15, 2007
Answer Entry Menus
116
Apian SurveyPro 4.0 User Guide
Data Collection Options
There's now a wide (and sometimes dizzying) array of data collection
options for surveying. What are the best choices given the respondent
base, survey content, time frame and budget?
A basic run-down of your alternatives is:
Collection Technique
Requires
Keyed data entry
SurveyPro, or KeyCollect for more economical
multi-user entry (see page 10)
Web or Intranet
NetCollect document (see page 9)
E-mail, phone, disk,
kiosk, LAN
DirectCollect document (see page 9)
Scanning
Third-party scanning software compatible with
SurveyPro's forms
Enterprise databases or
other sources
SurveyPro
Note that a single project can be administered via a scanned paper form,
the Web, a kiosk, and any other combination you need. The advantage of
the Collect programs is their tight integration with SurveyPro, which
allows you to use sophisticated functions for Web surveys without coding,
and streamlines data import. However, SurveyPro's import filters (see
page 144) can handle just about any file type, so you can use many thirdparty data collection tools for specialized applications.
Chapter 9 - SurveyPro’s Database
January 15, 2007
Data Collection Options
117
Apian SurveyPro 4.0 User Guide
Protect Answers
Accessed from the Edit menu in Answer Entry.
Use this dialog to protect responses from accidental change. If you're
interested in restricting access to editing, use the administrative passwords in the Options dialog (see page 26).
Forms already verified
Verification is a KeyCollect option where two different clerks enter forms
to confirm accuracy, so this may not apply to your project.
Prior sessions’ forms
Sessions start with the launching of SurveyPro, and end when you exit.
Other people’s forms
SurveyPro prompts you for an ID when you launch a Workgroup license
or go to Answer Entry for a Personal License. This ID is embedded in
forms which are entered directly into SurveyPro or with KeyCollect.
Warn before saving changes Pops up a confirmation warning when you leave a form which has been
changed.
Print with Data
Accessed from the File menu in Answer Entry.
Print with Data allows you to merge database information into a questionnaire form. For example, you may want to do a mail merge where you
place respondent names and addresses on the questionnaire, or to merge
an ID into a barcode for scannable forms. Another application is printing
respondents' answers in the context of the questionnaire (see also the
Data Table Figure on page 204).
The primary control in the dialog is your ability to select a range of
forms—see Form Select Filters on page 212 for details on their construction.
Chapter 9 - SurveyPro’s Database
January 15, 2007
Protect Answers
118
Apian SurveyPro 4.0 User Guide
Fill Passwords
Accessed from the Database menu in Answer Entry.
This is a great little utility for seeding a database with passwords. Just
import your respondent contact information, adding a couple extras just
in case. Make sure you have a question with a SurveyPro 4, 5, or all number PIN scale. Then go to Answer Entry, Database Menu, and click Fill
Passwords. SurveyPro will add passwords to any forms which don't
already have them, checking to make sure the values are unique.
Chapter 9 - SurveyPro’s Database
January 15, 2007
Fill Passwords
119
Chapter 10
Entering and Editing Data
REFERENCE
Chapter Contents:
Data Entry in SurveyPro . . . . . . . . . . . . . . . . . . . . . . . . . . . . 121
Entering data by scale type . . . . . . . . . . . . . . . . . . . . . . 122
Data Cleaning . . . . . . . . . . . . . . . . . . . . . . . . . . . . . . . . . . . 123
Postcoding . . . . . . . . . . . . . . . . . . . . . . . . . . . . . . . . . . 125
Data Cleaning Dialog . . . . . . . . . . . . . . . . . . . . . . . . . . . . . . 126
Mass Delete . . . . . . . . . . . . . . . . . . . . . . . . . . . . . . . . . . . . . 128
Mass Replace . . . . . . . . . . . . . . . . . . . . . . . . . . . . . . . . . . . . 129
Answer Replace . . . . . . . . . . . . . . . . . . . . . . . . . . . . . . . . . . 130
Questionnaire for New Forms . . . . . . . . . . . . . . . . . . . . . . . . 131
Chapter 10 - Entering and Editing Data
January 15, 2007
120
Apian SurveyPro 4.0 User Guide
Data Entry in SurveyPro
Data entry has been optimized for both the mouse and keyboard, including features such as single keystroke entry for shorter checkbox and rating
scales. The Answer Entry screen is automatically created from the questionnaire definition(s), and accessed from document editing through the
Answer Entry toolbar button
or Database, Answer Entry.
Entry and editing are primarily handled in the left-hand side of the screen:
The panel is driven by the question selected in the current form (as indicated by an orange highlight on the right side of the screen), so any current response is highlighted in the list and may be edited in the type-in
box.
Moving from field to field
To move the highlight from question to question, you can use the mouse,
Tab/Shift+Tab, or Enter keys. The only time Enter does not work is when
you are editing a long written answer.
Moving from form to form
At the top of the left panel is the current form’s number and two buttons
for stepping back and forward one form at a time. F9 and F10 move back
and forward through forms as well. Below the buttons is a field for typing
in a form number for a direct jump. In addition to these basics, there are a
number of “Find” functions under the Form menu.
Tools, Options dialog
The first tab of the Options dialog includes two settings to streamline data
entry. The first, Do not require Enter key on single-digits, means that
Chapter 10 - Entering and Editing Data
January 15, 2007
Data Entry in SurveyPro
121
Apian SurveyPro 4.0 User Guide
when a checkbox or rating has less than 10 items, one numeric keystroke
will mark the response and drop you to the next question. The second, Go
to next form after last question answered eliminates the need for clicking
next
or pressing F10.
Pre-loading answers
Under the View menu is a Preload option which lets you set the initial values in a new form. When you select Preload, the form number in the
upper left changes to indicate you’re entering initial values. When you’re
finished, select View, Preload again to resume normal entry. This is primarily used for batch entry or session information, where a number of
forms share common answers, but is easy enough to change that it can be
practical for even small batches.
Copying answers from other The Edit menu includes two commands for copying responses from the
previous form. Copy and paste can also be used to paste text into the
forms
entry box.
Spell check
Spell checking may be applied to written answers in a single response, a
form, or the entire database.
Entering data by scale type
Depending on the current question’s scale, you will need to enter the
answer in a particular format. Just above the type-in box is a prompt line
which will remind you of the scale type.
Single answer checkboxes,
Ratings and Rankings
Type the number of the response or double-click on an answer in the list.
You don’t need to enter the complete label.
Multiple answer checkboxes Type one or more numbers to indicate the box or boxes checked. As each
checkbox number is entered, a highlight will appear in the Answers list.
Numbers may be separated by spaces, commas, periods, plus +, minus -,
or slash / keys. For mouse entry, click on the first answer you’re marking,
then Shift+click for sequential entries or Ctrl+click to turn on and off nonsequential items.
Number scales
Enter the number value without any “$,” “%” or other symbols. The
Answers list will also display existing responses which you can click to
select.
Dates and times
Check the prompt line above the type-in box for the scale’s preferred format. SurveyPro will accept any unambiguous response in the same
month/day/year or hour/minute/second order as the scale structure.
Patterns
The underlying structure of a pattern is one of the three Written Answer
formats (short, short multiple, long unique). SurveyPro’s strictness on the
entry (allowing spaces, etc.) depends on the definition of the pattern.
Chapter 10 - Entering and Editing Data
January 15, 2007
Data Entry in SurveyPro
122
Apian SurveyPro 4.0 User Guide
Short, countable written
answers
Type in the response, up to 200 characters (the prompt line will let you
know how much space you’ve used). If it is a multiple answer scale, use a
semicolon “;” to separate distinct responses such as “cat; dog.” The
Answer list will display up to 64,000 unique responses, which you can
select by clicking. Short countable written answers are always one line, so
Enter will drop you to the next field.
Long/unique written
answers
Long/unique answers may be up to 10,000 characters, and as with short
written answers the prompt line will keep track of your capacity. Normally
long written answers allow multiple paragraphs, but they can also be set
to Single Line for shorter unique answers such as names.
Data Cleaning
So what is data cleaning, why do you need to do it, and why doesn't
SurveyPro do it automatically?
Data cleaning exists because usually we're happy if respondents complete
the survey—reading the instructions is icing on the cake.
When you receive forms with dates in the wrong format, rankings that go
“1, 2, 2, 4, 5,” or “Wash” when you're using 2 letter state abbreviations,
you’ll need to do some data cleaning. Because it is a normal part of the
survey process, SurveyPro includes a suite of tools both for minimizing
and performing data cleaning.
Questionnaire Definition
The place to start is with a well-designed survey.
Make sure your scales have the proper structure for single/multiple
answer checkboxes, date scales, etc. Questions should include clear
instructions about how you'd like respondents to answer. Make sure skips
and branching are explicit for paper forms, and properly constructed for
DirectCollect and NetCollect.
Publish
If you are conducting the survey with a DirectCollect or NetCollect form,
most potential problems can be caught while the respondent is completing the form. Do make sure the answer formatting tests are enabled in the
Publish dialog and properly tested, though. Also, while your instructions
may not need to be quite as detailed as for paper forms, you still need to
tell respondents what you want so they're not frustrated by unnecessary
error messages.
Chapter 10 - Entering and Editing Data
January 15, 2007
Data Cleaning
123
Apian SurveyPro 4.0 User Guide
Import
Every SurveyPro import has the option of cleaning the data. This includes
whether you'd like to enforce pattern scales (such as telephone numbers),
required answers, and passwords. Responses which do not match a set
format, such as a date or number scale, are brought up for manual correction. This cleaning pass is usually the fastest way to correct entries, so
even if you're in a hurry to see your results, we strongly recommend taking a couple minutes to perform the scan during import.
Answer Entry
Both SurveyPro and KeyCollect data entry screens will pick up your questionnaire structure and enforce the entry rules as new forms are entered.
For existing forms, there are several tools available:
•
Tools, Data Cleaning performs a scan similar to the one in Import. It
can also apply a password to paper survey data. See page 126.
•
Form, Find commands bring up navigation palettes which list all the
forms matching your criteria. Click on a form number to jump to it for
editing. A marker * will be placed next to forms which have been
changed. See also Form Select Filters on page 212.
•
Database, Answer Replace takes answers in one question and
replaces them with another. This is a great time saver for consistently
coding Other blank responses and short written answers. See page
130.
•
Database, Mass Replace is a super-set of the Answer Replace
function. The rule for selecting the forms whose value you want to
replace can be far more complex than in Answer Replace’s. See page
129.
•
Database, Mass Delete clears forms from the database based on a
form range, or filter, or for all forms. See page 128.
Analysis
If for some reason you want to exclude forms from your analysis, use a
Form Select Filter (see page 212). This can be done quickly for an entire
document with Report On (see page 238). Rescales (see page 216) may
also be used to group similar responses, though coding them consistently
in the database is usually a better approach.
Chapter 10 - Entering and Editing Data
January 15, 2007
Data Cleaning
124
Apian SurveyPro 4.0 User Guide
Postcoding
Postcoding is modifying a questionnaire and/or data after collection to
optimize it for analysis. Many of the common applications, such as Zip
code grouping and product name tabulations, are handled through
SurveyPro’s data cleaning (see page 123), and rescales (see page 216).
Postcoding can also be used to add questions to the survey which allow
you to enhance the respondent data. Two examples are:
Coding comments
A wonderful way to work with open-ended responses is to pair them up
with a multiple-answer short countable written scale. By adding this field
to the questionnaire after printing or publishing, you can keep the verbatims intact while encoding them about subject, attitude, or any other factor.
If you are encoding answers on several dimensions, such as product name
and attitude, you may want to add a question for each aspect. Or, if you
use a multiple answer written scale you can include several attributes in
one, such as “Negative; Products; Services.”
During analysis, you can use the short written scales in Form Select Filters (see page 212) to extract sub-groups of respondents, or even to crosstab the written answers themselves (see page 211).
Merging information
When respondents are identified with a unique customer or employee ID,
you can merge information from other sources with your survey data for
common analysis. For a customer survey, rather than asking respondents
to provide purchase history (since this type of question is hard work for
them and produces inaccurate responses), simply ask for their customer
ID. Then add questions to the survey that can receive the additional information, and merge in the information from your invoicing system using
their ID as a key (see page 151).
Chapter 10 - Entering and Editing Data
January 15, 2007
Data Cleaning
125
Apian SurveyPro 4.0 User Guide
Data Cleaning Dialog
Accessed from the Tools menu.
This dialog is very similar to the ones during import, and allows you to
manage your database after collection.
The options in the lower half of the dialog depend on the structure of the
selected question or grid, so if you don't see an option you need, check
your scale definition. Questions which don't have a screen indicated in the
first column will be ignored when you click Apply and Clean. Must
Answer is the only one which applies to all question types—the other controls are covered further down this page.
Screens column
The first column lists the “test” which will be performed on the data, such
as a password screen or pattern check for an ID.
Must Answer Question
Must answers are the only universal settings, and are absolute, so they
should generally only be used when the form is invalid without an answer.
Chapter 10 - Entering and Editing Data
January 15, 2007
Data Cleaning Dialog
126
Apian SurveyPro 4.0 User Guide
Cleaning Navigator
Once you click Apply and Clean, this navigation palette will pop up:
To jump to a matching record, just click on a form number in the list. Click
Setup to bring the main dialog back, and Refresh to update the form list
after you make edits.
Checkbox and Rating Scales
For multiple answer checkbox scales, you can specify a minimum or maximum number of boxes which can be selected:
Written Answer and Pattern Scales
For each import there can be only one password field, whether it's a single
value or file.
In addition, pattern scales can be enforced or loosened to allow data
through.
Chapter 10 - Entering and Editing Data
January 15, 2007
Data Cleaning Dialog
127
Apian SurveyPro 4.0 User Guide
Mass Delete
Accessed from the Database menu in Answer Entry.
Individual forms can be deleted one by one, but if you want to clear out a
block of forms Mass Delete is the tool to use. You'll find Mass Delete
inside Answer Entry, under the Database menu. This is a permanent
operation, so we recommend creating a backup before beginning.
For these forms
Select among these options for a range of forms or the entire database.
Remember that you can perform analysis on a subset of the data without
deleting records.
Action
Regardless of whether you choose Delete or Void, the data will be gone.
The only difference is that Void leaves a placeholder so the form numbers
after the deleted forms remain the same as before the Mass Delete.
Confirmation
When you click OK, you'll be prompted with a confirming dialog. You can
either delete the forms one-by-one, keep them, delete all at once, or cancel the operation.
Chapter 10 - Entering and Editing Data
January 15, 2007
Mass Delete
128
Apian SurveyPro 4.0 User Guide
Mass Replace
Accessed from the Database menu in Answer Entry.
Mass Replace changes the answer to a question in forms which match
your selection criteria, whether it's for the entire database or a complex
filter. However, if all you want to do is a simple replacement of one answer
for another, you can use Answer Replace on page 130. This is a permanent operation, so we recommend creating a backup before
beginning.
For these forms
The criteria you use to select the forms can be completely unrelated to
the question whose answer(s) you're replacing.
Replacing
Select a question you want to update, and the value you'd like to set. For
the answer, type it just like you would in Answer Entry, such as the box
number for a checkbox value.
Confirmation
When you click OK, you'll be prompted with a confirming dialog. You can
either update the forms one-by-one, update all at once, or cancel the
operation.
Chapter 10 - Entering and Editing Data
January 15, 2007
Mass Replace
129
Apian SurveyPro 4.0 User Guide
Answer Replace
Accessed from the Database menu in Answer Entry.
Answer Replace literally replaces one answer with another within the
same question. Mass Replace can also do this, but takes a little longer
since it's geared for more complex replacements (see page 129).
The most common application is consistently coding short written
answers for tabulation, such as replacing instances of “Wash” with “WA.”
However, it can be applied to any scale type, not just text. You can also
replace just one answer within a multiple answer checkbox or written
scale.
To replace answers, just select the question in Answer Entry mode, then
select Answer Replace from the Database menu. You'll be provided with a
list of all current responses, and can use Ctrl+Click or Shift+Click to
select multiple answers to replace. The value you use to replace can be
either from the drop-down list or click Type Answer to add a free-form
response.
After clicking OK, you'll see a confirmation dialog and then a message
indicating the number of replacements.
Q#: Name
The question whose answers you're replacing. If it's not the right question,
click Cancel, select the right field, and try again.
Select Answer(s)
List of all current responses to the question. To access Other blank text
entries, you have to select the Other blank itself, not the block of checkboxes.
Change to this answer
List of current responses from which you can select a replacement
answer. For type-in scales (written answers, dates, etc.) you can click Type
Answer to add a new response.
Chapter 10 - Entering and Editing Data
January 15, 2007
Answer Replace
130
Apian SurveyPro 4.0 User Guide
Type Answer
Toggles the drop-down list to a type-in field and back. Only appears for
written, date, number and pattern scales.
Update all Answer
Reference lists after
Updates the answer list for the current question when you finish the
replacements. Generally you will only want to disable this if you are doing
repeated replacements on the same question in a very large database.
Questionnaire for New Forms
Accessed from the Edit menu in Answer Entry.
When a project contains multiple questionnaire versions, SurveyPro
needs to know which document to use when entering new forms. This
dialog allows you to select the questionnaire for entry, and will not affect
your ability to view or edit any existing forms.
To select other survey for data entry, you can choose this option again
from the Edit menu (or exit and reenter Answer Entry).
Chapter 10 - Entering and Editing Data
January 15, 2007
Questionnaire for New Forms
131
Chapter 11
Working in Answer Entry
TUTORIAL
While not everyone needs to enter new forms, searching and editing the
database is an almost universal task.
In this tutorial you’ll learn how to:
Enter new forms in the database
Set entry preferences for faster input
Replace answers on multiple forms at once
Find forms based on a Form Select Filter
Tutorial Notes
General
You can save your file and take a break any time you’re in the
main document screen.
Tutorial Files
Are in your SurveyPro Samples folder, by default under:
C:\Program Files\Apian Software\SurveyPro 40\
1. Start SurveyPro, log in, and if the window isn’t filling the screen, maximize it.
2. File, Open Data Entry Tutorial.SP4 and save as
YourName Data Entry Tutorial.SP4 when prompted.
3. The File History dialog gives you a brief overview of the project’s contents.
Click Close.
Entering forms with the mouse
This is a fairly typical project, with a rating grid, multiple answer checkbox, long comment, short tabulated written answer, and a date. First let’s
enter a couple forms, so you get the idea of how editing the different scale
types work.
1. Select Answer Entry from the Database menu, or click the toolbar button
Chapter 11 - Working in Answer Entry
January 15, 2007
.
132
Apian SurveyPro 4.0 User Guide
The screen changed dramatically when you switched into Answer Entry,
because this area of SurveyPro is optimized for data collection instead of
document editing.
On the right is an image of your questionnaire, with the first field selected
for entry.
The status bar at the bottom of the screen indicates the current field,
when the form is being added and by whom, and the unique ID this form
will have (Form numbers can change if records are deleted).
On the left are three sections: a simple navigation panel around “New
form 533,” a type-in area for responses just below, and a list of possible or
existing answers to the current question.
Data entry can be done by either keyboard or mouse—let’s try the mouse
first. With the mouse, you can select an answer from the list with one
click, or double click to select and jump to the next question.
2. Double-click on answers in the list on the left until all ten rating grid
questions have responses.
Chapter 11 - Working in Answer Entry
January 15, 2007
133
Apian SurveyPro 4.0 User Guide
Note that the highlight jumped between separate small fields in the scale
columns. If you ever want to select and edit a grid response, you need to
click on the scale instead of the question text.
3. When your highlight has landed on the Comments question, click in the typein box at the upper-left and enter an answer—anything you’d like, including
paragraph breaks.
There are three things to note while in this question. First, the line of text
above the type-in box says “One or more text lines,” letting you know that
this is a long written answer. Second, the percentage next to that prompt
is an indicator which will track how many of the 10,000 possible characters you’ve used up. Third, the Answer Reference List below the type-in
box is grayed, because these responses are assumed to be unique.
4. Enter will just add another paragraph break for this type of question, so press
Tab to move forward.
This is a multiple-answer checkbox scale, as you can tell from the prompt
“One or more box numbers.” With a mouse, you treat this like standard
Windows multiple-select lists.
5. Click in one of the answers in the list, then Ctrl+click on additional responses.
You can also use Shift+click to select sequential items.
6. Make sure one of the boxes you select is 6-Other.
7. Press Tab to move to the next field.
8. That question had an answer test, so SurveyPro may have popped up an error
message. If it did, click Correct, reduce the number of boxes selected to
three or fewer, and click Tab.
Because you selected the Other box, your highlight is now on the Other
blank for a text entry—otherwise SurveyPro would have skipped ahead to
the next question. The Answer Reference List is filled up with the existing
answers in case you’re trying to code responses for tabulation.
9. Double-click on any of the items in the Answer list.
10. Double-click on an answer for the trip purpose question.
Chapter 11 - Working in Answer Entry
January 15, 2007
134
Apian SurveyPro 4.0 User Guide
Now for the date. While SurveyPro will list up to 64,000 unique dates in
the Answer list, sometimes you need the one that’s missing. Above the
type-in box, you’ll see the prompt is letting you know the entries should
be like Apr 30, 2007, but SurveyPro is actually a bit more flexible on what
it will accept.
11. Click in the entry box, type 31 8 07 and press Tab.
12. Click Correct on the error message.
13. This time, try typing 8 31 07 and pressing Tab.
Now SurveyPro takes the value, because even though it wasn’t a very
descriptive entry, it does match the Month-Day-Year order of the scale.
SurveyPro will take other formats as well, such as “F/28/07” for February
28th, but not “A 28 2007” because “A” could apply to either April or
August. Whenever it accepts an entry, SurveyPro reformats it to match
the scale style.
14. Your highlight should now be on the State question, and the Answer list
populated with entries. Double-click on one of the existing answers.
15. The form is complete, so click the Forward button
screen or F10 to move ahead.
at the top-left of the
You probably noticed the little “saving” message as you advanced.
SurveyPro saves each form as you leave it, whether it’s an addition or edit.
The saves are to a working data file to save time, and when you leave
Answer Entry, SurveyPro confirms that you want to merge the changes
with your SP4 file.
Changing data entry preferences
If you’re a keyboard enthusiast, you’ll find SurveyPro’s data entry very
fast. Many of the commands can also be made on a 10-key pad.
1. First, go to the Tools menu and select Options.
2. In the middle of the dialog is an Answer Entry panel—turn on Do not require
Enter key on single-digits.
Chapter 11 - Working in Answer Entry
January 15, 2007
135
Apian SurveyPro 4.0 User Guide
3. Click OK.
This will speed things up quite a bit, since for each of those rating items in
the grid you’ll just have to type one character, with no Tab or Enter
required to advance fields.
Entering forms with the keyboard
1. Click in the entry box in the upper-left.
2. Using your regular or numeric keypad, type a value from 1-4 for each of the
grid items.
3. You know how the comments work, so just press Tab or Enter to skip over it.
4. Like dates, multiple answers may be entered in several formats. Type
1.3-4
and note the highlight added to the Answer list with each new number.
5. Press Enter to advance.
Data cleaning text answers
Any time you need to change an answer in the database, you just go to the
form, click on or Tab to the question, and change it. Or, if you need to
change several items, you use one of the tools we’re covering next.
1. Press F9 or use the back button to skim through a few forms. Note that the
responses change on the form each time you move.
Cleaning data by going form-by-form would take forever so let’s give it a
try with some tools for finding and replacing answers.
2. Click on the Home State question at the end of the survey.
In the Answer list you’ll see that most of the data is 2-character abbreviations, but a few exceptions could be problems for analysis—especially
since Washington is listed three ways and would therefore tabulate as
three items.
3. Under the Database menu, select Answer Replace.
Chapter 11 - Working in Answer Entry
January 15, 2007
136
Apian SurveyPro 4.0 User Guide
At the start, both the tall scrolling list and the drop-down list below it contain the same answers. The assumption is that you’re trying to consistently code written answers, consolidating similar entries.
4. Scroll the top list until you reach the end. Click on Wash, then Ctrl+click on
Washington.
5. From the lower drop-down list, select WA.
6. Click OK, Yes at the confirmation dialog, and OK to close the report about the
number of forms updated.
7. Once again, go to the Database menu and select Answer Replace.
8. This time, select New York in the upper list.
9. Since NY is not in the database yet, click the To Type Answer button at the
bottom of the dialog.
10. Type NY in the entry blank that just appeared.
11. Click OK, Yes at the confirmation dialog, and OK to close the report about
updating 1 form.
The same dialog can be used to consolidate the similar entries in the
Amenities question’s Other blank.
Another tool for replacing answers is Mass Replace, also under the Database menu. While Answer Replace is limited to replacing values within
one question, Mass Replace can use a variety of criteria to set answers.
For example, if a batch of data wasn’t marked with a location code, you
could create a Form Select Filter on a range of data entry dates and
change the location for all forms matching the filter. In general, if you
need a replacement that Answer Replace can’t handle, use Mass Replace.
Chapter 11 - Working in Answer Entry
January 15, 2007
137
Apian SurveyPro 4.0 User Guide
Finding forms for data cleaning
Under the Form menu are three “Find” functions Each one has a specific
application, and the one we’re going to use here is Find Form Select.
1. Pull down the Form menu and click Find Form Select.
2. There are no filters defined, so click the Insert button
to add one.
Form Selects can be typed manually, but usually they’re built in the dialog
by selecting a question, relationship, and values.
3. In the upper-left corner, type the filter Name Other responses.
4. From the Pick a Question or Form Property drop-down list at the upper-right,
select Q12: Amenities.
5. Click the = Equal radio button below.
6. From the list of answers, select Other.
7. Click the button labeled Insert on the left side of the dialog to transfer the
filter to text.
8. Click Test Rule to find approximately 35 forms (depending on your entries),
and click OK.
Now the palette is filled with a list of forms matching your Form Select.
You may not have noticed, but some of the forms which had the Other
box marked but no text in the entry blank.
9. Click on the Other blank to select it—that way you can see its responses in the
Answer list as we search.
Chapter 11 - Working in Answer Entry
January 15, 2007
138
Apian SurveyPro 4.0 User Guide
10. Click on the form numbers in the navigation palette until you find a form with
no Other text.
11. When you get to a matching form, click on the multiple answer checkbox
scale.
12. Ctrl+click on 6-Other in the Answer list to turn it off.
13. Click another form number in the navigation palette list.
Note that the form number of the record you edited is now marked with
an asterisk “*” to indicate it was edited. To save time (especially on large
files), SurveyPro doesn’t update the Answer list with every edit, so even
though the form you changed no longer matches the rule, it’s still in the
list.
14. Click the Refresh button on the navigation palette, and see the form number
disappear.
While there’s a great deal more to data cleaning, those are the essentials
of adding, updating, and finding forms. See also SurveyPro’s Database on
page 110 and Data Cleaning on page 123.
Finishing your session
Generally you’ll return to the main document editing screens after a data
entry session:
1. Close the navigation palette.
2. From the File menu, Quit Answer Entry.
Chapter 11 - Working in Answer Entry
January 15, 2007
139
Apian SurveyPro 4.0 User Guide
Most of the time you’ll click Yes on this dialog, merging you data entry
session into your main SP4 project file. On very rare occasion, such as an
“Oops” during data cleaning, you’ll discard the session with No.
3. Click Yes to save your changes, then Exit SurveyPro.
Chapter 11 - Working in Answer Entry
January 15, 2007
140
REFERENCE
Chapter Contents:
Chapter 12 - Import and Export
January 15, 2007
Chapter 12
Import and Export
Import/Export Fundamentals . . . . . . . . . . . . . . . . . . . . . . . 142
Import Dialog . . . . . . . . . . . . . . . . . . . . . . . . . . . . . . . . . . . 144
General Tab for SurveyPro Family Files . . . . . . . . . . . . . 146
General Tab for Comma/Tab Delimited ASCII . . . . . . . . . 147
General Tab for Access MDB and SQL Databases . . . . . . 148
Field Matchup Tab . . . . . . . . . . . . . . . . . . . . . . . . . . . . . 149
Key Tab . . . . . . . . . . . . . . . . . . . . . . . . . . . . . . . . . . . . . 151
Data Cleaning Tab . . . . . . . . . . . . . . . . . . . . . . . . . . . . . 153
Batch Import Dialog . . . . . . . . . . . . . . . . . . . . . . . . . . . . . . 155
Import Log Files . . . . . . . . . . . . . . . . . . . . . . . . . . . . . . . . . . 157
Export Dialog . . . . . . . . . . . . . . . . . . . . . . . . . . . . . . . . . . . . 159
General Tab for Comma/Tab Delimited ASCII . . . . . . . . . 162
General Tab for Microsoft Access MDB . . . . . . . . . . . . . . 163
General Tab for SurveyPro ST3, STL and SDE . . . . . . . . . . 160
Field Selection Tab . . . . . . . . . . . . . . . . . . . . . . . . . . . . 164
General Tab for SQL Databases . . . . . . . . . . . . . . . . . . . 165
Field Matchup Tab for SQL Databases . . . . . . . . . . . . . . 166
Key and Scale Label Maps Tab for SQL Databases . . . . . 167
Export Log Files . . . . . . . . . . . . . . . . . . . . . . . . . . . . . . . . . . 168
SQL Connection Dialog . . . . . . . . . . . . . . . . . . . . . . . . . . . . . 169
Field Name Sets . . . . . . . . . . . . . . . . . . . . . . . . . . . . . . . . . . 170
Scale Value Mapping for Import and Export . . . . . . . . . . . . . 171
141
Apian SurveyPro 4.0 User Guide
Import/Export Fundamentals
If you have not already done so, you may want to read Database Fundamentals on page 111 to acquaint yourself with some of the terms.
SurveyPro can import and export a variety of data formats. Some formats
are fairly sophisticated, containing information such as the field structure
(date, number, text), while others contain only the basic data. While data
files with more information minimize the transfer time and potential
errors, they're not always compatible with the applications or operating
systems you're using.
More Structure
SurveyPro family files
Survey Tag Language
MS Access or ODBC
Comma/Tab Delimited or Fixed ASCII
Less Detail
SurveyPro family files
When you're moving data among SurveyPro and the Collect programs,
your best choice is one of these formats.
DirectCollect
SDD
For exchanges with DirectCollect, both for empty
templates and for files with completed responses. To
create a DirectCollect file with data, use Publish.
KeyCollect
SDE
Primarily for importing from KeyCollect or filling
Import on page 146
KeyCollect files with data for additional entry or editing, Export on page 160
but can also be used to exchange data between SurveyPro
project files. To create a KeyCollect file with data, use
Publish.
NetCollect
SDH
Format saved to your Web server by the NetCollect scripts. Import on page 146
In addition to the responses, the file includes a date/time
stamp, page number, form ID, and Q numbers.
Survey Pro 2.0
SVA
SurveyPro 4.0 will open a 2.0 SVA file and save to a SP4,
Import on page 146
converting elements such as written answer scales and
File Open on page 3
grids. If you need to exchange files with someone on an
older version of SurveyPro, export to Survey Tag Language
2.0 (STL).
Chapter 12 - Import and Export
January 15, 2007
Import on page 146
Import/Export Fundamentals
142
Apian SurveyPro 4.0 User Guide
SurveyPro 3.0
SP3
You can open a 3.0 SP3 file and save to a SP4 with very
Import on page 146
little impact to the documents. If you need to exchange File Open
files with someone on an older version of SurveyPro, export
to Survey Tag Language 3.0 (ST3).
SurveyPro 4.0
SP4
The best format for combining entire SurveyPro databases Import on page 146
(to merge only part of a database, export to KeyCollect
File Open
SDE, then import into SurveyPro).
Survey Tag Language files
Survey Tag Language files can be opened to create a new project file, as
well as used to exchange data among Apian's products and our partners’.
Version 2.0
STL
STL files are compatible with SurveyPro 2.0, so you can
Import on page 146
export a SurveyPro 4.0 project to STL, and users with older Export on page 160
versions can open it.
File Open
Version 3.0
ST3
A more detailed file format, including specifications for Import on page 146
the new scale types introduced in SurveyPro 3.0, this is the Export on page 160
better approach for users. Can also be used by SurveyPro File Open
4.0 to create templates by exporting a file with no data
but all the file’s scales or exchange files with SurveyPro 3.0
users.
MS Access and ODBC
For many users, these will be the primary tools for transferring data
between SurveyPro and other applications.
Microsoft Access .MDB
Compatible with a wide range of applications, and
Import on page 148
includes field information. Export creates a MDB file from Export on page 163
scratch.
SQL
Allows you to exchange data with enterprise databases.
Chapter 12 - Import and Export
January 15, 2007
Import on page 148
Export on page 165
Import/Export Fundamentals
143
Apian SurveyPro 4.0 User Guide
ASCII Data
We're down to the workhorses of data transfer, used for the vast majority
of imports and exports because they are the least common denominator.
ASCII formats are not only compatible with a wide range of applications,
but are also cross-platform.
Delimited
CSV
TXT
TAB
Comma and tab delimited ASCII are structurally the same— Import on page 147
the only difference is whether a comma or a tab is used to Export on page 162
separate the fields. Delimited ASCII is the best choice for
files with text fields, and also makes it easier to match up
fields when importing into the final application.
Import Dialog
Import can be used to add entire new forms to the database, or to merge
information from a data file into the existing database. The second technique is called “keyed” import in SurveyPro, as it requires a common key
field in both the existing data and the import file to match them together.
Keyed import is most often used for merging together data files from
multi-page NetCollect surveys, or adding information from a customer or
other company database to the survey data.
The two most common sources of import problems are:
•
Editing the questionnaire after documents have been printed or
published. If the Q numbers and/or scale structures have been
changed, it becomes difficult or impossible for SurveyPro to
automatically match up fields.
•
Exporting data from a third-party application without checking
SurveyPro’s data file preferences.
Both of these can cause a number of time-consuming problems, and both
are easily avoided. We recommend always testing the entire survey process—from the content of the questionnaire to collecting the data to producing test figures—before launching your study.
Steps for any import
Regardless of the type of file you are importing, you will go through these
steps:
1. Select a file type
2. Select a file name and location
Chapter 12 - Import and Export
January 15, 2007
Import Dialog
144
Apian SurveyPro 4.0 User Guide
3. Choose a previously created import map, and/or specify details of the file
format and forms to be included
4. Match the import file's fields to questions
5. Set key controls to merge import data into the current forms (optional)
6. Clean for passwords, duplicates, coding open-ended responses, etc.
(optional)
7. Type a name for the export map you've just created (optional)
Field names
If the data file includes field names, you can use them to automatically
match up the data file’s fields to SurveyPro’s questions. SurveyPro
includes default matchups, or you can define custom sets (see page 170).
Data values
The compatible file formats are listed on page 142. Ideally, checkbox and
rating data should be coded with the numeric value, not the plain text
label, though the Scale Value Matchup dialog can take care of mismatches. For written answers, SurveyPro can take any ANSII characters,
and will safely import and export double-byte languages (Chinese, Arabic,
etc.), though characters will not be legible within SurveyPro.
Import maps
For each import file type (ASCII, MDB, etc.) SurveyPro will store a set of
import maps which remember all your file format, field matchup, key and
data cleaning settings. Saving your settings can streamline any repeated
imports.
Log files
At the end of every import you will see a log file with detailed information
about the file source, forms added, mismatches, and other aspects of the
import. If SurveyPro encountered any difficulties, this is where they will
be reported. Logs are also stored in the Tools menu, File History dialog
for later reference.
Importing Data on page 172 provides a detailed walk-through of the
import process, from matching up your fields to questions, to key settings,
to data cleaning tools. While the Collect programs automate many of
these settings, if SurveyPro encounters a problem you will need to use the
standard dialogs.
Chapter 12 - Import and Export
January 15, 2007
Import Dialog
145
Apian SurveyPro 4.0 User Guide
General Tab for SurveyPro Family Files
This includes SurveyPro project (SP4, SP3), Survey Tag Language (ST3,
STL), KeyCollect data (SDE), NetCollect data (SDH) and DirectCollect
data (SDD) files.
You can merge information from different SurveyPro files using the SP4
import. Or, if you only want to import a few forms from a SurveyPro file,
export first to the Survey Tag Language (ST3), then import that file.
Whenever you’re importing a SurveyPro family file, the software will look
at the questions and scales and attempt to match up all the fields. Pay special attention to the notice at the top of this first screen as it will tell you
whether the files are a match or if you need to check the Field Matchup
tab (see page 149).
Notice
Before you see this dialog, SurveyPro has already scanned your file selection for possible problems. Be sure to check this panel for any warnings.
Import Map
If the import may be repeated, it's helpful to save the settings as a named
map. Maps are specific to a file type, and include settings in all four tabs.
Questionnaire to set as
form default
If your file contains multiple questionnaires, you’ll need to tell SurveyPro
which version you want to use for the new forms.
Chapter 12 - Import and Export
January 15, 2007
Import Dialog
146
Apian SurveyPro 4.0 User Guide
General Tab for Comma/Tab Delimited ASCII
The controls for comma and tab delimited ASCII are identical, so both are
documented here. For the pros and cons of delimited ASCII see
Import/Export Fundamentals on page 142.
If you don't have any Import Maps saved, you'll go through the four dialog
tabs as a wizard. Only the General and Field Matchup screens are
required to import data—the others serve specialized needs for merging
pieces of records and cleaning respondent data. As with all SurveyPro
tabbed dialogs, it's best to make your settings in the General tab first since
they can affect the remaining tabs.
Notice
Before you see this dialog, SurveyPro has already scanned your file selection for possible problems (such as irregular record lengths or field
counts). Be sure to check this panel for any warnings.
Import Map
If the import may be repeated, it's helpful to save the settings as a named
map. Maps are specific to a file type, and include settings in all four tabs.
Questionnaire to set as
form default
If your file contains multiple questionnaires, you’ll need to tell SurveyPro
which version you want to use for the new forms.
First record
The first record of ASCII data files often includes field names instead of
labels. If so, tell SurveyPro here.
Multiple-answer
checkboxes are
There is no database standard for multiple answer scales, so the two formats are as a single field separated by semicolons “2;4;5”, or as a set of
yes/no or on/off fields “0,1,0,1,1”.
Chapter 12 - Import and Export
January 15, 2007
Import Dialog
147
Apian SurveyPro 4.0 User Guide
General Tab for Access MDB and SQL Databases
Import allows you to select a table within your MDB file or SQL database
and bring it into SurveyPro. You can add the information from additional
tables by keying on a unique value.
Notice
Before you see this dialog, SurveyPro has already scanned your file selection for possible problems (such as irregular record lengths or field
counts). Be sure to check this panel for any warnings.
Connect SQL
Click the Connect SQL button to connect to create a new import connection. Or, to use a previously defined setup, select an import map and then
click this button to connect. See page 169.
Import Map
If the import may be repeated, it's helpful to save the settings as a named
map. Maps are specific to a file type, and include settings in all four tabs.
Questionnaire to set as
form default
If your file contains multiple questionnaires, you’ll need to tell SurveyPro
which version you want to use for the new forms.
Multiple-answer
checkboxes are
There is no database standard for multiple answer scales, so the two formats are as a single field separated by semicolons “2;4;5”, or as a set of
yes/no or on/off fields “0,1,0,1,1”.
Chapter 12 - Import and Export
January 15, 2007
Import Dialog
148
Apian SurveyPro 4.0 User Guide
Field Matchup Tab
Depending on whether you're importing a SurveyPro file or a general file
format such as ASCII, this screen may be automatically filled in for you.
SurveyPro family files
Unless SurveyPro finds a discrepancy between your open SP4 and the file
you are importing, you should not have to manually set field matchups.
For Collect files, if SurveyPro gives you a warning in the General screen it
often means the survey was edited after the Web, kiosk or KeyCollect data
collection began, which means you need to very carefully check the
match-ups. With SP4, SP3, and ST3 imports, it’s not uncommon to be
merging slightly different sources, so just be careful to check the matchups.
ASCII, MDB and SQL imports In the Field Matchup screen you're just linking the import file's fields to
the correct questions in the file. This is done manually by clicking in the
field column and typing the field number you see in the peek window at
the bottom of the screen. If your import file's field numbers (or a subset)
are in the same order as the SurveyPro questions, you can use the Fill
Next button to set field matchups after the first.
If the first record of your file contains field names (and you indicate it in
the General tab), there's an automatic approach you can take called the
Field Name Set. The sets already defined are for standard SurveyPro
question IDs, such as Q numbers and report labels. If your source file uses
a different set of labels, use the insert button next to the field name set to
add your own. Then, when you select a Field Name set which matches up
the import file's first record to your questions, SurveyPro automatically
fills in the first column matchups. See page 170.
Note: If the question names do not seem to match the questionnaire, it is
because their Report Labels need to be updated. See page 248.
Chapter 12 - Import and Export
January 15, 2007
Import Dialog
149
Apian SurveyPro 4.0 User Guide
Field
Type the field number which matches the question, or type the first in a
series and use the Fill Next button to enter the rest.
Question/Its Scale
Questions and scales in the file. This is the master list, not just the contents of a single questionnaire.
Field Name Set
If your data files include field names in the first record (and you'll be
repeating the import), create a Field Name Set to automatically match
fields to questions.
Fill Next
Fill Next increments field matchups for quick setup when your import
file's fields are in the same order as the SurveyPro file’s questions.
Test Import
If you're uncertain of your settings, the Test Import button is a quick
check to ensure everything is fine. It produces a report similar to the Log
you'll see on a completed import.
Preview Window
The lower half of the dialog shows the first few records of your data
source.
Chapter 12 - Import and Export
January 15, 2007
Import Dialog
150
Apian SurveyPro 4.0 User Guide
Key Tab
By default, SurveyPro adds imported data as complete forms at the end of
your current database. However, you can also use a “keyed” import to
merge information from the import file into existing forms. Two common
applications are:
•
Adding individual respondent information from another source, such
as from a customer contact database
•
Coding data similar to a Rescale, such as adding city names based on
a Zip code
To do a keyed import, the first step is to select the question, such as a customer’s e-mail address, which will be used to match imported records to
the existing data. Everything else on the screen is used to handle the
exceptions, such as having two forms containing the same e-mail in either
the imported file or existing SurveyPro data.
It's a bit confusing at first, but if you're ever unsure just set everything to
Error and try Test Import. This way SurveyPro will report any problems
before importing anything.
Select Key
For most imports, this defaults to “Add all import records as new forms.”
If you’re importing a Collect file including the Form ID (FID), then it
defaults to keying on that value (to prevent duplicates) or adding new
forms if it doesn't find a match. When you switch this to Key import, you
can select one of the questions you’re importing into as the shared link.
The key does not have to be a unique value in SurveyPro or the import
file.
Chapter 12 - Import and Export
January 15, 2007
Import Dialog
151
Apian SurveyPro 4.0 User Guide
If duplicated import key use If the file which you are importing contains more than one record with the
same key, then would you like SurveyPro to use the first instance, last, or
stop and produce an error?
If empty or invalid import
key
If the file you are importing has a form with nothing in the key field, would
you like a new form added, the form skipped, or an error?
If import key matches more In the SurveyPro file's existing forms, a key value is used in more than one
form. Would you like the import file's data merged with all instances or an
than one form
error?
If no match found for
import key
One of the key values in the import file does not exist in the SurveyPro
database. Would you like a new form added, the import form skipped, or
an error?
Replace an existing answer
Among the fields being imported, data may already exist in the SurveyPro
database. If so, would you like this replaced with the import file's data,
only replaced if it's not a blank field, or never replaced?
Form Unique ID Rules
This last set of controls only appears in the fringe case of a Collect Form
ID (FID) being imported, but not being used as the key. Regular KeyCollect, DirectCollect and NetCollect imports key off this automatically
generated but unique ID to prevent double imports of the same forms. If
you do encounter this condition, you may want to contact Technical Support, because many times we can find an easier way.
If missing or invalid
imported ID
If an individual record within the import file does not have a Form ID,
then you have an option of creating a new FID or having SurveyPro skip
the form.
If ID of added record is
already used
This is a very unlikely case, so it's best to leave it on Error. If your SP4 file
contains Form IDs, and the import file contains Form IDs, and there's a
form where its FID is the same as an existing record in the SP4 but which
isn't the one to which it is merging, then you can add the record with a
new FID or skip it. If you do encounter this condition, you may want to email your files to Tech Support for assistance.
If import and open project
are different IDs
When you match up an SP4 and import record using your key question,
they should have the same Form ID or the SP4 record should be empty.
However, if they both have FIDs and they're different, you can select
which one to retain.
Chapter 12 - Import and Export
January 15, 2007
Import Dialog
152
Apian SurveyPro 4.0 User Guide
Data Cleaning Tab
The Data Cleaning tools let you:
•
Specify Must Answer questions
•
Screen for passwords
•
Enforce or loosen pattern checking on telephone numbers, zip codes,
etc.
•
Map data within a field which doesn't match the checkbox labels
(such as a,b,c,d instead of 1,2,3,4)
•
Manually check all responses to a question for coding open-ended
answers
•
Correct responses which don't match your scale's format, such as
dates or numbers
While you can also use the data cleaning tools in Answer Entry (see page
123), that is generally reserved for consistently coding responses. The
import cleaning dialog is critical for correcting any answers which do not
match the scale format (dates, numbers, patterns) and therefore would
not import into the file.
You'll see the settings in the dialog change depending on the scale of the
selected question. Must Answer is the only one which applies to all question types—the other controls are covered further down this page.
With Collect files, all of your Publish settings for passwords and other field
checking will be pre-loaded in this dialog.
Chapter 12 - Import and Export
January 15, 2007
Import Dialog
153
Apian SurveyPro 4.0 User Guide
Screens
Lists all the screens set for the question, including ones from answer tests
and passwords defined during your questionnaire design.
Field
The import file's field which you will be cleaning. “--” indicates there is no
field being imported into a question.
Sample of Answers
Shows the first few records in your import file for reference.
Must Answer Question
Rejects the entire record if a response is not received to this question.
Test Import
We strongly recommend testing your import, especially if you're new to
the process or working with complex settings. This button makes SurveyPro to scan your file, and brings up a report indicating any possible problems. See page 157.
Checkbox and Rating Scales
Multiple answer checkboxes For multiple answer checkbox scales, you can specify a minimum or maximum number of boxes which can be selected:
Scale Value Mapping
Map individual data values to the checkbox labels, such as a,b,c,d to
1,2,3,4. See page 171.
Written Answer and Pattern Scales
Single line
When you’re using scale 3, Non-repeating or Long Memo Written Answer,
the data can contain paragraph breaks. Marking this box restricts the
import to a single line instead.
Chapter 12 - Import and Export
January 15, 2007
Import Dialog
154
Apian SurveyPro 4.0 User Guide
Password Question
For each import there can be only one password field, whether it's a single
value or file. You can use a prepared PIN password file (see page 86) or
simply reference a particular column in a CSV file. If you’re using the CSV,
you can ignore the first record, which is often field names. If for some reason the password was defined elsewhere but you don’t want to enforce it
on import, mark the Ignore option.
Manual Cleaning
For written answer, pattern, date and number data you can review the
answers on import. This can be for all of the answers, or just for ones
which fail to match the scale's format. Select your cleaning option, then
click Set Corrections to go through the responses for that question.
Apply Scale Input Filters
In addition, pattern scales can be enforced or loosened to allow data
through.
Batch Import Dialog
Accessed from the Database menu while in the document editing mode.
Batch Import is used for importing multiple KeyCollect and DirectCollect
files at once. (For NetCollect, use the Get Latest Data command in the
Web Survey Setup dialog.) Batch Import automatically matches up import
forms and performs all the data cleaning tests from Publish.
When you select Batch Import, SurveyPro will ask you for the name of
one data file. If that file is not a perfect match with the current project, it
will redirect you to the regular import dialog (see page 144).
If the file is a perfect match, SurveyPro scans the directory for other compatible files (or in the case of multi-page NetCollect surveys, file sets), and
asks which files you would like to import. The import itself is completed
using the default settings for that file type, so if you have any concerns,
you should review the settings in a manual import first.
Chapter 12 - Import and Export
January 15, 2007
Batch Import Dialog
155
Apian SurveyPro 4.0 User Guide
As always, be sure you review your log files (see page 157) when finished.
Scan of data files in folder
The first dialog tells you it found sets, and asks if you'd like to proceed
with all files or just the ones it hasn't imported before. Since SurveyPro
scans all the files between the first and second dialog, selecting Batch
New Only can save time.
Batch All
Scans all the files found for compatibility problems. You will still have a
chance to review the files and un-select ones already imported.
Batch New Only
Scans only the files it does not have a record of importing in the logs.
This File Only
Switches from batch import mode into the standard dialogs.
Import file list
When you reach the second dialog SurveyPro will indicate which sets
have been imported already, and gray out any sets with which it encountered problems.
Chapter 12 - Import and Export
January 15, 2007
Batch Import Dialog
156
Apian SurveyPro 4.0 User Guide
Files
Lists all file sets found, as well as any problems encountered. In this case,
the third file has been imported already, and the last is a mismatch with
the questionnaire so it cannot be imported as a batch (but can through
regular import).
Key on Unique Respondent
ID
If the project uses a unique password, the key will revert to that question—otherwise it will revert to the form's unique ID.
Clear All/Set All Not
Imported/Set All
Buttons for selecting file sets. Sets can also be manually selected or unselected by clicking in the first column.
Import Log Files
Accessed from the Tools menu, File History dialog.
Import logs generally serve as a confirmation that the import was performed and a record of which fields went where. Most of the complexity
in the example below is due to the keyed aspect, so if you're simply adding forms your log will be quite a bit simpler. A complete description form
matchup table is below the annotated version.
To print a record of the log, just copy the contents to the clipboard, and
paste into Notepad or a word processor.
Logs are retained in the File History (under the Tools menu) until you
remove them. Note that removing logs also removes SurveyPro’s memory
of what it has already imported.
One of the most important elements to watch for is the mismatches. At
least one mismatch in each field usually means you forgot to indicate the
first record was field names on the General tab. Other mismatches, such
as the state below, can often be fixed in the Data Cleaning tab so the
response isn’t skipped.
Chapter 12 - Import and Export
January 15, 2007
Import Log Files
157
Apian SurveyPro 4.0 User Guide
In the keyed import above, only a few forms were matched to the database, with the majority added as new records. Let’s look at the table at the
end which lists all the records in your import file. This takes a little practice to read at first. The columns 0-9 indicate the ones digit of record
numbers. The rows [blank] to end are the tens and hundreds of your
imported record numbers. The four circled records are 1, 3, 6, and 32:
•
Record 1 is the field Names in the database
•
Record 3 was added to the SurveyPro database as form number 90
•
Records 6 and 32 were skipped in the import file because they had the
same Key values as records later in the file
Here’s the full set of codes which may occur based on your import Key
(see page 151) and Data Cleaning (see page 153) settings:
Chapter 12 - Import and Export
January 15, 2007
Import Log Files
158
Apian SurveyPro 4.0 User Guide
Must
Record rejected as one or more responses did not meet Must
Answer requirement(s)
Pwd
Missing valid password
DupKey
Import file contained multiple instances of a key, and based on
your key settings (First/Last), this record was not the one used
NoKey
Record was missing a key, and your settings were Skip rather than
Add New
NoFind
SP3 file did not contain a matching key, and your settings were Skip
rather than Add New
DupUid
Import record contained a unique Form ID which already existed in
your project, and your settings were Skip rather than Create New
NoUid
Import record was missing a unique Form ID, and your key settings
were Skip rather than Add
¹
Superscript next to the form number, indicates the record was
added with a new Form ID
²
Superscript next to the form number, indicates an existing Form ID
was replaced by the import record's Form ID
Names
Appears only for record 1, indicating it contained field names
instead of data
Void
Keyed import on form number, attempting to merge into a form
which has been voided (meaning the data is gone, and only a form
number placeholder is left)
Export Dialog
Accessed from the Database menu while in document editing mode.
Export is a very straightforward function in SurveyPro, with compatible
file formats listed on page 142.
For any export to a file (not SQL), you will specify the:
1. File type
2. File name and location
3. A previously created export map, and/or details of the file format and forms
to be included:
SurveyPro ST3/STL/SDE on page 160
Chapter 12 - Import and Export
January 15, 2007
Export Dialog
159
Apian SurveyPro 4.0 User Guide
Comma/Tab Delimited ASCII on page 162
MS Access MDB on page 163
SQL on page 165
4. Questions to export in the Field Selection Tab on page 164
5. If SQL, merge options for adding information to your database on page 167
6. Name for the export map you've just created (if you're going to repeat the
process)
Log files
At the end of every export you will see a log file with detailed information
about the file created, and forms and fields exported. This is an excellent
reference for matching the data file into the application which will be
using it. Logs are stored in the Tools menu, File History dialog for later
reference. See page 168.
General Tab for SurveyPro ST3, STL and SDE
Accessed from the Database menu while in document editing mode.
The controls for Survey Tag Language 2.0 (STL) and 3.0 (ST3), as well as
KeyCollect SDE data files are identical, so all three are documented here.
A great way to make a template is to export an ST3 file with all scales and
no data, then you can open that in SurveyPro when you need to start a
new file.
If you use ST3 Export as a template when using Remark 5.1 for scanning,
it saves you the trouble of setting up a template in Remark question by
question.
See also the Field Selection Tab on page 164.
Chapter 12 - Import and Export
January 15, 2007
Export Dialog
160
Apian SurveyPro 4.0 User Guide
Scale Export Map/Name
All the settings in both the General and Field Selection tabs can be saved
as Export Maps. Maps are linked to the file type for future use. If you want
to save your settings as an Export Map, type a name for your reference.
Export all scales (ST3/STL
only)
Exports all scales in the file, not just the ones used by the questions you're
exporting. This is very useful for creating templates.
Data Forms to Export
Depending on the file type you will have an option of all forms, no forms,
or a sub-set determined by a Form Select Filter (see page 213).
Chapter 12 - Import and Export
January 15, 2007
Export Dialog
161
Apian SurveyPro 4.0 User Guide
General Tab for Comma/Tab Delimited ASCII
Comma and tab delimited ASCII files are identical except for the delimiter, so both are documented here.
See also the Field Selection Tab on page 164.
Scale Export Map/Name
All the settings in both the General and Field Selection tabs can be saved
as Export Maps. Maps are linked to the file type for future use. If you want
to save your settings as an Export Map, type a name for your reference.
First ASCII record gets field
names
Adds the field names as the first record in the data file. If the importing
application supports this, including the names helps prevent mismatches.
One blank character in
empty written answers
Some applications prefer a placeholder, such as a single space, be added
to empty fields.
Multiple-answer
checkboxes
There is no standard data file format for multiple answer fields, so you can
export them as either a single field such as “,3;7;12,” or separate fields “, ,
,1, , , ,1, , , , ,1,”. If you are uncertain what format your software prefers,
separate fields is generally the safer choice.
Checkbox and ranking
answers
You can export either the checkbox number or the label used in SurveyPro. Note this is the automatic number, not a custom value you may have
added.
Put quotes around answers
Within ASCII data files double quotes " indicate that the following text is
to be taken verbatim, and that special characters such as commas or line
breaks should be disregarded until the closing " is encountered. Although
some applications only enclose data in quotes when it contains one of
Chapter 12 - Import and Export
January 15, 2007
Export Dialog
162
Apian SurveyPro 4.0 User Guide
these special characters, we recommend doing so for all written fields.
Any quotes within a response will be doubled, becoming "".
Answer length limit
Allows you to truncate the length of written answers.
Data Forms to Export
Export all forms or a sub-set determined by a Form Select Filter (see page
213).
General Tab for Microsoft Access MDB
Accessed from the Database menu while in document editing mode.
Microsoft Access MDB files can be a great way to transfer data among
applications which support the format. This is also the most common
approach for interfacing with ODBC databases.
When SurveyPro exports data to MDB, it creates a new single-table database with your responses.
See also the Field Selection Tab on page 164.
Scale Export Map/Name
All the settings in both the General and Field Selection tabs can be saved
as Export Maps. Maps are linked to the file type for future use. If you want
to save your settings as an Export Map, type a name for your reference.
Multiple-answer
checkboxes
There is no standard data file format for multiple answer fields, so you can
export them as either a single field such as “,3;7;12,” or separate fields “, ,
,1, , , ,1, , , , ,1,”. If you are uncertain what format your software prefers,
separate fields is generally the safer choice.
Chapter 12 - Import and Export
January 15, 2007
Export Dialog
163
Apian SurveyPro 4.0 User Guide
Checkbox and ranking
answers
You can export either the checkbox number or the label used in SurveyPro. Note this is the automatic number, not a custom value you may have
added.
Answer length limit
Allows you to truncate the length of written answers.
Truncate field names at 64
Truncates the field names in the table at 64 characters. This is usually
only an issue if you select the Question Report Labels as the field names
to export on the Field Selection tab (see page 164).
Data Forms to Export
Export all forms or a sub-set determined by a Form Select Filter (see page
213).
Field Selection Tab
All the file formats except SQL use this screen to mark the questions you
want to include in your export.
Note: If the question names do not seem to match the questionnaire, it is
because their Report Labels need to be updated. See page 248.
Include
Selects the fields to export. At the end of the list are system fields such as
the date and time a record was submitted online, or form number.
Clear All/Set All
Use these buttons to mark or clear all fields.
Field Name Set
When you export the field names as the first record, you can select the
names you'd like to use or add a custom set. See page 170.
Chapter 12 - Import and Export
January 15, 2007
Export Dialog
164
Apian SurveyPro 4.0 User Guide
Test Export
If you're uncertain of your settings, the Test Export button is a quick
check to ensure everything is fine. It produces a report similar to the log
you'll see on a completed export (see page 168).
General Tab for SQL Databases
Accessed from the Database menu while in document editing mode.
SQL exports are slightly different from the others because instead of creating a new data file, they add information to an existing database. It uses
a Field Matchup tab on page 166 which is similar to imports, as well as a
Key tab on page 167 to specify how to handle overwriting information.
Scale Export Map/Name
All the settings in both the General and Field Selection tabs can be saved
as Export Maps. Maps are linked to the file type for future use. If you want
to save your settings as an Export Map, type a name for your reference.
Multiple-answer
checkboxes
There is no standard data file format for multiple answer fields, so you can
export them as either a single field such as “,3;7;12,” or separate fields “, ,
,1, , , ,1, , , , ,1,”. If you are uncertain what format your software prefers,
separate fields is generally the safer choice.
Checkbox and ranking
answers
You can export either the checkbox number or the label used in SurveyPro. Note this is the automatic number, not a custom value you may have
added.
Answer length limit
Allows you to truncate the length of written answers.
Chapter 12 - Import and Export
January 15, 2007
Export Dialog
165
Apian SurveyPro 4.0 User Guide
Connect SQL
Click the Connect SQL button to connect to create a new export connection. Or, to use a previously defined setup, select an export map and then
click this button to connect. See page 169.
Data Forms to Export
Export all forms or a sub-set determined by a Form Select Filter (see page
213).
Field Matchup Tab for SQL Databases
Use this screen to link the export file's fields to the correct questions in
the file. Click in the field column and type the field number you see in the
peek window at the bottom of the screen. If your export file's field numbers (or a subset) are in the same order as the SurveyPro questions, you
can use the Fill Next button to set field matchups after the first.
Field
Type the field number which matches the question, or type the first in a
series and use the Fill Next button to enter the rest.
Question/Scale
Questions and scales in the file. This is the master list, not just the contents of a single questionnaire.
Fill Next
Fill Next increments field matchups for quick setup when your import
file's fields are in the same order as the SurveyPro file's questions.
Test Export
If you're uncertain of your settings, the Test Export button is a quick
check to ensure everything is fine. It produces a report similar to the Log
you'll see on a completed export.
Chapter 12 - Import and Export
January 15, 2007
Export Dialog
166
Apian SurveyPro 4.0 User Guide
Field Name Set
Because SQL databases tend to have their own field naming conventions,
Field Name Set field is not typically used for SQL export. However, when
needed you can select an automatic set or create a new one (see page
170).
Preview Window
The lower half of the dialog shows the first few records of your database.
Key and Scale Label Maps Tab for SQL Databases
Use this screen to fine tune information about database keys, export rules,
and scale mapping.
Important: SQL databases have their own rules for adding fields, such as
requiring unique values or prohibiting NULL (empty) values. Be sure your
export rules here are consistent with the SQL rules. Otherwise, the export
is likely to fail and you may receive cryptic error messages from the SQL
system.
Select Key
Often you’ll be merging information into existing records. A Key question
is used to match up forms in the import file to those in the existing database.
If duplicated export key use If your SurveyPro file contains more than one instance of a key, do you
want the export to update your SQL database with the first instance, last
instance, or stop with an error?
If empty export key
If your SurveyPro file contains forms with no key entered, do you want
them to be added as new records to your SQL database, skipped, or to
halt the whole export with an error?
Chapter 12 - Import and Export
January 15, 2007
Export Dialog
167
Apian SurveyPro 4.0 User Guide
If export key matches more
than one form
If the database to which you are exporting contains more than one
instance of a key, then would you like SurveyPro to update all instances or
stop and produce an error?
If no match found for
export key
One of the key values in your SurveyPro file does not exist in the SQL
database. Would you like a new form added, the export form skipped, or
an error?
Replace an existing answer
Among the fields being exported, data may already exist in the SQL database. If so, would you like this replaced with the SurveyPro file's data, only
replaced if it's not a blank field, or never replaced?
Scale Label Mappings
Scale Label Mappings lets you to override what is exported for specific
scales to match what the SQL database expects. See page 171.
Export Log Files
Accessed from the Tools menu, File History dialog.
Export logs generally serve as a confirmation that the export was performed and a record of any form or field sub-sets. They are invaluable
when you don't export first record labels, or when you'll be passing the
data file to another person.
To print a record of the log or e-mail to another person, just copy the contents to the clipboard, and paste into Notepad or a word processor.
Logs are retained in the File History until you remove them.
Chapter 12 - Import and Export
January 15, 2007
Export Log Files
168
Apian SurveyPro 4.0 User Guide
SQL Connection Dialog
Accessed from the General tab of SQL Imports and Exports.
Whether you are importing or exporting to a SQL database, when you
click the Connect SQL button, you'll arrive at this dialog. You must connect to the database before you can test an import, or proceed with the
import or export.
Connection String
Choose a server type from the list. Your choice affects the other connection options that appear. SQL Server, MySQL, Oracle, and Oracle From
Microsoft let you connect to those SQL server products. Access Jet lets
you go to a MDB file. Data Link Files lets you use a predefined connection
referenced by name. DSN lets you use an ODBC registered name. <Custom> offers the same entries as SQL Server but without the server name
pre-loaded.
Connection Status
Click to connect to the database. When connected, this button is renamed
to Disconnect.
Table in Database
After connecting to the database, select the database table you want to
use. If there is only one, it is selected automatically. SurveyPro can only
exchange data with one table at a time.
Close
After connecting to the database and selecting a table, click Close to
return to the import or export process.
Chapter 12 - Import and Export
January 15, 2007
SQL Connection Dialog
169
Apian SurveyPro 4.0 User Guide
Field Name Sets
Accessed through the Field Matchup Tab on page 149 during imports or the
Field Selection Tab on page 164 during exports.
Use Field Name sets to match your data file's or database's field names to
the SurveyPro question labels.
To match a field name, click in the first column, then click on a field name
in the bottom left list.
Note: If the question names do not seem to match the questionnaire, it is
because their Report Labels need to be updated. See page 248.
Field Name
Lists the names currently associated with questions.
SurveyPro Question/Its
Scale
Questions and scales in the file. This is the master list, not just the contents of a single questionnaire.
Database field names
Field names used in the file you are in the process of importing.
Copy to Clipboard
Copies the field name, question ID and scale matchups to the clipboard.
They can be pasted into a text editor, word processor, or spreadsheet.
Set’s Name
Copies the field name, question ID and scale matchups to the clipboard.
They can be pasted into a text editor, word processor, or spreadsheet.
Chapter 12 - Import and Export
January 15, 2007
Field Name Sets
170
Apian SurveyPro 4.0 User Guide
Scale Value Mapping for Import and Export
Accessed through the Data Cleaning screen during imports.
While you select a checkbox question in the Data Cleaning screen during
import, you’ll see a control labeled Scale Mapping. What this control lets
you do is select or create a scale mapping that translates SurveyPro’s
scale box values into the answers to be read from or written to your external sources.
To map multiple values into one scale item, separate them with semicolons “;”.
To create a scale mapping:
1. Select the question you want to map on the Data Cleaning tab
2. Insert a mapping
3. Type the value which is used in your ASCII file or SQL database next to every
scale item (rows left blank will not save an answer)
4. Give the map a Name and click OK to save
As with all named objects in SurveyPro, once a scale map is created you
can apply it to other questions with the same scale. However, remember
that any changes will also ripple to all uses, so if you’re using a mapping
that was defined by someone else for an import or NetCollect piping, you
may want to duplicate the mapping before editing.
Chapter 12 - Import and Export
January 15, 2007
Scale Value Mapping for Import and Export
171
Chapter 13
Importing Data
TUTORIAL
The basics of importing forms is straightforward, but there are many flavors of data files and possible combinations, so SurveyPro includes a
large number of controls in its Import dialogs.
While the Collect programs take care of most of the matchup and merging
for you (especially with batch import), if a file isn’t a perfect match, you’ll
be using these same controls.
See Database Fundamentals on page 111 and Import/Export Fundamentals
on page 142 for definitions of database terms.
In this tutorial you’ll learn how to:
Importing new forms into SurveyPro.
Saving settings in an Import Map.
Merging information into existing database forms (keyed import).
Screening for incorrect responses.
Tutorial Notes
General
You can save your file and take a break any time you’re in the
main document screen.
Tutorial Files
Are in your SurveyPro Samples folder, by default under:
C:\Program Files\Apian Software\SurveyPro 40\
1. Start SurveyPro, log in, and if the window isn’t filling the screen, maximize it.
2. File, Open Import Tutorial.SP4 and save as YourName Import Tutorial.SP4
when prompted. Close File History.
Chapter 13 - Importing Data
January 15, 2007
172
Apian SurveyPro 4.0 User Guide
This is a modified version of the survey created in Creating a Questionnaire
on page 91. The original questionnaire asked respondents for their room
service check number, and for those who provided it, we’ll be able to
merge information from the hotel’s invoicing system with the respondent
data. So, the original questionnaire was copied into a new version, “D5:
Data Entry Version,” and a few fields were added to a second page for the
invoicing data. All entry and import will be into this questionnaire document.
Selecting the file and format
The files we’re working with are comma delimited ASCII, also known as
comma separated values (CSV). These are the most common data file
imported apart from the Collect files.
1. Under the Database menu, select Import from, Comma Delimited ASCII.
2. Select Import Tutorial 1.CSV and click OK.
Before SurveyPro even brought this dialog up, it scanned your file for possible errors and reported what it found in the top panel.
3. In the first active field, give your settings the Name Ratings.
While this setting has little meaning for a one-time lesson import, it’s
extremely handy for real projects. SurveyPro will save all settings we’re
about to make under this name, so next time you import a file from the
same source, all you would have to do is select the Import Map and click
Finish.
4. Change the Questionnaire setting to D5: Data Entry Version.
Chapter 13 - Importing Data
January 15, 2007
173
Apian SurveyPro 4.0 User Guide
5. This file’s first row does contain field names, so click the radio button for
First Record: Is Field names.
The next setting relates to multiple-answer checkbox scales, which do not
have a universal formatting in data files. The first option, combined,
would mean there was a single field indicating the boxes marked, such as
“1;2;5,” while the separate fields uses a separate field for each box with a
1/0 or Yes/No switch such as “1,1,0,0,1.”
6. Set the Multiple-answer control to Separate sequential import fields and
click Next.
7. Click OK to close the warning dialog.
Matching import fields to questions
The Field Matchup screen is just that—connecting fields from the data file
into your SurveyPro questions.
At the top is a list of the SurveyPro questions in Q order. At the bottom is
a list of the fields in the file you’re importing. Next to each field number is
a peek at the first few forms in the file, to help you match the right data to
the right question.
Between the two is a control which is a real timesaver, and we’re about to
use it to have SurveyPro match our fields for us.
1. In the middle of the dialog, change the Field Name Set to Question Report
Labels.
Chapter 13 - Importing Data
January 15, 2007
174
Apian SurveyPro 4.0 User Guide
Because the field names in the imported file are identical to the report
labels, SurveyPro entered the field numbers in the first column for us.
SurveyPro has several built-in field name sets, but you can also add custom sets to match existing databases.
2. It’s always a good idea to double-check automatic settings, so scroll down
the top list, comparing the field number in its first column against the data
in the lower window.
Questions 4 and 7 didn’t match up because of different punctuation in the
SurveyPro and import file labels.
3. Click in the Field column next to Q4: Waiter’s Manner and type a 5 to match it
to the fifth import field.
4. Type 15 next to Q7: Comments?
Note that Q8: Service Enhancements only has one field number, 9, even
though the peek shows several fields with that label. This is the multiple
answer question, and since it has 5 boxes, SurveyPro automatically looks
to 9 and the following 4 fields.
Q8: Service Enhancements also has two rows in the upper list, the second
with “Other” after the Question name. This checkbox scale had a write-in
blank, which is a different database field in SurveyPro. It also wasn’t
matched by the Field Name Set, so we’ll need to fill it in.
5. In the Field column for Q8: Service Enhancements Other, type 14 to match it
to the field number labeled “Other” in the lower list.
6. The remaining empty fields will be filled in with our second import, so click
the Test Import button to see whether we have any errors so far.
Chapter 13 - Importing Data
January 15, 2007
175
Apian SurveyPro 4.0 User Guide
It’s always best to correct problem files or incorrect settings before
import, so clicking Test Import and reviewing the test log is worth a few
moments. It’s also better to learn about problems from the import log than
an “off ” report, so be sure you check the final log even on routine imports.
Import logs are saved for your review in the Tools, File History dialog, and
the Help system includes detailed information about their contents.
7. In this case, no mismatches show mid-way down the log, so click Back to
close the log screen.
8. Click Next to go to the Key tab.
Keyed import merges information from the imported file into existing
forms in your database. For right now, we’re just adding forms, but the
second import in this lesson merges information based on the Check #.
9. Click Next to see the Data Cleaning tab, which we don’t need to use since we
have no mismatches.
10. Click Finish, Yes at the prompt to save the map, and OK to close the log file.
11. Click on the 2: Executive S... document tab at the bottom of the screen for
the automatic Executive Summary report.
We have data in all the questions the guests answered. The remaining
fields are ones we’re going to fill in based on the Check #.
Matching forms for a second import
1. Go to the Database menu, and select Import, Comma Delimited ASCII again.
2. Select Import Tutorial 2.CSV.
This time the dialog looks different, with tabs instead of a wizard, because
SurveyPro brought up the settings for the Ratings import map we just created.
3. The first control is a drop-down list asking for the Import Map to use. In this
case we need a new one, so click the Insert button
next to the list.
4. If you’re prompted to save changes to Ratings, click No.
5. Click in the Name field and type Check # Merge.
6. Again, click in the list below to change the Questionnaire drop-down list to
D5: Data Entry Version.
7. Set the First Record to Is Field Names again, and check your screen against
the one below.
Chapter 13 - Importing Data
January 15, 2007
176
Apian SurveyPro 4.0 User Guide
8. Click on the Field Matchup tab at the top of the dialog.
9. In the middle of the dialog, change the Field Name Set to Question Report
Labels again.
10. Scroll down the question list until Q10: Check # is at the top.
11. In this case, only two field names matched SurveyPro’s, so click in the Field
column next to Q11 and click the Fill Next button.
12. Click Fill Next twice more to set the next two questions.
Chapter 13 - Importing Data
January 15, 2007
177
Apian SurveyPro 4.0 User Guide
Setting the import to update records instead of add
1. Click on the Key tab at the top of the dialog.
Now things are going to get interesting, since the next step is to match the
information in this data file to the records already in the SurveyPro database. Keyed import has a somewhat confusing array of controls because
the scenarios for merging data are so different. For your own projects, you
may want to try a test run with a temporary file until you’re sure it’s doing
exactly what you want.
2. Select the radio button for Key import records.
3. From the drop-down list that appeared under the radio, select Q10: Check #.
The drop-down list only displays questions into which data is being
imported. An “ideal” keyed scenario is a 1:1 relationship between records
in the existing data and the imported file, but those rarely exist. Most of
the controls in this dialog are for dealing with exceptions.
In the next set of controls are settings for exceptions in the CSV file we’re
importing. Because this data file originated in an invoicing system, every
record should have a check number and there should be no repeats. If
there are any problems, we want to know about it before importing.
4. For both Import File Rules, change the settings to Error.
The Error setting in keyed imports stops the import, produces a warning
dialog, and will not let you proceed until the key settings and/or data file
are corrected to eliminate all errors. Generally this setting is only used
when the file should produce absolutely no errors, so getting one means
the file is corrupted in some manner.
Next in the dialog are controls for exceptions in the existing SurveyPro
data. Again, we need to make a change for this particular scenario, where
many forms in the SurveyPro database don’t contain a key value (it was
an optional question), and the import file is a super-set of the responses
(not everyone answered the survey).
5. Change If no match found for import key to Skip Record, since we don’t want
to add forms for which we have no feedback.
6. Check your screen against these settings, and then click Test Import.
Chapter 13 - Importing Data
January 15, 2007
178
Apian SurveyPro 4.0 User Guide
As you read through the log, note that it matched up only 30 records and
skipped 48, and that it encountered mismatches for the Meal question. If
you remember from the peek on the Field Matchup tab, it was encoded as
“B,L,D,S” while the SurveyPro scale is “Breakfast, Lunch, Dinner, Late
Night Snack.” Since the “L” in the import file could be applied to both the
second and fourth checkboxes and “S” doesn’t match the first letter of any
labels, SurveyPro reported them as mismatches. Don’t worry, the next
step is to fix it!
At the end of the log, instead of the solid grid of numbers which you saw
in the first matchup, there are numbers interspersed with “NoFind,” which
indicates the import file records for which it couldn’t find a match in the
SurveyPro database.
7. Click Back to close the log.
Mapping import data to scale values
1. At the top of the dialog, click the Data Cleaning tab.
2. Scroll down to the end and note that the Key setting is indicated in the first
column for Q10.
3. Click on Q14: Meal in the center column of the last row.
Notice that just below the question list a sample of the import data
appeared. Now you don’t need to jump back to the Field Matchup tab for
a peek at the values we need to fix.
Chapter 13 - Importing Data
January 15, 2007
179
Apian SurveyPro 4.0 User Guide
4. Click the Insert button
next to the Scale Value Mapping drop-down list
(you can have several sets for different sources).
5. In the Import-Export file column, type B, L, D and S next to Breakfast, Lunch,
Dinner and Late Night Snack respectively.
6. Click in the Map Name field and type Invoice Values.
7. Click OK, and note that Sv1 has appeared next to Q14 in the Data Cleaning
question list.
8. Click Test Import, confirm the mismatches are gone, and click Back to close
the log.
9. Click OK to finish the import, and Yes to save your import map settings for
future use.
10. Click OK to close the final log, and notice all the questions in the Executive
Summary now have data!
In most cases, you’ll need to become familiar with only a few of the
import controls because you’ll be importing data from only a few sources.
Even if you never manually enter data, you may want to take a look at
Working in Answer Entry on page 132, so you can learn how to find and
edit individual responses.
Chapter 13 - Importing Data
January 15, 2007
180
Apian SurveyPro 4.0 User Guide
Chapter 13 - Importing Data
January 15, 2007
181
Apian SurveyPro 4.0 User Guide
Chapter 13 - Importing Data
January 15, 2007
182
REFERENCE
Chapter Contents:
Chapter 14 - Figures
January 15, 2007
Chapter 14
Figures
Understanding Report Elements in SurveyPro . . . . . . . . . . . 184
Using Figures Effectively . . . . . . . . . . . . . . . . . . . . . . . . . . . 185
Figure Dialogs . . . . . . . . . . . . . . . . . . . . . . . . . . . . . . . . . . . 187
General Tab . . . . . . . . . . . . . . . . . . . . . . . . . . . . . . . . . . 187
For Question(s) Tab . . . . . . . . . . . . . . . . . . . . . . . . . . . . 188
For Statistics Tab . . . . . . . . . . . . . . . . . . . . . . . . . . . . . 189
By Crosstab/Filter Tab . . . . . . . . . . . . . . . . . . . . . . . . . . 190
Layout Tab . . . . . . . . . . . . . . . . . . . . . . . . . . . . . . . . . . 191
Title-Caption Tab . . . . . . . . . . . . . . . . . . . . . . . . . . . . . 192
Text Figures . . . . . . . . . . . . . . . . . . . . . . . . . . . . . . . . . . 193
Tables . . . . . . . . . . . . . . . . . . . . . . . . . . . . . . . . . . . . . . 193
Table + Bars . . . . . . . . . . . . . . . . . . . . . . . . . . . . . . . . . 194
Bar Chart . . . . . . . . . . . . . . . . . . . . . . . . . . . . . . . . . . . 195
Pie Chart . . . . . . . . . . . . . . . . . . . . . . . . . . . . . . . . . . . . 196
Stacked Bars . . . . . . . . . . . . . . . . . . . . . . . . . . . . . . . . . 198
Line Chart . . . . . . . . . . . . . . . . . . . . . . . . . . . . . . . . . . . 199
Compare Groups Pairs . . . . . . . . . . . . . . . . . . . . . . . . . . 201
Data Table Figure . . . . . . . . . . . . . . . . . . . . . . . . . . . . . 204
Stub List Dialog . . . . . . . . . . . . . . . . . . . . . . . . . . . . . . . . . . 206
Clone Figures Dialog . . . . . . . . . . . . . . . . . . . . . . . . . . . . . . 206
Statistics in SurveyPro . . . . . . . . . . . . . . . . . . . . . . . . . . . . . 207
183
Apian SurveyPro 4.0 User Guide
Understanding Report Elements in SurveyPro
SurveyPro creates report documents which are structured of tiles just like
surveys, but instead of question tiles it uses figures. A figure can be a
table, or bar chart, or pie, and can change as needed. Using Figures Effectively on page 185 is an excellent place to start if you are new to analysis.
Again, just as questionnaires reference Text Styles and Scales in their definitions, figures reference an assortment of components which enrich and
streamline your analysis. The components are referenced throughout this
chapter, and used in Creating a Report on page 253 and Breaking Data
Down on page 268, but their specific coverage begins on page 210.
SurveyPro’s reporting engine is designed to be used from a novice to
expert level, with automatic reports you can print as-is, to an array of
options for fine-tuned analysis.
Note: If the figure dialogs and reporting tools don’t offer you a statistic or
function you expect, double-check your questionnaire definition. For
example, if on your survey you asked a date question but used a written
answer scale, the reporting will not give you the option to group dates by
days, months, etc.
Chapter 14 - Figures
January 15, 2007
Understanding Report Elements in SurveyPro
184
Apian SurveyPro 4.0 User Guide
Using Figures Effectively
You’re constructing a custom report, you click the Insert button, and a list
of nine figure types drops down. Not only do the different figure types
provide different visual representations, they also report on different
types of questions and work with different sets of statistics. So which to
choose?
The best way to discover the pros and cons of different figures, as well as
your personal preferences, is to experiment with your own projects. Creating a Report on page 253 walks through many of these figure types, but
you can also insert a bar chart, change it to a table, modify the statistics,
change it to a pie chart, and so on. When you finish playing with test figures, clean them up for use in your final report or simply delete them.
In general, the figures do have certain strengths and weaknesses though,
which we’ve described here. All figure types have some common dialog
elements which are covered beginning on page 187. Each figure dialog
will offer the statistics applicable to that format (many more in tables than
pies), and which are allowed for the selected questions’ scales—see Statistics in SurveyPro on page 207.
Text
Text figures are minimally formatted, so while they can be used to report
on a wide range of statistics, they are normally used to analyze written
answer scales. Written responses can be reported for the entire database
or a sub-set of respondents, and may also be crosstabbed (broken down)
by another question. See page 193.
Chapter 14 - Figures
January 15, 2007
Using Figures Effectively
185
Apian SurveyPro 4.0 User Guide
Table
Tables may be used when you need to pack a page with many statistics,
questions, and crosstabs, but can also make effective presentations of
smaller amounts of numeric data. If a table appears awkwardly long or
wide, try tinkering with the layout settings to create a more balanced look.
See page 193.
Table + Bars
The default for Executive Summaries, Table + Bars combine numeric data
with a visual representation. In this case, the table displays counts, while
the bars show percents. See page 194.
Bar Chart
Bar Charts are the classic graphs, excellent for reporting frequencies in a
question, or even means for items in a question group (see page 228).
They are not very effective for crosstabs, where they produce a figure for
each breakdown, so for that type of analysis you may want to try a
Stacked Bar figure. See page 195.
Pie Chart
Pie Charts are a popular figure type, but tend to be limited in their applications. If you use a pie, take a look at the sorting function and rescales to
simplify the chart, and 3D styles to maximize the impact. As with bar
charts, crosstabs can become difficult to compare with pie charts, so you
may want to consider a stacked bar or other figure. See page 196.
Stacked Bars
A Stacked Bar is like a pie chart in that it contains slices for each response
in the frequency distribution, but its strength is that you can stack these
slices up for a quick visual comparison. See page 198.
Line Chart
Line or profile charts are similar to stacked bars in that they present
results for different groups in a concise visual format. See page 199.
Compare Groups Pairs
Compare Groups figures can take several forms: bar charts, scatterplots,
or line charts. In all cases, the figure is about comparing the results for two
question groups or two customer segments on one question group, and
only the layout changes. See page 201.
Chapter 14 - Figures
January 15, 2007
Using Figures Effectively
186
Apian SurveyPro 4.0 User Guide
Data Table
In addition to the Data Table report, individual data tables may be
inserted into custom reports. One very effective use for these figures is to
report on one group of customers for whom you want a more complete
profile. For example, you can create a figure with a few key questions and
a Form Select of records containing comments. See page 204.
Figure Dialogs
Figures act just like questions, added with the Insert pencil point and
assembled in a document as tiles. Also like questions, when you initially
insert a figure it will be in “wizard” mode stepping you through the tabs,
but on editing all the controls will be available.
Many of the figure controls are used repeatedly in the dialogs, so start first
with the following sections on the tabs. Then see the individual figure
types for additional details.
General Tab
You’ll skip this tab when you use the pencil point to insert a specific figure
type. After a figure is defined, you can change a tile to another figure type,
but this can lose some layout and statistics settings so you may want to
experiment on a copy.
Chapter 14 - Figures
January 15, 2007
Figure Dialogs
187
Apian SurveyPro 4.0 User Guide
For Question(s) Tab
Select a question or group of questions as the primary elements in the figure. This tab is almost identical for every figure type except the Line
Chart, which is covered on page 199.
Table For
The figure can be for a single question, a question group, or a set of questions known as a stub list. See Question Groups & Scores on page 228 and
Stub List Dialog on page 206.
Pick the
Question/Group/Stub Item
For questions, this displays the complete list within your project. For
Groups, it lists the existing groups and has Insert, Modify, and Duplicate
buttons for adding new groups. For Stubs, it lists the items in the stub list
you've created, and as you click on each item in the list you can selectively apply modifiers, or click Apply To All to set them at once.
Question Group as
Groups can be presented as a single unit, showing each question within
the group, or both. The best choice usually depends on the type of figure
and whether you're using a cross-tab. Try experimenting with all the settings to see how they appear.
Modifiers
You can apply an optional Rescale to change the labels, grouping or structure of the selected question(s). With date and number scales you'll also
see options for quick binning into common categories, and written
answers are autopostcoded. See Modifiers & Rescales on page 216.
Chapter 14 - Figures
January 15, 2007
Figure Dialogs
188
Apian SurveyPro 4.0 User Guide
For Statistics Tab
This tab will include the statistics applicable to your figure type and
selected For Question(s). In figures without this tab, the statistics and sorting options will appear in other tabs.
For Text and Table figures, the dialog is identical, with a set of statistics in
the lower half of the dialog and the ability to select individual Stub items
in the upper half (will appear gray if a single question or group is the For
Question).
Table+Bar and Bar Chart figures have a different arrangement of options
due to the format of the graphs, but the meanings of the settings is the
same.
Note that some of these settings also appear on other tabs. If they appear
on a Layout tab (such as for Pies) then they apply to the For Question. If
they appear on a By Crosstab/Filter tab, then they apply to the crosstab
question.
Pick the Item
Apply Stats to All
When working with a Stub list, you may be mixing items which support
different statistics. Click on each item to set individual statistics, or click
Apply Stats to All and SurveyPro will apply whichever of your selected
stats are valid to each question.
Frequency/Statistical/
Significance Measures
See Statistics in SurveyPro on page 207 for a description of all the statistics.
Which ones appear depends on the type of figure and scale.
Chapter 14 - Figures
January 15, 2007
Figure Dialogs
189
Apian SurveyPro 4.0 User Guide
With No Answers
Includes a category for the number of people who skipped the question.
This is distinct from marking a NA you configured in the scale definition
(see page 72). When you include No Answers, they’re added to the
denominator for percentage breakdowns.
Sorting
The options offered depend on the type of scale and modifiers applied.
Move counts at or under ___ By default, SurveyPro will count all repeated responses to Other blanks
and short written answer scales (including telephone and Zip pattern
into Others
scales). Use this setting to adjust the number of times an answer has to be
provided before it shows as a unique response or is combined with other
outliers into “Other.”
By Crosstab/Filter Tab
In addition to the primary question(s) and statistics in your figure, you can
break down your analysis by the responses to a question, Group, or Banner. Banners are useful when you need more flexibility than is available
here, or plan to re-use your settings (see page 223). This tab also includes
statistics which apply to the crosstab question.
Crosstab By
Select a question, Group, or Banner to break down your For Question's
responses.
Crosstab Label
An optional label override for the crosstab. Banners offer additional label
controls.
Chapter 14 - Figures
January 15, 2007
Figure Dialogs
190
Apian SurveyPro 4.0 User Guide
Modifiers
You can apply an optional Rescale to change the labels, grouping or structure of the selected question(s). With date and number scales you'll also
see options for quick binning into common categories, and written
answers are autopostcoded. See Modifiers & Rescales on page 216.
With No Answers
Includes a category for the number of people who skipped the question.
This is distinct from marking a NA you configured in the scale definition
(see page 72). When you include No Answers, they’re added to the
denominator for percentage breakdowns.
Overall Column
Adds a column for all responses to the For Question (after applying the
Form Select), in addition to the breakdown columns. Banners offer additional options.
Show Empty Crosstabs
Includes a column for By Question or Banner categories which did not
receive any responses, such as keeping a column for Alaska even though
no respondents had marked it as their residence.
Sorting
The options offered depend on the type of scale and modifiers applied.
Move counts at or under ___ By default, SurveyPro will count all repeated responses to Other blanks
and short written answer scales (including telephone and Zip pattern
into Others
scales). Use this setting to adjust the number of times an answer has to be
provided before it shows as a unique response or is combined with other
outliers into “Other.”
Form Select Filter
Form Selects subset the database based on answers to questions, form
numbers, and other criteria. Select among the Form Selects already
defined, or use the buttons to duplicate, insert, and modify filters.
Layout Tab
See also the individual figure types for layout options. Common controls
include:
Question Numbers
With a single questionnaire document, the question numbering is quite
straightforward. However, if you have multiple questionnaire documents
and/or ones which have evolved over time, you may want to use an internal question number rather than the primary survey's autonumber values.
Color Fill Set
The fill set for a graph can be set at the document level or overridden on
an individual figure. Use the Insert, Modify and Duplicate buttons to add
and edit sets. See page 250.
Text Style for Contents
Sets the base Text Style for the figure's labels and data.
Dimensions
Sets the width of the tile, placement of the figure within it, and the size of
the figure itself. See also Working with Tiles on page 39.
Chapter 14 - Figures
January 15, 2007
Figure Dialogs
191
Apian SurveyPro 4.0 User Guide
Title-Caption Tab
These titles and captions are tied to the figure, and will stay with it in the
document. You can also add titles, subheads and comments using text
graphics (see page 45) and annotations with anchored graphics (see page
49).
Caption
While in the text box, it will preview all your settings except the basic
typeface. Use the Text Palette to change the typeface, size, color, etc. You
can type up to 2000 characters, and multiple paragraphs. If you need
additional characters, insert a text graphic after the figure.
Justify
Sets the alignment of the caption within its tile boundaries and any indentation settings.
Placement
The caption defaults to below the figure. If you place it above, it will still
appear below any title text.
Title
As with the caption, allows up to 2000 characters and line breaks.
Appears centered above the figure.
Text Styles
Text Styles provide the basis for your font settings. Use the Insert pencil
point to add new styles for different types of information such as instructions, or modify existing styles to suit your needs. Remember, when a
style is changed, all tiles using it are automatically updated. If you need to
override a style for just one tile or a few letters use the Text Palette.
Autonumbering
Autonumber can be applied to either the title or the caption. See page 38.
Chapter 14 - Figures
January 15, 2007
Figure Dialogs
192
Apian SurveyPro 4.0 User Guide
Text Figures
Text figures and tables are very similar, both producing the greatest range
of statistics. Their primary use is for reporting comments and other nonrepeated text strings, but they can be applied to any scale type.
Most of the functions are covered under the descriptions of the shared
tabs starting on page 187.
Special Layout Tab Options
Written Answers
Comments and Other responses which are not tabulated may be presented as a bulleted list or a continuous paragraph with responses separated by ellipsis.
Preferred columns
When the Text Figure contains frequencies, this sets the number of columns in which they are reported (SurveyPro's automatic setting is to create the most compact layout).
Questions as
Specify whether you want the questions listed with their complete text or
just the short report labels.
Tables
Tables are the best way to present a great deal of numeric information,
particularly with complex cross-tabs. When tables are pasted into a
spreadsheet or word processing software, they will come through as editable text.
Most of the functions are covered under the descriptions of the shared
tabs starting on page 187.
Chapter 14 - Figures
January 15, 2007
Figure Dialogs
193
Apian SurveyPro 4.0 User Guide
Special Layout Tab Options
For question statistics as
By default the For question is the row, and the By the columns, but you
can swap layouts for style preferences or to better fit on a page (often this
will eliminate a wrap in a table).
Lines and Tints
Changes the style of the table.
Percents below counts
If your table includes both percentages and counts, by default they are
side-by-side in a cell. You can change this to a stacked arrangement.
Vertical Labels
Rotates the column labels for a more compact arrangement. Rescales (see
page 216) and Banners (see page 223) can also be used to edit labels.
Left Labels
Column Widths
Overrides the automatic column width settings, which are to make columns as narrow as possible given the contents and Text Style. You can set
the first column (row labels) separately from the other columns.
Table + Bars
These charts are a great hybrid of a table's numeric data and a visual representation of the responses. Table+Bars can display almost as much
information as Text and Table figures—the only absence is the Stubs.
Most of the functions are covered under the descriptions of the shared
tabs starting on page 187.
Chapter 14 - Figures
January 15, 2007
Figure Dialogs
194
Apian SurveyPro 4.0 User Guide
Special Layout Tab Options
Be sure you set the Bar Graph Portion statistic on the For Statistics tab
before overriding the axis ends.
Left/Right end
By default, SurveyPro will set the bar axis ends based on the contents,
such as 0 to 100 for percentages, or the scale end points for the mean. You
can override those endpoints by typing values in these boxes. To re-set,
simply type “auto” as the value.
Color
Select a color from the drop-down palette or click Other for more options.
Bar Chart
Bar charts are at their best when working with a single question or group,
though as with all reporting there are many uses for the figure types. If
you're cross-tabbing your bar chart, you may want to look into stacked
bars (see page 198).
Most of the functions are covered under the descriptions of the shared
tabs starting on page 187.
Special Layout Tab Options
Chapter 14 - Figures
January 15, 2007
Figure Dialogs
195
Apian SurveyPro 4.0 User Guide
2D/3D
Bar graphs are 3D by default, but you can change this for a more compact
layout.
Horizontal/Vertical Bars
With vertical graphs, SurveyPro automatically rotates any question labels
and numbers you have at the bar ends.
Show Counts/Values
Place the counts and/or values at the ends of the bars. Values are whatever you selected in the statistic tab, whether percentages, mean, etc.
Place bar labels
Unless you have extremely long labels, having them at the bar bottom is
generally the easiest way to read them.
Preferred label lines
Override the number of lines labels wrap onto to adjust spacing.
Axis
Mark the beginning and end points for the axis (typically the scale end
values), and if desired, the breakdowns in between.
Axis Indent
Type a value in inches for the start of the axis, regardless of the length of
labels at bar bottom.
Axis Length
Overrides the automatic scaling of the axis. Enter a value in inches.
Pie Chart
Pies very quickly and intuitively convey the breakdown of responses to a
single question, particularly with 10 or fewer answer options. They can
also be used for cross-tabs and larger distributions, but in those cases you
may want to look into Bar Chart on page 195 and Stacked Bars on page
198.
Most of the functions are covered under the descriptions of the shared
tabs starting on page 187.
Chapter 14 - Figures
January 15, 2007
Figure Dialogs
196
Apian SurveyPro 4.0 User Guide
Special Layout Tab Options
2D/3D
Create circular 2D pies, or angled 3Ds.
Answers
These controls are identical to those on the For Statistics tab of other figures. See page 189.
Explode wedge
Wedge 1 is the first clockwise of vertical, and you can explode as many
wedges as you like.
Labeling
Labels on pie wedges have an angled line tying them to a slice. Legends
tend to work best when there are many tightly packed slices, or with a
cross-tab where there are many pies and a single legend works for all of
them.
Counts/Percentages
Click these to display the percentages and/or counts with the slice labels.
Pie Diameter
Allows you to specify a size for the pie(s) in inches.
Chapter 14 - Figures
January 15, 2007
Figure Dialogs
197
Apian SurveyPro 4.0 User Guide
Stacked Bars
Stacked bars are the densest visual approach for cross-tabs and detailed
question group analysis.
Most of the functions are covered under the descriptions of the shared
tabs starting on page 187.
Special Layout Tab Options
2D/3D
Bar graphs are 3D by default, but you can change this for a more compact
layout.
Horizontal/Vertical Bars
With vertical graphs, SurveyPro automatically rotates any question labels
and numbers you have at the bar ends.
Answers
These controls are identical to those on the For Statistics tab of other figures. See page 189.
Show Counts
Place the counts at the ends of the bars.
Preferred label lines
Override the number of lines labels wrap onto to adjust spacing.
Axis Indent
Type a value in inches for the start of the axis, regardless of the length of
labels at bar bottom.
Axis Length
Overrides the automatic scaling of the axis. Enter a value in inches.
Chapter 14 - Figures
January 15, 2007
Figure Dialogs
198
Apian SurveyPro 4.0 User Guide
Line Chart
Line Charts have two modes: crosstab and question group. Statistic versus
Crosstab charts lines for each crosstab “by” or column. Compare Groups
is similar to the compare group pairs figure (see page 201), but offers the
ability to chart up to 8 groups or group/filter combinations.
Most of the functions are covered under the descriptions of the shared
tabs starting on page 187.
Statistic versus Crosstab For Question(s) Tab
When line graphs are in crosstab mode, two tabs appear to select the primary (For) and crosstab (By) questions or groups.
On Question(s)
The figure can be for a single question or question group.
Show
Groups can be presented as a single unit, showing each question within
the group, or both. The best choice usually depends on the type of figure
and whether you're using a cross-tab.
On Statistic
These controls are identical to those on the For Statistics tab of other figures. See page 189.
Modifiers
You can apply an optional Rescale to change the labels, grouping or structure of the selected question(s). With date and number scales you'll also
see options for quick binning into common categories, and written
answers are autopostcoded. See Modifiers & Rescales on page 216.
Chapter 14 - Figures
January 15, 2007
Figure Dialogs
199
Apian SurveyPro 4.0 User Guide
Compare Groups For Question(s) Tab
The Compare Groups mode for line graphs allows you to chart up to 8
customized lines. In this case, a question group is being graphed for the
overall results and for breakdowns by business size. Another set of lines
could be added for a second group using the same breakdowns.
Controls on the right-hand side of the dialog are driven by the item
selected in the left-hand list.
Line Items
Click the buttons below the list to rearrange, add, and remove list items.
Each line is identified with the Question Group number, any Form Select
Filter you’ve added, and then the label you specify.
Question Group
Select among existing groups or use the Insert, Modify and Duplicate buttons to add new ones. See Question Groups & Scores on page 228.
Rescale
You can apply an optional Rescale to change the labels, grouping or structure of the selected question(s). See Modifiers & Rescales on page 216
Form Selection
Form Selects subset the database based on answers to questions, form
numbers, and other criteria. Select among the Form Selects already
defined, or use the buttons to duplicate, insert, and modify filters.
Label
Set the legend labels for the chart.
On Statistic
These controls are identical to those on the For Statistics tab of other figures. See page 189.
Chapter 14 - Figures
January 15, 2007
Figure Dialogs
200
Apian SurveyPro 4.0 User Guide
Special Layout Tab Options
Line Graph Orientation
Lines may be charted horizontally or vertically in the figure.
Place Line Labels
Shorter labels work well vertically under the figure, while longer labels
may be accommodated stacked. This is for the axis labels, not the line
labels which are contained in a legend.
Preferred label lines
Override the number of lines labels wrap onto to adjust spacing.
Axis
Mark the beginning and end points for the axis (typically the scale end
values), and if desired, the breakdowns in between.
Axis Indent
Type a value in inches for the start of the axis, regardless of the length of
labels at bar bottom.
Axis Length
Overrides the automatic scaling of the axis. Enter a value in inches.
Compare Groups Pairs
Comparison graphs do simply that—compare the results for two question
groups (i.e. importance vs. performance), two demographic groups, or a
combination of the two. These can be laid out as scatterplots, bar graphs
showing differences in means, or line graphs. If you need to compare
more than two items, see the Line Chart on page 199.
Chapter 14 - Figures
January 15, 2007
Figure Dialogs
201
Apian SurveyPro 4.0 User Guide
Compare Groups Tab
Compare Between
The Custom setting is a super-set of the two more common applications:
comparing two groups or comparing two respondent segments across
one group.
Question Group
Select among existing groups or use the Insert, Modify and Duplicate buttons to add new ones. See Question Groups & Scores on page 228.
Rescale
You can apply an optional Rescale to change the labels, grouping or structure of the selected question(s). See Modifiers & Rescales on page 216
Form Selection
Form Selects subset the database based on answers to questions, form
numbers, and other criteria. Select among the Form Selects already
defined, or use the buttons to duplicate, insert, and modify filters.
Label
Set the legend labels for the chart.
On Statistic
These controls are identical to those on the For Statistics tab of other figures. See page 189.
Special Layout Tab Options
Layout settings are driven by the Graph Type in the upper-left corner. In
particular, the settings below and to the right of the Graph Type will
change greatly based on the chart style.
Below are the settings for X-Y Scatterplot as that is the unique layout for
this figure. The controls for the bar and line styles overlap with layout
options for Bar Chart on page 195 and Line Chart on page 199.
Chapter 14 - Figures
January 15, 2007
Figure Dialogs
202
Apian SurveyPro 4.0 User Guide
Graph Type
The best way to determine which style suits your report is to try a few settings, edit the figure, try a few others, and so on.
Hide axis numbers
Removes the axis numbers from the scatterplot, leaving only the distribution of dots.
Grid as quadrants
Adds quadrant lines within the scatterplot.
Scatter marks
Switches between colored dots and lettered points for black and white
reproduction.
Preferred label lines
Override the number of lines labels wrap onto to adjust spacing.
Axis
Mark the beginning and end points for the axis (typically the scale end
values), and if desired, the breakdowns in between.
Axis Indent
Type a value in inches for the start of the axis, regardless of the length of
labels at bar bottom.
Axis Length
Overrides the automatic scaling of the axis. Enter a value in inches.
Chapter 14 - Figures
January 15, 2007
Figure Dialogs
203
Apian SurveyPro 4.0 User Guide
Data Table Figure
Data Tables are a more flexible version of the Data Table report. You can
also intermix them with other figures in a longer report, such as a figure
containing comments along with the respondent name and the rating they
gave service.
Contents Tab
Select among a few key questions or include them all.
Data Table For
By default, the dialog lists all questions in the survey with Show All and
Show None buttons for quick marking or clearing of the list. Select Full
Control to switch to a Stub List mode where you can change the sort
order and labels for each column (see page 206).
Questions and Form
Properties
Lists all questions in your project, as well as question groups and system
fields such as the form number and date/time stamp.
Form Selection
Select the forms you'd like to include by a form number range or with a filter. See page 212.
Sort On
Sort the data using up to three questions, including ones which are not
shown in the table.
Chapter 14 - Figures
January 15, 2007
Figure Dialogs
204
Apian SurveyPro 4.0 User Guide
Special Layout Tab Options
Data Tables are primarily designed for content, and have just a few layout
settings.
Boxes
Sets whether to display the checkbox number, the 1 or 2 digit legends, or
the full text label. If you'd like to modify the legends, go back to the Scale
definition (see page 72).
Show Other Text
Select to include the text of Other responses as well as the number of people who marked an Other box.
Show row numbers
Numbers each row of the table. Another option is to include the Form
Number for each respondent.
Force Breaks At
Allows you to specify row and column numbers at which you would like
the table to break.
Columns
Override the default spacing with the minimum and maximum column
widths, as well as the maximum number of lines to wrap a cell.
Figure Type
Select Bulleted Text for a format which focuses on an individual respondent and allows for a great deal of data. Select a Table format for a more
compact view which also copies and pastes well into spreadsheet software.
Chapter 14 - Figures
January 15, 2007
Figure Dialogs
205
Apian SurveyPro 4.0 User Guide
Stub List Dialog
Stub lists are used to select multiple questions for inclusion in a text figure
or table. Unlike Question Groups, stub lists do not have to have compatible scales—you can assemble any combination you like. Stubs are not
named items, so if you'd like to reuse one, copy and paste the figure, then
make edits on the copy.
Add/Insert/Remove
Click to add and remove items from the master list of questions to the
stub list for this figure.
Questions and Groups
The list will display questions and groups, to be added to the Stub list. At
the bottom of the list, you can insert, modify and duplicate groups.
Items in this figure
Type edits directly into the grid rows. To rearrange items, click on the
gray box at the left of the row once to select it, then click and drag, releasing when the red line is where you want the item to go.
Clone Figures Dialog
Accessed from the Insert menu.
Use Clone Figure to quickly replicate a figure for several other primary
questions (the For Question tab). Note you can also copy/paste figures for
just one or two, and you can embed the results for several questions in a
single figure with Stubs (see page 206) or Groups (see page 228).
Unlike questions where copying and pasting between documents maintains a link (see page 83) copied figures are completely independent and
can be freely edited.
All you have to do is select the items you want to use in the right column,
decide whether you want a page break before each one (removable later
using the Breaks dialog), and click OK.
Chapter 14 - Figures
January 15, 2007
Stub List Dialog
206
Apian SurveyPro 4.0 User Guide
Statistics in SurveyPro
When you look in the figure dialogs, you’ll see up to three groupings of
statistics: Frequency Measures, Statistical Measures, and Significance
Measures. (The specific controls which appear depend on the figure type
and questions.) In many cases, you may apply more than one statistic to a
figure. For example, with a table you could include a half dozen calculations, and even a bar chart graphing percentages could add the counts at
the end of the bars.
Depending on the content of the survey, decision being made, and statistical knowledge of the decision makers, it’s entirely possible that the Executive Summary report containing only frequency measures is a perfect fit.
Greater statistical complexity does not always enhance the decision-making process.
Frequency Measures
Frequency measures are simply counts and percents, and cumulative percents. The other settings in this section affect what is being counted and
how it is being ordered.
Counts and percents will also appear in the Figure dialog’s By
Crosstab/Filter tab when you have a crosstab selected. Some charts also
have the option of adding counts and percents to the graphic
Counts
The number of respondents who marked each answer.
Percents
Calculated as the number of respondents to a question divided by the
total number of replies to that question.
Chapter 14 - Figures
January 15, 2007
Statistics in SurveyPro
207
Apian SurveyPro 4.0 User Guide
Cumulative %
Applied to ordered scales, by arranging them in order, then keeping a running total of the individual percentages. A specific cumulative percentage
is referred to as a “percentile.”
With No Answers
Adds an answer category reporting on how many people didn’t answer. If
this is turned on, it affects the number of replies by which percentages are
divided.
Sorting
When applied to unordered scales, Sort orders responses alphabetically
(written scales), in scale order, or by frequency. It can also be used to simplify figures, reporting on only the most common responses.
Move counts at or under ___ As with Sorting, Move counts simplifies figures by reducing the number of
answers being analyzed. A setting of “0” will force SurveyPro to report
into Others
every answer, including singles, while increasing the threshold will display
only the most common responses.
Statistical Measures
Where frequency measures look at individual responses, statistical measures tend to look at a question as a whole. Measures include:
Mean
Also known as the average, the mean is the sum of all responses divided
by the number of responses. For checkboxes, the mean is based on the
box number, and depending on the scale order, a low mean may be better
than high.
Median
For continuous data (dates, numbers) you arrange all the responses in
order and go halfway down the list to find the “middle” value (equal to
50th percentile). For checkbox and rating scales, a formula is used to calculate how far into a bin the middle would fall, so you will see a number
like 2.3 instead of simply 2. The median complements the mean, as it is
less likely to be distorted by a few extreme responses.
Standard Deviation
Standard deviations calculate a range around the mean in which 68% or
95% of your respondents replied. For example, if your mean were 30 and
your 95% standard deviation ±8, then all but 5% of your respondents
answered between 22 and 38.
Forms/Replies
Forms is the total number of forms in the database, while Replies is the
number of people who marked a particular question.
Top/Bottom Box
If you just want to know how many people were happy, you would select
Top Box, or Top 2 Boxes, and SurveyPro would produce a number for
everyone who marked Excellent and Good. While this is a handy snapshot, focusing only on the top or bottom boxes can be misleading.
Chapter 14 - Figures
January 15, 2007
Statistics in SurveyPro
208
Apian SurveyPro 4.0 User Guide
Minimum/Maximum
These can be applied to any ordered scale, including checkboxes, but tend
to be used most for reporting the highest and lowest answers to number
and date questions.
Sum
The sum is a total of all answers, and most commonly applied to number
scales (you may also want to take a look at scoring on page 228). Sums
can also be applied to other ordered scales, where they will produce a
weighted total (3 replies * box 1 = 3, +, ...).
Significance Measures
Significance measures look at the data in your file—the data reported by
frequency and statistical measures—and estimate how accurate it is for
predicting the people who didn’t reply. If you have a census (100%
response rate) or close to it, then there’s little need for these predictions.
When significance measures produce an estimate, they do so to a degree
of certainty. For confidence intervals and standard error of the mean, you
select a certainty of 68% or 95%. Chi-square on the other hand, tells you
the likelihood that there is a relationship.
Confidence Interval on
Frequencies
A statistic frequently seen in newspaper polls, this provides a range
around percentage frequencies.
Standard Error of Mean
Calculates a range around the mean into which the population should fall
with 68% or 95% certainty. This will be a wider range than the standard
deviation which only reports on the data in your file.
Chi-Squared
In a crosstab, patterns will appear, such as a relationship between the frequency someone purchases and their satisfaction. Chi-squared (pronounced “kai”) tells you the likelihood that the relationship is a real
pattern and not just random noise. (See Crosstabs & Banners on page 223.)
Chapter 14 - Figures
January 15, 2007
Statistics in SurveyPro
209
REFERENCE
Chapter Contents:
Chapter 15 - Analysis Components
January 15, 2007
Chapter 15
Analysis Components
Slicing, Dicing, and Rearranging Data . . . . . . . . . . . . . . . . . 211
Form Select Filters . . . . . . . . . . . . . . . . . . . . . . . . . . . . . . . . 212
Form Select Filter Dialog . . . . . . . . . . . . . . . . . . . . . . . . . . . 213
Sample Weights Dialog . . . . . . . . . . . . . . . . . . . . . . . . . . . . 215
Modifiers & Rescales . . . . . . . . . . . . . . . . . . . . . . . . . . . . . . 216
Rescale Dialog . . . . . . . . . . . . . . . . . . . . . . . . . . . . . . . . . . . 217
Written Answers Tab . . . . . . . . . . . . . . . . . . . . . . . . . . . 217
Number Inputs Tab . . . . . . . . . . . . . . . . . . . . . . . . . . . . 219
Date-Time Inputs Tab . . . . . . . . . . . . . . . . . . . . . . . . . . 219
Answer Mapping Tab . . . . . . . . . . . . . . . . . . . . . . . . . . . 220
Output Bins Tab . . . . . . . . . . . . . . . . . . . . . . . . . . . . . . . 222
Crosstabs & Banners . . . . . . . . . . . . . . . . . . . . . . . . . . . . . . 223
Banner Dialog . . . . . . . . . . . . . . . . . . . . . . . . . . . . . . . . . . . 225
Question Groups & Scores . . . . . . . . . . . . . . . . . . . . . . . . . . 228
Question Groups Dialog . . . . . . . . . . . . . . . . . . . . . . . . . . . . 232
Select Items Tab . . . . . . . . . . . . . . . . . . . . . . . . . . . . . . 232
Edit Items Tab . . . . . . . . . . . . . . . . . . . . . . . . . . . . . . . . 233
Points Tab . . . . . . . . . . . . . . . . . . . . . . . . . . . . . . . . . . . 234
Weighting Tab . . . . . . . . . . . . . . . . . . . . . . . . . . . . . . . . 236
Output Bins Tab . . . . . . . . . . . . . . . . . . . . . . . . . . . . . . . 237
Report On . . . . . . . . . . . . . . . . . . . . . . . . . . . . . . . . . . . . . . 238
Report On Dialog . . . . . . . . . . . . . . . . . . . . . . . . . . . . . . . . . 240
210
Apian SurveyPro 4.0 User Guide
Slicing, Dicing, and Rearranging Data
The figures and statistics are just the beginning of SurveyPro’s analysis.
Everything covered already can be enriched by comparing answers from
one group of respondents against another’s or just looking closely at one
group.
Here are some ideas of what you can do with SurveyPro:
•
Create a figure analyzing a subset of the respondents, such as just the
females, with Form Select Filters (see page 212).
•
Add questions or other dimensions to a crosstab with a banner (see
page 223)
•
Run a report for the latest quarter’s data, or repeat the report for every
quarter, using Report On (see page 238)
•
Show differences between related questions—typically done by
looking at means, medians, or perhaps the percentages of who
marked the best or worst choices. Most often, the related questions
are in a grid, and analyzed with a Question Group (see page 228)
•
Include more than one question in a table row, also known as using a
stub list, as covered in Breaking Data Down on page 268.
•
Change the labels on the questions to make labels and graphs
clearer—there are two places for this: Report Labels under the Edit
menu, as well as in the individual question tiles. In many places,
question labels can be overridden for an individual figure. Scale
answer labels can be selectively edited using Rescales (see page 216).
•
Combine answers into categories using Rescales (see page 216).
•
Change the way statistics are computed or scored by modifying the
values underlying the labels—another Rescale (see page 216).
•
Score a test for a total, or calculate a score for a satisfaction index on
a survey or other application with Groups (see page 228).
Creating a Report on page 253 and Breaking Data Down on page 268 will
introduce you to more possibilities, as well as getting hands-on with
Rescales, stubs, and other tools.
Chapter 15 - Analysis Components
January 15, 2007
Slicing, Dicing, and Rearranging Data
211
Apian SurveyPro 4.0 User Guide
Form Select Filters
Form Select Filters are used in both Answer Entry and analysis, although
they are most commonly applied to reports. For example, you would create a figure analyzing respondents over age 55, or people who answered
an open-ended question. You can also apply a Form Select to an entire
report at once through Report On (see page 238).
Filters are one of the named components you’ll find under the Object
Tree (see page 15), so once you define a filter it can be reused for many
figures. When using filters for data cleaning or experimentation, it’s often
useful to create a filter called “Working” which is edited again and again
as needs change.
Form Select structure
Filters are in the format:
Item
Relation
Value
Q5
=
“500-999”
Items can be questions (with or without Rescale), document names, entry
date and time, or even another Form Select Filter.
Relationships are things like =, <, >, and not equal.
Values are the pre-set scale options, existing data, or hand-typed data as
in this range.
Building Filters
As with other components in SurveyPro, filters are most frequently
inserted and edited through the dialogs that use them—just look for the
insert button next to the filter drop-down list. If you need a similar figure,
and don’t want to alter the original, use the duplicate (camera) button.
The right-hand side of the Form Select dialog is a point-and-click interface
for building filters. This is the best approach to create a filter, even if you
plan on hand-editing it later.
Chapter 15 - Analysis Components
January 15, 2007
Form Select Filters
212
Apian SurveyPro 4.0 User Guide
Form Select Filter Dialog
While filters can be manually constructed using the text box on the left,
the easiest approach is to have SurveyPro build it. The AND rule pictured
below selects all auto commuters who drive more than 45 minutes. It’s
built with the following steps:
1. Select the first question from the upper right drop-down list—in this case Q5
Commute length.
2. Click >= Greater-Equal.
3. Select 45 (minutes) from the list.
4. Click the button labeled Insert on the left side.
5. Click AND to add the parentheses.
6. Select the second question, Q11 Commute via.
7. Click = Equal.
8. Select checkbox 1, Car.
9. Click your mouse inside the second set of parentheses.
10. Click Insert.
You'll find it takes longer to read these instructions than to create the rule
itself. If you create complex rules with many ANDs and ORs, be very
careful to check your parentheses.
It's always a good idea to use the Test Rule button to check your syntax
and see if you're getting about the right number of forms.
Chapter 15 - Analysis Components
January 15, 2007
Form Select Filter Dialog
213
Apian SurveyPro 4.0 User Guide
Name
Filter names can be up to 200 characters and will appear in figures
(though some figures allow label overrides).
Selection Rule
The actual specification of what forms to find. Rules can be created or
edited by hand, but generally it's easiest to build them with the right-hand
panel.
Test Rule
Provides either the number of forms it found or an error statement if it has
a problem with the rule's syntax.
And/Or
Add parentheses around the existing rule, the word AND or OR, and an
empty set of parentheses at the end of the rule. Depending on the rule you
are constructing, you may need to adjust the parentheses.
Insert
Transfers the rule you constructed on the right-hand side into the text
box. If the Insert button is grayed out, you need to first click in the text
box to tell it where to insert.
Sample Weights
An advanced capability to correct for sampling biases. See page 215.
Pick a Question or Form
Property
Lists the questions in the file, form attributes such as the date/time stamp
or questionnaire, and any Form Selects you have already defined.
Rescale
Applies a rescale to the question, handy if you have already grouped some
checkboxes into categories, or dates and numbers into ranges. When a
rescale is applied, it will read R7(Q3) in the rule, meaning the 7th rescale
applied to the 3rd question. See page 216.
Pick a Relationship
Sets the relationship between the question or form attribute and the value.
Equal Only == will pull a response which is exactly equal to the selected
Value, and equal to no others (applies primarily to multiple answer checkboxes and written answers).
Pick Value
Lists the values applicable to the selected question/rescale combination.
Dates and numbers without a rescale will list the actual data. Written
answers and patterns give you the option of displaying the whole Answers
or extracting Keywords to fill the value list. Form Selects can be True or
False. If the value you need is not listed (such as January 1, 2007) you can
select a similar value to get the correct syntax, then edit the value within
the Selection Rule box.
Chapter 15 - Analysis Components
January 15, 2007
Form Select Filter Dialog
214
Apian SurveyPro 4.0 User Guide
Sample Weights Dialog
Sample weights are a specialized capability for correcting sampling biases
or for forcing a bias to favor a respondent sub-group. They should be used
with care or the results will be a distortion rather than an improvement.
Related to Sample Weights are Scores for answers.
This is a weighting of the samples; it weights all the answers in each form.
Sometimes the term “weights” is used instead for assigning values to
responses for statistical or test evaluation purposes, which Survey Pro
does through rescales (see page 216) and scoring (see page 228).
The sample weights in Survey Pro are tied to a form select to allow for the
cases where the bias differs from one part of the database to another, say
differing by quarter on a repeated survey. The sample weighting will only
be applied to a figure where its parent form select rule has been applied.
Since you can leave the actual selection rule blank, you can still apply
weights to all forms.
If you want to weight an entire document, you can apply a Form Select
Filter through the Report On settings (see page 238). The Sample Weights
button displays the dialog below, which shows one weighting question set.
Pick 1 to 3 Questions
You can set 1, 2 or 3 questions to weight. Each pull-down list contains all
the questions using single answer scales. A multiple-answer scale or
rescale cannot be used for sample weights. The Set column of radio buttons determines which question’s weights are being edited.
The order of the questions does not matter, just like any other multiplication problem. Thus if you correct on both Gender and Age questions, it
Chapter 15 - Analysis Components
January 15, 2007
Sample Weights Dialog
215
Apian SurveyPro 4.0 User Guide
adjusts for Age and for Gender as separate ratios, then multiplies them
when they overlap.
Set based on
You can set target frequencies, as for correcting demographic imbalances,
or weights, such as when you want to emphasize one group's contributions. This setting determines which fields are active in the lower section
of the dialog.
Form weights by question
answer
When adjusting the Target Frequencies, as shown here, you will be provided with the distribution (subset by the parent Form Select Filter). You
must make the target frequencies add up to 100%. The last column,
Weight, is for your reference and calculated automatically by SurveyPro.
When you set Weights Directly, SurveyPro ignores the sample’s frequencies and target, leaving the right side with two columns.
In either case, you can then edit the Target or Weight by clicking to select
it and then typing in the box below. Enter will automatically drop you to
the next answer to be weighted.
Modifiers & Rescales
Rescales add a layer on top of a question, allowing you to change the way
data is grouped, ordered, and valued. Examples include:
•
Combining Zip codes into regions
•
Changing the labels on a scale
•
Setting custom values for computations (instead of 1,2,3,4, perhaps 1,
4, 7, 10)
Since it isn't changing the question or data, you can still analyze responses
in their original format or use as many different Rescales as you need.
In addition the custom Rescales you can build, most figures include several Modifiers which can be used to quickly group dates into months, or
numbers into ranges.
Building Rescales
Rescales are most frequently inserted and edited through the dialogs that
use them—just look for the insert button
next to the filter drop-down
list. Rescales are tied to a specific scale type, so only the ones which are
valid for the current question will appear in the list.
Chapter 15 - Analysis Components
January 15, 2007
Modifiers & Rescales
216
Apian SurveyPro 4.0 User Guide
Rescales are built in four stages:
1. Selecting the scale or scale type to which it will apply
2. Processing the raw responses for written answer, number or date/time scales
3. Setting the mapping/grouping/binning of the responses
4. Adjusting the output labels and values
Rescale Dialog
Checkbox and rating scales already have a set of fixed answers, so you
simply use the Answer Mapping Tab on page 220 to combine responses,
and Output Bins Tab on page 222 to adjust labels and values. For other
scale types, you need to create sets of responses first. See Written Answers
Tab in the next section, Number Inputs Tab on page 219 and Date-Time
Inputs Tab on page 219.
See also Modifiers & Rescales on page 216.
Written Answers Tab
Written answers can be rescaled in their entirety, or you can work with
prefixes, suffixes, or keywords (such as area codes). To construct the Rescale, you first need to create the raw answer inputs, which will be used by
the other two tabs beginning on page 220.
For written answers in particular, it is much easier to construct a Rescale
if your data has been cleaned. There are also circumstances where postcoding is a better approach than Rescales. See Data Cleaning on page 123.
You can build your Raw Answer list by extracting responses from one or
more written answer questions, or manually by typing answers. To
Chapter 15 - Analysis Components
January 15, 2007
Rescale Dialog
217
Apian SurveyPro 4.0 User Guide
remove items, simply select them in the list and click Delete Selection.
Note that the order does not matter at this point, just the content.
Search Database For
Whole Answers work well for short entries, like product names and locations. Keywords work best for longer comments. Prefixes and suffixes are
best for IDs, Zip codes, and telephone numbers.
Add All Answers to Question Select the question from which to extract responses. You may select more
than one question, clicking Add after each one.
Add Typed Answer
Manually construct or modify the list by typing entries not yet in your
database.
Edit Raw Inputs
Undo the last addition, delete a term in the list, or completely clear the
list.
Raw Answers As Inputs
Includes all answers you wish to use in the rescale. Answers not included
will be ignored in figures which use the rescale.
Chapter 15 - Analysis Components
January 15, 2007
Rescale Dialog
218
Apian SurveyPro 4.0 User Guide
Number Inputs Tab
You can enter the endpoints and increments, manually enter the bin
edges, or both. Don't worry about the Below and Above values if you
won't need them—they can be taken care of in the Answer Mapping Tab
on page 220.
Format Default
Sets the sensitivity of the bin edges, and will not necessarily be displayed
in the final outputs.
Add Edges from Range
To quickly set ranges, enter low and high values, along with how often
you'd like them broken. You can always manually add bins above, below,
and in the middle.
Add Bin Edge
Bin edges are the inclusive upper edge.
Edit Raw Inputs
Undo the last addition, delete an edge point in the list, or completely clear
the list.
Raw Answers As Inputs
Includes all answers you wish to use in the rescale.
Date-Time Inputs Tab
The main figure dialogs allow you to group dates into days, weeks,
months, quarters and years, and times into several intervals, so you only
need to define a Rescale when you need special periods.
Note that you can rescale a sub-set of a date/time scale. For example, if
you were collecting the date and time someone visited, you could create
Chapter 15 - Analysis Components
January 15, 2007
Rescale Dialog
219
Apian SurveyPro 4.0 User Guide
one rescale which grouped respondents by the time of day, and a separate
rescale grouping them by month.
Bins Based On
Select whether you're rescaling the dates, times, or both, and the formats
you'll use for your Rescale. The format does not have to match the scale
definition's.
Add Automatic Bins
Select whether you're rescaling the dates, times, or both, and the formats
you'll use for your Rescale. The format does not have to match the scale
definition's.
Add Bin Edge
Type here to manually add a date/time bin edge in the format you specified above.
Edit Raw Inputs
Undo the last addition, delete an edge point in the list, or completely clear
the list.
Raw Answers As Inputs
Includes all categories you wish to use in the rescale.
Answer Mapping Tab
This screen serves two functions:
•
Grouping the Raw Answers
•
Ordering the Output Bins (can also be done in the Output Bins tab)
The way this works can get a little tricky, but here's a typical scenario:
1. Scroll through the list on the left and select responses you want in one
category, such as California, Washington and Oregon. Click Combine which
results in all their Output Bins changing to a common “1: <Untitled>.”
Chapter 15 - Analysis Components
January 15, 2007
Rescale Dialog
220
Apian SurveyPro 4.0 User Guide
2. Click on the “1: <Untitled>” bin label and click First to bring it to the top of
the list—note that the left list was reordered as it brought its items with it.
3. Switch to the Output Bins tab to assign a name to your new bin.
4. Switch back to Answer Mapping to create another group.
5. Combine another bin, but notice you missed an item, so click on the Answer
you need to add, then click on the Output Bin, and click Combine again.
6. Combine a third bin, but notice you had an extra item, so click on that extra
in the Answers column, then click on the Output Bin you need to extract it
from, and click Split.
Raw Answers
Lists all the checkboxes or rating levels in the scale, or the answers you
set up in the first tab for Written Answer, Date or Number scales.
Output Bins
If you are grouping several Raw Answers into new Output Bins, this column will show the new categories. When you first combine categories,
they show as “Untitled.”
Select
Use the column next to the Raw Answers bin to mark several Raw
Answers you want to Combine. Or use the column next to Output bins to
select a bin you want to Split, or to rearrange the items.
Combine
Combines any checked Raw Answers together into a new Output Bin, or if
a bin is also selected, combines the answers into that bin. Any answers
combined with No Answer will be treated like missing responses in figures.
Split
Splits an Output Bin apart into its original Raw Answers. If you have specific Raw Answers checked, it will split them out selectively.
Chapter 15 - Analysis Components
January 15, 2007
Rescale Dialog
221
Apian SurveyPro 4.0 User Guide
Sort
Sorts the lists in order of the label number.
Up/Down/First/Last
Arranges the Output Bins, moving them up, down, and to the top and bottom of the list. Note that a bin consisting of many Raw Answers moves as
a single unit (clearer if you sort on the outputs).
Output Bins Tab
It's very helpful to alternate between this screen and the Answer Mapping
if you're doing a lot of rearranging to your scale.
This is the final step, where you set labels, values (for means, scoring,
etc.), and legends.
Rescale Name
Rescale names are displayed in some figures, so it helps to make this
descriptive.
List of Bins
Includes a row for each Output Bin from the Answer Mapping tab. If
you’ve combined categories, this will come in as empty, so use the gray
area in the lower-left corner to see what it contains.
Value
By default Rescales have no values, so they will only produce frequencies,
but you can override this with automatic values or custom ones. When
Set Own Values is selected, that column in the grid becomes active, and
you can type them in.
Legend
Legends are used in a few figure types. Turn off Automatic Legends to
activate this column.
Chapter 15 - Analysis Components
January 15, 2007
Rescale Dialog
222
Apian SurveyPro 4.0 User Guide
Extended edit
While in the text box, you can use the Text Palette (see page 44) to change
the typeface, size, color, etc. You can type up to 200 characters in a single
line/paragraph.
Output has input(s)
Offers a peek at the items you've grouped into the selected bin.
Up/First/Down/Last
Arranges the Output Bins, moving them up, down, and to the top and bottom of the list.
Statistical Values Out
By default Rescales have no values, so they will only produce frequencies,
but you can override this with automatic values or custom ones. When
Set Own Values is selected, that column in the grid becomes active, and
you can type them in. See Selecting Scales on page 69.
Automatic Legends
By default SurveyPro uses a simple alphanumeric legend for reports, but
you can override this with your own 1-2 digit labels.
Sort Outputs Low-best
Applies in analysis when you're working with top box and bottom box settings, and simply tells SurveyPro whether you consider the first answer to
be best (top) or worst (bottom).
Crosstabs & Banners
If you’ve read a magazine’s poll results, you’ve seen a crosstab. It’s simply
a comparison of the responses to one question against another:
In this table, the number of store visits was selected on the For Questions
tab, then Store Credit Account was selected on the By Crosstab/Filter tab.
When you look at the data, it appears cardholders visit more frequently,
but the Chi-Squared (Ch Sq) of “Under 50%” indicates that’s likely to be
random variation, not a reliable relationship. The table also has an automatically generated footnote that the results could become more certain
with more responses.
Chapter 15 - Analysis Components
January 15, 2007
Crosstabs & Banners
223
Apian SurveyPro 4.0 User Guide
Generally you’ll want to analyze crosstabs with percentages, since they
make it easier to see the relationships and not be distracted by significantly different response numbers. In the example above, note the dramatic difference between the number of respondents in the three
categories (in gray bar), which would make finding patterns with counts
very difficult.
SurveyPro will apply crosstabs to most figure types, although it’s better
suited to some than others (see page 185).
Banners
Banners are commonly used to create crosstabs, but they can also be
used for much more. A Banner is another SurveyPro Component, in this
case a saved definition of one or more column specifications. Yes, they
can be applied to pie charts as well, but it’s easiest to describe them in
terms of columns.
The simple crosstab example in Banner form would consist of two items:
the first a Filter item to select all forms for the Overall, and the second a
2D crosstab using the Trip Purpose question. For this case, it’s clearly
simpler to use a regular crosstab, but what about stacking another 2D
crosstab next to Trip Purpose? Or another Form Select column, this time
restricted to last quarter’s responses? Or a 3D crosstab comparing the
Amenities question against two others at once? Banners can contain up to
500 columns, and while a crosstab could produce several columns, that
still leaves plenty of room for heavy-duty analysis. Since they’re named
components, you only have to define a Banner once, then it’s available in
almost any figure type.
Another advantage of Banners is that you can completely customize the
labeling, even adding additional headings across multiple items.
As with other components in SurveyPro, Banners are most frequently
inserted and edited through the dialogs that use them—just look for the
insert button
next to the filter drop-down list.
Breaking Data Down on page 268 creates a Banner (among other table
tricks), and the full description of the dialog controls is in the Help system.
Chapter 15 - Analysis Components
January 15, 2007
Crosstabs & Banners
224
Apian SurveyPro 4.0 User Guide
Banner Dialog
Banners are a very flexible mechanism for defining cross-tabs within
SurveyPro. Banners allow you to run a cross-tab on combinations of questions and/or form selection filters, as well as providing control over labeling and certain tabulation features beyond the basic Figure Definition
dialog. Like Question Groups and Form Select Filters, Banners are named
building blocks, so once you define one you can select it from any figure
dialog.
The easiest way to think of a banner is in a basic cross-tabulation table
where the cross-tab appears across the top of the table columns. So even
though banners can be used with graphs and Report On, we will use the
terminology of columns throughout this section.
In SurveyPro, a banner consists of a series of items where each item can
be a Form Select, a 2D cross-tab question or a 3D set of nested cross-tab
questions. If you have used a simple cross-tabulation question in the main
Figure Edit dialog, then you have already seen a simple 2-item banner
consisting of an optional “Overall” column and a 2D cross-tab question.
The settings below would produce the following columns:
•
Database-wide values
•
Western region (Form Select 5) values
•
A set of columns, one for each quarter, for the Western region (2D
Crosstab using Q3 with FS5)
The grid in the upper portion lists the banner items, each one of which
could be one or many columns. When you click on a banner item you can
change its type from filter to 2D or 3D cross-tab, modify the questions, or
change the Labels and Modifiers.
Chapter 15 - Analysis Components
January 15, 2007
Banner Dialog
225
Apian SurveyPro 4.0 User Guide
Name
The banner name is used both as a reference in dialogs and in figures.
Shorter names are typically best.
Item List
Lists the items currently defined in your Banner with an internal label
reflecting their contents. Click the buttons to the right to add new items at
the end (+), insert above, or delete. To rearrange items, click on the gray
box at the left of the row once to select it, then click and drag, releasing
when the red line is where you want the item to go.
Sort On
Sorts the figure's rows based on the selected item's values. Does not apply
when the figure's primary question is an ordered scale.
Labels
Allows you to override the default column labels, as well as to set “heading” labels across multiple banner items. See below.
Item Type
Items can be a simple filter, a 2D cross-tab which breaks down with one
question, or a 3D which breaks down by two questions. For example, a 3D
cross-tab using gender and Yes/No would result in columns for Female
Yes, Female No, Male Yes, and Male No.
Form Select Filter
Form Selects subset the database based on answers to questions, form
numbers, and other criteria. Select among the Form Selects already
defined, or use the buttons to duplicate, insert, and modify filters.
Crosstab
List of all questions in the project.
More
You can apply an optional Rescale to change the labels, grouping or structure of the selected question(s). See below.
Chapter 15 - Analysis Components
January 15, 2007
Banner Dialog
226
Apian SurveyPro 4.0 User Guide
Labels in Banner Dialog
Another reason for using a Banner instead of a simple cross-tab is that
you have complete control over the labeling. In addition to overriding the
labels for any filters and questions, you can also create header labels that
stack above the columns.
If you use a Header label, it will go continuously across all adjacent banner items specifying the same label. Note that this dialog applies only to
the currently selected banner item.
Modifiers in Banner Dialog
These settings are scale dependent, so you may not see all for all questions. They apply only to the selected question, so you make settings for
each question in a 3D cross-tab independently.
Modifiers
You can apply an optional Rescale to change the labels, grouping or structure of the selected question(s). See Using Modifiers for all the details.
With date and number scales you'll also see options for quick binning into
common categories, and written answers are autopostcoded.
Chapter 15 - Analysis Components
January 15, 2007
Banner Dialog
227
Apian SurveyPro 4.0 User Guide
With No Answers
Check this to add a category for missing responses, so your cross-tab
breakdown would be Female/Male/No Answer.
Show Empty Crosstabs
In some circumstances the combination of data, cross-tab setting, and
Form Select can create empty cross-tab categories, such as quarters or
states with no data. Check this box to display those missing categories.
Sorting
Sorting options apply to unordered scales (written, pattern and unordered
checkboxes). By default all responses will be displayed, but you can override this to show only the 5 most popular answers, or only answers with a
minimum number of responses—in either case, the rest will be grouped
into an “Other” category.
Move counts at or under ___ By default, SurveyPro will count all repeated responses to Other blanks
and short written answer scales (including telephone and Zip pattern
into Others
scales). Use this setting to adjust the number of times an answer has to be
provided before it shows as a unique response or is combined with other
outliers into “Other.”
Question Groups & Scores
Question groups are collections of questions which are analyzed collectively. There are three types of groups which produce significantly different figures and statistics.
On Scales/Rescales
These are the simplest of the groups, basically just a grouping of questions for common analysis. Typical applications of this type of group are
importance/performance scatterplots, bar graphs of group means with an
overall line, and frequency distributions. This is the type of group automatically created from question grids.
Whenever you create a question grid, SurveyPro will create a group for
each of the scale columns, and these groups can be modified for any
required label overrides.
Unlike the scoring groups, On Scales/Rescales requires the scales have
compatible structures so they can be analyzed together:
Checkbox
Same scale (based on ID, not labels)
Ratings
Same end-points, such as 1 to 5 or -3 to 3
Forced Rank
Same number of levels
Chapter 15 - Analysis Components
January 15, 2007
Question Groups & Scores
228
Apian SurveyPro 4.0 User Guide
Written Answers and Patterns
Same rescale must be applied to all questions
Dates
Same rescale
Numbers
Same rescale
Point Scores
Point Scores can be used for exams, or for certain types of assessments
such as risk level for a disease. Compared to Weighted Scores these
groups are quite straightforward.
In our example here, we're looking at a sample adrenaline addiction
assessment:
This is very straightforward, since we just want to give True 1 point, and
False or No Answer 0. Whenever you have a situation like this, you only
need to set the points for one question, and then you can apply them to all
others with the same scale.
In other cases, you may have a mix of scale types, and have to address
each answer individually. Values can be either positive or negative, so if
you wish to discourage guessing, wrong answers could have -0.25 points
on the Points tab
When SurveyPro computes the score for this respondent, it will simply
total the points for each question marked (including multiple answer
checkboxes).
Scales can be of any type, though written, pattern, date and number
scales require a rescale to “bin” them before applying points.
The point scores themselves can also be “binned” into ranges (similar to a
rescale or other modifier), such as grade ranges or addition levels in our
example. This is very useful if you're planning on cross-tabbing the scores
against other questions or want to apply plain text labels to score ranges
on the Output Bins tab.
Chapter 15 - Analysis Components
January 15, 2007
Question Groups & Scores
229
Apian SurveyPro 4.0 User Guide
Weighted Scores
To illustrate the way weighted scores work we'll look at creating a “satisfaction index” for a spa survey. The questions we're working with are a
rating grid and a yes/uncertain/no scale. Scales must be discrete and
have values, so you may need to apply rescales to some of your own questions (such as written answer and number scales) when creating your
groups.
Weighted scores take the answers for each respondent and create a
numeric score for that respondent. While the score won't appear on their
form in Answer Entry, you can treat it like any normal number question
for analysis. This means the scores can be reported respondent-byrespondent in a data table figure, or analyzed across all your respondents
with means, medians, cross-tabs, and other tools.
In this example we have a mix of scales, so while the best answer for the
grid is a 4, the best possible answer for Q7 is only a 3. To eliminate this
distortion, we can convert all values to a 1-10 range on the Weighting tab
(don't worry, SurveyPro calculates the intervening values).
Question
Scale Value
Converted 1-10 Value
Q1-Q5
4
10
3
7
2
4
1
1
Chapter 15 - Analysis Components
January 15, 2007
Question Groups & Scores
230
Apian SurveyPro 4.0 User Guide
Question
Scale Value
Converted 1-10 Value
Q7
3 Yes
10
2 Uncertain
5.5
1 No
1
While we could consider each question equally important, it's more common with this type of group to “weight” certain questions as more or less
important. In our case, we want to make the referral question, Q7, twice
as important as the others, and Q5 regarding refreshments half as important. If you look in the table below, you'll see this reflected by weights of 1
for Q1-Q4, 0.5 for Q5, and 2 for Q7 (by default, SurveyPro gives all questions a weight of 1). Note that weights apply to the group overall, so
they're identical for both respondents in the table.
First Respondent
Second Respondent
Answer
Converted
Value
Weight
Score
(Weight
*Value)
Converted
Value
Weight
Score
(Weight
*Value)
Q1
2
4.0
1.0
4.0
[blank]
Q2
3
7.0
1.0
7.0
2
4.0
1.0
4.0
Q3
3
7.0
1.0
7.0
4
10.0
1.0
10.0
Q4
4
10.0
1.0
10.0
[blank]
Q5
1
1.0
0.5
0.5
3
7.0
0.5
3.5
Q7
Yes
10.0
2.0
20.0
Uncertain
5.5
2.0
11.0
6.5
48.5
4.5
28.5
Raw Totals
Final Score
Answer
7.5
6.3
Where Final Score = Total Score ÷ Total Weight.
Note that the second respondent didn't answer two grid questions, reducing the total weight used in the calculation of their final score. You can
also opt to have missing values scored at the lowest or highest possible
values, which would have given that respondent scores of 4.7 and 7.5
respectively. [See Weighting tab.]
In addition to analyzing the scores numerically, you can also “bin” them
into ranges (similar to a rescale or other modifier). This is very useful if
Chapter 15 - Analysis Components
January 15, 2007
Question Groups & Scores
231
Apian SurveyPro 4.0 User Guide
you're planning on cross-tabbing the scores against other questions or
want to apply plain text labels to score ranges.
Question Groups Dialog
In SurveyPro you can evaluate sets of questions as a single unit. There are
three different structures to groups, two of which are fairly complex, so
we strongly recommend reviewing this conceptual information on page
228 before diving into the dialog controls.
As with other components (such as Rescales and Form Selects), once you
define a group you can reuse it in many figures, and when you make a
change, it will automatically update all reports using the group.
Creating Groups
The first two tabs of the group dialog are common to all types:
1. Name the group (Select Items Tab in the next section)
2. Select the questions to include
3. Order the questions (Select Items Tab or Edit Items Tab on page 233)
4. Apply rescales to questions as needed (Edit Items Tab)
5. Modify question labels and legends
6. Specify the group type
If you are creating a Point or Weighted Score, you'll have two additional
tabs to:
7. Specify the calculation details (Points Tab on page 234; Weighting Tab on
page 236)
8. Optionally group score ranges into bins (Output Bins Tab on page 237)
Select Items Tab
In this first tab you give the group a name, select the questions, and have
the option of arranging the group order.
Chapter 15 - Analysis Components
January 15, 2007
Question Groups Dialog
232
Apian SurveyPro 4.0 User Guide
Reporting Name
Group names will appear in some figure types, and can be up to 200 characters.
Questions and Groups
Lists all questions in your file with their scales. Not all groups can include
all scales, so see the details on the three group types on page 228.
In Group
All questions in your file with their scales. Not all groups can include all
scales, so see the detailed pages on the three group types.
Items
The number at the beginning indicates the order in the group. This can be
adjusted using the buttons below, or in the second tab where you modify
labels and rescales.
Sort Question/Group List
Changes the display of the list for your convenience. This does not impact
the order of questions within the group (use the buttons to right or the
second tab).
Re-order Item List
Click on an item in the right column and move it up or down in the group.
Note that this will be indicated by a change in the number before the item,
and not in the rows unless you update the sort.
Edit Items Tab
Like the Select Items screen, this one is common to all group types.
The lower half of the dialog is driven by the item selected within the grid.
Some scale types, such as numbers and dates, require rescales before the
group can use them. See also the detailed information on each group type
for its requirements.
Chapter 15 - Analysis Components
January 15, 2007
Question Groups Dialog
233
Apian SurveyPro 4.0 User Guide
Item
Select an item in the list to change its rescale or label. You can also type
label changes directly into the grid.
Order
Rearrange the group, moving the selected item up or down in the list.
Edits for Item
Indicates the original label and scale for your reference.
Label
Change the figure label for the selected group item. While they can be up
to 200 characters, shorter is generally better.
Automatic Legends
Uncheck this box to type custom 1 or 2 digit legends in the list.
Rescale
Select from among existing rescales or insert a new one. Note that groups
are sensitive to the numeric values underlying scales, so make sure yours
are set up properly to produce the calculations you want.
Output Evaluations
Sets the type of group you are creating. See Question Groups & Scores on
page 228.
Points Tab
This dialog only appears if you selected Point Scores on the Edit Items
tab.
With a Point Score you need to specify a value for each possible answer
within the group. This is done by selecting a group item in the left side and
typing points on the right.
If you have a simple assessment, such as our adrenaline test where the
points are the same for each item, you can set one question and then use
the “Apply to Same Scales” to set the rest.
Chapter 15 - Analysis Components
January 15, 2007
Question Groups Dialog
234
Apian SurveyPro 4.0 User Guide
Question List
Lists the questions in the group, along with a peek at their current points.
If you need to adjust the order, return to the Edit Items tab.
Answers/Points
Lists the possible answers of the selected item. A point value is required
for each possible response, and can be positive, negative, or decimal.
Minimum items answered
By default, a respondent receives a score if any item is marked, but you
can change this to all items or a number in between. Note that with Points
you provide a value for No Answer as well as the other possible
responses.
Apply to same scales
Applies the current item's points to all other items using the same scale.
Chapter 15 - Analysis Components
January 15, 2007
Question Groups Dialog
235
Apian SurveyPro 4.0 User Guide
Weighting Tab
This dialog only appears if you selected Weighted Scores on the Edit
Items tab.
Important:
If you have not read the detailed information on page 230, please do so
first—this section assumes you already understand how the calculations
are made.
Item
Lists the questions in the group. If you need to adjust the order, return to
the Edit Items tab.
Raw Answers
Values from the question's scale or rescale. This is a critical component to
your calculations, so it's worth double-checking that the low and high
ends correspond to the answers you think they do.
Low To/High To
When working with scales with different ranges, you can minimize bias by
converting them to common end points.
Weight
By default all questions are weighted 1, but this can be changed to any
positive value. The easiest approach is to vary the exceptions as here
since the weights are relative to each other and not absolutes.
Score No Values As
If you are allowing scores on incomplete groups you have three options
for how to calculate the missing responses. The Low and High options
provide worst and best case scenarios, while Remove from decision
weight tends to be a middle-ground. This is easily changed, so you may
want to experiment with the three settings to see their effects on your
data.
Chapter 15 - Analysis Components
January 15, 2007
Question Groups Dialog
236
Apian SurveyPro 4.0 User Guide
Required values to score
You can produce a score on partially complete groups or require all questions be marked for calculation.
Make sum be
By default SurveyPro converts your score to a 1-100 range. Aside from
being an intuitive range, this is very handy when comparing information
across groups with different scale levels.
Output Bins Tab
Output Bins are only available with Point and Weighted Scores.
With the Output off, SurveyPro will report the numeric score you set up in
the Points or Weights tab. If you prefer to bin score ranges and apply text
labels, you can either turn on the Output Bins or selectively apply
Rescales in the figures.
Basically what you do is tell SurveyPro the lower edges of your bins, and it
manages the ranges. Then you provide text labels, and optionally legends
and values.
Enable output bins
Without the output bins, the score will simply produce a numeric total for
each respondent. With the output bins, the score instead acts like a checkbox scale in figures.
Weighted sums can range
Lists the possible score range for your group.
Bin Range
Lists the possible score range for your group.
Bin Label
Labels can be up to 200 characters, but shorter is usually better. You can
type directly in the list, or in the larger box below.
Chapter 15 - Analysis Components
January 15, 2007
Question Groups Dialog
237
Apian SurveyPro 4.0 User Guide
Legend
Labels can be up to 200 characters, but shorter is usually better. You can
type directly in the list, or in the larger box below.
Value
The values are used for calculating means and other statistics on the bins.
To manually override them, choose Custom Values below.
Label
Labels can be up to 200 characters, though shorter is generally better.
Automatic Legends
By default SurveyPro uses a simple alphanumeric legend for reports, but
you can override this with your own 1-2 digit labels.
Change Bins
To add a bin, type the lowest value you want it to contain in the box and
click Add. Remove bins by selecting them from the list and clicking
Delete.
Bin Statistical Values
Values are used for means, medians, and other statistics in your figures.
Report On
This is one of the greatest time-savers you will encounter in SurveyPro.
With just a few clicks it will let you:
•
Tailor an entire report document to the last quarter’s results.
•
Repeat the report for each answer in a question (similar to a crosstab),
such as creating a custom report for each employee being evaluated
in a 360 analysis. It’ll handle up to 64,000 repeats, so you can use this
for larger organizations.
•
Create reports tailored to each division, but with company-wide
summary data included as well.
Report On has two main settings, which can be applied separately or
together: a Form Select Filter and a Repeat Report setting. The first example is using a filter, and the second two a repeat. The third does something
really special—instead of applying the Report On settings to the entire
report, it’s only going to change the data in figures using a special filter
called “Report On Selection.”
Chapter 15 - Analysis Components
January 15, 2007
Report On
238
Apian SurveyPro 4.0 User Guide
Switching between repeat versions
Once you turn on Report On, a small navigation palette appears. This will
show the number of “steps” in your current settings, and allows you to
jump to a step or click through. Remember that these are only views of
one document, so that if you edit a figure tile in one step, it will update in
all of them.
Identifying the report version
You really don’t want to change the headline, print a version, change it
again, and so on for all 64,000 possible repeats—or even for one filter.
The solution is to use the variables in the Text Palette (see page 44). Insert
an inline text graphic, and type something like “Results for,” then click on
the Report On variable you need. These will be replaced with real information as soon as you return to the document.
The best way to get a feel for Report On is to play around with the dialog
a little and seeing what it does. For example, if you have a demographic
question, put a figure using it into a report, then apply a Report On Repeat
using that same question. As you move through the report versions you'll
have a clear indicator of what's going on. This is exactly what’s done at
the end of Breaking Data Down on page 268, so you may want to give the
tutorial a try.
Chapter 15 - Analysis Components
January 15, 2007
Report On
239
Apian SurveyPro 4.0 User Guide
Report On Dialog
To remove a Report On, just un-click the two checkboxes for Apply Filter
and Apply Repeat.
Apply Filter
Applies a Form Select Filter to the document, just as you could do manually figure-by-figure.
Whole Report/Report On
Selections Only
By default, Report On settings are made to the entire document. However, you can choose the “Report On Value” option and it will only apply
your settings to the figures using the Report On Value Form Select. This
way you can interleave in a single document the “overall” results for your
entire database with ones tailored to your Report On settings.
Apply Repeat
Creates a report version for each answer in the selected question, or each
column in a Banner. For example, if you apply a Repeat using a regional
scale of West, Central, East, you'll end up with three steps of your report,
each one reflecting only the respondents from one region.
Show Overall
Creates a version reflecting your entire database (after applying your
Form Select) as the first step.
Step Using
Select among your questions for the repeat, or use a Banner (see page
223) to generate more complex selections. Your combination of Form
Select and Repeat can create a maximum of 64,000 steps.
Optional Modifications
You can apply an optional Rescale to change the labels, grouping or structure of the selected question(s). With date and number scales you'll also
see options for quick binning into common categories, and written
answers are autopostcoded. See Modifiers & Rescales on page 216.
Chapter 15 - Analysis Components
January 15, 2007
Report On Dialog
240
Apian SurveyPro 4.0 User Guide
Printing Report On Repeat Documents
If your Report On includes a Repeat, when you print you'll first be
prompted with the steps you'd like to include. An “Empty” step is one
where the combination of data and report settings produce nothing to
analyze (like a region whose responses are not yet entered).
See also Publishing Reports on page 251 for how to create one HTML document for each step.
Chapter 15 - Analysis Components
January 15, 2007
Report On Dialog
241
REFERENCE
Chapter Contents:
Chapter 16 - Reports
January 15, 2007
Chapter 16
Reports
Executive Summary Automatic Report . . . . . . . . . . . . . . . . . 243
Data Table Automatic Report . . . . . . . . . . . . . . . . . . . . . . . 244
Automatic Report Document Properties Dialog . . . . . . . . . . 245
Executive Summary Tab . . . . . . . . . . . . . . . . . . . . . . . . . 245
Data Table Tab . . . . . . . . . . . . . . . . . . . . . . . . . . . . . . . 246
Title Tab . . . . . . . . . . . . . . . . . . . . . . . . . . . . . . . . . . . . 248
Report Labels Dialog . . . . . . . . . . . . . . . . . . . . . . . . . . . . . . 248
Graph Color Fills . . . . . . . . . . . . . . . . . . . . . . . . . . . . . . . . . . 250
Publishing Reports . . . . . . . . . . . . . . . . . . . . . . . . . . . . . . . . 251
Web HTML Reports . . . . . . . . . . . . . . . . . . . . . . . . . . . . . 251
Printable Images . . . . . . . . . . . . . . . . . . . . . . . . . . . . . . 252
242
Apian SurveyPro 4.0 User Guide
Executive Summary Automatic Report
The Executive Summary is a quick run-down of responses to your survey,
and uses either table+bar figures or straight text. Best of all, the report is
automatically maintained in your project file, so you can take a look at
your results before beginning your custom reports.
By default, the report will include results for every question in your
project. This can be tailored to a sub-set if needed. You can also adjust the
statistics used, although of course you don’t have the fine control which
comes with a custom report.
While the Executive Summary document cannot be deleted, you can
close it if you are working with other aspects of your project. To re-open
the report, use the Document menu’s Open Document command.
Chapter 16 - Reports
January 15, 2007
Executive Summary Automatic Report
243
Apian SurveyPro 4.0 User Guide
Data Table Automatic Report
While the Executive Summary views the database overall, the Data Table
looks at individual respondents. The report has one row per respondent,
and by default includes all the questions as columns (if there are too many
to fit across they will wrap onto additional pages).
In addition to providing a look at individual respondent responses, the
Data Table is also a valuable data cleaning tool, allowing you to quickly
pinpoint the form numbers of records needing edits (see Data Cleaning on
page 123).
The initial settings are designed for the most compact layout, but through
the Document Properties dialog you can change the data from checkbox
numbers to labels. Document Properties also contains the controls for
omitting questions or adjusting the range of forms being reported.
If you need additional controls for this type of report, you can insert a
Data Table figure in a custom report document.
The Data Table document cannot be deleted, but you can close it if you
are working with other aspects of your project. To re-open the report, use
the Document menu’s Open Document command.
Chapter 16 - Reports
January 15, 2007
Data Table Automatic Report
244
Apian SurveyPro 4.0 User Guide
Automatic Report Document Properties Dialog
The Executive Summary and Data Table Document Properties dialogs are
a blend of the regular Document Properties and figure controls. This section covers the first two tabs, which are the unique elements. See also
Logo Graphic Tab on page 34 and Footer and Header Tabs for Paper Documents on page 35.
Executive Summary Tab
The Executive Summary is a quick run-down of responses to your survey,
and uses either table+bar figures or straight text (both can be published to
HTML). This dialog allows you to change some basic settings on the contents and appearance.
Figure Types
By default, the report consists of Table+Bar figures, but you can override
this to plain text if desired.
Question Grids
The Executive Summary can report on grids as a group, individually, or
both. This does not impact the list of questions, where you can un-select
individual questions within a grid.
Contents
Select among the statistics you want in the report overall. SurveyPro will
only apply statistics relevant to the questions, so if you don't see something you want, check your scale definition.
Chapter 16 - Reports
January 15, 2007
Automatic Report Document Properties Dialog
245
Apian SurveyPro 4.0 User Guide
Maximum non-other
checkboxes
For unordered checkbox scales you can limit the number of boxes displayed to the most popular responses—everything else will be grouped
into an “Other” category.
Question Numbers
With a single questionnaire documents, the question numbering is quite
straightforward. However, if you have multiple questionnaire documents
and/or ones which have evolved over time, you may want to use an internal question number rather than the primary survey's autonumber values.
Report Text Style
Sets the base Text Style for the figure's labels and data.
Questions
Lists all questions in your project, as well as system fields such as the
date/time stamp (though the latter are not selected by default). Click on
the checkboxes to include individual questions, or use the buttons below
to select all at once.
Page Setup
Sets the margins for your overall document. Page size and orientation are
set in Print Setup.
Data Table Tab
The Data Table has one row per respondent, and by default includes all
the questions as columns (if there are too many to fit across they will wrap
onto additional pages). This dialog allows you to change some basic settings on the contents and appearance. You can also create a data table figure (see page 204) within a custom report where you have more options
and overrides.
To review and edit responses on a form-by-form basis, go to Answer
Entry. See Working with the Database on page 111.
Chapter 16 - Reports
January 15, 2007
Automatic Report Document Properties Dialog
246
Apian SurveyPro 4.0 User Guide
Form Rows
Include all records, or just a range based on the form number. To use a
Form Select for more detailed filtering, create a Data Table figure in a custom report.
Questions
Lists all questions in your project, as well as system fields such as the
date/time stamp (though the latter are not selected by default). Click on
the checkboxes to include individual questions, or use the buttons below
to select all at once.
Boxes
Sets whether to display the checkbox number, the 1 or 2 digit legends, or
the full text label, as well as whether you want the Other text included or
just a count for the number of Others. If you'd like to modify the legends,
go back to the Scale definition.
Question Numbers
With a single questionnaire documents, the question numbering is quite
straightforward. However, if you have multiple questionnaire documents
and/or ones which have evolved over time, you may want to use an internal question number rather than the primary survey's autonumber values.
Report Text Style
Sets the base Text Style for the figure's labels and data.
Page Setup
Sets the margins for your overall document. Page size and orientation are
set in Print Setup.
Chapter 16 - Reports
January 15, 2007
Automatic Report Document Properties Dialog
247
Apian SurveyPro 4.0 User Guide
Title Tab
Because you cannot add individual tiles to the Executive Summary or
Data Table, you'll need to use this tab for a title and introduction.
Title/Introduction
While in the text box, it will preview all your settings except line breaks.
Use the Text Palette to change the Text Style or make character overrides
for Italic, color, etc. You can type up to 2000 characters and multiple paragraphs. You can also insert variables, which will appear in the dialog with
a strike through but display properly once you close the dialog. See also
Text Palette on page 44.
Enhancements
Places a black border around the title or a line below.
Place Title
Either centers the title below any logo you’ve included using Document
Properties, or places it to the right of the logo. If you have not included a
logo, you can align the title to left, center or right.
Report Labels Dialog
Accessed from the Edit menu when a report document is selected.
By default, SurveyPro sets the report labels as the first 200 characters of
your question text. This can be changed question-by-question in the question or grid dialogs, or for many questions at once using this dialog. These
Chapter 16 - Reports
January 15, 2007
Report Labels Dialog
248
Apian SurveyPro 4.0 User Guide
short names not only appear in figures, they’re also used within dialogs to
refer to questions, such a the Object Tree and Import dialog.
Once a question name is overridden, it will no longer automatically
update when the question text is modified. Be careful of this if you have
files which have evolved a great deal over time.
You can also change the labels (indicated with a L number) used for statistical functions, either for translation or preference. Some of the labels
include wildcard characters which are substituted for other values, so be
very careful to leave these portions intact. (Note, unlike variables you can
insert through the text palette, the statistical labels using these wildcards
expect a specific function to be present.)
%d
Inserts an integer value in the label, such as for Top Box where
it inserts the number of boxes.
%.0f
through
%.6f
Inserts a decimal value in the label. You can set this from no
decimal “3” up to 6 decimal places “3.141593.”
%%
Only used immediately after wildcard value such as %.1f.
Inserts a “%” symbol in the text.
|
For labels which include footnotes, this symbol separates the
“pipe” symbol in-figure label from the note text. An asterisk “*” in the figure
referring to the note is inserted automatically.
Names and Labels
Lists first the question labels by internal Q number, then the statistical
labels.
Label Defaults
If a question is selected, displays the full text for your reference. If a statistical label is selected, displays the default, or in this case, both SurveyPro's
default and the one you have set as your personal default.
Chapter 16 - Reports
January 15, 2007
Report Labels Dialog
249
Apian SurveyPro 4.0 User Guide
Edit Name
Type the label text you want to use for the figures. Shorter is generally
better.
Make Default
Sets the statistical label as your personal default for new projects.
Reset Label
Resets question labels to the first 200 characters of question text, or statistical labels to SurveyPro's default.
Reset All Questions/Labels
If a question is selected, this resets all question names to their default, the
first 200 characters of question text. When you have questions with no
visible text, you’ll have to manually give them labels before leaving this
dialog. Or, if a statistical label is selected, it resets to their defaults.
Graph Color Fills
By default, SurveyPro comes with a mixed set of graph colors. The initial
set may be modified, or you may insert additional sets for specialized
applications, such as creating bar charts of all one color when a legend is
not needed. Graph fill sets are specified in the Document Properties and
in individual figures.
To change the settings, just click on the drop-down lists for each of the 16
items and select from one of the pre-set colors or add a custom color. The
Side Color is for shading on 3D pie and bar graphs.
You can repeat colors within the fill definition, and you don’t have to set
all the custom colors if your figures will not use them.
Chapter 16 - Reports
January 15, 2007
Graph Color Fills
250
Apian SurveyPro 4.0 User Guide
Publishing Reports
This feature allows you to publish SurveyPro’s custom and automatic
report documents to either HTML or individual image files. Note that you
can also copy and paste individual figure tiles from SurveyPro into other
applications.
After each Publish, a log is created with the results. You can retrieve this
later through the Tools menu, File History.
Web HTML Reports
In addition to posting HTML reports on a server, these files can also be
opened in Microsoft Word and other applications. If you’re conducting
Web surveys, see also the NetCollect User Guide for the real time serverbased reports.
Target Directory
Set the destination for the HTML pages and image files.
Base Filename
The individual files exported will add a document number prefix such as
“D5” and name suffix to this base filename.
Target System Frame
760 pixels will fit on an 800x600 SVGA screen without a horizontal scroll
bar. For users with larger displays, set whether you want that column to be
left, centered, or right aligned within their browser.
Report On
When the document has a Report On Repeat set, you can specify whether
you want to save just one “step” or all of them. When you select Each
step into its own HTML page the step number will be appended to the
HTML and image file names.
Chapter 16 - Reports
January 15, 2007
Publishing Reports
251
Apian SurveyPro 4.0 User Guide
Screen Image Files
Optimized
Images are exported at screen resolution. This option simply determines
whether they’re saved as high quality JPEGs or with some compression. If
you need higher resolution images, use the Printable Images Publish.
Printable Images
This is a convenient way to save all your figures to print quality images for
use in a page layout or other application.
Target Directory
Set the destination for the image and text files.
Base Filename
The individual files exported will add a document number such as “D5”
and tile number to this base filename.
Tile(s) to print
Select either all tiles in the document or just the selected item. Note you
can also paste SurveyPro tiles into most applications.
Tables and Text Figures As
Tables and text can be saved as editable TXT files, or they can be saved
as images just as they display in your SurveyPro document.
Report Converted at
Resolution
Select 300 or 600 DPI for the images.
Print Image Files
Select the preferred format of your graphic designer. Only JPEG files
should be used on the Web.
Chapter 16 - Reports
January 15, 2007
Publishing Reports
252
Chapter 17
Creating a Report
TUTORIAL
SurveyPro is designed to create reports, not just independent figure tiles.
This lesson is a complement to Creating a Questionnaire on page 91, which
uses additional document editing tools in the creation of a questionnaire.
In this tutorial you’ll learn how to:
Insert different figure types
Create cross-tabulations
Apply form select filters
Work with question groups
Adjust Other groupings and Sorting
Summarize written answers
Tutorial Notes
General
You can save your file and take a break any time you’re in the
main document screen.
Tutorial Files
Are in your SurveyPro Samples folder, by default under:
C:\Program Files\Apian Software\SurveyPro 40\
1. Start SurveyPro, log in, and if the window isn’t filling the screen, maximize it.
2. File, Open Report Tutorial.SP4 and save as YourName Report Tutorial.SP4
when prompted.
3. Close File History.
The Hotel Ombreux departure survey was created to help prioritize
improvements in the hotel, as well as track changes in the feedback as
improvements are implemented.
At the bottom of the screen are tabs for the four starting documents in a
file: Questionnaire, Executive Summary, Data Table and Custom Report.
The Custom Report is empty, waiting for your content, while the Executive Summary and Data Table are automatically maintained reports which
display results as soon as a single form is in the database.
Chapter 17 - Creating a Report
January 15, 2007
253
Apian SurveyPro 4.0 User Guide
4. Click on the Questionnaire tab and take a moment to acquaint yourself with
the survey we’re going to analyze.
5. Click on the Executive Summary tab, and scroll through the report.
6. Click on the Data Table, and scroll through the respondent answers.
Both the Executive Summary and Data Table have a few customization
controls through their Document Properties dialogs
, but they’re a subset of the normal reporting tools. So, let’s make a custom report!
Adding a bar graph
1. Click on the Custom Report tab.
2. In the toolbar, click the Insert button
down list.
and select Bar Chart from the drop-
3. In the For Question(s) tab, select Q12: Amenities.
As you clicked on the question, the section below added a selection:
Count writtens into virtual checkboxes. This is available because the
amenities question includes an Other blank. SurveyPro assumes you’re
going to want to count the write-ins as well as pre-loaded checkboxes, so
if it finds repeats it will report them in bars just like the original boxes. If
you don’t want SurveyPro to tabulate the Others, you can always turn the
setting back to None.
4. However, in our case, we want the Others counted, so click Next.
5. Leave the statistic setting at the top on Frequency
6. Check the box for With No Answers to add a bar for missing responses.
7. Click on the Sorting drop-down list and change it to Sort by Frequency.
Bar and pie charts are among SurveyPro’s simplest figures, as you can see
from the limited set of statistics active on the screen. This is an unordered
scale, so it’s even simpler because the options for means, medians, and
standard deviations are not applicable (see Statistics in SurveyPro on page
207).
The one setting we didn’t change, Move counts at or under 1 into Others,
is related to the selection we made on the first screen to count written
responses.
8. Click Next, and Next again (we’ll come back to the crosstab screen).
The Layout screen includes a variety of options, both for the display of the
bar and the dimensions of the tile itself.
Chapter 17 - Creating a Report
January 15, 2007
254
Apian SurveyPro 4.0 User Guide
9. In the upper-right corner, under Labeling, turn on Show Counts.
10. Click Finish to see your chart.
Not bad for a few clicks, and best of all, it will automatically update as
new data is received. In order for SurveyPro to tabulate the three
repeated write-ins, they had to be entered consistently in the database.
See Data Cleaning on page 123 and Working in Answer Entry on page 132
for more information.
Adding a crosstab to the bar chart
Let’s play some more with the bar chart.
1. Double-click on the bar chart.
2. Click on the For Statistic tab, and turn off With No Answers.
3. Click on the By Crosstab/Filter tab.
A crosstab (A.K.A. cross-tab or cross-tabulation) is simply a breakdown of
one question’s responses by another. Common examples would be breaking down an opinion poll by region, gender, or political party. Sometimes
there’s a relationship in the breakdown, and sometimes there isn’t. (See
also Crosstabs & Banners on page 223)
In our case, we’re going to look at whether the amenities requested vary
based on whether a guest is traveling on business or pleasure.
4. Click on the One Question radio button at the top.
Chapter 17 - Creating a Report
January 15, 2007
255
Apian SurveyPro 4.0 User Guide
5. From the list which appeared just below, select Q13: Trip Purpose.
6. Near the bottom of the dialog is a setting for Overall Column—click to select
First.
7. Click OK.
Well, we now have four charts, one for overall and three for the Trip Purpose answers, but they break across the pages and it’s difficult to compare
the respondent groups. While we could tighten up the layouts so they’re
closer together, another approach works better for cross-tabbed bar
charts.
8. Double-click on the bar chart again.
9. Click on the General tab.
10. Change the figure type to Stacked Bars and click OK.
Much more concise! Stacked bars and line charts tend to be the best
visual representations of cross-tabulations, with tables the winner in
detailed data.
Creating a table of dates
So onward with a table…
1. Click on the blue insert bar beneath the stacked bars.
2. Insert
a Table.
3. From the list, select Q14: Arrival Date.
Again, some more modifiers appeared based on the question’s scale definition. If you have a date question in your survey but didn’t see these
options, go back to the questionnaire and check your scale.
Chapter 17 - Creating a Report
January 15, 2007
256
Apian SurveyPro 4.0 User Guide
4. For Put dates into bins by, select Months.
5. Click Next.
6. For the statistics, turn on Percents, Confidence Interval on Frequencies at
95%, and Crosstab significance by Chi-Squared.
7. Click Next.
8. Change the Crosstab By setting to One Question again.
9. Again, let’s use Q13: Trip Purpose, so select it from the drop-down list.
Here we can take advantage of the additional statistical detail you can display in tables.
10. In the bottom half of the dialog, in the Show section, turn on Counts and
Percents.
11. Click Finish to see the table.
Since we used the SurveyPro automatic binning for the dates, it will continue to add rows as data is collected. Or, if we just want to look at Q1, we
can do so with a Form Select Filter.
Adding a Form Select Filter
1. Double-click on the table.
2. Click on the By Crosstab/Filter tab.
3. At the bottom of the dialog, click the Insert button
Select Filter drop-down list.
Chapter 17 - Creating a Report
January 15, 2007
next to the Form
257
Apian SurveyPro 4.0 User Guide
Form Select Filters tell SurveyPro to focus on a sub-set of your database,
based on the rules you set up. Rules can be as simple as Q13=1 (the first
checkbox), or complex nested filters with nesting, ANDs, and ORs. See
page 212.
4. In the upper-left corner, type the filter Name Q2 2001.
5. In the question list at the upper-right, select Q14: Arrival Date.
Note that at the end of the list are form properties, such as the questionnaire document used and date it was collected, all of which can also be
used to look at specific forms in your database.
6. Below the question list is a set of radio buttons for the Relationship—select =
Equal.
7. SurveyPro lists the existing data below, which is a good starting point. Click
on Apr 2, 2001, scroll down until you can see Jun 30, 2001, and Shift-click on
Jun 30, 2001.
8. You should now see a block of selected values—click the button labeled Insert
on the left side of the dialog to transfer the rule you specified into the text
area.
Note that your settings in the right panel all translate to a text-based rule,
which SurveyPro interprets and which you can manually edit. In this case,
we do need to make one change because the first date in our database
falls after the beginning of the quarter.
9. Click in the typing area on the left side of the dialog and change the rule so it
reads Q14 = "Apr 1, 2001".."Jun 30, 2001".
Chapter 17 - Creating a Report
January 15, 2007
258
Apian SurveyPro 4.0 User Guide
10. Click the Test Rule button, and you should see a line appear below the rule
box “Found 179 Forms.”
11. Click OK to return to the table dialog, and note your new rule is already
selected in the Form Select drop-down list.
Once a filter is defined, you can apply it anywhere, from Answer Entry
searches to other figures to exports. Filters are organized under the
Object Tree in the Components section (see page 15). Other reporting
components, such as Rescales, Banners, Question Groups and Graph Fills
can also be defined once, then applied again and again.
12. Click OK to see the revised table.
The last line of the table, Chi Sq Significance, reads “Under 50%.” This
means that there’s a less than 50% chance that the guests’ Trip Purpose
varies with the date they arrived. Now if the comparison were done across
a year, it’s possible at trend would be visible for summers and holidays.
If you’re interested in exploring tables more, see Breaking Data Down on
page 268 for a walk-through of its interactions with complex filters, banners, and other settings.
Using Pie Charts
1. Click on the thick blue insertion bar beneath the table, and Insert
Chart.
a Pie
2. In the first screen, select Q15: Home State from the list.
3. Click Next twice to reach the Layout screen.
4. At the upper-right, in the Labeling section, click to select On Pie Wedges and
Percents.
5. Click Finish to see the chart.
Chapter 17 - Creating a Report
January 15, 2007
259
Apian SurveyPro 4.0 User Guide
It’s colorful, but if you want the full breakdown a table or bar chart would
be better. Let’s clean the pie up to the biggest groups.
Showing only the most common answers
1. Double-click on the pie chart, and click on the Layout tab.
2. On the left-hand side is a drop-down list labeled Sorting, currently set on
Sort Alphabetically. Change this to Biggest 5.
3. Just below, click on Wedge 1 to in the list to select it.
4. Click OK.
With the Sorting setting, SurveyPro pulls out the largest segments and
groups the rest into an “Other” category. In this case, we end up with a
clear regional picture. There’s one other way to approach this type of consolidation.
5. Double-click on the pie chart again.
Chapter 17 - Creating a Report
January 15, 2007
260
Apian SurveyPro 4.0 User Guide
6. Change the Sorting drop-down list from Biggest 5 back to Sort alphabetically.
7. Just below the drop-down list is a control for Lump counts at or under 1 as
Others. Change this to 25 and click OK.
This setting achieves a similar effect to the Biggest 5, but from a different
direction. These controls are available in most figures (though typically on
the For Statistics tab), so you can apply them whenever you want to
quickly consolidate data. Rescales can also be used to group responses
(see page 216).
Showing question groups in bar graphs
Now we’re going to do something with that importance/performance grid
from the questionnaire. SurveyPro automatically created a question group
for each of our scale columns, so we can get started immediately. (See
Question Groups & Scores on page 228.)
1. Click on the blue bar below the pie and Insert a Bar Chart.
2. In the upper-left, change the setting from A Question to A Question Group.
3. Select the group name ending with Our Performance.
4. Change the setting on the left to Components and Whole.
5. Click Next.
Note that when you’re looking at a group in this manner you can only
choose among statistics which produce a single value per question.
Because the graph will be of the Mean, another set of controls is available
at the bottom, which allow you to chart a range around questions.
6. Select Standard Deviation at 68% from the lower panel.
7. Click Next, and Finish to see the bars.
Chapter 17 - Creating a Report
January 15, 2007
261
Apian SurveyPro 4.0 User Guide
Each bar represents one question in the grid. The vertical line in the middle of each bar is the mean, and the range around it is the standard deviation, the range in which 68% of respondents fell for each question. The
axis numbers relate back to the original scale definition, with 4=Very
Important, and 1=Unimportant. (Standard deviation is calculated as a
symmetrical range, which is why some of the bars go past the maximum
possible response of 4.)
Now we’re going to make three changes to the figure so we can look at
the group’s data in another way.
8. Double-click on the bar chart you just inserted.
9. Click on the General tab, and change the figure type to Table + Bars.
10. Click on the For Question(s) tab, and turn on the checkbox for Use Group like
a ‘crosstab’.
11. Click on the For Statistics tab, and turn on Percent in the top panel.
Note that the dialog is broken into two main sections: one with checkboxes allowing multiple statistics for the table portion, and one with radio
buttons for the bar graph statistic.
12. Click OK.
Table + Bar figures are handy because you can have the numeric information as well as a graphical representation—in this case the table contains
the frequency distribution, mean and standard deviation, while the bars
show the mean.
Chapter 17 - Creating a Report
January 15, 2007
262
Apian SurveyPro 4.0 User Guide
Scatterplots for pairs of groups
1. Double-click on the group table + bar for one more variation.
2. Click on the General tab, and change the figure type to Compare Group Pairs—
note the tabs changed again to reflect the different feature set of this
figure.
3. Click on the Compare Groups tab.
Compare groups does just that: compare the results of two related Question Groups. In our case we’re comparing the importance and performance ratings from the grid, but it could also be a comparison between
two types of respondents on a single Question Group.
4. The left-hand side of the dialog shows the first group, which we’ve been
working with already. On the right side, select G2: Ratings--Importance from
the Question Group drop-down list.
5. At the bottom of the dialog are Label settings, one for each side. On the left,
type the label Performance, and on the right, Importance.
6. Click the Layout tab.
7. Compare groups can take several forms, in this case we want a X-Y
Scatterplot, so select that as the Graph Type in the upper-left corner.
8. Click OK.
Chapter 17 - Creating a Report
January 15, 2007
263
Apian SurveyPro 4.0 User Guide
It looks like our data is very spread out for the different factors, but when
we look more closely we see the axes have automatically scaled themselves to fit the data. Let’s change them to the scale endpoints instead:
9. Double-click on the scatterplot—you should already be on the Layout tab.
10. Change the Horizontal and Vertical axes from “auto” to a Start of 1 and End
of 4.
11. Click OK.
Now there’s a much tighter cluster in the quadrant for higher importance
and better performance.
On your own projects you might want to tighten up the labels, which can
be done either by editing the question grid Report Labels tab (see page
66) or creating custom Question Groups (see page 228).
Summarizing and cross-tabbing comments
OK, we’re down to the last figure for this tutorial: a look at the open-ended
comments respondents made.
1. Click on the blue bar at the end and Insert a Text Figure.
2. From the Question list, select Q11: Comments.
3. Click Next twice to get to the By Crosstab/Filter screen.
4. Select the radio button for One Question.
5. In the list that appeared just below, select Q13: Trip Purpose.
6. Click Finish.
If this is the last figure in your report, it’s just broken across two pages
which is a little awkward.
7. Click once on the Text Figure you just inserted and under the Insert menu (not
the button), select Breaks.
8. Click New Page and click OK.
Chapter 17 - Creating a Report
January 15, 2007
264
Apian SurveyPro 4.0 User Guide
That’s all there is to creating reports. Of course there’s some additional
polish to finish it off, such as titles, footers, and figure numbering from the
Document Properties dialog (see page 30), but these are the essentials of
working with figure tiles. If you got off track at some point, you can open
the file Report Tutorial End.SP4 for a look at the final settings.
Breaking Data Down on page 268 has more details on delving into data.
Chapter 17 - Creating a Report
January 15, 2007
265
Apian SurveyPro 4.0 User Guide
Chapter 17 - Creating a Report
January 15, 2007
266
Apian SurveyPro 4.0 User Guide
Chapter 17 - Creating a Report
January 15, 2007
267
Chapter 18
Breaking Data Down
TUTORIAL
While Creating a Report on page 253 introduces the report and figure creation process, this tutorial gets into the tools which help you slice and dice
your database. In this lesson we use a table to demonstrate the features,
but most of what we do can be applied to any other figure type—tables
just happen to be the densest figure type for conveying detailed data.
In this tutorial you’ll learn how to:
Create Rescales for restructuring and rearranging scales
Use Stub lists to include multiple questions in a figure
Build complex crosstabs with Banners
Clone figures to insert many at once
Replicate entire documents with Report On
Tutorial Notes
General
You can save your file and take a break any time you’re in the
main document screen.
Tutorial Files
Are in your SurveyPro Samples folder, by default under:
C:\Program Files\Apian Software\SurveyPro 40\
1. Start SurveyPro, log in, and if the window isn’t filling the screen, maximize it.
2. File, Open Report Tutorial.SP4 and save as
YourName Components Tutorial.SP4 when prompted.
3. Close File History.
4. If you have not completed Creating a Report on page 253, click on the
Questionnaire tab at the bottom of the screen and review the survey we’ll be
analyzing.
Adding a table of state names
1. Click on the tab at the bottom of the screen for the Custom Report.
2. From the toolbar, Insert
Chapter 18 - Breaking Data Down
January 15, 2007
a Table.
268
Apian SurveyPro 4.0 User Guide
3. From the list at the top of the dialog, select Q15: Home State.
4. Click Next.
5. In the middle of the dialog, turn on Percent.
6. In the center-right, change Move counts at or under 1 into Others, to 0.
7. Click Next, and Finish.
OK, here’s the first iteration of the table: an automatic tabulation of the
short written answer State. While we could have SurveyPro automatically
reduce the table to the most frequent responses as with the pie chart in
Creating a Report, what about regions?
Copying and pasting figures
Rather than continuing to edit the same figure, we’re going to add a copy
so you can see how it evolves and compare settings in your final file.
1. Click on the table to select it, and press the Copy button
Ctrl+C.
2. Click on the blue bar just below the table, and Paste
Ctrl+V.
in the toolbar or
with the toolbar or
Unlike questions which can remain linked when pasted across documents
and may have data linked to a specific tile, pasted figures are independent
from the original.
Adding figure numbers
1. These versions could get confusing, so click on the Document Properties
toolbar button .
2. Click on the Autonumber tab.
3. Select the radio button for Standard Choices, and click OK.
Grouping states into regions with a Rescale
1. Now double-click on Figure 2, the table at the end.
2. It should open to the For Question(s) tab. At the bottom of the screen,
change the Modifiers setting to Rescale.
3. Since we don’t have any Rescales in this file yet, click the Insert button
next to the drop-down list that appeared.
Chapter 18 - Breaking Data Down
January 15, 2007
269
Apian SurveyPro 4.0 User Guide
Rescales modify the way SurveyPro’s reports work with your data, but do
not change the underlying responses so you can have many rescales for
each scale, applying them in different situations. For example, on this
question we could have one rescale which groups respondents based on
the distance traveled to the hotel, while another rescale might be based
on traditional regions.
Each Rescale is tied to a specific scale type, whether it’s written, date, or a
specific checkbox scale, and the rescale dialogs are slightly different for
each—see Modifiers & Rescales on page 216 for more.
4. Leave the first drop-down on Whole Answers, and change the second to Q15:
Home State.
5. Click the Add button next to the Home State question.
6. Click in the list below, type TX and click Add next to your entry.
Since we don’t have all 50 states represented in the database, this would
be the way to add in the gaps. That way when you do collect additional
answers in the future, SurveyPro knows how to handle them.
7. Click Next.
Now that we have our raw entries, we need to group them into regions.
For simplicity, we’re just going to use Western, Central, Eastern, and Canada. The next two dialogs are common to all rescale types.
8. In the first column, click on the checkboxes next to:
2: AZ
4: CA
5: CO
10: MT
11: NM
12: NV
14: OR
18: WA
and click the Combine button on the left hand side of the dialog.
Chapter 18 - Breaking Data Down
January 15, 2007
270
Apian SurveyPro 4.0 User Guide
Yes, this is the way it’s supposed to look. The items you marked are all
grouped into one “Output Bin” called 11: <Untitled>. It is a little distracting all broken apart, and since the alphabetical listing on the left means little in this case, we’ll clean it up.
9. At the bottom of the dialog are two sets of buttons, one labeled Input
Answers and the other Output Bins—click the Sort button for the Output Bins.
10. Click on the first 11: <Untitled> (next to AZ).
11. The First button on the lower-right should have become active; click it to
move this group to the top.
We’re going to go back-and-forth a little in this dialog because it’s the easiest way to do this type of grouping.
12. Click the Next button.
13. Click in the first row and type Western.
SurveyPro provides a peek at the contents of each row in the lower-left
corner of the dialog—a valuable double-check for more complex
Rescales.
Below our new Western group is our lone Canadian, BC. A rescale can be
simply a re-labeling of responses, so let’s take care of that now.
14. Click in the third row, BC.
15. Backspace over the current text and type Canada.
Chapter 18 - Breaking Data Down
January 15, 2007
271
Apian SurveyPro 4.0 User Guide
16. Click the Back button so we can group the remaining states.
17. Now for the central states. In the first column, click on the checkboxes next
to:
1: AL
6: GA
7: IL
8: KS
9: MI
16: TX
18. Click Combine again, then Next.
19. Click in line 6, the row for the new bin, and type Central. Click Back.
20. In the first column, click on the checkboxes next to:
13: NY
15: PA
17: VA
and click Combine, then Next one last time.
21. For the last group, line 4, type the label Eastern.
22. The Canada group doesn’t belong in the middle of the others, so select it and
click the Last button.
23. At the top of the dialog, type the Name for this rescale: Regions.
Rescales with their Output Bins are very similar to checkbox scales. Just
like checkbox scales can be unordered or ordered, and have values, so can
Rescales.
Chapter 18 - Breaking Data Down
January 15, 2007
272
Apian SurveyPro 4.0 User Guide
24. On the lower-right, change Statistical Values Out to Ordered No Values which
will keep this sorted in figures.
25. Check your dialog against the one below.
26. Click Finish to save the Rescale, and OK to close the figure dialog.
This time the table got a lot smaller, with an understandable distribution
for a hotel located in Washington. Let’s complicate the table some more.
Using multiple questions in a table
1. Click once on the second table, Figure 2, and press the Copy button in the
toolbar or Ctrl+C.
2. Click on the blue bar just below the table, and Paste with the toolbar or
Ctrl+V.
3. Double-click on the table at the end, Figure 3, to edit.
4. In the For Question(s) tab, change the upper-left setting to Multiple Items
(stub list).
While question groups produce calculations on the group as a whole, stub
lists are a way to create sets of questions which may use completely different statistics. Stubs are only available in tables and text figures, because
charts cannot present diverse scale structures.
5. Click the Edit Item List button that appeared just below your radio selection.
6. We’ll keep this somewhat simple, so scroll down the left-hand list and click
on Q12: Amenities. Shift+click on Q15: Home State.
Chapter 18 - Breaking Data Down
January 15, 2007
273
Apian SurveyPro 4.0 User Guide
7. Click the Add -> button.
We’re saving time setting up these figures because when the question was
inserted, a short, clear report label was set. Otherwise, not only would we
be overriding labels, we’d be hunting through lists of questions with
names like “Q12: When you are...”
8. Click OK.
Now instead of a list of questions for the entire project, we have the set of
four which will be included in the table.
9. Click through the items in the list and notice that the Modifiers controls at
the bottom of the dialog change with the selection.
10. So we don’t have a 20 page table, click on Q14: Arrival Date and set its
Modifier to Months.
11. Click on Q15: Home State, click Rescale, and select the one we just added,
R1: Regions.
Chapter 18 - Breaking Data Down
January 15, 2007
274
Apian SurveyPro 4.0 User Guide
12. Click the For Statistics tab at the top of the dialog.
Again, we see a list of the stub items because they have very different statistical needs. We could use the “Apply Stats to All” button, and SurveyPro
would apply your selections to all the questions for which they were valid,
but let’s be a little more specific here.
13. Click on I1: Amenities in the top list.
14. Amenities has an Other blank which we don’t want cluttering the table, so in
the center-right of the dialog set Move counts at or under to 5.
15. The rest of the settings should be fine for all, so click OK to see the table.
Adding columns with Banners
We’ve expanded the number of questions in the rows, now let’s see what it
looks like when we start adding more columns.
1. Scroll up and double-click on Figure 2, our short table with the Rescale.
2. Click the By Crosstab/Filter tab.
3. Select One Question, and from the list that appears, choose Q1: Front DeskImportance to you.
4. Click OK.
Chapter 18 - Breaking Data Down
January 15, 2007
275
Apian SurveyPro 4.0 User Guide
Simple enough, so let’s add a Banner to put more information in the table.
5. With the table still selected, press the Copy button in the toolbar or Ctrl+C.
6. Paste with the toolbar or Ctrl+V.
7. Double-click on the new Figure 3.
8. You should be back in the By Crosstab/Filter tab, so change the radio
selection at the top to Banner.
9. None are defined yet, so click Insert
next to the drop-down list.
Banners are named, reusable column specifications, though a “column”
can also be applied to pie charts, stacked bars, etc. Columns can consist
of a simple Form Select Filter (July’s responses), a 2D crosstab such as the
one we just inserted, or a 3D crosstab which compares several customer
groups. Each banner item, Filter/2D/3D, can produce one or more columns, as you can see in the 2D crosstab above which produced four columns. Banners may include up to 500 columns, so they should be able to
accommodate whatever you need.
Aside from the ability to stack up all these items in a figure, Banners also
allow you to override the labeling and set statistics individually for each
item, just as we did with the stub list. Since these are saved settings, defining a banner can save you time when you use the same crosstab many
times.
10. At the top of the dialog, type the banner Name 3D Table.
11. Having a first item as an “overall” is useful, so leave item 1 on Filter only, All
Forms.
12. Click the Add button
to insert a row item at the end of the list.
13. With the new item selected, set it to 2D Crosstab at the lower-left.
14. At the lower-right, select Q1: Front Desk from the drop-down list.
15. Click OK, and OK again to close the figure dialog.
Chapter 18 - Breaking Data Down
January 15, 2007
276
Apian SurveyPro 4.0 User Guide
Except for the Overall column (which the simple crosstab can add), the
two are identical.
16. Double-click on Figure 3 again.
17. Click the Modify button
18. Click the Add button
next to the banner selection.
to insert a row item at the end of the list.
19. Set this new item to 3D Crosstab.
3D crosstabs have an “inner” and “outer” question, with outer being the
one on the top of the column heading. You’ll see in a moment. We’re
going to compare the respondent’s visit date against their trip purpose.
20. In the lower-right corner, set the Outer Crosstab to Q14: Arrival Date.
21. Click the More button to the right of the question selection.
22. Set the Modifier to Quarters and click OK.
23. Now set the Inner Crosstab to Q13: Trip Purpose.
24. Click OK, and OK again to see the table. You’ll have to scroll a little, since it’s
wrapping to three lines and breaking across the page.
Changing table layouts
One option for tables is to use a larger or landscape page layout, sometimes as a separate report document from the rest of the figures. There
are also layout options which let you condense a table or change its orientation.
1. In the toolbar, click Document Properties
Chapter 18 - Breaking Data Down
January 15, 2007
.
277
Apian SurveyPro 4.0 User Guide
2. In the General tab, click the Print Setup button.
3. Change the paper size to Legal, with a Landscape orientation.
4. Click OK twice, and notice the table is still wrapping.
5. Double-click on Figure 3.
6. Click on the Layout tab.
7. In the upper-right corner, click to turn on Percents below counts and Vertical
labels. Click OK.
Finally! Of course if we start adding more columns, maybe we’ll have to
shrink the font size as well.
When you look at the table, you’ll see the three items: Filter set to All
Forms, 2D crosstab, and 3D crosstab. The filter could be any Form Select,
and you could have several stacked up. You can also apply filters to the
2D and 3D crosstab items. In the 3D, the “Inside” question Trip Purpose is
repeated inside each of responses for the Outer Arrival Date question.
Cloning figures for a series of questions
Another way to display data for several questions is the Clone Figure
command—sometimes this makes it easier to compare results than a single really wide table. First let’s create our template figure.
1. Scroll to the bottom of the document and click the blue bar at the bottom.
2. Insert another Table.
3. Click Next twice to reach the By Crosstab/Filter screen.
4. Change the selection to One Question and pick Q13: Trip Purpose from the
drop-down list.
5. Turn on Counts and Percents near the middle of the dialog.
Chapter 18 - Breaking Data Down
January 15, 2007
278
Apian SurveyPro 4.0 User Guide
6. Click Next.
7. On the left-hand side of the Layout screen, click Gray behind tiles, no lines.
8. Click Finish.
Now for the cloning:
9. Click once on Figure 5 to select it.
10. Under the Insert menu (not the button), select Clone Figures.
11. Every question except the one used in the For Question tab is listed. In the
Clone column, click on the remaining grid questions, Q2-Q10.
Chapter 18 - Breaking Data Down
January 15, 2007
279
Apian SurveyPro 4.0 User Guide
12. Click OK, and OK again at the confirmation for 9 figures.
Of course you could do this with copy/paste and editing the new version,
as we did earlier, but this is the fastest way to replicate figures.
Using Report On to filter and replicate reports
There’s one more tool in this lesson, and it applies to an entire document,
not just one figure: Report On. Report On acts like a filter or crosstab at
the document level. Common applications include creating quarterly or
divisional breakdowns, as well as employee 360 surveys.
1. The changes are easiest to see graphically, so scroll to the top of the report
and double-click on Figure 1.
2. Click on the General tab, and change the figure type to Table + Bars.
3. Click on the For Question(s) tab, and at the bottom change the Modifiers
setting to Rescale. Select R1: Regions from the list.
4. Click OK.
5. Under the Document menu, select Report On.
There are two panels, for filter and repeat, which can be used separately
or together. Since filters we’ve touched on filters in other tutorials, we’ll
skip ahead to a repeat.
6. Click on the box for Apply Repeat.
Chapter 18 - Breaking Data Down
January 15, 2007
280
Apian SurveyPro 4.0 User Guide
The first option is whether you want this to be a global setting or only
impact figures using a special Form Select called Report On Selection.
Using the second setting is a great way to embed a database-wide Overall
column in a table, while the rest of the columns vary with the Report On
setting.
7. Leave the Step Using setting on Question, and select Q13: Trip Purpose from
the list.
8. Click Show Overall, and OK.
A little navigation palette popped up, which allows you to scroll through
the report views which were just created. These are just views of one document, and that if you edit a figure in one of the views it will ripple to all.
9. Click Forward and Back through the steps, and note the changes to the bar
lengths and counts as you do so.
10. Scroll down until you can see Figure 3, the Banner table, and note the
columns disappearing on all but step one (the Overall).
That’s it for this lesson, though the features we used can be applied and
combined in many other ways as well. If you are done playing with the
reports, exit SurveyPro. There’s a copy of the finished lesson file called
Components Tutorial End.SP4 in the SurveyPro Samples folder for your
reference.
Chapter 18 - Breaking Data Down
January 15, 2007
281
Appendix A
License Agreements
YOUR AGREEMENT TO LEGAL CONTRACT:
CAREFULLY READ THE FOLLOWING TERMS AND CONDITIONS
BEFORE USING THE SOFTWARE. YOUR USE OF THE SOFTWARE
INDICATES YOUR ACKNOWLEDGEMENT THAT YOU HAVE READ
THIS LICENSE, YOU UNDERSTAND IT, AND YOU AGREE TO BE
BOUND BY ITS TERMS AND CONDITIONS. IF YOU DO NOT AGREE
TO THESE TERMS AND CONDITIONS, RETURN THE SOFTWARE
AND USER MANUALS TO THE PLACE OF PURCHASE WITHIN 30
DAYS FROM THE DATE OF PURCHASE AS EVIDENCED BY A COPY
OF A VALID RECEIPT AND YOUR PURCHASE PRICE WILL BE
REFUNDED.
Chapter Contents:
Appendix A - License Agreements
January 15, 2007
Single User License . . . . . . . . . . . . . . . . . . . . . . . . . . . . . . . 283
Workgroup (Multi-user) Site License . . . . . . . . . . . . . . . . . . 285
NetCollect Server Application . . . . . . . . . . . . . . . . . . . . . . . 288
282
Apian SurveyPro 4.0 User Guide
Single User License
APIAN SOFTWARE LICENSE AGREEMENT for SurveyPro 4.0
SINGLE USER LICENSE
This Apian Software License Agreement (“License Agreement”) is a legal agreement
between you and Apian Software, Inc. (“Apian”) for the use of Apian Software product programs and files identified above (“Software”). Software consists of the computer program,
its accessory programs and included files, and may include associated media, printed
materials, any “on-line” or electronic documentation and also includes any updates and
supplements to the original Software provided to you by Apian. By installing, downloading,
accessing, copying, or in any way using the Software, you agree to be bound by the terms
of the License Agreement.
Ownership of Software, Copyright, Trademarks Retained
The Software is the property of Apian Software, Inc. The Software is protected by copyright laws and international copyright treaties, as well as other intellectual property laws
and treaties. The Software is licensed, not sold. All rights not expressly granted are
reserved by Apian.
Grant of License. Apian grants you the non-exclusive, non-sublicensable, limited license to
use the Software so long as you comply with all the terms of the License Agreement for
the Software use you have paid for.
Single User License. You may install and use this Software under a Single License as either
(1) a PERSONAL Configuration or as (2) a SINGLE-USER SITE Configuration, but not
both.
In a PERSONAL configuration you may install the Software wherever you are working, so
long as it used by one individual and no other. You may install the Software in machinereadable form on any computer(s), including on a network server, solely for one person’s
individual use, and so long as no other person can access the Software. You may NOT
allow more than one individual to use the Software at any time under this option.
OR
In a SINGLE-USER SITE configuration you may install the Software at a single Site. It may
be used by any person who normally works at this site, so long as the Software is used by
no more than one person at a time. You may install the Software in machine-readable form
on one computer only (workstation or LAN server). The Software may be accessed by a
person who normally works at the site on the one network server over a dial-up connection, Local Area Network, Virtual Private Network, or its equivalent where the program is
executed directly from the single copy on that server.
You may not combine elements of the PERSONAL and SINGLE-USER SITE Options.
If you need the right for more than one person to use the Software, please contact Apian
Software for Workgroup License information.
Backup Copy. You may make one (1) copy of the Software in machine-readable form solely
for backup purposes, provided that you reproduce all proprietary notices on the copy.
Transfer of Software. You may transfer your rights in the Software one time, from you to
one other person, provided you permanently transfer all rights under this Agreement, and
not for the purposes of a single project or segment of a project.
Appendix A - License Agreements
January 15, 2007
Single User License
283
Apian SurveyPro 4.0 User Guide
Limits on Modifications. You may not modify, translate, reverse engineer, decompile, disassemble, create derivative works based on, or copy (except for the backup copy) the Software or accompanying materials (except for sample code). You may not use or modify
sample source code except as required for its use with licensed Apian Software products.
You may not remove any proprietary notices, labels or marks on the software or accompanying materials.
NetCollect Web surveys. You may install on any Online server(s) HTML surveys exported
from NetCollect. Perl, ASP and other server application components included with NetCollect may be used with NetCollect HTML surveys by licensed users of NetCollect, but
may not be distributed separately, reverse-engineered or used for other purposes.
DirectCollect surveys. You may distribute as many copies of the run-time survey data collector and team interviewer modules as needed, or offer network access to them for
respondents, without additional licenses. Visual Basic source code included with DirectCollect may be modified and used with DirectCollect by licensed users of DirectCollect,
but may not be distributed separately, reverse-engineered or used for other purposes.
KeyCollect. You may install as many copies of the KeyCollect accessory program as you
wish for data entry to SurveyPro projects developed under this license.
Respondent EMailer. You may install as many copies of the Respondent EMailer accessory
program as you require to support SurveyPro projects developed under this license. The
Respondent EMailer is not licensed or supported for general use. Apian supports responsible bulk mailing. The Respondent EMailer may be used only for mailings which comply
with: current “Spam” or Unsolicited Bulk E-mail legislation, Acceptable Uses or similar
contractual obligations you may have with your Internet service provider(s) and opt-in
mailing lists.
Evaluation Software. Software identified as “Evaluation” or “Demonstration” may not be
resold, transferred or used for any purposes other than demonstration, test, or evaluation.
Upgrades and Conversions. If the Software is an upgrade of an earlier release, a conversion from another Apian Software product, or fulfillment of a Beta Subscription, then you
must cease using all earlier versions except for transitional use during the upgrade. You
may not loan, rent, sell or otherwise transfer any earlier version. This license agreement
replaces all prior license agreements effective with installation of the Software, and prior
Licenses for earlier versions are hereby terminated. Following installation, the Entire
agreement of both parties is governed by the terms of this current license agreement,
which supersedes all earlier versions.
Termination of License. Unauthorized copying of the Software (alone or merged with other
software) or the accompanying materials, or failure to comply with the restrictions in the
License Agreement automatically terminates this License Agreement. Upon termination
of the license, you must remove the Software from all computers on which it is installed,
and destroy or return to Apian the Software, accompanying materials, and any copies
made by you.
Limited Warranty and Disclaimer. Apian Software, Inc. warrants the media on which the
Software is furnished to be free of defects in material and workmanship under normal use
for a period of ninety (90) days from the date of delivery to you as evidenced by a copy of
your receipt. If any media does not conform to this limited warranty, your exclusive remedy is replacement of the media or, if Apian is unable to deliver replacement media, refund
of the purchase price and termination of the License Agreement.
NO OTHER WARRANTIES. EXCEPT FOR THE ABOVE WARRANTY, THE SOFTWARE
AND ACCOMPYING MATERIALS ARE PROVIDED WITHOUT WARRANTY OF ANY
KIND, EITHER EXPRESS, IMPLIED, STATUTORY, IN ANY COMMUNICATION WITH
Appendix A - License Agreements
January 15, 2007
Single User License
284
Apian SurveyPro 4.0 User Guide
APIAN SOFTWARE, INC., OR OTHERWISE, INCLUDING WITHOUT LIMITATION
IMPLIED WARRANTIES OF MERCHANTABILITY AND FITNESS FOR A PARTICULAR
PURPOSE. APIAN SOFTWARE, INC., DOES NOT WARRANT THAT THE FUNCTIONS
CONTAINED IN THE SOFTWARE WILL MEET YOUR REQUIREMENTS OR THAT
THE OPERATION OF THE SOFTWARE WILL BE UNINTRRUPTED OR ERROR FREE.
THE ENTIRE RISK AS TO THE USE, QUALITY, AND PERFORMANCE OF THE SOFTWARE IS WITH YOU.
SOME STATES DO NOT ALLOW EXCLUSION OF IMPLIED WARRANTIES SO THE
ABOVE EXCLUSION MAY NOT APPLY TO YOU. THIS LIMITED WARRANTY GIVES
YOU SPECIFIC LEGAL RIGHTS. YOU MAY HAVE OTHERS, WHICH VARY FROM
STATE TO STATE.
LIMITATION OF LIABILITY. TO THE MAXIMUM EXTENT PERMITTED BY APPLICABLE LAW, APIAN SOFTWARE, INC., SHALL IN NO EVENT BE LIABLE FOR ANY SPECIAL, INCIDENTAL, INDIRECT, OR CONSEQUENTIAL DAMAGES WHATSOEVER
(INCLUDING, WITHOUT LIMITATION, DAMAGES FOR LOSS OF BUSINESS PROFITS,
BUSINESS INTERRUPTION, LOSS OF BUSINESS INFORMATION, OR ANY OTHER
PECUNIARY LOSS) ARISING OUT OF THE USE OF OR INABILITY TO USE THE
SOFTWARE OR THE PROVISION OF OR FAILURE TO PROVIDE SUPPORT SERVICES,
EVEN IF APIAN SOFTWARE, INC. HAS BEEN ADVISED OF THE POSSIBLITY OF
SUCH DAMAGES. IN EVERY CASE, APIAN SOFTWARE, INC.’S MAXIMUM LIABILITY
UNDER ANY PROVISION OF THE LICENSE AGREEMENT SHALL BE LIMITED TO
THE AMOUNT ACTUALLY PAID BY YOU FOR THE SOFTWARE OR USD $5.00,
WHICHEVER IS GREATER.
General. This agreement will be governed by the laws of the State of Washington. Any suit
regarding this License shall be brought only in King County, Washington. This Agreement
is the entire agreement between us and supersedes any other communications with
respect to the Software and accompanying materials. If any provision of this Agreement is
held unenforceable, the remainder of this agreement shall continue in full force and effect.
U.S. Government Restricted Rights. Government Use. The Software and accompanying
documentation are deemed to be “commercial computer software” and “commercial computer software documentation,” respectively, pursuant to DFAR Section 227.7202 and FAR
Section 12.212, as applicable. Any use, modification, reproduction, release, performance,
display or disclosure of the Software and accompanying documentation by the U.S. Government shall be governed solely by the terms of this License Agreement and shall be prohibited except to the extent expressly permitted by the terms of the License Agreement.
If you have any questions, please contact the manufacturer in writing: Apian Software,
Inc., 115 N 85th Street, Suite 204, Seattle, WA 98103.
Workgroup (Multi-user) Site License
APIAN SOFTWARE LICENSE AGREEMENT for SurveyPro 4.0
WORKGROUP SITE LICENSE for simultaneous users.
This Apian Software License Agreement (“License Agreement”) is a legal agreement
between you and Apian Software, Inc. (“Apian”) for the use of Apian Software product programs and files identified above (“Software”). Software consists of the computer program,
its accessory programs and included files, and may include associated media, printed
materials, any “on-line” or electronic documentation and also includes any updates and
supplements to the original Software provided to you by Apian. By installing, downloading,
Appendix A - License Agreements
January 15, 2007
Workgroup (Multi-user) Site License
285
Apian SurveyPro 4.0 User Guide
accessing, copying, or in any way using the Software, you agree to be bound by the terms
of the License Agreement.
Ownership of Software, Copyright, Trademarks Retained
The Software is the property of Apian Software, Inc. The Software is protected by copyright laws and international copyright treaties, as well as other intellectual property laws
and treaties. The Software is licensed, not sold. All rights not expressly granted are
reserved by Apian.
Grant of License. Apian grants you the non-exclusive, non-sublicensable, limited license to
use the Software so long as you comply with all the terms of the License Agreement for
the Software use you have paid for.
Workgroup Site License. If you have purchased use of the Software under a Workgroup
License, you may install the Software in machine-readable form for use at a single site. A
Workgroup License is limited to a specified number of simultaneous users (the number of
which is specified at the top of this license and is controlled and/or monitored by a serial
number placed within the master disk provided to you) who work at one site. A Workgroup
License does not allow the Software to be installed at more than one physical site. The
Software may be shared subject to these limitations by the licensed users in one of the
ways outlined below.
You may:
1. Install the Software in machine-readable form, on one server and/or one or more
independent computers (not exceeding the total number of licensed simultaneous users)
at one site. Users who normally work at the site may access the Software on the one network server over a dial-up connection, Local Area Network, Virtual Private Network, or its
equivalent where the program is executed directly from the single copy on that server;
2. Allow up to the number of licensed users who work at one site to use the Software at
one time; and
3. Physically move the Software from one computer to another, provided the Software is
installed on no more computers than, and used by no more than the number of licensed
users at one site at any one time.
Backup Copy. You may make one (1) copy of the Software in machine-readable form solely
for backup purposes, provided that you reproduce all proprietary notices on the copy.
Transfer of Software. You may transfer your rights in the Software one time, from you to
one other person, provided you permanently transfer all rights under this Agreement, and
not for the purposes of a single project or segment of a project.
Limits on Modifications. You may not modify, translate, reverse engineer, decompile, disassemble, create derivative works based on, or copy (except for the backup copy) the Software or accompanying materials (except for sample code). You may not use or modify
sample source code except as required for its use with licensed Apian Software products.
You may not remove any proprietary notices, labels or marks on the software or accompanying materials.
NetCollect Web surveys. You may install on any Online server(s) HTML surveys exported
from NetCollect. Perl, ASP and other server application components included with NetCollect may be used with NetCollect HTML surveys by licensed users of NetCollect, but
may not be distributed separately, reverse-engineered or used for other purposes.
DirectCollect surveys. You may distribute as many copies of the run-time survey data collector and team interviewer modules as needed, or offer network access to them for
Appendix A - License Agreements
January 15, 2007
Workgroup (Multi-user) Site License
286
Apian SurveyPro 4.0 User Guide
respondents, without additional licenses. Visual Basic source code included with DirectCollect may be modified and used with DirectCollect by licensed users of DirectCollect,
but may not be distributed separately, reverse-engineered or used for other purposes.
KeyCollect. You may install as many copies of the KeyCollect accessory program as you
wish for data entry to SurveyPro projects developed under this license.
Respondent EMailer. You may install as many copies of the Respondent EMailer accessory
program as you require to support SurveyPro projects developed under this license. The
Respondent EMailer is not licensed or supported for general use. Apian supports responsible bulk mailing. The Respondent EMailer may be used only for mailings which comply
with: current “Spam” or Unsolicited Bulk E-mail legislation, Acceptable Uses or similar
contractual obligations you may have with your Internet service provider(s) and opt-in
mailing lists.
Evaluation Software. Software identified as “Evaluation” or “Demonstration” may not be
resold, transferred or used for any purposes other than demonstration, test, or evaluation.
Upgrades and Conversions. If the Software is an upgrade of an earlier release, a conversion from another Apian Software product, or fulfillment of a Beta Subscription, then you
must cease using all earlier versions except for transitional use during the upgrade. You
may not loan, rent, sell or otherwise transfer any earlier version. This license agreement
replaces all prior license agreements effective with installation of the Software, and prior
Licenses for earlier versions are hereby terminated. Following installation, the Entire
agreement of both parties is governed by the terms of this current license agreement,
which supersedes all earlier versions.
Termination of License. Unauthorized copying of the Software (alone or merged with other
software) or the accompanying materials, or failure to comply with the restrictions in the
License Agreement automatically terminates this License Agreement. Upon termination
of the license, you must remove the Software from all computers on which it is installed,
and destroy or return to Apian the Software, accompanying materials, and any copies
made by you.
Limited Warranty and Disclaimer. Apian Software, Inc. warrants the media on which the
Software is furnished to be free of defects in material and workmanship under normal use
for a period of ninety (90) days from the date of delivery to you as evidenced by a copy of
your receipt. If any media does not conform to this limited warranty, your exclusive remedy is replacement of the media or, if Apian is unable to deliver replacement media, refund
of the purchase price and termination of the License Agreement.
NO OTHER WARRANTIES. EXCEPT FOR THE ABOVE WARRANTY, THE SOFTWARE
AND ACCOMPYING MATERIALS ARE PROVIDED WITHOUT WARRANTY OF ANY
KIND, EITHER EXPRESS, IMPLIED, STATUTORY, IN ANY COMMUNICATION WITH
APIAN SOFTWARE, INC., OR OTHERWISE, INCLUDING WITHOUT LIMITATION
IMPLIED WARRANTIES OF MERCHANTABILITY AND FITNESS FOR A PARTICULAR
PURPOSE. APIAN SOFTWARE, INC., DOES NOT WARRANT THAT THE FUNCTIONS
CONTAINED IN THE SOFTWARE WILL MEET YOUR REQUIREMENTS OR THAT
THE OPERATION OF THE SOFTWARE WILL BE UNINTRRUPTED OR ERROR FREE.
THE ENTIRE RISK AS TO THE USE, QUALITY, AND PERFORMANCE OF THE SOFTWARE IS WITH YOU.
SOME STATES DO NOT ALLOW EXCLUSION OF IMPLIED WARRANTIES SO THE
ABOVE EXCLUSION MAY NOT APPLY TO YOU. THIS LIMITED WARRANTY GIVES
YOU SPECIFIC LEGAL RIGHTS. YOU MAY HAVE OTHERS, WHICH VARY FROM
STATE TO STATE.
Appendix A - License Agreements
January 15, 2007
Workgroup (Multi-user) Site License
287
Apian SurveyPro 4.0 User Guide
LIMITATION OF LIABILITY. TO THE MAXIMUM EXTENT PERMITTED BY APPLICABLE LAW, APIAN SOFTWARE, INC., SHALL IN NO EVENT BE LIABLE FOR ANY SPECIAL, INCIDENTAL, INDIRECT, OR CONSEQUENTIAL DAMAGES WHATSOEVER
(INCLUDING, WITHOUT LIMITATION, DAMAGES FOR LOSS OF BUSINESS PROFITS,
BUSINESS INTERRUPTION, LOSS OF BUSINESS INFORMATION, OR ANY OTHER
PECUNIARY LOSS) ARISING OUT OF THE USE OF OR INABILITY TO USE THE
SOFTWARE OR THE PROVISION OF OR FAILURE TO PROVIDE SUPPORT SERVICES,
EVEN IF APIAN SOFTWARE, INC. HAS BEEN ADVISED OF THE POSSIBLITY OF
SUCH DAMAGES. IN EVERY CASE, APIAN SOFTWARE, INC.’S MAXIMUM LIABILITY
UNDER ANY PROVISION OF THE LICENSE AGREEMENT SHALL BE LIMITED TO
THE AMOUNT ACTUALLY PAID BY YOU FOR THE SOFTWARE OR USD $5.00,
WHICHEVER IS GREATER.
General. This agreement will be governed by the laws of the State of Washington. Any suit
regarding this License shall be brought only in King County, Washington. This Agreement
is the entire agreement between us and supersedes any other communications with
respect to the Software and accompanying materials. If any provision of this Agreement is
held unenforceable, the remainder of this agreement shall continue in full force and effect.
U.S. Government Restricted Rights. Government Use. The Software and accompanying
documentation are deemed to be “commercial computer software” and “commercial computer software documentation,” respectively, pursuant to DFAR Section 227.7202 and FAR
Section 12.212, as applicable. Any use, modification, reproduction, release, performance,
display or disclosure of the Software and accompanying documentation by the U.S. Government shall be governed solely by the terms of this License Agreement and shall be prohibited except to the extent expressly permitted by the terms of the License Agreement.
If you have any questions, please contact the manufacturer in writing: Apian Software,
Inc., 115 N 85th Street, Suite 204, Seattle, WA 98103.
NetCollect Server Application
APIAN SOFTWARE LICENSE AGREEMENT for the NetCollect Server Application
This Apian Software License Agreement (“License Agreement”) is a legal agreement
between you and Apian Software, Inc. (“Apian”) for the use of Apian Software product programs and files identified above (“Software”). Software consists of the computer program
and included files and may include associated media, printed materials, any “on-line” or
electronic documentation and also includes any updates and supplements to the original
Software provided to you by Apian. By installing, downloading, accessing, copying, or in
any way using the Software, you agree to be bound by the terms of the License Agreement.
Ownership of Software, Copyright, Trademarks Retained
The Software is the property of Apian Software, Inc. The Software is protected by copyright laws and international copyright treaties, as well as other intellectual property laws
and treaties. The Software is licensed, not sold. All rights not expressly granted are
reserved by Apian.
Grant of License. Apian grants you the non-exclusive, non-sublicensable, limited license to
use the Software so long as you comply with all the terms of the License Agreement for
the Software use you have paid for.
Backup Copy. You may make one (1) copy of the Software in machine-readable form solely
for backup purposes, provided that you reproduce all proprietary notices on the copy.
Appendix A - License Agreements
January 15, 2007
NetCollect Server Application
288
Apian SurveyPro 4.0 User Guide
Transfer of Software. You may transfer your rights in the Software one time, from you to
one other person, provided you permanently transfer all rights under this Agreement, and
not for the purposes of a single project or segment of a project.
Limits on Modifications. You may not modify, translate, reverse engineer, decompile, disassemble, create derivative works based on, or copy (except for the backup copy) the Software or accompanying materials (except for sample code). You may not use or modify
sample source code except as required for its use with licensed Apian Software products.
You may not remove any proprietary notices, labels or marks on the software or accompanying materials.
Evaluation Software. Software identified as “Evaluation” or “Demonstration” may not be
resold, transferred or used for any purposes other than demonstration, test, or evaluation.
Upgrades and Conversions. If the Software is an upgrade of an earlier release, a conversion from another Apian Software product, or fulfillment of a Beta Subscription, then you
must cease using all earlier versions except for transitional use during the upgrade. You
may not loan, rent, sell or otherwise transfer any earlier version. This license agreement
replaces all prior license agreements effective with installation of the Software, and prior
Licenses for earlier versions are hereby terminated. Following installation, the Entire
agreement of both parties is governed by the terms of this current license agreement,
which supersedes all earlier versions.
Termination of License. Unauthorized copying of the Software (alone or merged with other
software) or the accompanying materials, or failure to comply with the restrictions in the
License Agreement automatically terminates this License Agreement. Upon termination
of the license, you must remove the Software from all computers on which it is installed,
and destroy or return to Apian the Software, accompanying materials, and any copies
made by you.
Limited Warranty and Disclaimer. Apian Software, Inc. warrants the media on which the
Software is furnished to be free of defects in material and workmanship under normal use
for a period of ninety (90) days from the date of delivery to you as evidenced by a copy of
your receipt. If any media does not conform to this limited warranty, your exclusive remedy is replacement of the media or, if Apian is unable to deliver replacement media, refund
of the purchase price and termination of the License Agreement.
NO OTHER WARRANTIES. EXCEPT FOR THE ABOVE WARRANTY, THE SOFTWARE
AND ACCOMPYING MATERIALS ARE PROVIDED WITHOUT WARRANTY OF ANY
KIND, EITHER EXPRESS, IMPLIED, STATUTORY, IN ANY COMMUNICATION WITH
APIAN SOFTWARE, INC., OR OTHERWISE, INCLUDING WITHOUT LIMITATION
IMPLIED WARRANTIES OF MERCHANTABILITY AND FITNESS FOR A PARTICULAR
PURPOSE. APIAN SOFTWARE, INC., DOES NOT WARRANT THAT THE FUNCTIONS
CONTAINED IN THE SOFTWARE WILL MEET YOUR REQUIREMENTS OR THAT
THE OPERATION OF THE SOFTWARE WILL BE UNINTRRUPTED OR ERROR FREE.
THE ENTIRE RISK AS TO THE USE, QUALITY, AND PERFORMANCE OF THE SOFTWARE IS WITH YOU.
SOME STATES DO NOT ALLOW EXCLUSION OF IMPLIED WARRANTIES SO THE
ABOVE EXCLUSION MAY NOT APPLY TO YOU. THIS LIMITED WARRANTY GIVES
YOU SPECIFIC LEGAL RIGHTS. YOU MAY HAVE OTHERS, WHICH VARY FROM
STATE TO STATE.
LIMITATION OF LIABILITY. TO THE MAXIMUM EXTENT PERMITTED BY APPLICABLE LAW, APIAN SOFTWARE, INC., SHALL IN NO EVENT BE LIABLE FOR ANY SPECIAL, INCIDENTAL, INDIRECT, OR CONSEQUENTIAL DAMAGES WHATSOEVER
(INCLUDING, WITHOUT LIMITATION, DAMAGES FOR LOSS OF BUSINESS PROFITS,
Appendix A - License Agreements
January 15, 2007
NetCollect Server Application
289
Apian SurveyPro 4.0 User Guide
BUSINESS INTERRUPTION, LOSS OF BUSINESS INFORMATION, OR ANY OTHER
PECUNIARY LOSS) ARISING OUT OF THE USE OF OR INABILITY TO USE THE
SOFTWARE OR THE PROVISION OF OR FAILURE TO PROVIDE SUPPORT SERVICES,
EVEN IF APIAN SOFTWARE, INC. HAS BEEN ADVISED OF THE POSSIBLITY OF
SUCH DAMAGES. IN EVERY CASE, APIAN SOFTWARE, INC.’S MAXIMUM LIABILITY
UNDER ANY PROVISION OF THE LICENSE AGREEMENT SHALL BE LIMITED TO
THE AMOUNT ACTUALLY PAID BY YOU FOR THE SOFTWARE OR USD $5.00,
WHICHEVER IS GREATER.
General. This agreement will be governed by the laws of the State of Washington. Any suit
regarding this License shall be brought only in King County, Washington. This Agreement
is the entire agreement between us and supersedes any other communications with
respect to the Software and accompanying materials. If any provision of this Agreement is
held unenforceable, the remainder of this agreement shall continue in full force and effect.
U.S. Government Restricted Rights. Government Use. The Software and accompanying
documentation are deemed to be “commercial computer software” and “commercial computer software documentation,” respectively, pursuant to DFAR Section 227.7202 and FAR
Section 12.212, as applicable. Any use, modification, reproduction, release, performance,
display or disclosure of the Software and accompanying documentation by the U.S. Government shall be governed solely by the terms of this License Agreement and shall be prohibited except to the extent expressly permitted by the terms of the License Agreement.
SERVER APPLICATION EXTENSION:
NetCollect is an extension of your SurveyPro Software.
This optional installation adds the following to the contract terms, conditions, warranties,
and limitations of liability in Apian’s Software License Agreement above:
You may install on any Online server(s) HTML and ASP surveys exported from NetCollect
along with the Apian Server Application components to support them. Any ASP, perl,
DLLs, sample code or other server application components included with NetCollect may
be used with NetCollect HTML surveys by licensed users of NetCollect, but may not be
distributed separately, reverse-engineered or used for other purposes.
CONTACT INFORMATION:
If you have any questions, please contact the manufacturer in writing: Apian Software,
Inc., 115 N 85th Street, Suite 204, Seattle, WA 98103.
Appendix A - License Agreements
January 15, 2007
NetCollect Server Application
290
Index
Symbols
C
#4 button 44, 239
+ button 6
callouts 45, 49
camera button 6
captions 192
Cascade windows on screen 22
character map 44
characters, special 44
charts see figures
checkbox scales 71, 73, 122, 127
Chi-squared 209, 223
cleaning data see data cleaning
Clear Answers 114
clipboard 17, 114
Clone Figure dialog 206, 268
coaching 2
Color Fill Set 191, 250
colors 37
column widths in grids 65
columns 50
Columns tab, Question Grid dialog 63
comma delimited ASCII files 144, 147, 149, 162
comments see written answer scales
compare groups figures 185, 192
Compare Groups tab, Figure dialog 201
components 15
confidence interval 209
Contents tab, Figure dialog 204
cookies 88
Copy 17, 114
Copy Document 20
Copy Last Form 114
Copy Last Form’s Answers 114
copying answers 122
counts 207
crosstabs 190, 206, 211, 223, 225, 253
CSV data files 144, 147, 149, 162, 172
cumulative % 208
currency scales 77
Cut 17, 114
Numerics
360 surveys 238, 240
A
About SurveyPro 22
access controls 10, 26
Access database files 143, 148, 149, 163
Add button 6
Advanced options Tab, Question dialog 58
Anchor Graphic dialog 45, 49
annotations 45, 49
Answer Entries tab, Question Grid dialog 64
Answer Entry 21, 86, 112, 113, 121, 124, 131, 132
answer lists 116
Answer Mapping tab, Rescale dialog 220
Answer Replace 116, 130, 132
answer tests 58, 64, 153
Arrange Icons 22
ASCII data files 144, 147, 149, 162, 172
automatic save 10, 26
Autonumber 41, 56, 65
Autonumber tab, Document Properties dialog 38
B
backup files 10
BAK backup files 10
Banner dialog 225
Banners 190, 211, 223, 225, 268
bar charts 185, 188, 189, 190, 192, 195, 201, 253
Batch Import dialog 155
bold text 42
bottom box 208
branching 20, 82
Breaks dialog 50
bubbles for scanning 36
bullets 44
By Crosstab/Filter tab, Figure dialog 190
Index
January 15, 2007
291
Apian SurveyPro 4.0 User Guide
Executive Summary tab, Document Properties dialog
D
data cleaning 123, 125, 126, 130, 132, 153, 172,
185, 204
Data Cleaning dialog 126
Data Cleaning tab, Import dialog 153
data collection 117
data entry 26, 112, 121, 130, 131, 132
data files 111
data structures 69
data table figures 185, 192, 204
Data Table report 244
Data Table tab, Document Properties dialog 246
Database menu 21, 116
databases 143, 169
exporting to 142, 163, 165, 166, 167
importing from 142, 148, 149
key terms 111
SurveyPro’s 111
date scales 72, 74, 122
Date-Time Inputs tab, Rescale dialog 219
decimal scales 77
Delete 6, 17, 40
Delete Document 20
Delete Form 115
deleting
documents 20
forms 115, 128
Dimensions Tab, Question dialog 59
DirectCollect 9, 31, 81, 89, 117, 142, 146, 155
discussion list 2
Document menu 20
Document Properties dialog 30, 31, 32, 33, 34, 35,
36, 37, 38, 91, 245, 246, 248
Document Tabs 18
documents 13, 14, 23, 131
adding 20
copying 20
deleting 20
opening 18, 20
publishing 89, 123, 251, 252
see also questionnaires
see also reports
dot fill 65
dual scale grids 61, 63
Duplicate 6
E
é button 44
Edit Items tab, Question Groups dialog 233
Edit menu 17, 114
e-mail survey invitations 9
e-mail surveys 9
Executive Summary report 243
Index
January 15, 2007
245
export 142, 159, 162, 171
Access MDB files 143, 163
ASCII data files 144, 162
field names 170
figures 251, 252
KeyCollect data 142, 160
logs 168
SDE files 142, 160
SQL databases 143, 165, 166, 167
ST3 files 143, 160
STL files 143, 160
Export dialog 159, 160, 162, 163, 164, 165, 166,
167
F
Field Matchup tab, Export dialog 166
Field Matchup tab, Import dialog 149
Field Names dialog 170
Field Selection tab, Export dialog 164
fields 111
Figure dialog 187, 188, 189, 190, 191, 192, 193,
194, 195, 196, 198, 199, 201, 204
figures 15, 183, 185, 187, 192, 206
colors 191, 250
duplicating 206, 268
exporting 251, 252
labels 56, 248
numbering 38, 268
rearranging 39
resizing 39
File History 25, 90
File menu 17, 114
Fill Passwords 116, 119
filters see Form Select Filters
Find Duplicates 115
Find Form Select 115
Find Same Answers 115
fixed response options 72
flip scales 64
fonts 42, 43
Footer tab, Document Properties dialog 35
footers 30, 35
footnotes on figures 248
For Questions tab, Figure dialog 188, 199
For Statistics tab, Figure dialog 189
forced rank scales 78
forced sum scales 65
Form IDs 111
Form menu 115
Form Select Filters 132, 190, 211, 212, 213, 225,
238, 240, 253
292
Apian SurveyPro 4.0 User Guide
forms 111, 208
deleting 115, 128
forums 2
frequency measures 207
G
General tab, Document Properties dialog 31, 32
General tab, Export dialog 160, 162, 163, 165
General tab, Figure dialog 187
General tab, Import dialog 146, 147, 148
General tab, Question Grid dialog 60
GoTo 82
Graph Color Fills dialog 191, 250
graphics 34, 45, 46, 49
graphs see figures
grids of questions see question grids
H
Header tab, Document Properties dialog 35
headers 30, 35
headings 33, 46, 192, 248
Help menu 22
hide
grid columns 63
grid rows 62
scale items 58
high-low scales 77
HTML questionnaires 9, 31, 89
HTML reports 251
I
ID scales 71, 75
IDHH_KCPUB 89
images 34, 46
import 86, 142, 144, 147, 149, 155, 171, 172
Access MDB files 143, 148, 149
ASCII data files 144, 147, 149, 172
DirectCollect data 142, 146, 155
field names 144, 170
KeyCollect data 142, 146, 155
keyed 151
logs 157
maps 144
merge 151
NetCollect data 142, 146
SDD files 142, 146, 155
SDE files 142, 146, 155
SDH files 142, 146
SQL databases 143, 148, 149
ST3 files 143, 146
STL files 143, 146
SurveyPro 2.0 files 142, 146
SurveyPro 3.0 files 143, 146
SurveyPro 4.0 files 143, 146
Index
January 15, 2007
Import dialog 144, 146, 147, 148, 149, 151, 153
indentation 59, 65
Inline graphics 46
Inline Text/Graphics 45
Insert 6, 40
Insert menu 19
instructions 46
italic text 42
K
Key and Scale Label Maps tab, Export dialog 167
Key tab, Import dialog 151
KeyCollect 10, 89, 117, 142, 146, 155, 160
kiosk surveys 9, 31, 81
knowledgebase 2, 6
L
labels in figures 56, 66, 225, 248
labels in questionnaires 30, 36
languages, surveys in multiple 85
Last Form 115
Layout tab, Document Properties dialog 36, 37
Layout tab, Figure dialog 191, 193, 194, 195, 196,
198, 199, 201, 204
Layout tab, Question Grid dialog 65
layouts 31, 32, 37, 57, 58, 59, 60, 64, 65, 250
license agreements 22, 282
Likert scales 73
line charts 185, 190, 192, 199, 201
Lock Changes 17
locking documents 10
locking forms 118
Logo Graphic tab, Document Properties dialog 34
logos 30, 34, 91
logs 25, 90
export 168
import 157
publish 28
low-high scales 77
M
mail merge 118
margins 30, 31, 32, 50, 59
Mass Delete 116, 128
Mass Replace 116, 130
maximum 209
maximum scale boxes 58
MDB files 143, 148, 149, 163
mean 208
median 208
medium for questionnaires 31, 81
293
Apian SurveyPro 4.0 User Guide
menus 14, 16, 113
Database menu 21, 116
Document menu 20
Edit menu 17, 114
File menu 17, 114
Form menu 115
Help menu 22
Insert menu 19
Tools menu 22, 116
View menu 18, 115
Window menu 22
Merge into Question Grid dialog 67
Microsoft Access 143, 148, 149, 163
minimum 209
minimum scale boxes 58
mismatches during import 153, 157, 171
modifiers 216, 217
Modify 6, 17, 40
multiple questionnaire documents 83
Must Answer questions 126
N
NA 30, 36
NetCollect 9, 31, 81, 89, 117, 142, 146
New 17
New Form Questionnaire 114
New Questionnaire 20
New Report 20
Next Form 115
No Answers 208
Not Applicable 30, 36
Number Inputs tab, Rescale dialog 219
number scales 72, 77, 122
numbering
figures 38, 268
pages 30, 35, 37, 44
questions 26, 30, 38, 41, 56, 65, 191
O
Object Tree 14, 15, 18
OCR 36
OMR 36
Open 17
Open Document 18, 20
open-ended questions see written answer scales
Options dialog 26, 121, 132
ordered scales 70
Other blanks 30, 36
Other responses 189
Output Bins tab, Question Groups dialog 237
Output Bins tab, Rescale dialog 222
P
Page graphics 46
page numbering 30, 35, 37, 44
Page Setup 17, 30
page size 31, 32
Page Text/Graphics 45
paper size 31, 32
passwords 10, 26, 86, 116, 119, 127, 153
Paste 17, 114
patching SurveyPro 3
pattern scales 71, 75
pencil buttons 6, 17
percentage scales 77
percents 207
pictures 34
pie charts 185, 188, 190, 192, 196, 253
PIN files 87, 119
plus button 6
postcoding see data cleaning
Preferences dialog 26
Preload Answers 115, 121
Print 17
Print Preview 17
Print Setup 17, 31, 32
Print with Data 118
profile graphs 185, 190, 192, 199, 201
project status 25
Protect Answers 114, 118
Publish 20
logs 28, 90
questionnaires 10, 89, 123
reports 251
Publish Report Figures for Printing dialog 252
Publish Report to Web dialog 251
Q
Question dialog 55, 56, 57, 58, 59
Question Grid dialog 60, 61, 62, 63, 64, 65, 66
question grids 53, 60, 61, 62, 63, 64, 65, 66, 77, 78,
91, 102
splitting 68
tinted bands 37
question groups 60, 199, 201, 206, 211, 228, 253
Question Groups dialog 232, 233, 236, 237
question labels 248
question library 14, 15
question names 248
question numbering 26, 30, 53
Question Tab, Question dialog 56
questionnaires 13, 30
locking 10
medium 31, 81
publishing 89, 123
page breaks 50
Index
January 15, 2007
294
Apian SurveyPro 4.0 User Guide
questions 15, 53, 55, 56, 57, 58, 59, 91
linked tiles 84
merging into grids 67
numbering 38, 41, 56, 65, 191
rearranging 39
resizing 39
see also question grids
Quick Set tab, Question Grid dialog 61
Quit Answer Entry 114
R
randomize 58, 62, 64
ranking scales 71, 78, 122
rating scales 71, 77, 122, 127
read only forms 118
rearranging scales 58
see also Rescales
records 111
Redo 17
Refresh Answer Lists 116
replies 208
report labels 56
Report Labels tab, Question Grid dialog 66
Report On 211, 238, 240, 268
Report On Value filter 240
reports 13, 32, 37, 185
copying 238
filtering 238
HTML 251
publishing 251, 252
Rescale dialog 217, 219, 220, 222
Rescales 211, 216, 217, 268
respondent 111
Respondent EMailer 9
reverse scale layouts 58, 64
Rows tab, Question Grid dialog 62
S
Sample Weights dialog 215
Save 17
automatic 10, 26
Save As 17
Scale dialog 72, 73, 74, 75, 77, 78
Scale Value Mapping dialog 171
Scaled Entry Tab, Question dialog 57
scales 15, 57, 61, 63, 64, 65, 69, 72, 73, 74, 75, 77,
78, 91
forced sum 65
mapping labels and values 171
rearranging 58
see also answer tests
see also Rescales
scannable surveys 36, 81, 117
scatterplots 185, 192, 201, 253
Index
January 15, 2007
scoring 211, 228, 232
SDD DirectCollect data files 142, 146, 155
SDE KeyCollect data files 142, 146, 155, 160
SDH NetCollect data files 142, 146
SDT KeyCollect template files 89
security 10, 26, 86, 119
Select Items tab, Question Groups dialog 232
semantic differential scales 77
serial number 22
Set Items dialog 206
significance measures 209
Skip Patterns 20
skip patterns 82
Skips and Branches dialog 82
social security number scale 71
sorting in figures 189, 208
SP3 SurveyPro 3.0 files 143, 146
SP4 SurveyPro 4.0 files 6, 143, 146
spelling check 23, 122
Split Question Grid dialog 68
SQL Connection dialog 169
SQL databases 143, 148, 149, 165, 166, 167, 169
ST3 survey tag language files 143, 146, 160
stacked bar charts 185, 188, 190, 192, 198, 253
standard deviation (std dev) 208
standard error of mean 209
statistical labels 248
statistical measures 208
statistics 207
Status Bar 18
STL survey tag language files 143, 146, 160
Stub Lists 206, 268
sum 209
support 2
survey tag language 143, 146, 160
SurveyPro 2.0 142, 146
SurveyPro 3.0 143, 146
SurveyTalk list 2
SVA SurveyPro 2.0 files 142, 146
T
tab delimited ASCII files 144, 147, 149, 162
table+bar figures 185, 188, 189, 190, 192, 194
tables 185, 188, 189, 190, 192, 193, 206, 253
tables of questions see question grids
tabulations 207
technical support 2
telephone interviewing 9, 81
telephone number scale 71
test scoring 228, 232
text figures 185, 188, 189, 190, 192, 193, 206, 253
text formatting 42, 43
Text Palette 44
Text Styles 42, 43, 91
295
Apian SurveyPro 4.0 User Guide
Tile windows on screen 22
tiles 13, 39, 53
numbering 41
time scales 74, 122
tinted bands for grids 60
Title tab, Document Properties dialog 33, 248
Title-Caption tab, Figure dialog 192
titles 30, 33, 248
toolbars 14, 18
Tools menu 22, 116
top box 208
training 2
tree 14, 15
typeface 42, 43
U
Undo 17
unordered scales 69
updating SurveyPro 3
V
validation see answer tests
variables 44, 239
verbatims see written answer scales
View menu 18, 115
Void Form 115
W
Web reports 251
Web surveys 9, 31, 89
weighting 211, 215, 228, 232
Weighting tab, Question Groups dialog 236
Window menu 22
Wingdings 44
written answer scales 70, 123, 127, 253
reporting 193
Written Answers tab, Rescale dialog 217
Z
Zip code scale 71
Zoom 18, 115
Index
January 15, 2007
296