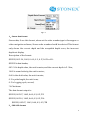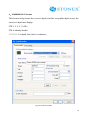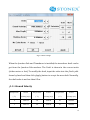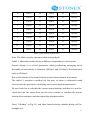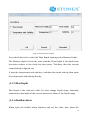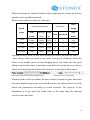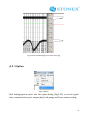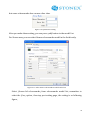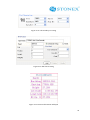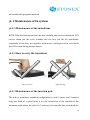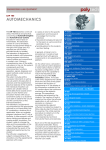
1
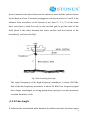
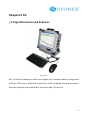
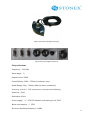
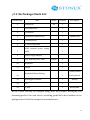
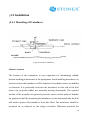
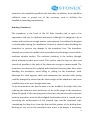
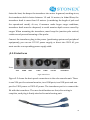
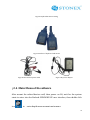
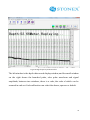
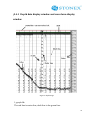
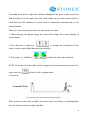
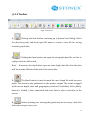
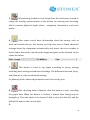
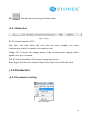
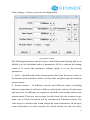
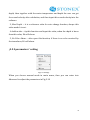
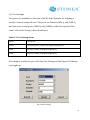
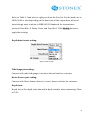
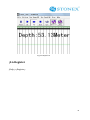
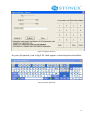
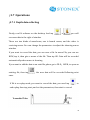
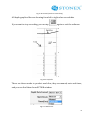
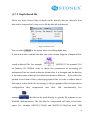
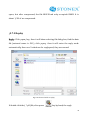
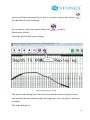
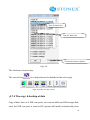
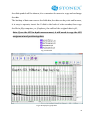
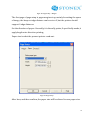
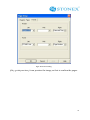
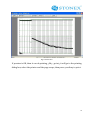
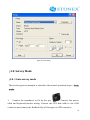
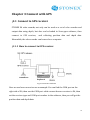
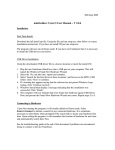
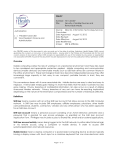
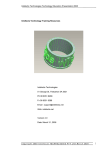
User manual STONEX E6 Contents Chapter1 Preview...................................................................................................... 3 ¡1.1 Introduction .......................................................................................................................3 ¡1.2 Echo Sounding P rinciples............................................................................................3 ¡1.2.1 Echo Sounding Principles ...............................................................................3 ¡1.2.2 Pulse length ............................................................................................................4 ¡1.2.3 Blanking Pulse Length ......................................................................................5 ¡1.2.4 Power Adjudt ........................................................................................................5 ¡1.2.5 Gain ...........................................................................................................................6 ¡1.2.6 Threshold ...............................................................................................................6 ¡1.2.7 Depth ranging ......................................................................................................6 ¡1.3 Related terms ....................................................................................................................7 ¡1.3.1 Three type depth data .......................................................................................7 ¡1.3.2 Data format ............................................................................................................7 ¡1.3.3 Draft setting ....................................................................................................... 11 ¡1.3.4 Sound Velocity ................................................................................................... 12 ¡1.3.5 Max Depth ........................................................................................................... 14 ¡1.3.6 Shallow alarm .................................................................................................... 14 ¡1.3.7 No Echo Alarm .................................................................................................. 15 Chapter2 E6 .............................................................................................................. 16 ¡ 2.1Specifications and Features ..................................................................................... 16 ¡ 2.2 E6 Package Check List .............................................................................................. 19 ¡ 2.3 Installation ...................................................................................................................... 20 ¡2.3.1 Mounting of Transducer ............................................................................... 20 ¡2.3.2 Interfaces ............................................................................................................ 22 ¡ 2.4 Main Menu of E6 software ...................................................................................... 23 ¡2.4.1 Depth data display window and waveform display window ........ 25 ¡2.4.2 Toolbar ................................................................................................................. 27 ¡2.4.3 Status bar ............................................................................................................. 30 ¡ 2.5 Parameters ..................................................................................................................... 30 ¡2.5.1 Parameters setting .......................................................................................... 30 ¡2.5.2 parameters' setting ......................................................................................... 32 ¡2.5.3 Option ................................................................................................................... 36 1 ¡2.6 Register ............................................................................................................................. 40 ¡ 2.7 Operations ...................................................................................................................... 42 ¡2.7.1 Depth data collecting ...................................................................................... 42 ¡2.7.2 Depth Result file ............................................................................................... 45 ¡2.7.3 Replay .................................................................................................................... 46 ¡2.7.4 The copy&backup of data ............................................................................. 48 ¡2.7.5 Print the data ...................................................................................................... 50 ¡ 2.8 Survey Mode .................................................................................................................. 54 ¡2.8.1 Auto survey mode ............................................................................................ 54 ¡2.8.2 Manual survey mode ...................................................................................... 55 Chapter 3 Connect with GPS ................................................................................. 57 ¡3.1 Connect to GPS receiver ............................................................................................ 57 ¡3.1.1 How to connect to GPS receiver ............................................................... 57 ¡3.1.2 Note of connection .......................................................................................... 58 ¡3.2 Software Setting ............................................................................................................ 58 ¡3.2.1 Surveypro setting ............................................................................................ 58 Chapter 4 Related operations............................................................................... 61 ¡4.1 How to change CF card .............................................................................................. 61 ¡4.2 Maintenance of E6 system ....................................................................................... 62 ¡4.2.1 Maintenance of the mainframe ................................................................. 62 ¡4.2.2 How to carry the transducer ...................................................................... 62 ¡4.2.3 Maintenance of the junction pole ............................................................. 62 2 Chapter1 Preview ¡1.1 Introduction Stonex E6 echo sounder is the new industrial digital echo sounder: it is an integrated product which is composed of a 12.1-inch TFT-LCD screen, the industrial control unit, the echo sounding unit, data processor, internal memory unit, interfaces and I/O devices. The special design make it dustproof, waterproof, shockproof. It can collects depth measurement and positioning GPS data together. All these features make this instrument a product with a strong compatibility, stable performance and reliable accuracy. The machine comes with a 12.1-inch TFT-LCD color touch-screen which support a clear visibility also under bright light. It has an embedded operative system Windows XP, which can connect to external keyboard, mouse and other external USB devices. Dominant frequency of the CPU is 1.6 GHZ with 1Gb internal memory and built-in 4 Gb massive electronic storage. E6 can connect to a GPS receiver of any manufacturers for positioning. Users can run different hydrographic surveying software (support embedded WinXP version) on it. It is an ideal instrument for sea, river, or lake water depth measurement together with the port and waterway dredging project. ¡1.2 Echo Sounding Features ¡1.2.1 Physical principles The principle of echo sounder is to use acoustic waves (ultrasound) spread through the water: the ultrasonic transducer (probe) launches ultrasounds, 3 then it measures the time t between the emission wave and the reflected wave by the bottom of sea. If acoustic propagation velocity in water is V and Z is the distance from transducer to the bottom of sea, then Z = V t / 2. At the same time, user have to read the scale on the junction pole to get the value of the draft (draft is the value between the water surface and the bottom of the transducer), as showed in Fig.1. Fig.1 Echo Sounding Principles The signal frequency of the high-frequency transducer is about 200 KHz, that of the low-frequency transducer is about 20 KHz. Low frequency signal has a longer wavelength, so strong penetration capacity, it can also penetrate a certain thickness of silt. ¡1.2.2 Pulse length It indicates the transmitted pulse duration in millisecond unit: its value ranges 4 from 0.01 to 1.2. The intensity of the transmitted pulse becomes stronger with longer pulse. If the pulse length is too long, it may lead to an inaccuracy because of the overlap of the transmitted pulse and the echo wave when measuring in shallow water. If the pulse length is too short, when measuring in deep water or when the absorption power of the water is too strong, may appear no echo because the transducer can¡t receive enough echo signal. So user should adjust the pulse length value according to depth real time. The default value of pulse length is 0.1ms. If works on the sea, user should increase the pulse length properly, since the higher salinity of the water increases strongly the absorption of the ultrasound. ¡1.2.3 Blanking Puls e Length The experiment proves that the ultrasonic lasts out even if the Pulse Length time is over, and that is said remaining ultrasonic signal. This signal will affect the return signal from the bottom and that¡s why a blanking pulse length can clear the remaining signal to get precise depth. Blanking Pulse Length must be one millisecond longer than the Pulse Length except extreme cases. ¡1.2.4 Power Adju st There are two gears: Low and High. When water is deep, then use High. When water is shallow, use Low. In normal conditions, Low is ok. 5 ¡1.2.5 Gain The gain value means the enlargement factor of the return signal. It is useful to increase the gain when the return signal is feeble, but the noise is enlarged as the gain is increased. So when set the gain value we must consider the vantage and disadvantage in order to recognize the effective echo. The Gain should be increased or decreased until the digitizer finds the correct bottom. The default gain value is 1dB. ¡1.2.6 Threshold The threshold value decides when the timer using for accumulating the echo continuous time stops to work, and starts picking up return signal. When increasing the threshold value, weak signal may be picked up. If the threshold is too high, may mistake the noise as echo. If the threshold is too low, may not receive the echo. The default value is 1. ¡1.2.7 Depth ranging During the measurement, different water depth measurements adopt different frequencies, the depth and frequency is as the following table: Auto Change Data sampling rate 15m 14 Hz 30m 14 Hz 6 60m 7 Hz 120m 2 Hz 240m 2 Hz 300m 2 Hz From the table, it indicates that to get high sampling rate and resolution of the echo image, proper depth range should be selected. If the depth range selected is shallower than the true depth, then the system will change to the proper frequency automatically, the bottom profile of the water can¡t be showed on the screen totally, but it doesn¡t affect the accuracy. ¡1.3 Related terms ¡1.3.1 Three type depth data There are three kinds of depth data: correct depth, the depth with tolerance error, incorrect depth. 1. Correct depth is the depth value measured under normal surveying; 2. The depth with tolerance error is the depth value measured when the bottom of the water changes suddenly or there is reasonable change in the water. 3. Incorrect depth is the fault depth data because of noise or accidental error. The software will distinguish the above three kinds of data automatically with reliable result. ¡1.3.2 Data for mat E6 echo sounder can output four kinds of depth data format: 7 Fig.1-1 1.Stonex data format Stonex data, if use this format, when set the echo sounder type in Surveypro or other navigation software, Stonex echo sounder should be selected. This format only shows the correct depth and the acceptable depth error, the incorrect depth not display. Description of the format: $GPSSS, 005. 34, 1463, 0. 60, 0. 3, 0. 5,*f<CR><LF> $GPSSS is data header, 005. 34 is depth value, the unit is meter, and the current depth is 5. 34m, 1463 is sound velocity, the unit is meter; 0.60 is the draft value, the unit is meter; 0. 3 is pulse length, the unit is ms; 0. 5 is Logging cycle, second, *f=Checksum The data format output is: $GPSSS, 005.07, 1463, 0.60, 0.3, 0.5,*E3 $GPSSS, 005.10, 1463, 0.60, 0.3, 0.5,*DA $GPSSS, 005.07, 1463, 0.60, 0.3, 0.5,*FB 2.SDH-13D format: 8 Description of the format: DT ######<CR><LF> DTB######<CR><LF> DTE######<CR><LF> DT, mark, depth. DT<M>ddddd <M>=<SPACE>, or B, or E ddddd=depth, centimeter The mark ¡<SPACE>¡ means depth is correct. The mark ¡B¡ means depth error is tolerance. The mark ¡E¡ means depth is incorrect. 3.DESO 25 format This format only shows the correct depth and the acceptable depth error, the incorrect depth not display. If it is high frequency channel: DA#####. ##<SPACE>m*<CR><LF> If it is low frequency channel: DB#####.##<SPACE>m*<CR><LF> D is identity header; The mark ¡A¡ means high frequency. The mark ¡B¡ means low frequency. #####.##is depth, the unit is meter; <space> is one blank space; M means unit is meter; 9 4.INNERSPACE455 format This format only shows the correct depth and the acceptable depth error, the incorrect depth not display. STX#####<CR> STX is identity header #####is depth, the unit is centimeter; Fig.1-2 Set Echo Sounder 10 Run Survey pro software, "Setting Echo sounder": Echo sounder: if use Echo sounder, must click "Use"; Head: data header, begin letters in each row Tail: the end of each data, always use ASCII,13 means Enter; Position: Means that the depth data is from this position include the space before the short data. Length: the numbers of effective digits, counting from the Head. Error character: When this error character appears means there is incorrect data. Multiplier: When transform the unit of the depth value to meter, need to shift the decimal point, such as 0.01 needs to shift the decimal point towards the left 2bits. Error Bit: Show the position of the error character; Code: Code is the character to perform AND operation with Error Bit (Generally no use). Event character: the instruction for marking, which is the marking instruction issued from the computer to the echo sounder, and the default of which is ASCII format, if click "Hex", then it will issue the marking instruction with Hex. Always, different echo sounder has different marking instructions. ¡1.3. 3 Draft setting Clicking the Basic submenu brings up the following dialog: 11 Fig.1-3 Basic settings When the Junction Pole and Transducer is installed, the transducer draft can be got form the Junction Pole markers. The Draft is shown in the current units (either meter or feet).To modify the draft, input the value into the ¡Draft ¡edit frame by hand and then click ¡Apply¡ button to accept the new draft. Normally, the draft value is not less than 0.5m. ¡ 1.3.4 Sound Velocity Temperature Sound Temperature Sound Temperature Sound ( ℃) velocity( m/s) ( ℃) velocity( m/s) ( ℃) velocity( m/s) 0 1402.74 18 1476.35 36 1522.06 1 1407.71 19 1479.55 37 1523.93 12 2 1412.57 20 1482.66 38 1525.74 3 1417.32 21 1485.69 39 1527.49 4 1421.96 22 1488.63 40 1529.18 5 1426.50 23 1491.50 41 1530.80 6 1430.92 24 1494.20 42 1532.37 7 1435.24 25 1497.00 43 1533.88 8 1439.46 26 1499.64 44 1535.33 9 1443.58 27 1502.20 45 1536.72 10 1447.59 28 1504.68 46 1538.06 11 1451.51 29 1507.10 47 1539.84 Table1-1 Sound velocity in fresh water Note: The table is just for reference when settings depth. Table1-1 Show the sound velocity at different temperature in fresh water. Sound velocity is a critical parameter when performing surveying work. Normally, sound velocity is between 1300m/s and 1650m/s, the theoretical value is 1500m/s. Due to the salinity of the sound velocity in sea is faster than in fresh water. The table1-1 provides a method for the user to enter a calibrated sound velocity into the system for calculating an accurate depth measurement. E6 use Check bar to calculate the current sound velocity, and that is to put the check bar into the water, then use the echo sounder to calculate the sound velocity. After calculate, and then input the calculation value. Press "Calculate" in Fig.1-4, and then Sound velocity calculate dialog will be brought out: 13 Fig1-4. Sound velocity calculate If use check bar, first to select the Than Depth, then input the Measure Depth; The Measure depth is from the echo sounder; Than Depth is the depth from the water surface to the check bar, then press "Calculate¡, then the current sound velocity is figured out. If uses the temperature and salinity to calculate the sound velocity, then input the temperature and salinity directly. ¡1 .3.5 Max Depth Max Depth is the reference value for Auto change Depth range. Generally, estimate the max depth of the current water area, then set the Depth range. ¡1.3. 6 Shallow alarm When open the shallow alarm function, and set the value, then when the 14 measured depth value is shallower than this value, the buzzer of echo sounder will alarm. ¡1.3. 7 No Echo Alarm When the basic settings and advanced setting has error, or if the tilt angle of the transducer is too large, or measuring depth is over the depth range, lead to no echo received by the transducer, then the echo sounder will sound an alarm, the alarm sound 1 second then stops 4 seconds, 5 seconds of a cycle and the frequency is 0.2Hz, then to check the possible reasons above one by one is necessary. Note: when the boat near the dock or travel in shallow water, take care of the transducer not to hurt or break something hard or hanging objects, affect the progress of the project, if necessary, remove the probe in advance. 15 Chapter2 E6 ¡ 2.1Specifica tions and Features Fig.2-1 E6 E6 is a kind of industrial control and digital echo sounder which is integrated with the LCD screen, industrial control unit, echo sounding unit, data processor, internal memory unit and kinds of interfaces and I/O devices. 16 Fig2-2 Transducer (Single Frequency) Fig.2-3 E6 port (Single Frequency) E6 Specifications Frequency: 200 kHz Beam Angle: 7¡ Output Power: 500W Sound Velocity: 1300~1700m/s,resolution 1m/s Depth Range: 0.3m~300m( related to water conditions) Accuracy: ¡1cm¡0.1 %D( except error cause by sound velocity) Draft: 0m~9.9m Resolution: 0.01m Power supply: 9~15V(12V aluminic acid battery)or AC 220V Mean consumption: < 25W Processor dominant frequency: 1.6GHz 17 System: Embeded WinXP Internal memory: 1G Display: 12.1-inch color LCD Input: touch screen, mouse, keyboard I/O interface: 2 COM ports, 2 USB port, one VGA interface Built-in memory capacity: 4GB Serial port output: Simulation of a variety of formats, adjustable baud rate Work environment: -30¡ ~60¡ ,dustproof, waterproof, shakeproof Weight: about 7.5Kg Replay and print data, synchronous recordingdepth data and echo graph. 18 ¡ 2.2 E6 Package Check List Part Number Item Model Quantity E6 1 1 Mainframe 2 Instrument Box 1 3 Transducer 1 4 Transducer Junction Pole 1 5 Transducer Kit 1 6 2- RS232 data cable 1 Description Standard 2m 220V external power supply 7 cable 1 8 Power supply adapter 9 12V external power cable 10 Keyboard 1 11 Mouse 1 W2J20 1 Connect mouse Keyboard/Mouse Wiring 12 1 and keyboard Built-in 13 Surveypro software 1 14 CD 1 18 U Disk 1 Backup data NOTE: Check list may be changed along with the produce developing and becoming perfect. User can refer to receiving goods list in the condition of not getting notice of this list changes from manufacturer. 19 ¡ 2.3 Installation ¡2.3.1 Mounting of Transducer Fig.2-4 Transducer installation Choose a Location The location of the transducer is very important for maintaining reliable bottom tracking performance of the equipment. Avoid installing transducers in locations where the transducer will be subjected to turbulent water, air bubbles, or vibration. It is preferable to mount the transducer on the side of the hull where the propeller blades are normally moving downwards. The upward motion of the propeller can generate pressure waves, which push air bubbles up against the hull. By mounting the transducer on the downward side, the hull will tend to protect the transducer from this effect. The transducer should be mounted on, or adjacent to, the ship¡s centerline. Wherever practical, the 20 transducer face should be parallel to the waterline. In addition, there should be sufficient room to permit use of the necessary tools to facilitate the installation-mounting requirements. Handling Transducers The transducer is the heart of the E6 Echo Sounder and, in spite of its appearance and size, is a delicate instrument. Although it is designed to be in contact with and survive tough marine environments, it should not be dropped or manhandled during the installation. Caution is advised when handling the transducer to prevent any damage to the transducer face. The transducer elements are situated in molded resin or stainless steel housings covered with a urethane window surface. The urethane ¡window¡ is the surface through which ultrasonic pulses must travel. This surface must be kept as clean and smooth as possible so the path of the ultrasonic energy is uninterrupted. The transducer face must not be painted with lead based bottom paint. Also, when handling the transducer, avoid lifting or pulling on the transducer cable. Although the cable appears thick and substantial, the internal cable wiring could be damaged by stress from the sheer weight of the transducer and cause a malfunction at the most inopportune time. To fix the transducer, the best location is in the middle of the ship's side, thus reducing the influence and interference of the traffic surge to the transducer. When the speed of the surveying boat is fast, then the junction pole connected with the transducer must be tilted slightly backwards, which is carried out by increasing the reinforcement of the forward rope and the backward rope, considering the drag force from the flow and the gesture of the driving boat. Working at sea, to put the transducer into water a bit deeper is necessary; 21 faster the boat, the deeper the transducer into water. In general, working at sea, the transducer draft is better between 1.2 and 1.4 meters; in Inland River, the transducer draft is more than 0.5 meters (considering the length of pole and the operational needs). At sea, if measure under larger surge conditions, transducer draft muse be deepened, to avoid massive depth errors caused by surges. When mounting the transducer, must keep the junction pole vertical, reinforce and prevent loosening of the probe. Connect the transducer, plug in the power (positioning system and peripheral equipment), you can use 12V DC power supply, or direct into 220V AC, you must use the corresponding power supply cable. ¡2.3.2 Interfaces Ports: VGA COM2 OM1 USB1 USB2 12V DC Transducer Fig.2-5 Interfaces Figure 2-5 shows the basic panel connections to the echo sounder unit. There is one VGA port for external monitor, two COM ports, two USB ports and one port for 12DC power or 220V AC power. The transducer port is to connect the E6 with the transducer. The user should make sure that, after wiring is complete, each plug is firmly attached to main housing unit. 22 Fig.2-6 Keyboard & mouse wiring Fig.2-7interface of keyboard and mouse Fig.2-8 12V external power cable Fig.2-9 E6 power adapter ¡ 2.4 Main Menu of E6 software After mount the related devices well, then power on E6, wait for the system starts to enter into the Embede WINDOWS XP user interface, then double click icon to enter depth measurement main menu. 23 Fig.2-10 High frequency main interface The left window is the depth data record display window, and the small window on the right shows the launched pulse, echo pulse waveform and signal amplitude; between two windows, there is a ruler, the scale of which can be zoomed in and out. Scale calibration can select the denser, sparser or default. 24 ¡2.4.1 Depth data display window and waveform display window Fig.2-11 depth image 1, graph file The red line is water line; draft line is the green line. 25 Vertically from left to right, the software displayed the time of the mark line and the label on each mark line, the mark mode can be Auto mode which is controlled by GPS software to send control commands automatically, or by manual mode. There are three operations the user can adjust the ruler: 1. When change the depth range, the ruler will change the screen display of water depth; 2. Use ¡Denser¡ or ¡Sparser¡ to change the resolution of the ruler in order to get depth data more accurately; 3. Use ¡Deep¡ or ¡Shallow¡ to shift the ruler up and down. NOTE: No matter how the ruler scale changes in the measurement process, the users can use ¡ ¡to back to the original state. 2, Waveform Fig.2-12 Wave (Has been Rotated 90¡anticlockwise) After power on the echo sounder, no matter start recording or replaying data, there is waveform in the right window. 26 ¡2.4.2 Toolbar Fig.2-13 Shortcut 1, Clicking the New button can bring up a System Save Dialog. Select the directory path, and then input file name to create a new file for saving acoustic graph data. 2. Clicking the Open button can open an exist graph data file, so that to replay, check or add record. Note: If measure the depth after open an exist depth data file, then the data will be recorded followed the end of the exists data. 3, The Mark button is used to mark the user Graph file with an event mark. This mark is also generated on the printer output. The event is tagged with current depth, time and geographic position (if available). After ¡Mark¡ button is clicked, a line, annotated with text data is place vertically on the screen. 4, Before printing out, viewing the graph may be necessary. And click this button to get once-over. 27 5, When having loaded an exist Graph Data file, this button is used to replay the moving representation of the bottom for viewing and searching, which contains digitized depth values , navigation information, and event marks. 6, After input correct basic information about the survey, such as draft and sound velocity, this button can help new user to finish advanced settings about the equipment automatically and drives the echo sounder to work. Under this mode, only the pulse length and gain can be adjusted on the status bar below. 7. This button is used to log depth according to user¡s settings including basic settings and advanced settings. The difference between ¡Auto¡ and ¡Manual¡ is only on advanced settings. In ¡Manual¡ mode, advanced parameters need to be set by user. 8, After choosing Auto or Manual, click this button to start recording the graph data. When the button is clicked, a System Save Dialog may be brought up. Then the advice is to choose D disk to save the data file, and the default file name is the current date. 9, 28 Clicking the Print button can bring up a Set Printer dialog. 10, This button is used for checking the current software version and hardware version to decide whether needing to update it. 11, This button is used to stop the echo sounder working and exit this software. Before exiting the software in any condition, the graph data has been saved into storage automatically, so user doesn¡t worry about the loss. 12, When the depth is out of the Range, the graph may not be displayed in the view window, and user can click the Deep button to extend the depth Range. 13, This button is used to shrink the Depth Range. 14, This button is used to move the record screen up. 15, This button is used to move the record screen down. 16, This button is used to make the Range Markers denser (increase the scale resolution). 17, This button is used to make the Range Markers sparser. 29 18, This button is used to get default values. ¡2.4. 3 Status bar Fig.2-14 Status ID: ID is serial number of E6. Left time: Left time show the rest time the echo sounder can work continuously, which is related to the register code. Voltage (V): It shows the voltage status of the current power supply, which update once per 5 seconds. Left DC: Show the status of the power supply by percent. Num, digits, roll show the status of Num Lock, Caps Lock, and Scroll Lock. ¡ 2.5 Parameters ¡2.5.1 Parameters setting Fig.2-15 Settings 30 Click ¡Setting¡ -> ¡Basic¡, enter into the dialog below: Fig.2-16Basic settings The following parameters can be set here: draft value, sound velocity and so on. Default is to use the default value of parameters, OK is to confirm the setting, cancel is to cancel the parameter settings. Apply is to use the current parameters. 1、Draft -- the draft value is the measurement value from the water surface to the bottom of the transducer, before set this value, and please get this value by measurement. 2、Sound velocity -- In different seasons and different waters (including different temperature) will have a different velocity, the velocity of fresh water and sea water are different, so requests to check the echo sounder before each measurement. There are various ways for this check, but the common is two ways: one is Check bar which will be introduced in followed sections. The other way is to measure the sound velocity by sound velocimeter on the spot, sound velocimeter not only measure the sound velocity but also the water 31 depth, then together with the water temperature and depth the user can get the sound velocity after calculation, and then input this sound velocity into the software. 3, Max Depth -- it is a reference value for auto change function, always this value needn't to set. 4 shallow alar -- tip this function and input the value, when the depth is lower than this value, E6 will alarm. 5, No Echo Alarm -- after open this function, if there is no echo received by the transducer, E6 will alarm. ¡2.5.2 parameters' setting Fig.2-17 Settings When you choose manual mode in main menu, then you can enter into Advanced to adjust the parameters in Fig.2-18 32 Fig.2-18 Manually adjust parameters The basic settings include transmitted intensity, Sensitivity and flitting setting. (1)Transmitted intensity include the adjust of pulse length, blanking pulse and power. Pulse length --- pulse length indicates the transmitted pulse duration with the millisecond unit, and its value ranges from 0.01 to 1.2. The intensity of the transmitted pulse becomes stronger along with longer pulse. The figure width of the transmitted / received pulse means the pulse intensity, and the figure length of the transmitted / received pulse means the pulse length. If the pulse length is too long, because of the too long duration of the signal, it may lead to the error because of the overlap of the transmitted pulse and the 33 echo wave when measure shallow water. If the pulse length is too short, then the signal duration time is too short, when measure deepwater or the absorption power of the water is too strong,may appear no echo because the transducer can¡t receive strong enough echo signal. So, we should adjust the pulse length value according to depth real time. The default value of pulse length is 0.1ms.If works on the sea, we should increase the pulse length properly, and since the higher salinity water absorbs ultrasound strongly. Blanking pulse --The experiment proves that the ultrasonic lasts out even if the Pulse Length time is over, and that is said remaining ultrasonic signal. And this signal will affect the return signal from the bottom, and the blanking pulse length can clear the remaining signal to get precise depth. Blanking Pulse Length must be one millisecond longer than the Pulse Length except extreme case. Power- It indicates the amplitude of the ultrasonic with two grades that are low and high. Low power usually is used for shallow water, and high power is used for deep water. (2)Sensitivity contains Gain and threshold. Gain- The gain value means the enlargement factor of the return signal. It is useful to increase the gain when the return signal is feeble, but the noise is enlarged as the gain is increased. So the gain must is set considering the vantage and disadvantage. The Gain should be increased or decreased until the digitizer finds the correct bottom. Threshold- The threshold value decides when the timer using for accumulating the echo continuous time stops work, and to start picking up return signal. 34 When increasing the threshold value, feebler signal may be picked up, but the signal is more possible unwanted. Here is some empirical value for reference: Filter transmitted intensity Sensitivity setting Depth range Pulse blanking Pow Gate Gain threshold length pulse er depth 1¡ 20m 0.2ms 1.4ms Low 2 1 10% 20-50m 0.3ms 1.6ms Low 3 1 10% 50-100m 0.5ms 1.6ms High 3 1 10% 100-300m 0.6ms 1.8ms High 3 1 10% In manual survey mode, all the above parameters can be adjusted by hand. Auto survey mode can work in any water with good conditions, when the water is too muddy (such as near dredging boat), this mode also has good ability of anti-interference. Sometimes, even with auto mode, the user still can adjust the Pulse length and Gain in the status bar as the figure below show. Pulse length: adjust the emitted energy intensity Gain: adjust the echo intensity When the Echo is thin or weaker, the user need to increase the gain, also when the water depth is deeper, the user should increase the pulse width. In a word, adjust the parameters according to actual situation. The purpose of the adjustment is to get clear and visible echo, at the same time, the drawing record is clean and clear. 35 Fig.2-19 The standard figure in normal surveying ¡2.5. 3 Option Fig.2-2 Option Click Setting/option; enter into the option dialog (Fig.2-25) to set the signal color, communication port, output depth, tide gauge and heave sensor setting. 36 Fig.2-25 grey display Fig.2-26 Colorful display Signal color: There are two choices: Color/Grey. If change colors, the user can enter into the color setting dialog by double click: Fig.2-27 Color The baud rate of depth data output port is 9600. Output Depth 37 (1) Port Settings Two ports are available on the side of the E6 Echo Sounder for utilizing a variety of input/output choices. The ports are labeled ¡COM 1¡ and ¡COM 2¡. And there are virtual ports ¡COM10¡ and ¡COM20¡ within the system. Each status of the Port Setting is described below. Table 2-1 Port Setting Status Status Description Closed Set virtual port ¡COM10¡ as depth output port COM1 Set port ¡COM1¡ as depth output port COM2 Set port ¡COM2¡ as depth output port If wanting to modify the port, click the Port Setting and the Figure2-28 dialog is brought up. Fig.2-28 Port Setting 38 Refer to Table 2-1and select a right port from the Port list. Set the baud rate to 4800, 9600 or else depending on the baud rate of the output data. All serial input strings must conform to NMEA 0183 Standards for transmission protocol: Data Bits- 8, Parity- None, and Stop Bits-1.Click Modify button to apply the settings. Depth data format setting: Fig.2-29 Data format Tide Gauge port setting: Connect with radio tide gauge to monitor tide real time for customer. Heave Sensor port setting: Connect with Heave Sensor device to correct heave real time for customer. Depth font: Depth font is the depth value showed in depth window when measuring. Show as 2-31: 39 Fig.2-31Depth font ¡2.6 Register ¡Help¡->¡Register¡: 40 Fig.2-33 Register interface Or press ¡Keyboard¡ icon in Fig.2-23, then appear a virtual keyboard as bellow. Fig.2-34 Virtual keyboard 41 ¡ 2.7 Operations ¡2.7.1 Depth data collecting Firstly, run E6 software on the desktop. And tap or , you will see wave data in the right of window. There are two kinds of waveforms, one is launch waves, and the other is receiving waves. You can change the parameters to adjust the showing waves window. If you want to record the data, you can new a file. In menu File, you can see NEW, tap it, then give a name of the file. Then tap OK. Data will be recorded automatically when waves is showing. If you want to add the data to an exist file, please go to FILE¡ OPEN, to open an existing file, then tap , the new data will be recorded following exist ones. If E6 is as replay mode, you want to record the data, you need tap to end replay, then tap ¡start¡ and set the parameters, then start to record. 42 Fig.2-35 Normal (Has been rotated 90¡) All depth graphics files are showing from left to right when record data. If you want to stop recording, you can tap again or exit the software. Fig.2-36 Graph file There are three modes to product mark line, they are manual, auto and timer, and you can find them from OPTION window. Fig.2-37 Mark basis 43 Manual: user can tap button on the toolbar, software will draw up the mark line now. Auto: When users connect E6 to Surveypro, the Surveypro software will send the signals of marking to E6. Timer: means you select the mode as timer, and then set the clock in the number of seconds, at this time, the software will start from the beginning of time, according to the set time interval of automatic marking. Fig.2-38 Mark line (has been rotated 90¡clockwise) the parameters on the mark line ,which are point name, time, low frequency mark, low frequency depth, high frequency mark and high frequency depth, the X, Y, the depth of the water. If no value, please use space to replace it. Note: if users go to one water area at the first time, in order to get a best showing and result, you can record a little time data, and then adjust the parameters setting from the waveforms. 44 ¡2.7.2 Depth Result file There are three format files of depth result: date.pll, date.txt, date.cab. And date.cab is composed of compressive file by date.pll and date.txt. Fig.2-39 Cabinet or not You can select cabinet in the menu when recording depth data. If you do not select cabinet the data, the cross-section diagram of depth will be saved as date.pll file. For example , ¡080128_1516¡ means1 5:16 on January 28, 2008.in order to check the parameters of surveying, all parameters files are saved as date.txt format after it is changed, and the date.txt is the same name of date.pll, just extension name is different. If you select the packed record menu: Due to the large graphics files, in order to reduce data of disk space, when finish the surveying, it will put graphics files and parameter configuration example files compressed into date. Cab automatically. For , this file can be used directly to open by E6 software or use WinRAR decompression. The file after be compressed will save a few times space. For example, 080128_1516.pll and 080128_1516.pl1.txt used 13M 45 space, but after compressed, the file 080128.cab only occupied 620KB. It is about 1/20 of no compressed. ¡2.7.3 Replay Reply: Click ¡open¡ key, then it will show selecting file dialog box, find the data file (external name is .PL1), click ¡open¡, then it will enter the reply mode automatically, there are 3 selections for replyspeed, they are normal. Fig.2-40 choose the file to replay If double click the ( *.pl1)file, after press key by hand, the reply 46 process will start automatically, so that it can enter reply mode, if press , the data file will cycle replaying. If you want to reply some specific data, the can do it. Operates as follows: Select the specific data, press ¡Jump¡, Jump Fig.2-41Replaying¡press jump Pop up the index dialog box, select the mark which needs tore play, the user also can find the start time through checking time, click ¡ok¡, then it will start to replay. The index dialog box: 47 Time for Mark line Time for Ruler line Choose the items to display Fig.2-42 The function of restore key: The restore key is to help observe the detailed of the echo reply. Fig.2-43 toolbar for ruler control ¡2.7.4 The copy & backup of data Copy of data: there is 2 USB com ports, can connect different USB storage disk, once the USB com port is inserted, XP system will install automatically, then 48 the disk symbol will be shown, it is convenient for users to copy and exchange the data. The backup of data can reserve the field data, the data can be print and browse, it is easy to operate, insert the U disk in the back of echo sounder, then copy the file in ¡My computer¡ or ¡Explorer¡, the suffix of the original data is pl1, Note: If use the GPS in depth measurement, it still needs to copy the GPS assignment and positioning data. Fig 2-44 data file Fig.2-45 Replay the graph data 49 ¡2.7.5 Print the data Data printing: After reply the data, if it needs to be printed, press to print。 Note: This function can be used in other computers, when it needs to print, copy the software and data to the other computer, then print out. Before printing, preview it, and it needs to do page setup and print preview. The main function of page setup is setting the page direction and the page margin, the important parameter is the amplification factor of horizontal axis, when the amplification factor of horizontal axis is 10,the data of echo in printing will be drew out to 1 MM. 50 Fig.2-46 Page Setup-Margin The first page of page setup is page margin set up, mainly for setting the space of image, the keep out edge distance can be set as 0, but the printer should support 0 edge distances. Set the direction of paper: Generally, it is laterally prints, if specifically needs, it apply length wise direction printing. Paper size is what the present printer reads out. Fig.2-47 Page Setup Alter here, and then confirm, the paper size will be altered to new paper size. 51 Fig.2-48 Format setting ¡file¡ -¡print preview¡, it can preview the image, so that to confirm the pages. 52 Fig.2-49 Preview If preview is OK, then it can do printing, ¡file¡-¡ print¡, it will go to the printing dialog box, select the printer and the page scope, then press ¡confirm¡ to prin t. 53 Fig.2-50 Print dialog ¡ 2.8 Survey Mode ¡2.8. 1 Auto survey mode This section gives an example to introduce the normal operation steps----Auto mode: 1. Connect the transducer to E6 by the port Connect the power cable and keyboard/mouse wiring. Connect the GPS data cable to the COM connector and connect the Hardlock Key of Surveypro to USB connector. 54 2. Power on; 3. Run the echo sounder software through clicking the icon which is named E6 on the desktop. 4. Click Auto button and then click Record button, and then select the directory path and input the file name for saving the graph data. 5. Click the menu Settings->Basic to bring up the Basic Setting dialog, and input current draft and sound velocity. 6. Click the menu Settings->Option to bring up the Option dialog. And the Mark Basic is selected to be Automatic and the Ruler Increment is selected to be one of the options by user. 7. Minimize the echo sounder software, and run Surveypro navigation software and create a new project referring to Surveypro manual. 8. Connect echo sounder with Surveypro. ¡2.8.2 Manual survey mode In most situations the user need not adjust the acoustic settings of the echo sounder (Transmitted Pulse Length, Blanking Pulse Length, Threshold, Gain and Depth Gate). Each parameter is fine-tuned to provide optimal performance in AUTO modes. Manual settings are provided, however, for extreme cases in shallow water (less than 1 meter) operation, where it may be necessary to adjust a setting to obtain the correct digitized depth. Normally, the user can rely on the acoustic graph for estimating the true bottom when the digitized value may be questionable. User can minimize the Transmitted Pulse Length, Blanking Pulse Length, 55 Threshold, Gain and Power to obtain optimum performance in shallow water conditions. This section gives an example to introduce the operation steps. 1. Connect the transducer cable to the port Connect the power cable and keyboard/mouse wiring. Connect the GPS data cable to the COM connector and connect the Hardlock Key of Surveypro to USB connector. 2. Power on; 3. Run the echo sounder software through clicking the icon which is named E6 on the desktop. 4. Click Manual button and then click Record button, and then select the directory path and input the file name for saving the graph data. 5. Click the menu Settings->Basic to bring up the Basic Setting dialog , and input current draft and calculate the sound velocity( refer to previous sections). Click the menu Settings->Advanced to bring up the parameter settings dialog and then adjust the parameters as the introduction above. 6. Click the menu Settings->Option to bring up the Option dialog. And the Mark Basic is selected to be Automatic and the Ruler Increment is selected to be one of the options by user. 7. Minimize the echo sounder software, and run Surveypro navigation software and create a new project referring to Surveypro manual. 8. Connect echo sounder with Surveypro referring to the previous chapter. 56 Chapter 3 Connect with GPS ¡3.1 Connect to GPS receiver STONEX E6 echo sounder, not only can be used as a set of echo sounder and output data using depth, but also can be loaded in Surveypro software, then connect to GPS receiver, and collecting position data and depth data. Meanwhile, the echo sounder can be used as a computer. ¡3.1.1 How to connect to GPS receiver Fig.3-1Connection with GPS Here we use beacon receiver as an example. You can find the COM port on the right side of E6, then use the COM port cable connect beacon receiver to E6, then set the receiver type and COM port number in the software, then you will get the position data and depth data. 57 ¡3.1.2 Note of connection Port configuration: There are two COM ports on the right side of E6. E6 normally used one COM port to output depth date, the other port is for backup. If you want E6 to use with other software, you can use a cable with COM port to connect E6 to other computer to transfer the depth date. ¡3.2 Software Setting ¡3.2.1 Surveypro setting Firstly, run the Surveypro program in the echosounder, then you can select echosounder model from menu, you can press ¡Settings¡ ->¡device setting¡->¡echosounder¡ to enter echosounder setting interface. Different echosounder models have different data format, if the user doesn¡t find their own model, they can define their own format by inputting the following information: Head: It¡s the beginning label of one data record. Tail: It¡s the ending label of one data record. Position: It¡s the position of the first effective data Length: The length of depth value. Multiplier: A scale factor for depth, 100 means multiplying 1/100 Error mark: Error bit is the position of error information, usually, error char is E, 58 but some echosounder also can use other char. Figure 3-10 parameters setting After you make these setting, you can press ¡add¡ button to the model li st. For Stonex user, you can select Stonex echosounder model in the list directly. Figure 3-11 select Stonex echosounder model from the list Select ¡Stonex ltd echosounder¡ from echosounder model list, remember to select the ¡Use¡ option, then tap port setting page, the setting is as following figure, 59 Figure 3-12 echosounder port setting Figure3-13 data format setting Figure 3-14 Position information and depth 60 After the GPS and echosounder are connected successfully, the position information and depth will show on the left panel of screen. Chapter 4 Related Operations ¡4. 1 How to change CF card This operation must be done when echo sounder shutdown! And only when the system is collapsed of no reason, in order to solve the problem, you can do CF card replacement. And you should ask the dealer whom you bought from for the new CF card. How to change CF card? Please tear down the screw of CF cap, then press the CF card, it will pop up automatically from the slot. Please pick up the damaged CF card and put the new card in the slot. Please be careful of your strength when you press it in. and pay attention on the direction of CF card. After set it in, please remember to tighten the screws of the CF cap. Note: CF card need not be replaced, unless meet no reason problem. To lest water leakage, and introduced circuit board short-circuiting while burned-out motherboard, CF card lid is forbidden to tear down. After the successful replacement, please delete all COM port in the control panel applet > > > -- - the system hardware device manager - > port, and restart the system. After the restart the system, the systems will automatically assigned COM port. Then please update the firmware and control software to make PC and 61 microcontroller program matched. ¡4. 2 Maintenance of E6 system ¡4. 2.1 Maintenance of the mainframe NOTE: Take the instrument from the box carefully, take care not break the LCD screen, when put the echo sounder into the box, put the E6 mainframe separately in one box, not together with mouse and keyboard in case break the LCD screen during transportation. ¡4. 2.2 How to carry the transducer T Fig.4-1 Correct Fig.4-2 wrong ¡4. 2.3 Maintenance of the junction pole The pole of transducer, standard configuration is with 3 parts, total 2 meters long, one head of a spiral holes is for the connection of the transducer, the minimum scale above the pole is 0.1 meters (echo sounder has considered the 62 depth of transducer after connection). When setting the echo sounder, firstly need connect three parts pole, then put the cable pass through pole from the spiral hole, then be out on the other side of the pole, and then please make the hole of transducer be position at the hole of the pole and use the screw to fix on the pole. There is a screw cap on the other side of the pole, please be out the cable sideward of the cap to avoid cable weared. Upper lid can be placed GPS antenna. (GPS antennas can offset elsewhere). The peared side of transducer, you can put it towards to the head or Stern of the ship when it is in the water. When finish the project, please remove the GPS antenna firstly, then take down the lid, then lift up the pole, raise the transducer and pour out the water in the pole from another side, then tear down other parts. Fig.4-3Junction pole 63