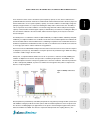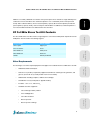
1
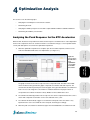
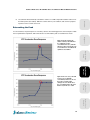
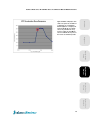
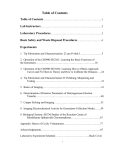
User Manual XF cell mito stress test kit for research use only XF96 Instructions www.seahorsebio.com Part #: 102308-400 Rev. A This page intentionally left blank Preface Copyright ©2012 Seahorse Bioscience Inc. All rights reserved. Printed in U.S.A. Under copyright laws, this manual may not be reproduced in any form, in whole, or in part, without prior written permission from Seahorse Bioscience Inc. This revision supercedes all previous revisions. Every effort has been made to ensure that the information in this manual is accurate at the time of printing. However, Seahorse Bioscience Inc. assumes no liability for errors or omissions and reserves the right to make changes without notice to any products described herein to improve reliability, function, or design. Excel is a registered trademark of Microsoft Corporation. Other company and product names may be trademarks of their respective companies. Conventions This guide uses the following conventions: Convention Type of Information Bold Indicates user interaction with elements of the software or system. Titles are spelled as they appear on the system. 1. Procedures are numbered and subprocedures are lettered. You must complete steps in the sequence they are presented to ensure success. 2. a. b. • Bullet lists indicate general information about a procedure. They do not imply a sequential procedure. • Information HINT: Provides a helpful hint related to the current topic. NOTE: Calls out a specific area of note in the protocol. iii Seahorse BioScience XF Cell Mito Stress Test Kit User Manual XF96 Instructions Related Documentation In addition to the user manual, a Quick Start Guide is shipped with each kit. Customer Support To contact Seahorse Customer Service: By phone: (800) 671-0633, Option 3 • By fax: (978) 671-1611 • By e-mail: [email protected] • By web: http://www.seahorsebio.com • By mail: Reagents • Seahorse Bioscience Inc. 16 Esquire Road N. Billerica, MA 01862 iv Table of Contents 1 Overview of XF Cell Mito Stress Test Kit Overview .................................................................................................................................................. 1 XF Cell Mito Stress Test Kit Contents ..................................................................................................... 3 Other Requirements........................................................................................................................ 3 2 Reagent Preparation Reagent Kit Contents .............................................................................................................................. 5 Preparing the Reagents ........................................................................................................................... 6 Aliquoting Reagents ................................................................................................................................ 6 3 Optimization Setup Optimization Assay .................................................................................................................................. 7 Assumptions ................................................................................................................................... 7 Cell and Cartridge Preparation ....................................................................................................... 8 Optimization Assay Example for XF96............................................................................................ 8 Setting Up the Optimization Software .......................................................................................... 10 4 Optimization Analysis Analyzing the Peak Response for the ETC Accelerator......................................................................... 13 Determining the Peak.................................................................................................................... 14 Analyzing the Inhibitory Response for the ATP Coupler and Mito Inhibitor A and Mito Inhibitor B ...... 16 Determining the Inhibitory Concentration ..................................................................................... 17 5 Stress Test Setup XF Cell Mito Stress Test Assay.............................................................................................................. 19 Assumptions ................................................................................................................................. 19 Cell and Cartridge Preparation ..................................................................................................... 20 Preparing Reagents ...................................................................................................................... 20 Preparing Cartridge for Injection and Cell Plate ........................................................................... 20 Setting Up the XF Cell Mito Stress Test Software ........................................................................ 21 v Seahorse BioScience XF Cell Mito Stress Test Kit User Manual XF96 Instructions 6 Stress Test Analysis Index...............................................................................................35 vi Reagents Data Presentation .................................................................................................................................. 26 Spare Respiratory Capacity .......................................................................................................... 28 Coupling Efficiency ....................................................................................................................... 29 Basal Respiration .......................................................................................................................... 30 ETC Accelerator Response........................................................................................................... 31 ATP Coupler Response................................................................................................................. 32 The Mitochondrial Proton Circuit........................................................................................................... 33 Mitochondrial Proton Current (Respiration) .................................................................................. 34 Overview of the Manual • Section 1, “Overview of XF Cell Mito Stress Test Kit” on page 1 contains an overview describing the scientific merits of the stress test and a description of the kit contents and other required items. • Section 2, “Reagent Preparation” on page 5 describes how to prepare and aliquot the reagents. • Section 3, “Optimization Setup” on page 7 describes how to set up the optimization assay and software. • Section 4, “Optimization Analysis” on page 13 describes how to analyze the results of the optimization assay. • Section 5, “Stress Test Setup” on page 19 describes how to set up the XF cell mito stress test assay and software. • Section 6, “Stress Test Analysis” on page 25 describes how to analyze the results of the XF cell mito stress test assay. vii Seahorse BioScience XF Cell Mito Stress Test Kit User Manual XF96 Instructions Reagents This page intentionally left blank viii 1 Overview of XF Cell Mito Stress Test Kit This section covers the following topics: Overview • XF Cell Mito Stress Test Kit Contents • Other Requirements Overview • Overview worldwide to advance their research in understanding the role of mitochondrial function in areas such as obesity, diabetes, aging, cancer, cardiovascular function, and safety toxicity. Reagents The ability to measure cellular metabolism and understand mitochondrial dysfunction has enabled scientists Cellular metabolism is the process of substrate uptake, such as oxygen, glucose, fatty acids, and glutamine, and the subsequent energy conversion, through a series of enzymatically controlled oxidation and reduction reactions. These intracellular biochemical reactions result in the production of ATP and the release of heat and Valuable insight into the physiological state of cells, and the alteration of the state of those cells, can be gained through measuring the rate of oxygen consumed by the cells, an indicator of mitochondrial respiration, the Oxygen Consumption Rate (OCR). Cells also generate ATP through glycolysis, the conversion of glucose Optimization Setup chemical byproducts, such as lactate and CO2, into the extracellular environment. to lactate, independent of oxygen. The measurement of lactic acid produced indirectly via protons released into the extracellular medium surrounding the cells, causing acidification of the medium, provides the Extracellular Acidification Rate (ECAR). which to build more complex experiments aimed at understanding both the physiologic and pathophysiologic function of mitochondria, and to predict the ability of cells to respond to stress and/or insults. The cells are metabolically perturbed by the addition of three different compounds in succession, that shift Optimization Analysis This assay is derived from a classic experiment to assess mitochondria, and serves as a framework with the bioenergetic profile of the cell (Figure 1.1). One group will serve as the control, with running media added as control “compounds”. channel of the Fo portion ATP synthase (Complex V). In mitochondrial research, it is used to prevent state 3 (phosphorylating) respiration. Within cells, it can be used to distinguish the percentage of oxygen consumption devoted to ATP synthesis and the percentage of oxygen consumption required to overcome the natural proton leak across the inner mitochondrial membrane. Stress Test Setup The first injection is Oligomycin (ATP Coupler). Oligomycin inhibits ATP synthesis by blocking the proton The second injection is FCCP (ETC Accelerator). FCCP (Carbonyl cyanide-ptrifluoromethoxyphenylhydrazone) is an ionophore that is a mobile ion carrier. FCCP is an uncoupling agent leads to a rapid consumption of energy and oxygen, without the generation of ATP. In this case, both OCR and ECAR increase, OCR due to uncoupling, and ECAR due to the cells attempting to maintain their energy balance by using glycolysis to generate ATP. 1 Stress Test Analysis because it disrupts ATP synthesis by transporting hydrogen ions across the mitochondrial membrane instead of the proton channel of ATP synthase (Complex V). The collapse of the mitochondrial membrane potential Seahorse BioScience XF Cell Mito Stress Test Kit User Manual XF96 Instructions FCCP treatment can be used to calculate the spare respiratory capacity of cells, which is defined as the that the maintenance of some spare respiratory capacity, even under conditions of maximal physiological or pathophysiological stimulus, is a major factor defining the vitality and/or survival of the cells. The ability of cells to respond to stress under conditions of increased energy demand is influenced by the bioenergetic Overview quantitative difference between maximal uncontrolled OCR, and the initial basal OCR. It has been proposed capacity of mitochondria. This bioenergetic capacity is determined by several factors, including the ability of the cell to deliver substrate to the mitochondria, and the functional capacity of the enzymes involved in electron transport. Inhibitor A), a Complex III inhibitor. This combination shuts down mitochondrial respiration and enables both the mitochondrial and non-mitochondrial fractions contributing to respiration to be calculated. A decrease in OCR due to impaired mitochondrial function will occur, with a concomitant increase in ECAR, as the cell shifts Reagents The third injection is a combination of Rotenone (Mito Inhibitor B), a Complex I inhibitor, and Antimycin A (Mito to a more glycolytic state in order to maintain its energy balance. Rotenone is a mitochondrial inhibitor that prevents the transfer of electrons from the Fe-S center in Complex I converted to usable energy in the form of ATP. Antimycin A, a complex III inhibitor, binds to the Qi site of cytochrome c reductase, thereby inhibiting the oxidation of ubiquinol in the electron transport chain of oxidative phosphorylation. The inhibition of this reaction disrupts the formation of the proton gradient across the inner membrane. Therefore the production Optimization Setup to ubiquinone (Coenzyme Q). This inhibition of Complex I prevents the potential energy in NADH from being of ATP is subsequently inhibited, as protons are unable to flow through the ATP synthase complex in the absence of a proton gradient. Optimization Analysis Figure 1.1 Example of the Stress Test Stress Test Setup leak. Addition of Oligomycin blocks the ATP synthase and the residual respiration is due to the proton leak. The decrease on adding Oligomycin approximates to the proton current flowing through the ATP synthase before the inhibitor was added. The decrease compared to basal provides the coupling efficiency. The 2 Stress Test Analysis Basal respiration is predominantly controlled by the parallel re-entry pathways through the ATP synthase and Seahorse BioScience XF Cell Mito Stress Test Kit User Manual XF96 Instructions addition of a carefully calibrated concentration of the protonophore FCCP introduces a high artificial proton Overview conductance into the membrane. This maximal respiration is now controlled by electron transport chain activity and/or substrate delivery. The increased respiratory capacity above basal respiration provides the spare respiratory capacity. Finally, electron transport chain inhibitors are added; any residual respiration is non-mitochondrial and needs to be subtracted from the other rates. XF Cell Mito Stress Test Kit Contents XF96 plates. The kit contains the following reagents: Chemical Name ATP Coupler Oligomycin ETC Accelerator FCCP Mito Inhibitor A Antimycin A Mito Inhibitor B Rotenone DMSO Dimethyl Sulfoxide Optimization Setup Reagent Name Reagents Reagents The XF Cell Mito Stress Test Kit contains enough reagents to run a mitochondrial profile experiment for 6 full Other Requirements The following is a list of the required equipment and supplies not included in the XF Cell Mito Stress Test Kit: XF96 Extracellular Flux Analyzer • Seahorse assay media (or equivalent) supplemented with fresh sodium pyruvate, glutamine, and Optimization Analysis • glucose. (See the XF assay media product insert for more details.) XF96 FluxPak including cell plates, calibrant, and cartridges • Serial dilution vessel (24-well plate or eppendorf tubes) • Incubator - set to 37 °C, without CO2 • Standard cell culture equipment: Class II Biological Safety Cabinet • P10 - P1000 pipettes • Cell culture incubator • Bench top Vortex • Bench top mini-centrifuge Stress Test Analysis • Stress Test Setup • 3 Seahorse BioScience XF Cell Mito Stress Test Kit User Manual XF96 Instructions Overview Reagents Optimization Setup This page intentionally left blank Optimization Analysis Stress Test Setup Stress Test Analysis 4 2 Reagent Preparation This section covers the following topics: Preparing the Reagents • Aliquoting Reagents Overview • Reagent Kit Contents Reagents Figure 2.1 Kit Contents Optimization Setup One box of reagent compounds contains enough material for 6 full XF96 assays. The reagent box contains • Optimization Analysis the following items: 4 vials of the reagent compounds in powder form (marked with a Seahorse logo): Yellow top vial – ATP Coupler • Blue top vial – ETC Accelerator • Red top vial – Mito Inhibitor A • Green top vial – Mito Inhibitor B • Grey top vial - 1 ml DMSO - used to resuspend the compounds • 20 pre-labeled vials for aliquoting Stress Test Setup • Stress Test Analysis 5 Seahorse BioScience XF Cell Mito Stress Test Kit User Manual XF96 Instructions Preparing the Reagents give a 2.5 mM stock concentration for each compound. 1. Overview This protocol describes the process of resuspending the compounds in the appropriate volume of DMSO to Remove the XF Cell Mito Stress Test Kit from the –20 °C freezer and place on a lab bench for 30 minutes to thaw. Once the reagent compounds are resuspended and aliquotated, they must be used within 6 weeks when stored at –20 °C. 3. In a Class II Biological Safety Cabinet, resuspend powder reagent compound (marked with the Seahorse logo) in 180 l of DMSO. 4. Vortex the vial, right side up and up side down, for 10 seconds each. 5. Spin down the vial in a mini centrifuge for approximately 5 seconds. 6. Repeat steps 1 through 4 to resuspend the other reagent compounds. 7. Write the date of resuspension in the Date Reconstituted box on the side of the XF Cell Mito Stress Test Kit. Optimization Setup 2. Reagents NOTE: When handling the compounds, nitrile gloves should be worn. Aliquoting Reagents Open all the empty vials, of the same color, for one resuspended reagent (for example, all of the red toped vials). Using a P-200 pipette, aspirate 30 l of the resuspended reagent (in this example, the red vial containing the Mito Inhibitor A reagent). 3. Dispense 30 ul of reconstituted reagent into the appropriate empty vial; capping the vial immediately. 4. Repeat steps 1 through 3 for each resuspend reagent until each tube contains 30 l of reagent. 5. Reagents that are not used immediately should be stored in the XF Cell Mito Stress Test Kit box at –20 °C. NOTE: Once the reagent compounds are resuspended and aliquotated, they must be used within 6 weeks when stored at –20 °C. Stress Test Setup 2. Optimization Analysis 1. Stress Test Analysis 6 3 Optimization Setup This section covers the following topics: Optimization Assay • Cell and Cartridge Preparation • Optimization Assay Example for XF96 • Setting Up the Optimization Software Overview • The optimized working concentrations of the compounds used in the XF Cell Mito Stress Test Kit can change based on the cell line or cell type used for the assay. The Optimization Assay should be run for each Reagents Optimization Assay compound when a new cell line is used. Before running the optimization assay, the user should run a cell titration assay (described in the XF96 type. Record the average basal OCR value for this cell density, as it will be used to define the protocol in the software wizard. Prior to Day of Assay Day of Assay Optimization Analysis Hydrate Cartidge and store overnight at 37°C Load Cartridge & Calibrate 15 minutes Dilute Stress Test Compounds Run Experiment 1.5 hours Prepare Assay Medium Stock Optimization Setup Extracellular Flux Analyzer Users Manual) to determine the proper cell seeding density for each cell line or cell Analyze Data 1 hour Stress Test Setup Change to Assay Medium & Preincubate Seed Cells in XF Microplate Assumptions The optimal cell seeding density has been determined prior to running the optimization assay. • The average basal OCR was determined for the optimized cell seeding density. Stress Test Analysis • 7 Seahorse BioScience XF Cell Mito Stress Test Kit User Manual XF96 Instructions Cell and Cartridge Preparation Overview The day before running the assay, do the following: 1. Hydrate the desired number of cartridges and store at 37 °C with no CO2. 2. Prepare the desired number of cell plates by seeding cells at the appropriate density. Optimization Assay Example for XF96 Reagents For this example, we will use a 24-well plate to do the dilutions. You can also use eppendorf tubes. Preparing Compounds for Injection Ports 1. Remove the reagent box from the –20°C freezer. 2. Remove one tube for the reagent to be optimized and place the reagent box back in the freezer. Creating a Serial Dilution Optimization Setup NOTE: To determine the volumes for the following procedure, use Table 3.1 Serial Dilution Volumes. 1. Perform serial dilution in a 24-well plate: a. Prepare 100 M top concentration by adding 20 l from the appropriate reagent vial to 480 l of Seahorse running media into well #1. Dispense the appropriate volume of Seahorse running media into wells #2 through #10 (found in the Seahorse Assay Medium column in Table 3.1). c. Using the pipette, mix up and down in well #1 several times. d. Remove the appropriate volume of solution from well #1 (found in the Dilution Volume column Optimization Analysis b. in Table 3.1) and add to well #2. For example, for well #2 dilution, remove 300 l from well #1 and add to well #2. For well #3 dilution, remove 500 l from well #2 and add to well #3. Using the pipette, mix up and down in well #2 several times. Stress Test Setup e. Stress Test Analysis 8 Seahorse BioScience XF Cell Mito Stress Test Kit User Manual XF96 Instructions f. Repeat steps c through d until all 10 wells have solution. Overview Table 3.1 Serial Dilution Volumes Well/ Tube # Dilution Volume (from previous well/tube) 0 300 500 833 800 750 667 600 333 300 Reagents 1 2 3 4 5 6 7 8 9 10 Injection Concentration Final Working Seahorse Assay (M) [10X final working Concentration (M) Medium (l) concentration] 100 10 500* 30 3.0 700 15 1.5 500 12.5 1.25 167 10 1.0 200 7.5 0.75 250 5 0.5 333 3 0.3 400 1 0.1 667 0.3 0.03 700 We recommend starting the dilution from the 30M starting concentration to make serial dilutions (add 6l of 2.5mM stock to 494l Seahorse Running Media). Optimization Setup NOTE: * For the ATP Coupler reagent, there could be solubility issues at the 100M concentration. Refer to step 1a. 1. See the plate map in Table 3.2 and dispense 25 l of injection medium with compound into port A of the appropriate cartridge. Optimization Analysis Preparing Cartridge and Cell Plate for Assay Figure 3.1 Well Plate Ports Stress Test Setup Stress Test Analysis 9 Seahorse BioScience XF Cell Mito Stress Test Kit User Manual XF96 Instructions Table 3.2 96-Well Final Working Concentration 2 0.03 0.03 0.03 0.03 0.03 0.03 0.03 0.03 3 0.1 0.1 0.1 0.1 0.1 0.1 0.1 0.1 4 0.3 0.3 0.3 0.3 0.3 0.3 0.3 0.3 5 0.5 0.5 0.5 0.5 0.5 0.5 0.5 0.5 6 0.75 0.75 0.75 0.75 0.75 0.75 0.75 0.75 7 1 1 1 1 1 1 1 1 8 1.25 1.25 1.25 1.25 1.25 1.25 1.25 1.25 9 1.5 1.5 1.5 1.5 1.5 1.5 1.5 1.5 10 3 3 3 3 3 3 3 3 11 3 3 3 3 10 10 10 10 12 Blank Blank Blank Blank Blank Blank Blank Blank 2. Place the cartridge with injections in a 37 °C incubator with no CO2 until the assay is started. 3. Perform a medium change on the cell plate by removing the running medium from each well and Reagents 1 Blank Blank Blank Blank Blank Blank Blank Blank Overview A B C D E F G H replacing with Seahorse Assay Medium (described in detail in the XF96 Extracellular Flux Analyzer User Manual). Final volume for each well is 225 ul. Place the cell plate in a 37 °C incubator with no CO2 for one hour prior to the assay. NOTE: Seahorse recommends medium changes using the XF Prep Station to insure accurate final volumes. When using the XF Prep Station, the final volume should be set to 225 l. 1. Optimization Analysis Setting Up the Optimization Software Optimization Setup 4. Open the XF software. Figure 3.3 Seahorse MitoKit Screen Stress Test Setup Stress Test Analysis 10 Seahorse BioScience XF Cell Mito Stress Test Kit User Manual XF96 Instructions In the Seahorse Apps drop-down menu, choose XF Cell Mito Stress Test Kit. 3. Click the Start App button. 4. Click the Run Optimization plate button. Overview 2. The Optimization Injection Layout screen appears. Reagents Figure 3.4 Optimization Assay – ETC Accelerator/ ATP Coupler Injection Map Optimization Setup On the injection map screen, do the following: a. Choose the compound combination you are optimizing from the drop-down menu at the top of the page. b. In the Cell seeding # box, enter the number of cells seeded per well. c. In the Average basal OCR box, enter the average basal OCR for the seeded cell density. running the optimization assay when optimizing for cell seeding concentration. Click the Start. 7. Choose a directory to save the file in, change the default file name, if necessary, and then click OK. 8. Place the cartridge and calibration plate with loaded injector ports on the sliding tray. 9. Click Continue to start calibration. Stress Test Analysis 6. Stress Test Setup NOTE: The average basal OCR value for the cell in question should have been determined prior to Optimization Analysis 5. 10. When prompted, replace the calibration (utility) plate with the cell plate. 11. Click Start. 11 Seahorse BioScience XF Cell Mito Stress Test Kit User Manual XF96 Instructions 12. The Optimization Assay will now run on the XF Analyzer. discard. Overview 13. When the run is over, follow the prompts in the software and remove the cartridge and cell plate and Reagents Optimization Setup Optimization Analysis Stress Test Setup Stress Test Analysis 12 4 Optimization Analysis This section covers the following topics: Overview • Analyzing the Peak Response for the ETC Accelerator • Determining the Peak • Analyzing the Inhibitory Response for the ATP Coupler and Mito Inhibitor A and Mito Inhibitor B • Determining the Inhibitory Concentration When the ETC Accelerator is injected into the wells, the OCR response should increase in a dose dependent manner. This compound is the most sensitive in the kit to concentration changes, so it is important that the Reagents Analyzing the Peak Response for the ETC Accelerator correct peak data point is chosen from the optimization experiment. 1. When the optimization experiment is complete, open the excel data output file, and choose the shows the data used to generate the graph, compound concentration and OCR response. The software will calculate the peak response from the graph, in the green box labeled ‘Concentration at Peak’. The user can change this concentration as needed to determine the proper volume of compound stock to add to 5ml Seahorse Assay Medium for the Cell Mito Stress Test. 2. Stress Test Setup The graph on the left shows a dose response for the compound tested. The table in the middle Optimization Analysis Figure 4.1 Screen shot of the Mito Stress Test Optimization excel output for the ETC Accelerator. Optimization Setup worksheet tab labeled ‘Mito Stress Test Optimization’ (see Figure 4.1). The software automatically produces a dose response curve for the compound tested. This curve is shown with compound concentration on the x-axis and OCR on the y-axis. The software will automatically suggest a concentration at the peak of the curve, but it is very important for the user to check that this is the true peak, and change accordingly. 4. When the peak concentration is determined, type it into the field labeled ‘Concentration at Peak’. 13 Stress Test Analysis 3. Seahorse BioScience XF Cell Mito Stress Test Kit User Manual XF96 Instructions 5. The software will automatically calculate the volume of 2.5 mM compound needed to make 5 ml of injections for the cell mito stress test. Determining the Peak Overview the final injection (the red box). Write this volume down in your notebook, and use this to prepare In some situations, the peak response is not always obvious. The following presents a few examples of data from an optimization experiment, and how Seahorse recommends the peak concentration be chosen. Reagents Figure 4.2 In this example the answer if obvious, the OCR values rise as ETC Accelerator concentration increases, and falls after the peak is reached. Here, the user should choose 0.75 uM as the optimized concentration. Optimization Setup Optimization Analysis Stress Test Setup Figure 4.3 In some cases, the OCR response rises gently with concentration, and levels out once the peak is reached. In this example, the user should choose the concentration where the curve flattens out, in this case 1 uM. Stress Test Analysis 14 Seahorse BioScience XF Cell Mito Stress Test Kit User Manual XF96 Instructions Overview Figure 4.4 In this example, the curve shows a steep increase in OCR over a small range of concentrations. Even though there is a higher peak point at 0.75 uM, the user should choose the point after the steep increase, in this case 0.5 uM. The idea is to maximize the response in the lowest concentration possible. Reagents Optimization Setup Optimization Analysis Stress Test Setup Stress Test Analysis 15 Seahorse BioScience XF Cell Mito Stress Test Kit User Manual XF96 Instructions When the ATP Coupler or Mito Inhibitor A or Mito Inhibitor B are injected into the wells, the OCR response Overview Analyzing the Inhibitory Response for the ATP Coupler and Mito Inhibitor A and Mito Inhibitor B should decline in a dose dependent manner. These compounds should be run separately to determine the proper concentration for inhibition for each compound. As the responses are similar for these three compounds, the technique for analyzing the data is the same. When the optimization experiment is complete, open the excel data output file, and choose the Reagents 1. worksheet tab labeled ‘Mito Stress Test Optimization’ (see Figure 4.5). shows the data used to generate the graph, compound concentration and OCR response. The software will calculate the inhibitory response from the graph, in the green box labeled ‘Concentration at Dip’. The user can change this concentration as needed to determine the proper Optimization Analysis The graph on the left shows a dose response for the compound tested. The table in the middle Optimization Setup Figure 4.5 Screen shot of the Mito Stress Test Optimization excel output for the ATP Coupler. volume of compound stock to add to 5 ml Seahorse Assay Medium for the Cell Mito Stress Test. 2. The software automatically produces a dose response curve for the compound tested. This curve is 3. The software will automatically suggest a concentration at the inhibitory concentration of the curve, but it is very important for the user to check that this is the true maximal inhibition, and change accordingly. 4. When the inhibitory concentration is determined, type it into the field labeled ‘Concentration at Dip’. 5. The software will automatically calculate the volume of 2.5 mM stock compound needed to make 5 Stress Test Setup shown with compound concentration on the x-axis and OCR on the y-axis. Stress Test Analysis ml of the final injection (the red box). Write this volume down in your notebook, and use this to prepare injections for the mito stress test. 16 Seahorse BioScience XF Cell Mito Stress Test Kit User Manual XF96 Instructions Determining the Inhibitory Concentration examples of data from an optimization experiment, and how Seahorse recommends the inhibitory concentration be chosen. Reagents Figure 4.6 In this example the answer if obvious, the OCR values falls as ATP Coupler concentration increases, and flattens out once the nadir is reached. Here, the user should choose 0.75 uM as the optimized concentration. Overview In some situations, the inhibitory response concentration is not always obvious. The following presents a few Optimization Setup Optimization Analysis NOTE: In this example, the curve trends subtly downward once the curve bottoms out. Here it is important that the user manually enter the 0.75 uM concentration in the green box in the spreadsheet, as the software may automatically recommend a higher concentration. Stress Test Setup Stress Test Analysis 17 Seahorse BioScience XF Cell Mito Stress Test Kit User Manual XF96 Instructions Overview Figure 4.7 In this example, forMito Inhibitor A, the curve shows a steep decrease in OCR over a small range of concentrations. Here, the proper concentration for the best inhibitory response is 0.5 uM. Reagents Optimization Setup Optimization Analysis Figure 4.8 In some cases, like this one for Mito Inhibitor B, the curve shows a gradual decline in OCR over increasing concentrations. Again, the concentration where the curve flattens out at it's nadir is the optimized inhibitory concentration. In this example that concentration is 1.5 uM. Stress Test Setup Stress Test Analysis 18 5 Stress Test Setup This section covers the following topics: Overview • XF Cell Mito Stress Test Assay • Cell and Cartridge Preparation • Preparing Reagents • Setting Up the XF Cell Mito Stress Test Software Prior to Day of Assay Reagents XF Cell Mito Stress Test Assay Day of Assay Hydrate Cartidge and store overnight at 37°C Optimization Setup Load Cartridge & Calibrate 15 minutes Dilute Stress Test Compounds Run Experiment 1.5 hours Prepare Assay Medium Stock Analyze Data 1 hour Optimization Analysis Change to Assay Medium & Preincubate Seed Cells in XF Microplate Assumptions The optimal cell seeding density has been determined prior to running the optimization assay. • The average basal OCR was determined for the optimized cell seeding density. • The user has run the optimization assay for all 4 compounds for the cell line or cell type in question. Stress Test Setup • Stress Test Analysis 19 Seahorse BioScience XF Cell Mito Stress Test Kit User Manual XF96 Instructions Cell and Cartridge Preparation Overview The day before running the assay, do the following: 1. Hydrate the desired number of cartridges and store at 37 °C with no CO2. 2. Prepare the desired number of cell plates by seeding cells at the appropriate density. Preparing Reagents Determine the appropriate concentration of each injected compound by running the compound Reagents 1. optimization experiments and analyzing the date. 2. Prepare 5 ml of each compound to be injected. The Mito Inhibitor A and Mito Inhibitor B are added at the same time during the assay, so the user should prepare 1 5 ml injection stock with both compounds added. • The concentration of each stock compound is 2.5 mM. • The volume of the 2.5 mM stock to be used for preparing the 10x injection compound is automatically calculated in the “Optimization tab”. • If calculating manually, prepare a 10X injection concentration compared to the final desired working concentration. Optimization Setup • NOTE: Seahorse recommends preparing 5 ml of each injection so the user can use a multichannel pipette reservoir. The actual volume needed to fill the 80 ports for injection is 2.0 ml. If the optimized concentration is too high to make the full 5 ml, recalculate to make 0.5 ml of Preparing Cartridge for Injection and Cell Plate 1. Add the appropriate volume of the prepared compound reagents into the appropriate injection port: Port A - 20 l - ATP Coupler • Port B - 22 l - ETC Accelerator • Port C - 25 l - Mito Inhibitor A and Mito Inhibitor B 2. Store cartridge in a 37 °C incubator with no CO2 until ready to use. 3. Perform a medium change on the cell plate by removing the running medium from each well and Stress Test Setup • Optimization Analysis injection stock. replacing with Seahorse Assay Medium (described in detail in the XF96 Extracellular Flux Analyzer User Manual). Final volume for each well is 180 l. 4. Place the cell plate in a 37 °C incubator with no CO2 for one hour prior to the assay. volumes. When using the XF Prep Station, the final volume should be set to 180 l. 20 Stress Test Analysis NOTE: Seahorse recommends medium changes using the XF Prep Station to insure accurate final Seahorse BioScience XF Cell Mito Stress Test Kit User Manual XF96 Instructions Setting Up the XF Cell Mito Stress Test Software Overview 1. Open the XF software. Figure 5.1 Seahorse MitoKit Screen Reagents Optimization Setup In the Seahorse Apps drop-down menu, choose XF Cell Mito Stress Test Kit. 3. Click the Start App button. 4. Click the Run Stress Test button. Optimization Analysis 2. The XF Cell Stress Test Setup screen appears. Figure 5.2 XF Cell Stress Test Setup Screen Stress Test Setup Stress Test Analysis 21 Seahorse BioScience XF Cell Mito Stress Test Kit User Manual XF96 Instructions 5. Do the following: In the Cell seeding # box, enter the number of cells seeded per well. b. In the Average basal OCR box, enter the average OCR. Overview a. NOTE: The average basal OCR value for the cell in question should have been determined prior to running the optimization assay when optimizing for cell seeding concentration. 6. Reagents c. Enter the final working concentration for each reagent that will be injected. Click the Next button. The group info screen appears. Optimization Setup Figure 5.3 Group Info Screen Optimization Analysis 7. Assign a group to the unassigned wells by choosing a color and a name, and then clicking on the NOTE: The groups are defined as different treatments before the XF Cell Mito Stress Test is run. All wells will get the same compound injections when the stress test is run. 8. Stress Test Setup appropriate wells. Click the Next button. Stress Test Analysis 22 Seahorse BioScience XF Cell Mito Stress Test Kit User Manual XF96 Instructions The Stress Test Injection Layout screen appears. This screen shows the injection layout for the Figure 5.4 Stress Test Injection Layout Screen Overview Stress Test cartridge. Reagents Optimization Setup 9. Click Start. 10. Choose a directory to save the file in, change the default file name, if necessary, and then click OK. 11. Place the cartridge and calibration plate with loaded injector ports on the slide out tray. Optimization Analysis 12. When prompted, replace the calibration (utility) plate with the cell plate. 13. Click Start. 14. The Stress Test will now run on the XF Analyzer. 15. When the run is over, follow the prompts in the software and remove the cartridge and cell plate and discard. Stress Test Setup Stress Test Analysis 23 Seahorse BioScience XF Cell Mito Stress Test Kit User Manual XF96 Instructions Overview Reagents Optimization Setup This page intentionally left blank Optimization Analysis Stress Test Setup Stress Test Analysis 24 6 Stress Test Analysis This section covers the following topics: • Spare Respiratory Capacity • Coupling Efficiency • Basal Respiration • ETC Accelerator Response • ATP Coupler Response • The Mitochondrial Proton Circuit • Mitochondrial Proton Current (Respiration) Reagents Data Presentation Overview • Since mitochondrial function can be analyzed in a number of different ways, one of the key advantages to using the XF Cell Mito Stress Test Kit is that key metrics are calculated automatically by the software, allowing Upon completion of the XF Cell Mito Stress Test, the data outputs to a standard XF excel file. The standard analysis tabs are still present (Data Viewer, Rate Data, etc) as well as the troubleshooting tabs that contain the raw data (Levels, Calibration). When the XF Cell Mito Stress Test is run, an additional tab is present called Optimization Setup for easy standardization between runs. the Mito Stress Test Output. Click on this tab to view the data calculated from this experiment. Optimization Analysis Stress Test Setup Stress Test Analysis 25 Seahorse BioScience XF Cell Mito Stress Test Kit User Manual XF96 Instructions Data Presentation Overview Data from five separate metrics are automatically calculated by the XF Cell Mito Stress Test software and presented in the format shown in Figure 6.1. Reagents Figure 6.1 Example data output for the XF Cell Mito Stress Test. Optimization Setup individual well. A user can scan the data quickly, and note if there are any outliers in individual groups. The groups previously chosen in the Stress Test Groups Layout screen, within the Stress Test wizard, are Optimization Analysis Data Table — The data table in the upper left-hand portion of the screen shows the calculated metric for each delineated by color in this table. Note that the color code is consistent throughout the results data, including the histogram. deviation, and coefficient of variation (CV) for each individual group. This provides the user an indication of the reproducibility between the groups. Histogram — The graph on the bottom of the screen shows a histogram, with the metric of interest on the y- Stress Test Setup Statistics Table — The statistics table in the upper right hand of the screen shows average, standard axis and the group on the x-axis. This graph provides the user a snapshot view of the group data as they relate to each other. Stress Test Analysis 26 Seahorse BioScience XF Cell Mito Stress Test Kit User Manual XF96 Instructions The data for the five output metrics are calculated according to Table 6.1. Overview Table 6.1 Description or formula for each output metric explaining calculation Description/Formula Spare Respiratory Capacity* =ETC Accelerator Response/Basal Respiration Coupling Efficiency* =1 - (ATP Coupler Response/Basal Respiration) Basal Response The 3rd basal measurement (measurement before injection) ETC Accelerator Response The maximum rate after ETC Accelerator injection ATP Coupler Response The minimum rate after ATP Coupler injection NOTE: * For the calculated metrics Spare Respiratory Capacity and Coupling Efficiency, the minimum Mito Reagents Metric Inhibitor Response is subtracted from the injection responses to account for non-mitochondrial respiration. Optimization Setup Optimization Analysis Stress Test Setup Stress Test Analysis 27 Seahorse BioScience XF Cell Mito Stress Test Kit User Manual XF96 Instructions Spare Respiratory Capacity respiration is subtracted from both of these values. This is the true ‘stress test’ measure of the assay, as it Overview Spare respiratory capacity is calculated by noting the OCR response to the ETC Accelerator, and dividing that number by the basal respiration and multiplying by 100 to get a percentage. The non-mitochondrial provides the user an idea of a cells maximum ATP production, therefore cells with a higher capacity have a greater ability to respond to stress. Reagents Optimization Setup Figure 6.2 Spare Respiratory Capacity — These data are presented as a % response from basal readings, with nonmitochondrial respiration subtracted out. Optimization Analysis An important diagnostic of the bioenergetic status of a cell, particularly one which can experience a variable ATP demand, such as a neuron, is to determine the spare respiratory capacity - the ability of substrate supply and electron transport to respond to an increase in energy demand. Ideally this should be done by increasing possible, an alternative is to add a carefully titrated concentration of protonophore, such as FCCP, sufficient to induce uncontrolled respiration. Under these conditions the mitochondria can still retain a considerable proton motive force, and are still able to generate ATP. The FCCP concentration is critical, since excess will Stress Test Setup oxidative phosphorylation directly, by activating an extra-mitochondrial ATPase, but since this is not always collapse the proton motive force. Stress Test Analysis 28 Seahorse BioScience XF Cell Mito Stress Test Kit User Manual XF96 Instructions Coupling Efficiency Overview The coupling efficiency metric measures the amount of ATP turnover in the mitochondria, compared to a baseline reading. The coupling efficiency data can be found by scrolling down to below the spare respiratory capacity data in the Mito Stress Test Output tab. Reagents Optimization Setup Figure 6.3 Coupling Efficiency — These data are presented as a % response from basal readings, with nonmitochondrial respiration subtracted out. Optimization Analysis In a single experiment it is possible to quantify the most important bioenergetic diagnostics of the mitochondria within an intact cell. The proton current generated by basal respiration supplies the ATP synthase and the proton leak. An approximate measure of the mitochondrial ATP synthesis in the basal state can be obtained from the decrease in respiration by inhibiting the ATP synthase with Oligomycin, the residual respiration being ascribed to the proton leak. In practice, since ATP synthase inhibition results in a slight The addition of Oligomycin shifts ATP production to glycolysis. To supply a cell with ATP at a rate comparable to that found during aerobic glycolysis requires that the pathway accelerate to more than tenfold. While most Stress Test Setup mitochondrial hyperpolarization, and the proton leak is voltage dependent, this approach can underestimate the ATP synthesis, and exaggerate the proton leak in the basal state. cell lines have sufficient glycolytic capacity, in some cells this may not be the case with the result that Oligomycin may induce an ATP crisis. Stress Test Analysis 29 Seahorse BioScience XF Cell Mito Stress Test Kit User Manual XF96 Instructions Basal Respiration The basal reading is determined by taking the 3rd basal measurement (the last measurement before compound injection). The basal reading is then used to baseline the responses to different compounds. Reagents Figure 6.4 Basal Respiration — These data are presented an absolute OCR reading (pMoles/min), taken from the third basal measurement. Overview The basal respiration is the baseline oxygen consumption reading per well, before compounds are injected. Optimization Setup Optimization Analysis Stress Test Setup Stress Test Analysis 30 Seahorse BioScience XF Cell Mito Stress Test Kit User Manual XF96 Instructions ETC Accelerator Response (FCCP) injection. It is calculated by taking the maximum value from the 3 after injection measurements. This value is then used to calculate Spare Respiratory Capacity - represented here to provide the user an idea of Overview The ETC Accelerator Response represents the maximum OCR measurement value after the ETC Accelerator maximum OCR readings seen in the assay. Reagents Optimization Setup Figure 6.5 ETC Accelerator Response — These data are presented an absolute OCR reading (pMoles/min), taken from the maximum OCR measurement after the ETC Accelerator injection. Optimization Analysis Stress Test Setup Stress Test Analysis 31 Seahorse BioScience XF Cell Mito Stress Test Kit User Manual XF96 Instructions ATP Coupler Response (Oligomycin) injection. It is calculated by taking the minimum value from the 3 measurements after injection. This value is then used to calculate Coupling Efficiency. Reagents Optimization Setup Figure 6.6 ATP Coupler Response — These data are presented an absolute OCR reading (pMoles/min), taken from the minimum OCR measurement after the ETC Accelerator injection. Overview The ATP Coupler Response represents the minimum OCR measurement value after the ATP Coupler Optimization Analysis Stress Test Setup Stress Test Analysis 32 Seahorse BioScience XF Cell Mito Stress Test Kit User Manual XF96 Instructions The Mitochondrial Proton Circuit each case a decline in redox potential of the electrons passing through the complex, is coupled to the Overview The mitochondrial proton circuit (Figure 6.7) is central to the multiple physiological functions of mitochondria. Three electron transport complexes, I, III, and IV pump protons across the inner mitochondrial membrane. In extrusion of protons from the matrix. Complexes I and III normally operate close to thermodynamic equilibrium, and can be induced to reverse under artificial conditions. Complex IV is irreversible. Complex II, of which succinate dehydrogenase is a part, is energetically incapable of pumping protons. The stoichiometry respiration) is the indicator allowing measurement of the proton current. The redox span across the electron transport chain is approximately 1100 mV, and provides an estimate of the maximal proton motive force Reagents of the proton pumps is such that a total of 10 protons are extruded for each electron pair passing from NADH to oxygen. Therefore the rate of oxygen uptake by a cell (after correcting for any non-mitochondrial across the inner membrane vary from 180 mV to 220 mV. Optimization Setup Figure 6.7 The electrical circuit analogy of the proton circuit. Optimization Analysis Stress Test Setup In Figure 6.7, Left: the three proton pumping complexes of the electron transport chain (a) pump protons out of the mitochondrion generating a proton motive force. The proton circuit is completed by re-entry through the ATP synthase (b) coupled to the generation of ATP, or through a dissipative leak (c). Right: In the electrical analogy three electrical batteries, corresponding to Complexes I, III and IV generate a voltage and the electron circuit is completed by 'useful' work (lighting a bulb) or 'dissipative' work through the variable resistance. synthase acts as a proton pump hydrolyzing matrix ATP, and extruding protons from the matrix. However, the high proton motive force generated by the electron transport chain forces the complex to run in reverse, synthesizing matrix ATP, as protons are driven back through the complex. The electron transport chain proton 33 Stress Test Analysis The dominant pathway of proton reentry is via ATP synthase. In the absence of a proton motive force, the Seahorse BioScience XF Cell Mito Stress Test Kit User Manual XF96 Instructions pumps together with the ATP synthase thus creating microscopic proton circuits across the inner proton current in nanomoles of protons per minute. This proton circuit is central to mitochondrial bioenergetics investigations. Experimentally distinct, but parallel experimental approaches are used to quantify the potential and flux components of the proton circuit, both with isolated mitochondria, and intact Overview mitochondrial membrane. The circuit has terms of potential, the proton motive force in millivolts, and flux, the cells. The proton motive force is expressed in millivolts and is identical to the proton electrochemical potential which uses the thermodynamic unit of kJ/mole. A useful conceptual model to consider is the proton circuit being analogous to a simple electrical circuit bioenergetic function. All mitochondria possess an endogenous proton leak that is apparent also in mitochondria in situ within intact cells, and is thus not an artifact of isolation. In the absence of ATP synthesis the proton circuit is largely completed by the proton leak, which may serve as an important factor in limiting Reagents (Figure 6.7). An additional component is necessary to provide a more accurate model of mitochondrial the proton motive force, therefore restricting leakage of single electrons from the electron transport chain to form the superoxide anion. The ATP synthase and the proton leak provide parallel pathways for proton reentry. mitochondrial protein or cell number), proton motive force (in mV) and proton conductance (nmol H+/min/mV/ per unit material). Optimization Setup The electrical analogue can be quantified in terms of voltage, current and (by Ohm's Law) resistance or conductance. In the proton circuit the corresponding parameters are proton current (nmol H+/min/per unit of Mitochondrial Proton Current (Respiration) The tight coupling between electron transport and proton extrusion attests that, for a given substrate, the rate of the total proton current. The many techniques available for monitoring the rate of oxygen utilization by mitochondria, all measure the activity of a single process, which is the transfer within complex IV of 4 electrons to a molecule of oxygen, to generate two molecules of water. Despite this, oxygen electrode experiments can be designed to obtain information on a wide variety of other processes within the Optimization Analysis of mitochondrial oxygen utilization, with both the isolated organelles and intact cells, is an accurate measure mitochondria, such as substrate transport, dehydrogenase activity, electron transport through individual complexes, ATP synthase activity, and proton leak. Incubation conditions have to be designed such that the process to be investigated exerts significant control over the overall rate of electron transport. experiment, it is advisable to determine residual respiration in the presence of electron transport inhibitors, Stress Test Setup In summary, when working with intact cells, or tissues, one should not assume that oxygen uptake is due to mitochondria only, since cells possess a variety of oxygenases. Therefore, when concluding a cell respiration such as Rotenone or Antimycin A, so as to optimize your assay results. Stress Test Analysis 34 Index A Compounds, resuspending.................................... 6 Analyzing Contact information................................................iv Inhibitory response for ATP Coupler and Mito Inhibitors A and B ........................... 16 Conventions ........................................................... iii Coupling efficiency......................................... 27, 29 Peak response for the ETC accelerator ........ 13 Antimycin A ........................................................ 2, 3 D Assay kit overview.................................................. 1 Determining Assumptions Inhibitory concentration ................................ 17 Optimization .................................................... 7 Peak response for ETC accelerator .............. 14 Stress Test .................................................... 19 E ATP Coupler....................................................1, 3, 5 ETC Accelerator ...........................................3, 5, 28 Coupler response.................................... 27, 32 Response ................................................ 27, 31 ATPase ................................................................. 28 Extracellular Acidification Rate (ECAR) .................. 1 Average basal OCR ............................. 7, 11, 19, 22 F B FluxPak................................................................... 3 Basal Respiration ................................................ 2, 30 G Response ...................................................... 27 Getting help............................................................iv Bench top Mini-centrifuge ................................................ 3 Green top vial ......................................................... 5 Grey top vial ........................................................... 5 Vortex .............................................................. 3 Blue top vial............................................................ 5 H Help ........................................................................iv C Hint statements ...................................................... iii Cartridge preparation Optimization .................................................... 8 I Stress test ..................................................... 20 Incubator ................................................................ 3 Cell culture incubator ............................................. 3 Inhibitory response analysis................................. 16 Cell preparation Optimization .................................................... 8 K Stress test ..................................................... 20 Kit contents ............................................................ 3 Cellular metabolism................................................ 1 Centrifuge............................................................... 3 M Chemical names..................................................... 3 Mini-centrifuge ....................................................... 3 Class II Biological Safety Cabinet ...................... 3, 6 Mito Coenzyme Q........................................................... 2 Inhibitor A........................................... 2, 3, 5, 6 Complex Inhibitor B.................................................... 2, 5 I inhibitor ......................................................... 2 III inhibitor........................................................ 2 V ...................................................................... 1 Stress Test Output tab............................ 25, 29 Mitochondrial Dysfunction ..................................................... 1 35 Seahorse BioScience XF Cell Mito Stress Test Kit User Manual XF96 Instructions Function ........................................................ 25 Red top vial ............................................................ 5 Proton circuit................................................. 33 Resuspending compounds .................................... 6 Proton current (respiration) ........................... 34 S N Safety cabinet ........................................................ 3 Names Seahorse assay medium .................................. 3, 10 Serial dilution vessel............................................... 3 Reagents ......................................................... 3 Setting up optimization software ......................... 10 Note statements ..................................................... iii Spare respiratory capacity ............................. 27, 28 Standard cell culture equipment ............................ 3 O Stress test Assumptions ................................................. 19 OCR Definition ......................................................... 1 Data presentation.......................................... 26 Oligomycin ............................................................. 1 Preparing cartridge for injection and cell plate .................................. 20 Optimization Preparing reagents........................................ 20 Assay............................................................... 7 Assay example ................................................ 8 Stress Test Kit Assumptions ................................................... 7 Contents.......................................................... 3 Creating serial dilution .................................... 8 Example .......................................................... 2 Preparing cartridge for assay.......................... 9 Overview ......................................................... 1 Preparing cell for assay................................... 9 Support, technical ..................................................iv Preparing compounds .................................... 8 Oxygen Consumption Rate (OCR) ......................... 1 T Technical support...................................................iv P Text conventions .................................................... iii P10 - P1000 pipettes ............................................. 3 Peak response analysis........................................ 13 U Phone number........................................................iv URL ........................................................................iv Preparing Cartridge ................................................... 8, 20 V Cell ............................................................ 8, 20 Vortex ..................................................................... 3 Reagents ......................................................... 6 R W Website support .....................................................iv Reagents Chemical names ............................................. 3 X Compounds .................................................... 5 XF excel file .......................................................... 25 Names ............................................................. 3 Preparing......................................................... 6 Y Yellow top vial ........................................................ 5 36 Reagents Chemicals ....................................................... 3