1
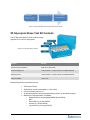
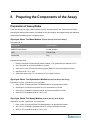
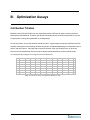
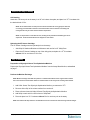
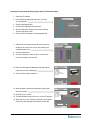
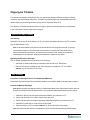
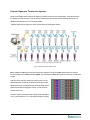
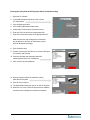
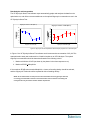
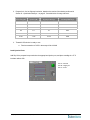
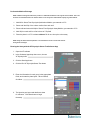
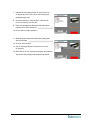
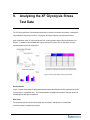
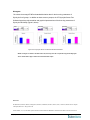
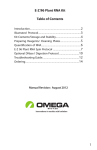
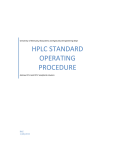
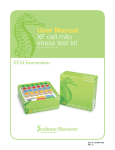
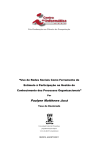
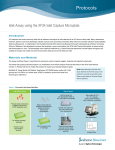
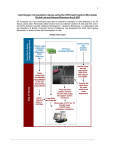
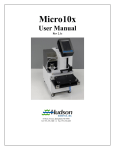
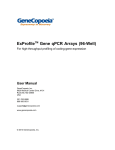
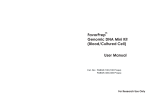
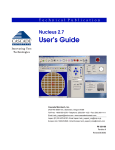
XF Glycolysis Stress Test Kit User Manual For use with the XF96 Analyzer Part# 102194-100 For Research Use Only XF Glycolysis Stress Test Kit User Manual (XF96) 1 Preface Copyright © 2012 Seahorse Bioscience, Inc.. All rights reserved. Printed in U.S.A. Under copyright laws, this manual may not be reproduced in any form, in whole, or in part, without prior written permission from Seahorse Bioscience Inc. This revision supersedes all previous revisions. Every effort has been made to ensure that the information in this manual is accurate at the time of printing. However, Seahorse Bioscience Inc. assumes no liability for errors or omissions and reserves the right to make changes without notice to any products described herein to improve reliability, function, or design. Excel is a registered trademark of Microsoft Corporation. Other company and product names may be trademarks of their respective companies. Customer Support Phone: +1.978.671.1600 Option 3 Toll free within USA 800.671.0633 Option 3 Fax: +1.978.671.1611 E-mail: [email protected] Web: http://www.seahorsebio.com Mail: Seahorse Bioscience Inc., 16 Esquire Road Billerica, MA 01862 XF Glycolysis Stress Test Kit User Manual (XF96) 2 Table of Contents I. Introduction ………………………………………………………………… 4 II. Preparing the Components of the Assay…………………………… 7 III. Optimization Assays…………………………………….………………. 9 IV. Running the XF Glycolysis Stress Test……………….…………… 17 V. 21 Analyzing XF Glycolysis Stress Test Data………………………… XF Glycolysis Stress Test Kit User Manual (XF96) 3 I. Introduction Overview Cellular metabolism is the process of converting fuel substrates such as glucose, fatty acids, and glutamine, to ATP through a series of enzymatic oxidation and reduction reactions. Cells take up reactants from their environment, such as glucose and O2, and process them biologically to generate ATP, resulting in the extrusion of products such as lactate, H+ and CO2 into the extracellular environment. ATP produced is used to maintain cellular function and to do work. The Seahorse XF Analyzer simultaneously measures these energy producing pathways non-invasively, in real-time, through the use of novel, solid-state sensors, specially designed consumables, and elegant instrument mechanics. The rate of oxygen consumption, or OCR, is proportional to mitochondrial respiration, while the rate of extracellular acidification, through the extrusion of protons, is proportional toglycolysis. + Changes in O2 and H concentrations are measured in a transient microchamber, with the solid-state sensors residing 200 microns above the cell surface. This ability to measure cellular metabolism has enabled scientists worldwide to advance their understanding of the roles glycolysis, and mitochondrial respiration, play in human physiology and disease. Changes in cellular metabolism have been shown to have therapeutic and diagnostic potential in the areas of obesity, diabetes, aging, cancer, cardiovascular function, immunology, and more recently, translational medicine. Assay Principle Glycolysis and oxidative phosphorylation are the two major energy producing pathways in the cell. Most cells possess the ability to shift dynamically between these two processes, adapting metabolically to changes in their environment for the purpose of survival. Glucose in the cell is converted to pyruvate, which is then converted to lactate in the cytoplasm, or CO2 and water in the mitochondria. Glucose conversion to lactate (Glycolysis) results in a net production and extrusion of protons into the extracellular medium. As glycolysis occurs, the resulting acidification of the medium surrounding the cells is measured directly by the XF Analyzer and reported as the Extracellular Acidification Rate, or ECAR. XF Glycolysis Stress Test Kit User Manual (XF96) 4 When oxidative phosphorylation is disrupted by an ATP synthase inhibitor (Oligomycin), cells may increase the rate of glycolysis to maintain ATP production, and thereby energy homeostasis, as previously shown (Wu M, et al.). This elevated rate of glycolysis is referred to as the Glycolytic Capacity of the cell. 10mM in) m Glycolytic Reserve pH / m ( R C A E Glycolytic Capacity ECAR Extracellular A idi i ation Glycolysis Non‐glycolytic Acidification Figure 1. XF Glycolysis Stress Test Profile This assay provides a standard and comprehensive method to assess the three key parameters of glycolytic function: Glycolysis, Glycolytic Capacity, and Glycolytic Reserve. Non-glycolytic acidification (which include includes CO2 evolution followed by its hydration to carbonic acid and bicarbonate) and proton extrusion are also reported in the same assay. Initially, cells are incubated in the glycolysis stress test medium without glucose and ECAR is assessed. The first injection is a saturating concentration of glucose (10mM). Glucose is taken up by the cells and catabolized through the glycolytic pathway to lactate, producing ATP and protons. The extrusion of protons into the surrounding medium produces a rapid increase in ECAR. This glucose-induced response is reported as the rate of glycolysis (or Glycolytic Flux) under basal conditions. The second injection is oligomycin, an ATP synthase inhibitor. Oligomycin inhibits mitochondrial ATP production and thus shifts the energy production to glycolysis, with the subsequent increase in ECAR revealing the maximum glycolytic capacity of the cells. The final injection is 2-DG, a glucose analog, which inhibits glycolysis through competitive binding to glucose hexokinase, the first enzyme in the glycolytic pathway. The resulting decrease in ECAR further confirms that the ECAR produced in the experiment is due to glycolysis (but it is not required for calculating Glycolytic Flux or Glycolytic Capacity). The difference between Glycolytic Capacity and Glycolysis rate defines Glycolytic Reserve. ECAR prior to glucose injection is referred to non-glycolytic acidification, which includes CO2 evolution (from the TCA cycle and other biochemical pathways) followed by its hydration to carbonic acid and bicarbonate, as well as proton extrusion. XF Glycolysis Stress Test Kit User Manual (XF96) 5 Optimization Glycolysis Stress Test • Cell Number Titration • Oligomycin Titration Automated Data Output & Metrics Figure 2. General Workflow of the XF Glycolysis Stress Test Kit XF Glycolysis Stress Test Kit Contents The XF Glycolysis Stress Test Kit contains enough reagents to run 6 full XF assay plates. Figure 3. XF Glycolysis Stress Test Kit Reagent Quantity Seahorse Glucose Solution 6 vials of a 2.5M solution Seahorse Oligomycin 1 vial of powder + 6 empty vials for reconstituted aliquots Seahorse 2-DG 1 vial of powder + 6 empty vials for reconstituted aliquots Seahorse DMSO 1 vial of 1mL Materials Required (not provided in the kit): XF96 4-port FluxPak Serial dilution vessel (24-well plate or 1.5mL tubes) CO2-free incubator set to 37°C XF Glycolysis Stress Test recommended assay medium, as described on page 7. Materials for Glycolysis Stress Test Media o Bicarbonate-free, low phosphate DMEM (Sigma D5030) o NaCl o Phenol Red (e.g. Sigma P0290) o Glucose (e.g. Sigma G8769) o L-glutamine (e.g. Invitrogen 25030) XF Glycolysis Stress Test Kit User Manual (XF96) 6 II. Preparing the Components of the Assay Preparation of Assay Media There are two types of assay medium utilized in the XF Glycolysis Stress Test. Seahorse recommends preparing the following base medium, formulated for long-term stability, and supplementing with additional components immediately prior to running the assay. Glycolysis Stress Test Base Medium (Prepare the Day Prior to the Assay) Formulation for 1L: Component Concentration DMEM D 5030 (Sigma) 1 bottle (powder) NaCl 143mM (final) Phenol Red 3mg Preparation Instructions: 1. Dissolve one bottle of Sigma D5030 powder in 990mL of TC-grade water pre-warmed to 37oC. 2. Add 1.85g NaCl for a final concentration of 143mM. 3. Add 0.6mL of a 0.5% Phenol Red solution (Sigma P0290) for a final concentration of 3mg/L. 4. Adjust the pH to 7.35 +/- 0.05. 5. Sterile filter and store at 4oC. It is stable at 4°C for at least 3 months. Glycolysis Stress Test Optimization Medium (Prepare the Day of the Assay) Preparation of 150mL (sufficient for one assay plate): 1. Place 150mL of Glycolysis Stress Test Base Medium in an appropriate container 2. Add 600μl of a 2.5M Glucose solution for a final concentration of 10mM 3. Add 1.5mL of a 200mM L-glutamine solution for a final concentration of 2mM 4. Warm to 37oC and adjust the pH to 7.35+/- 0.05 Glycolysis Stress Test Assay Medium (Prepare the Day of the Assay) Preparation of 150mL (sufficient for one assay plate): 1. Place 150mL of Glycolysis Stress Test Base Medium in an appropriate container 2. Add 1.5mL of a 200mM L-glutamine solution for a final concentration of 2mM 3. Warm to 37oC and adjust the pH to 7.35+/- 0.05 XF Glycolysis Stress Test Kit User Manual (XF96) 7 Reagent Preparation NOTE: Wear chemically-resistant, impervious gloves when handling the compounds in the kit. Reagent preparation must be performed in a Class II Biological Safety Cabinet. Reagent aliquots must be stored at –20°C. Use reagent aliquots within 3 months of reconstitution. Remove the XF Glycolysis Stress Test Kit from the freezer and allow the Oligomycin and 2-DG stock vials to warm to room temperature. Store the remaining components in the freezer until the reagent preparations are complete. Preparation of Oligomycin Aliquots (5mM) 1. Spin down the stock vial in a micro centrifuge for approximately 5 seconds prior to opening 2. Re-suspend powder in 18μl of DMSO 3. Transfer 30μl to each aliquot vial. Store vials not needed immediately at -20°C 4. Record the date of re-suspension on the side of the XF Glycolysis Stress Test Kit Preparation of 2-Deoxy-D-Glucose aliquots (1M) NOTE: pH adjustment of 2-DG solution may be performed in the reagent bottle or in a separate beaker. Before starting, ensure the availability of an appropriately-sized stir bar. 1. Re-suspend stock in 16ml of XF Glycolysis Stress Test Assay Medium, pre-warmed to 37°C, pipetting up and down several times 2. Adjust pH to 7.35 +/- 0.05 in stock jar or separate beaker, and adjust volume to 18ml with Glycolysis Stress Test Assay Medium NOTE: If solution has cooled to below 30 ºC, it should be warmed in a water bath prior to pH adjustment 3. Transfer 3ml to each aliquot vial. Store vials not needed immediately at -20°C 4. Record the date of re-suspension on the side of the XF Glycolysis Stress Test Kit Thaw a fresh aliquot of Oligomycin and 2-DG for each assay; warm to room temperature before use. XF Glycolysis Stress Test Kit User Manual (XF96) 8 III. Optimization Assays Cell Number Titration Metabolic rates (OCR and ECAR) can vary significantly between different cell types, culturing conditions, and experimental treatments. Therefore, the optimal cell seeding density should be determined on any new cell type before running other optimization or profiling assays. For the best results, several cell densities should be tested. A typical range is between 10,000 and 100,000 cells/well, although the actual seeding densities may need to be adjusted depending on cell diameter, rate of growth, and other factors. Cell types that are small in diameter, have long doubling times, or which are known to be less metabolically active may require higher seeding densities to achieve optimal results. An example plate layout diagram for a single cell line is provided below: X X X X X X X X 10k 10k 10k 10k 10k 10k 10k 10k 20k 20k 20k 20k 20k 20k 20k 20k 30k 30k 30k 30k 30k 30k 30k 30k 40k 40k 40k 40k 40k 40k 40k 40k 50k 50k 50k 50k 50k 50k 50k 50k 60k 60k 60k 60k 60k 60k 60k 60k 70k 80k 90k 100k 70k 80k 90k 100k 70k 80k 90k 100k 70k 80k 90k 100k 70k 80k 90k 100k 70k 80k 90k 100k 70k 80k 90k 100k 70k 80k 90k 100k NOTE: “X” wells should contain only Optimization Medium (no cells). XF Glycolysis Stress Test Kit User Manual (XF96) 9 X X X X X X X X Prior to the Day of Assay Cell Seeding Seed cells ~24 hours prior to the assay in an XF cell culture microplate, and place in a 37oC incubator with the desired level of CO2. NOTE: As the actual number of cells present in the well will affect the rate of glycolysis observed, it is strongly recommended to maintain a consistent number of hours between cell seeding and running the XF assay to reduce variation between experiments. NOTE: For experiments on non-adherent cells, seeding can be performed immediately prior to the experiment. Contact Seahorse Bioscience Support for more details. Hydrating the XF Sensor Cartridge The XF Sensor Cartridge must be hydrated prior to the assay: • Add 200µl of Seahorse Bioscience Calibrant to each well of an XF Utility Plate. • Place the XF Sensor Cartridge on top of the utility plate, and place in a 37oC incubator without CO2 for a minimum of 12 hours. Day of Assay Preparation of Glycolysis Stress Test Optimization Medium Prepare the Glycolysis Stress Test Optimization Medium from the Assay Base Medium, as described on page 7. Perform the Medium Exchange NOTE: Medium exchange described here produces a >1000-fold fold dilution of the original culture medium. This is the minimum recommended dilution to minimize effects on the assay from residual growth medium. 1. Add 225uL Stress Test Glycolysis Optimization Medium, pre-warmed to 37oC 2. Remove all but 25µl of the culture medium from each well. 3. Rinse cells two times with 300μl of Stress Test Glycolysis Optimization Medium 4. Add 225μl to each well for a final volume of 250μl/well 5. Place the plate in a 37°C incubator without CO2 for one hour prior to the assay NOTE: The Seahorse XF Prep Station is recommended to ensure accurate final volumes during media exchanges. XF Glycolysis Stress Test Kit User Manual (XF96) 10 Running the Assay with the XF Glycolysis Stress Test Software App 1. Open the XF software 2. In the Seahorse Apps drop-down menu, choose XF Glycolysis Kit 3. Click the Start App button 4. Click the Run Optimization Plate button 5. Select Cell Number Titration for one or two cell lines from the drop down menu 6. Enter the Cell Line Name in the appropriate field 7. Indicate the cell seeding density for each column by clicking on any well in the column, and entering the seeding density used 8. Click the Start button 9. Choose a directory to save the file in, choose a file name, if necessary, and click OK 10. Place the cartridge and calibration plate with loaded injection ports on the sliding tray 11. Click Continue to start calibration 12. When prompted, replace the calibration (utility) plate with the cell plate 13. Click OK, then Continue 14. The Optimization Assay will now run on the XF Analyzer 15. When the run is over, follow the prompts in the software and remove the cartridge and cell plate and discard XF Glycolysis Stress Test Kit User Manual (XF96) 11 Data Analysis and Interpretation The XF Glycolysis Stress Test software output automatically graphs and analyzes the data from the optimization run, and offers a recommendation as to the cell seeding density required to achieve a minimum level of ECAR. Cell Seeding Density Titration 140 120 100 Extracellular ECAR 80 60 40 20 0 0 20,000 40,000 60,000 80,000 Cell Seeding Density / Well Figure 4. Cell Number Titration Optimization Graph prepared on XF24 Analyzer In Figure 4 cells were seeded at intervals of 10,000 cells/well in a 24-well microplate on an XF24 Analyzer. In this case, the seeding density recommended by the software is 20,000 cells/well. While a particular seeding density may meet the technical requirements of the assay, these requirements should be balanced against biological factors. Observe the cell plate under a microscope before and after the experiment to assess both seeding uniformity and cell morphology. Cells which are overly sparse or crowded in the well may exhibit altered metabolic behavior, producing a higher degree of variation between wells. The optimal cell seeding density should be determined based on the following criteria: 1. Minimum ECAR of 20mpH/min 2. Seeding density falls within the linear portion of the graph 3. Visual confirmation of appropriate cell morphology and seeding. NOTE: As the actual number of cells present in the well will affect the rate of glycolysis observed, it is strongly recommended to maintain a consistent number of hours between cell seeding and running the XF assay to minimize variation between experiments. XF Glycolysis Stress Test Kit User Manual (XF96) 12 Oligomycin Titration The optimal concentration of Oligomycin can vary significantly between different cell types, culturing conditions, and experimental treatments. Therefore, the optimal Oligomycin concentration should be determined on any new cell type before running the XF Glycolysis Stress Test. The Oligomycin Titration should be performed using the optimal cell seeding density, as determined in the Cell Number Titration experiment on page 9. Prior to the Day of Assay Cell Seeding Seed cells ~24 hours prior to the assay in an XF cell culture microplate and place in a 37oC incubator with the desired level of CO2. NOTE: As the actual number of cells present in the well will affect the rate of glycolysis observed, it is strongly recommended to maintain a consistent number of hours between cell seeding and running the XF assay to reduce variation between experiments. For experiments on non-adherent cells, seeding can be performed immediately prior to the experiment. Contact Seahorse Bioscience Support for more details. Hydrating the XF Sensor Cartridge The XF Sensor Cartridge must be hydrated prior to the assay: • Add 200µl of Seahorse Bioscience Calibrant to each well of an XF Utility Plate. • Place the XF Sensor Cartridge on top of the utility plate, and place in a 37oC incubator without CO2 for a minimum of 12 hours. Day of Assay Preparation of Glycolysis Stress Test Optimization Medium Prepare the Glycolysis Stress Test Optimization Medium from the Base Medium, as described on page 8. Perform the Medium Exchange NOTE: Medium exchange described here produces a >1000-fold fold dilution of the original culture medium. This is the minimum recommended dilution to minimize effects on the assay from residual buffer capacity of growth medium. 1. Add 225uL Stress Test Glycolysis Optimization Medium, pre-warmed to 37oC 2. Remove all but 25µl of the culture medium from each well. 3. Rinse cells two times with 300μl of Glycolysis Optimization Medium, pre-warmed to 37oC. 4. Add 200μl to each well for a final volume of 225μl/well. 5. Place the plate in a 37°C incubator without CO2 for one hour prior to the assay. NOTE: The Seahorse XF Prep Station is recommended to ensure accurate final volumes during media exchanges. XF Glycolysis Stress Test Kit User Manual (XF96) 13 Prepare Oligomycin Titrations for Injection Allow vial of DMSO and one aliquot of Oligomycin (5mM) to thaw at room temperature. Label and refreeze the Oligomycin aliquot within 1 hour of thaw for subsequent experiments (do not discard). More than one additional freeze/thaw cycle is not recommended. Prepare dilutions from oligomycin stock vial according to the diagram below: Figure 5: Oligomycin Serial Dilution Series NOTE: 5.0µM and 2.5µM aliquots are prepared directly from oligomycin stock vial in DMEM. Other aliquots are prepared via a 2-step dilution first in DMSO followed by DMEM. The concentration of DMSO after injection into the assay is 0.05% (0.1% in 5 μM). Add 25μl of the resulting solution to injection port A of the appropriate wells, following the plate layout shown at right. NOTE: Injection ports of background wells should be loaded with the highest concentration of Oligomycin; however, no cells should be seeded in these wells. Once the injection ports are loaded, gently place cartridge in a CO2-free incubator at 37°C until ready to begin the assay. XF Glycolysis Stress Test Kit User Manual (XF96) 14 Running the Assay with the XF Glycolysis Stress Test Software App 1. Open the XF software 2. In the Seahorse Apps drop-down menu, choose XF Glycolysis Kit 3. Click the Start App button 4. Click the Run Optimization Plate button 5. Select Oligo Titration from the drop down menu 6. Enter the Cell Line Name in the appropriate field 7. Enter the cell seeding number in the appropriate field NOTE: If desired, the range of Oligomycin concentrations may be adjusted. In this case, the serial dilution volumes must also be adjusted accordingly. 8. Click the Start button 9. Choose a directory to save the file in, choose a file name, if necessary, and click OK 10. Place the cartridge and calibration plate with loaded injection ports on the sliding tray 11. Click Continue to start calibration 12. When prompted, replace the calibration (utility) plate with the cell plate 13. Click Ok, then Continue 14. The Optimization Assay will now run on the XF Analyzer 15. When the run is over, follow the prompts in the software and remove the cartridge and cell plate and discard XF Glycolysis Stress Test Kit User Manual (XF96) 15 Data Analysis and Interpretation The XF Glycolysis Stress Test software output automatically graphs and analyzes the data from the optimization run, and offers a recommendation as to the optimal Oligomycin concentration to use in the XF Glycolysis Stress Test. Oligomycin Titration - OCR (Rate 4) Oligomycin Titration - ECAR (Rate 7) 120 45 40 100 35 80 30 Extracellular ECAR Oxygen OCR (% 25 60 40 20 20 15 10 5 0 0 0.00 0.13 0.25 0.50 1.00 0.00 2.50 0.13 0.25 0.50 1.00 2.50 Oligomycin Concentration (µM) Oligomycin Concentration (µM) Figure 6: Oligomycin Titration Optimization Result Graphs prepared on an XF24 Analyzer In Figure 6 the XF Glycolysis Stress Test software would recommend a concentration of 0.5 µM. This example titration assay was conducted in a 24-well microplate on an XF24 Analyzer. The optimal Oligomycin concentration should be determined based on the following criteria: 1. Maximum inhibition of OCR (as shown by the plateau in the dose response curve) 2. Maximum ECAR < 90mpH/min If the maximum ECAR value exceeds 90mpH/min, a lower cell seeding density should be selected, and the Oligomycin Titration should be repeated at this cell seeding density. NOTE: As the actual number of cells present in the well will affect the rate of glycolysis observed, it is strongly recommended to maintain a consistent number of hours between cell seeding and running the XF assay to minimize variation between experiments. XF Glycolysis Stress Test Kit User Manual (XF96) 16 IV. Running the XF Glycolysis Stress Test Prior to the Day of Assay Cell Seeding Seed cells ~24 hours prior to the assay in an XF cell culture microplate, and place in a 37oC incubator with the desired level of CO2. NOTE: As the actual number of cells present in the well will affect the rate of glycolysis observed, it is strongly recommended to maintain a consistent number of hours between cell seeding and running the XF assay to reduce variation between experiments. NOTE: For experiments on non-adherent cells, seeding can be performed immediately prior to the experiment. Contact Seahorse Bioscience Support for more details. Hydrating the XF Sensor Cartridge The XF Sensor Cartridge must be hydrated prior to the assay: • Add 200µl of Seahorse Bioscience Calibrant to each well of an XF Utility Plate. • Place the XF Sensor Cartridge on top of the utility plate, and place in a 37oC incubator without CO2 for a minimum of 12 hours. Day of Assay y Preparation of Glycolysis Stress Test Assay Medium Prepare the Glycolysis Stress Test Assay Medium from the Base Medium, as described on page 7. Prepare Compounds for Injection Thaw DMSO and one aliquot each of glucose (2.0M), Oligomycin (5mM), and 2-DG (1M) at room temperature. 1. Add glucose (1mL) to 29mL of XF Glycolysis Stress Test Assay Medium, pre-warmed to 37oC. Adjust pH to 7.35 +/- 0.05. a. Final concentration of glucose in the assay will be 10mM XF Glycolysis Stress Test Kit User Manual (XF96) 17 2. Prepare 3mL of a 9x Oligomycin solution, based on the results of the titration performed in Section III - Optimization Assays – on page 9. See table below for easy reference. Oligomycin Dose in the Assay (µM) 9x Solution for Injection (µM) Volume of Oligomycin Stock (µl) Volume of XF Glycolysis Stress Test Assay Medium (µl) 5 45 27 2973 2.5 22.5 13.5 2987 1 9 5.4 2995 0.5 4.5 2.7 2997 0.25 2.25 1.35 2999 0.125 1.125 0.675 2999 3. Thawed 2-DG solution is ready to use a. Final concentration of 2-DG in the assay will be 100mM Load Injection Ports Add 25μl of the prepared compounds into the appropriate injection port, and place cartridge in a 37°C incubator without CO2 Port A – Glucose Port B – Oligomycin Port C – 2-DG XF Glycolysis Stress Test Kit User Manual (XF96) 18 Perform the Medium Exchange NOTE: Medium exchange described here produces a >1000-fold fold dilution of the original culture medium. This is the minimum recommended dilution to minimize effects on the assay from residual buffer capacity of growth medium. 1. Add 225uL Stress Test Glycolysis Optimization Medium, pre-warmed to 37oC 2. Remove all but 25µl of the culture medium from each well. 3. Rinse cells two times with 300μl of Stress Test Glycolysis Assay Medium, pre-warmed to 37oC. 4. Add 150μl to each well for a final volume of 175μl/well 5. Place the plate in a 37°C incubator without CO2 for one hour prior to the assay NOTE: Using the Seahorse XF Prep Station is recommended to ensure accurate final volumes during media exchanges. Running the Assay with the XF Glycolysis Stress Test Software App 1. Open the XF software 2. In the Seahorse Apps drop-down menu, choose XF Glycolysis Kit 3. Click the Start App button 4. Click the Run XF Glycolysis Stress Test button 5. Enter the information for each group in the appropriate fields, and create the plate layout. When finished, click Next. 6. The injection port layout and details are show for reference. Click Start button to begin the assay. XF Glycolysis Stress Test Kit User Manual (XF96) 19 7. Indicate the cell seeding density for each column by clicking on any well in the column, and entering the seeding density used 8. Choose a directory to save the file in, choose a file name, if necessary, and click OK 9. Place the cartridge and calibration plate with loaded injection ports on the sliding tray 10. Click Continue to start calibration 11. When prompted, replace the calibration (utility) plate with the cell plate 12. Click Ok, then Continue 13. The XF Glycolysis Stress Test will now run on the XF Analyzer 14. When the run is over, follow the prompts in the software and remove the cartridge and cell plate and discard XF Glycolysis Stress Test Kit User Manual (XF24) 20 V. Analyzing the XF Glycolysis Stress Test Data The XF Glycolysis Stress Test Software App delivers a series of automatic calculations, including the key parameters of glycolytic function – Glycolysis, Glycolytic Capacity, and Glycolytic Reserve. Upon completion of the XF Glycolysis Stress Test, a tab is present entitled “Glycolysis Stress Test Results”, in addition to the standard data outputs from an XF Assay. Click on this tab to view the calculated metrics from the experiment. Figure 7: XF Glycolysis Stress Test Summary Results Kinetic Results Figure 7 shows the average ECAR and standard deviation data obtained at each measurement point for all groups, in a graphical form. This data presentation highlights the dynamic changes within and between groups during the experiment. Data Table The numerical results from the kinetic graph are presented in tabular form to simplify data conversion/export for additional analyses. XF Glycolysis Stress Test Kit User Manual (XF24) 21 Histogram This shows the average ECAR and standard deviation data for the three key parameters of Glycolysis for all groups. In addition to these summary outputs, the XF Glycolysis Stress Test Software App also produces tabular and graphical presentations of the three key parameters of Glycolysis individually (Figure 8, below). Figure 8: XF Glycolysis Stress Test Results Individual Parameters NOTE: If changes are made in the Data Viewer tab, the assay must be re-exported using the XF Glycolysis Stress Test Software App to obtain the recalculated data output. References: Wu M, Neilson A, Swift AL, Moran R, Tamagnine J, Parslow D, Armistead S, Lemire K, Orrell J, Teich J, Chomicz S, Ferrick DA. Am J Physiol Cell Physiol; 2007 Jan 1. 292 (1):C125-136. Ibrahim-Hashim, A., et al., Free Base Lysine Increases Survival and Reduces Metastasis in Prostate Cancer Model. J Cancer Sci Ther 2011. XF Glycolysis Stress Test Kit User Manual (XF24) 22