1
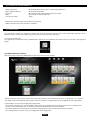
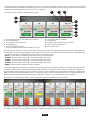
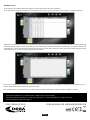
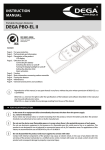
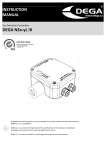
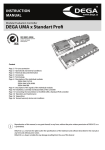
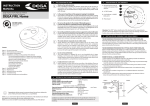
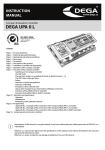
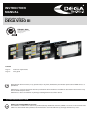
INSTRUCTION
MANUAL
Visualisation software
DEGA VISIO III
ISO 9001:2008
Quality Management Systems
Systéme de Qualité
www.sgs.com
Content
Page 2/
Page 2/
Technical requirements
User guide
Reproduction of this manual, or any part thereof, in any form, without the prior written permission of DEGA CZ s.r.o. is
prohibited.
DEGA CZ s.r.o. reserves the right to alter the specifications of the hardware and software described in this manual at any
time and without prior notice.
DEGA CZ s.r.o. bears no liable for any damage resulting from the use of this device!
FOR YOUR PROTECTION
Utilise only certified DEGA accessories
The software is certified and is technically and functionally suitable for authentic „DEGA“ accessories. In the event that the
software is utilised with other products the manufacturer shall not liable for any damages that this may cause.
TECHNICAL REQUIREMENTS
Operating System:
Other required software:
Processor:
RAM:
Free space on HDD:
Microsoft Windows XP or higher, recommended Windows 7
Microsoft Framework 4.0
Minimum 2.5 GHz, recommended dual-core 2.5GHz
At least 2GB, recommended 4 GB
20 GB
Ethernet for communication with controllers via Ethernet
USB for communication with controllers via RS485
USER GUIDE
The Dega Visio III software is designed to monitor the status of controllers and the values of the transmitters installed in them.
Monitored events are stored on disk at preset time intervals for later review and display.
Launching the application
The application is launched by using a DEGA VISIO III shortcut or in the Windows Start Menu, where it is located in the DegaVisio
group.
The DEGA VISIO III user interface
After starting the programme DEGA VISIO can open in this interface, for example:
Individual objects represent the systems that consist of controllers, the transmitters of which are displayed in the systems.
The number and the distribution of the systems and their controllers are dependent on the configuration of the programme.
Several buttons are located at the top of the programme.
- the speaker icon button is used to turn off the audio signal that is triggered in the event of an alarm or of a controller error.
- the full-screen mode button, the use of which stretches the window across the entire desktop.
- the history button for switching to the interface for viewing stored events and the values of the transmitters
- the settings button is used to access the configuration of the programme.
PAGE 2
Through its activities the programme communicates with the installed controllers, which transmit the status and values of their
linked transmitters. The individual systems display as many as the first 4 transmitters. In the event of an alarm displayed in the first
position are the transmitters that are in an alarm or an error status.
3
The diagram shows a detailed definition of one system:
4
5
2
6
1
7
8
9
10
1
2
3
4
5
- The number of receivers connected to the controller
- The area monitored
- The communication failure icon
- The flooding icon
- The current temperature icon
(in the case of the connection of the DEGA Tc II sensor)
6 - The location of the transmitter
7 - Gas detected
8 - A graphic representation of concentration
9 - The concentration detected
10 - The current status
The individual transmitters are represented by white rectangles. From the top position downwards the position of the transmitter
in the diagram, the gas detected, the graphic indicator of its concentration, the value of the concentration and, at the bottom, the
status of the transmitter, are displayed. Transmitter can be in one of these states:
- Ready - the transmitter is functioning and is not detecting any dangerous gas
- ALARM 1 - the transmitter is detecting a concentration higher than level 1
- ALARM 2 - the transmitter is detecting a concentration higher than level 2
- ALARM 3 - the transmitter is detecting a concentration higher than level 3
- ALARM 4 - the transmitter is detecting a concentration higher than level 4
- ERROR – a failure of the transmitters or of the controller.
In the upper right-hand corner there is a space for the icons that show the status of the controllers. If any of the controllers provide
information concerning the ambient temperature, the highest of these temperatures will be displayed. Further to the left there is a
space for displaying the status or the error icons of the controllers, which could indicate a failure of the thermometer, a failure of the
flood sensor, the activation of the flood sensor or a communication failure. If the communications error icon is displayed this means
that the detection system is functional, but that the visualisation computer is not connected to a specific controller.
Clicking on the system displays a window containing detailed information about the specific controller:
The figure in the example is showing that the detection system is composed of two UPAII controllers, each of which has four
transmitters. The status and values of the transmitters are displayed, together with the alarm levels for which they are set.
PAGE 3
HISTORY window
In this mode, it is possible to browse through the event history of the individual controllers.
In the left column, using the checkboxes, it is possible to select which specific controllers and transmitters should be displayed.
Additionally, it is possible to choose the time period for which the observation of a specific transmitter/controller is required. By using
the display button a graph is presented showing a record of the measurements stored to the disk during a pre-set time interval and
utilised for the accurate determination of the observed events. The view of the event log can be switched to a table view by using the
“Table” button or to an alarm view by using the “Alarms” button.
To be easily distinguished the individual sensors are shown in different colours. By setting the appropriate time intervals, we can
observe the behaviour of the detection system over time.
The recorded values can be saved in the *.csv format (e.g. for import to Excel) or as TXT files using the „Export…“ button.
Manufacturer: DEGA CZ s.r.o., K Žižkovu 640/9, 190 00 Prague 9, Czech Republic
Tax ID: CZ 279 029 43, Company ID: 279 02 943; Telephone (cz) : +420 774 447 660-5, Fax: +420 227 203 512
E-mail: [email protected] , Web: www.dega.cz
© 2012 DEGA CZ S.R.O.
USER MANUAL VER.: 05DEGAVISIOIII201210
PAGE 4