1
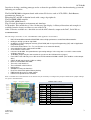
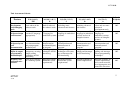
16-7210-00
Assignment - Development of a data capture and logging system to measure
shock/acceleration in athletes.
Individual assignment with 40 % weighting
Deadlines :Report – TBA
Demonstrations –
To take place in your normal laboratory period of the week commencing TBA
Objective Development of a data capture and logging system to measure shock/acceleration in athletes using the
MCB2300 development boards and associated peripheral boards.
The Basic System
Runners exert large shock forces (acceleration deceleration/g-forces) on specific bones such as the tibia
(shin bone) on every stride/impact with the ground. Repeated shock above specific thresholds can lead to
permanent injury and often goes unnoticed by the athlete until the damage has already been inflicted.
A preventative system is therefore required to monitor, log and alert the athlete if levels of shock above the
safe thresholds are experienced. The shock force on the will be measured using a single axis accelerometer
(ADXL78) which produces a voltage output proportional to the g value.
The output from the sensor driver electronics is an analogue signal in the range of 0 to +3.3 volts which
corresponds to a measured value of ±35g. To simulate the sensor output the potentiometer on the Keil
boards produces a voltage in the range 0 to approx. +3.3 volts, which is input to the microcontroller through
an analogue to digital converter (ADC). The ADC of the NXP LPC2368 is a 10-bit ADC producing 1024
possible digital values in the range 0 to 1023.
Your program should read the ADC at periodic time intervals (using a hardware Timer) and convert the
digital value into its equivalent acceleration in g using the information provided above. The measured
acceleration level should be continuously displayed on the LCD as a numerical value and as a moving bar
graph (see figure below as an example). You may be required to make your own LCD characters to achieve
a reasonable resolution of the bar graph display. Note: You may wish to use a Real Time Operating System
(RTOS) for the final implementation of the shock sensor system and therefore should consider your overall
approach and structure your code accordingly.
s h o c k
=
2 2 . 5 g
||||||||||||||||||||||||||||||||||||||||||||||||||||||||||||||
Basic Features (40-50%)
1. Risk of damage is significant if the g-force peaks above 12g. If the sensor reads three or more
samples with a level above 12g within a consecutive 5 second period the LED's should flash,
warning of possible of injury. You should choose a suitable sampling frequency for the application.
A Holloway
March 2012
V1.0
1
16-7210-00
2. Store the sampled data over a set period of time and or number of samples into an array for analysis
at a later time. At the end of the set time period or end sample number the values should be output to
the UART for display on a PC.
Note: A working solution incorporating features 1& 2 will achieve a pass (40 - 50%)
Additional Features (50-70%)
3. Implement a system to measure the cadence (steps per minute) of the athlete.
4. If the data is stored in an array located RAM memory (default option when arrays are created) the
logged data will be lost when power is removed from the chip. Store the data in non volatile memory
such as the internal flash or an external EEPROM connected to the microcontroller using the I2C or
SPI bus. (Ask the lecturer for more information on the external peripherals which may be accessed
through the I2C or SPI bus).
5. Increase the resolution of the system by using one of the external high resolution ADC's available on
the I2C and SPI peripheral boards.
6. Add user configurable parameters such as setting the sample period, number of samples to be taken
or changing the g-force warning levels. These could be set using HyperTerminal and the serial
UART connection of the MCB2300.
7. Implement an instantaneous increase but gradual decay of the bar graph on LCD.
8. Use the Real Time Clock (RTC) to timestamp the logged data.
9. Use the DAC and connected speaker to emit a 1 kHz test tone if the INT0 button is held down for
more than 3 seconds.
Advanced Features (70 %+)
10. Store the logged data to the SD card for analysis on a PC.
11. Use the CAN bus to connect multiple senor nodes.
12. Use of the RL ARM Real Time Operating System (RTOS) to coordinate the operation/flow of your
program. This may require you to form a new overall approach to the problem and restructure your
code.
13. Add USB functionality to your system replacing the data transfer of the UART.
14. Add your own innovative features!
Notes: The measurement of elapsed time must make use of one of the timers of the LPC2368 and must use
the timer to generate periodic interrupts. By counting the interrupts the passing of time can be measured. For
example if a timer was initialised to generate an interrupt every 100ms and at every interrupt a variable was
incremented, then when the variable reached 10 this would indicated that one second had passed.
A Holloway
March 2012
V1.0
2
16-7210-00
In order to develop a working prototype and to evaluate the possibilities of the shock monitoring system the
following are available:The Keil MCB2300 development board with various I/O devices such as LCD, LED’s, Push Buttons,
potentiometer, Buzzer etc.
Microchip I2C and SPI evaluation boards with a range of peripherals.
The Keil MDK ARM compiler
The Keil RL ARM libraries
The uVision3 Development environment and simulator
LCD module. This module has a 2 line 16 character /line display. A library of functions and examples is
available from the lecturer to allow easy use of the LCD.
Other C libraries available are:- functions to read the ADC channels, output to the DAC, Serial I/O etc.
Useful Information.
The following is a brief list of some of the LPC2368 & I/O Application board features:
•
•
•
•
•
•
•
•
•
•
•
•
•
•
•
•
•
•
NXP LPC2368 Microcontroller ARM7TDMI-S based high-performance 32-bit RISC Microcontroller
58 Kbytes of high-speed on-chip RAM
512KBytes of external program memory (Flash ROM) with In-System Programming (ISP) and In-Application
Programming (IAP)
Four 32-bit counter/timers T0 – T3 (see LPC23xx user manual for details)
Several digital I/O ports connected to 8 LED’s
A 16 character x 2 line LCD
6 channel 10-bit ADC. One potentiometer generating voltages in the range 0 to +3.3 volts is connected to
analogue channel 0.
10-bit DAC (Output may be connected to the speaker on the Keil board via a jumper).
Four UARTs with 2 directly accessible on the Keil demo board COM0 & COM1 (This could be used to output
data.)
CAN 2.0B with two channels (CAN1 & CAN2)
Ethernet 10/100 MAC with DMA
Three I2C serial interfaces
Three SPI/SSP serial interfaces
I2S interface
SD/MMC memory-card interface
Real Time Clock with optional battery backup
PWM unit for three-phase motor control
USB 2.0 Full Speed Device Controller
Note: To enable some of the features on the board it may be necessary to configure the jumpers. Details of the jumper settings
are given in the table below.
MCB2300 Jumper settings
A Holloway
March 2012
V1.0
J1 - USB (D-)
ON
Connects USB Line D- to the USB connector.
J2 - USB (D+)
ON
Connects USB Line D+ to the USB connector.
J3 - AOUT
ON
Connects AOUT via LF amplifier to the loudspeaker.
J4 -
--
Not used
J5 - UMODE
ON
Allows soft-connect of the USB device by issuing a software
restart via P0.14
J6 - AD0.0
ON
Connects POT1 potentiometer to AIN0 for analog input
demonstration.
J8 - INT0
ON
Enable INT0 Push Button.
J9 - RST
ON
Enables Reset via COM0.
J10 - ISP
OFF
J11 - LED
ON
Enables Port2.0 - Port2.7 LEDs.
J13 - ETM
ON
Enables the Embedded Trace Macrocell (so that the USB softconnect and the LED's can be used)
Disables In-System Programming via COM0.
3
16-7210-00
Assessment method
1.
2.
3.
4.
5.
6.
7.
8.
You must attend laboratory sessions in order that your progress can be monitored at each stage of the design. Attendance
will be monitored!
You will be asked to show program design and program code and where possible demonstrate partial solutions.
Your design should be documented and any ‘C’ code you write should be well structured and conform to a standard
layout with appropriate use of comments.
Note: if you do not attend laboratories and suddenly turn up at the end with a working program you will not be credited
with the work. The various stages of development must be monitored.
All students must submit a report and program listing with their name and student ID on both!
The Report - Produce a short report (typically about four sides of A4) containing an outline of the hardware components
and configuration of your shock sensor system, the software design and a brief description of the operation of the smart
meter. The complete ‘C’ listing of your program should be added to the report as an appendix (exclude any software
routines provided by the lecturer).
The report must clearly show how the values for your timing have been derived. This should indicate the timer used, the
prescaler value and the timer period. The report should briefly discuss the use of interrupts in your program; the interrupt
vector used by your timer and the priority level.
Demonstration – The submitted program must be demonstrated to the lecturer. During the demonstration you will be
questioned about the operation of your implementation. Demonstrations will typically be during the laboratory session of
the final week. No demonstration…No marks!
You will be asked to give detailed explanation of your code during the demonstration. If you are unable to answer
fundamental questions on sections of your own code they will not be counted in the assessment process.
A Holloway
March 2012
V1.0
4
16-7210-00
Unit Assessment Criteria:
Feature
Use of software
development
and debugging
tools
Report:
Program design
and structure
Report:
Program layout
and
documentation
Report:
Input & output
programming
methodologies.
Working state
and innovative
features.
A Holloway
March 2012
V1.0
Fail (0-39%)
F/E
Unable to use the
basic subset of the
software tools.
3rd (40%-49%)
D
Able to use a
limited subset of
the software tools.
2(ii) (50%-59%)
C
Use software tools
including some
advanced tool features
2(i) (60%-69%)
B
Use of software tools
including advanced
tool features
Unable to use
standard C language
appropriately.
Satisfactory use of Competent use of C
C language in
language in embedded
embedded systems systems.
Competent use of C
language in embedded
systems and use of
compiler features
Little or no useful
user documentation
and poor program
format/layout.
Little or no
competence at using
simple polling
techniques for I/O
interfacing
Little or no evidence
of a working system.
Adequate
documentation
and format/layout
of program.
Use of appropriate
techniques for I/O
interfacing
Appropriate
documentation and
format/layout of
program.
Use of polling
techniques with some
use of interrupts for
I/O interfacing
Detailed
documentation and
format/layout of
program.
Competent use of
polling and interrupts
for I/O interfacing
Program performs
minimum system
requirements.
Program performs
most of the system
requirements.
Program performs all
system requirements.
1st (70+%)
A
Able to discriminate,
select and use more
advanced
development tools.
Competent use of C
language in
embedded systems
and use of compiler
features
Professional
documentation and
format/layout of
program.
Innovative use of
polling and interrupt
driven programming
techniques.
Program performs all
system requirements
and system extended
in an appropriate and
innovative direction.
Indicative
Weighting
10%
10%
10%
10%
60%
5