1
TECDIS USER MANUAL
VER 3.23
ENGLISH
This blank page is automatically inserted where appropriate to ensure that
new Chapters begin on a recto page.
Table of contents
Introduction
17
Navigating the user manual
17
Textboxes
17
Help and support
18
Reservations
19
Compliance with Current Standards
20
Version 4.7.1 and higher:
20
Version 4.6.0 to 4.7.0:
20
Chapter 1:TECDIS at a glance
21
1.1:The ECDIS system
23
1.2:Charts at a glance
25
1.2.1:About Chart Databases and Simplified ENC Distribution
1.3:Positions / Chart Datum
Chapter 2:The basics
2.1:Keyboard and trackball/mouse
26
27
29
31
2.1.1:Trackball/mouse
31
2.1.2:Keyboard
31
2.1.3:Other peripherals
33
2.2:Navigating menus and tools
34
2.2.1:Chart panning
34
2.2.2:Zooming in the chart
34
2.2.3:Set chart center
34
2.2.4:Activating functions/tools
34
2.2.5:Dropdown menus
35
2.2.6:Popup windows
35
2.3:The TECDIS screen
36
2.3.1:Parts of the screen
36
2.3.2:Own vessel position
37
2.3.3:Screen light setting: Day - dusk - night
38
2.3.4:The information panel
39
2.3.5:The main toolbar
40
Chapter 3:The chart view
41
3.1:Moving around in the chart
43
3.1.1:Chart panning
43
3.1.2:Set chart center - visually
43
3.1.3:Set chart center - enter position
43
3.2:Automatic Chart Centering
45
3.3:Chart scale
46
3.3.1:Chart zooming - automatic scaling
46
3.3.2:Chart zooming with manual scaling
47
3.3.3:Automatic zooming during route sailing
47
3.3.4:Zooming without changing chart scale
47
3.3.5:NB! Overscale and underscale
48
3.4:Chart symbols - IHO Presentation library
49
3.5:Chart presentation
50
3.5.1:Standard presentation mode (STD)
50
3.5.2:User defined presentation mode (USER)
50
3.5.3:Full hazards display
51
3.5.3.1:Full safe hazards on anti grounding alarms
51
3.5.3.2:Danger symbol
52
3.6:Chart symbols - own objects
53
3.6.1:MOB symbol / eventmarker
53
3.6.2:Opening the symbol menu
53
3.6.2.1:Selecting and displaying objects (symbol, line and area)
54
3.6.3:Add new, modify or delete symbol (objects)
55
3.6.4:Add new, modify or delete custom lines / areas
57
3.7:Chart orientation
59
Chapter 4:Navigation
60
4.1:Route planning
63
4.1.1:An introduction
63
4.1.2:Starting the route planning tool
64
4.1.3:Draw a route directly in the charts
65
4.1.3.1:How to change the chart view during route drawing
66
4.1.3.2:How to separate a new route from existing routes in the chart view.
66
4.1.3.3:Route check
67
4.1.4:Activating the selected route
68
4.1.5:Automatic route generation with Jeppesen C-Routes
69
4.1.5.1:About C-Routes
69
4.1.5.2:Start C-Routes
70
4.1.5.3:Route name
70
4.1.5.4:Enter a new stop for the voyage
70
4.1.5.5:Port-of-call list
70
4.1.5.6:Restrictions - add and delete
71
4.1.5.7:Restrictions - options
72
4.1.5.8:Create Port-of-call list with the on-screen keyboard
73
4.1.5.9:Create the route
73
4.1.6:Search and Rescue - SAR
4.1.6.1:Special conditions for the QRS pattern type
4.1.7:Primary and secondary routes
4.1.7.1:Transfer of primary and secondary routes to another TECDIS unit.
4.1.8:Route organizer
73
74
75
75
75
4.1.8.1:Route selector and route search
76
4.1.8.2:Exporting routes
77
4.1.8.3:Importing routes
77
4.1.9:Delete selected route
77
4.1.10:Voyage planner
79
4.1.10.1:Changing values in the waypoint list - Default values
80
4.1.10.2:Changing values in the waypoint list - single waypoint
80
4.1.10.3:Edit waypoint/route information
80
4.1.10.4:ETA - calculation during route planning
81
4.1.11:Saving and exporting a route list
82
4.1.12:Extending a route
82
4.1.13:Modify waypoints directly in the charts
83
4.1.14:Merge routes
84
4.1.14.1:Save the new merged route
84
4.1.15:Copy selected route
85
4.1.16:Great circle route
85
4.1.17:Add index lines
86
4.1.17.1:Change index line length
87
4.1.17.2:Deleting and restoring index lines
87
4.1.18:Display sight lines
4.2:Route navigation
87
88
4.2.1:Navigation information
88
4.2.2:Larger CTS values
90
4.2.3:Route name text field
90
4.2.4:Calculation of the voyage duration
90
4.2.5:Primary and secondary routes
91
4.2.6:Notify Waypoint / Critical Point on the voyage
91
4.2.7:Hazards and alerts on a route
92
4.3:EBL/VRM Bearing
94
4.3.1:Bearing functions
94
4.3.2:General about EBL / VRM operation
94
4.3.3:Temporary/quick route - route with route monitoring in three clicks.
95
4.3.4:Storage and export of Bearing Position and of Line Of Position (LOP )
96
4.4:Anti grounding
98
4.5:Notifications and alarms
99
4.5.1:Confirm alarms and warnings
100
4.5.2:Alarm list
101
4.5.3:Alarm texts
102
4.5.4:Warning text
104
4.5.5:Text messages
106
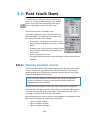
4.6:Past track lines
107
4.6.1:Primary position source
107
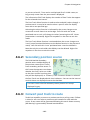
4.6.2:Secondary position source
108
4.6.3:Convert past track to route
108
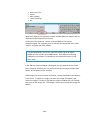
4.6.4:Show and Hide buttons
109
4.7:Maritime calculations
4.7.1:Calculate
110
110
4.7.1.1:Setting calculating position to chart center
110
4.7.1.2:Set a great circle route
110
4.7.1.3:Calculation of time
111
4.7.1.4:Datum
111
4.7.2:Lines of Position (LOP)
112
4.7.2.1:Register observations
112
4.7.2.2:Features of the LOP tab
113
Chapter 5:Other functions
5.1:Query cursor
115
117
5.1.1:The chart inspector window
117
5.1.2:Inspecting past tracks, routes, own symbols, etc.
117
5.2:Conning and anchor-watch
119
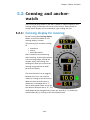
5.2.1:Conning display for mooring
119
5.2.2:Conning Anchorguard
120
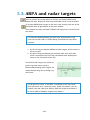
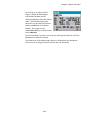
5.3:ARPA and radar targets
122
5.4:AIS - operation
124
5.4.1:Displaying AIS information from other vessels
124
5.4.2:Displaying AIS information from own vessel
126
5.4.3:AIS Broadcast messages
127
5.4.4:AIS direct messaging to selected vessel
127
5.4.5:AIS target list
128
5.4.5.1:Static mode
128
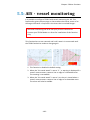
5.5:AIS - vessel monitoring
129
5.6:Tidal information
130
5.6.1:Tides
130
5.6.2:Tidal current
131
5.6.3:Tidal forecast points for ebb and flow
131
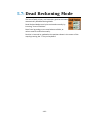
5.7:Dead Reckoning Mode
132
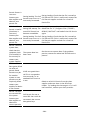
5.8:NAVTEX
133
5.8.1:Message types
133
5.8.2:Radio channels
134
5.8.3:Older messages
134
5.8.4:Show messages
134
Chapter 6:Chart installation and maintenance
6.1:Installing chart databases
135
137
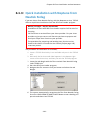
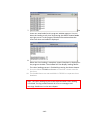
6.1.1:Quick installation with Jeppesen SENC charts
137
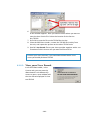
6.1.2:Quick installation with Navtor Navstick
139
6.1.3:Quick installation with Neptune from Nautisk Forlag
141
6.1.4:Create the User Permit file
143
6.1.4.1:View your User Permit
144
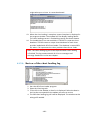
6.1.5:Standard chart installation with S63 Chart Loader
145
6.1.5.1:Adding Cell Permits
145
6.1.5.2:Deleting Cell Permits
147
6.1.5.3:Adding S63 charts
147
6.1.5.4:Review of the chart loading log
150
6.1.5.5:Considering authenticity information
151
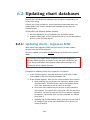
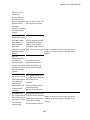
6.2:Updating chart databases
154
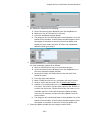
6.2.1:Updating charts - Jeppesen SENC
154
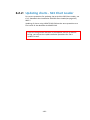
6.2.2:Updating charts - S63 Chart Loader
156
6.3:Chart corrections
157
6.3.1:T&P for charts from Jeppesen
158
6.3.2:AIO for AVCS charts
159
6.3.2.1:Loading AIO
159
6.3.2.2:Remove AIO notices
159
6.3.2.3:AIO: types and display
160
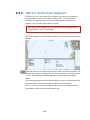
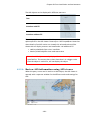
6.3.2.4:Review AIO information using AIO viewer
161
AIO object list
162
Query chart
162
Detailed view
162
AIO Status
162
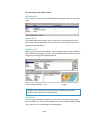
6.3.2.5:AIO Options panel
163
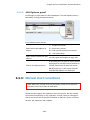
6.3.3:Manual chart corrections
163
6.3.3.1:Display of manual chart corrections in the chart view
164
6.3.3.2:Enter manual chart corrections
165
6.3.3.3:Change the correction
166
6.3.3.4:Delete chart corrections
167
6.3.4:Update log
168
6.4:Delete chart databases
170
6.5:Chart Licenses
171
6.5.1:View your chart licenses in the TECDIS program.
171
6.5.2:Chart licenses - Jeppesen SENC
172
6.5.2.1:Adding a chart license
172
6.5.2.2:Administrating the chart licenses
173
6.5.3:Certificate for chart providers
173
6.5.4:Dynamic Licensing
176
6.5.4.1:Credit Limit
176
6.5.4.2:Automatic Licensing
176
6.5.4.3:Reporting user
176
6.5.4.4:Billing
177
6.5.4.5:Use of Dynamic Licensing in TECDIS
177
6.5.4.6:Adjustment for automatic ENC licensing
177
6.5.4.7:Route Planning using ENC diagrams
178
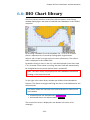
6.6:IHO Chart library
179
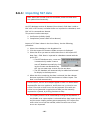
6.6.1:Importing S57 data
180
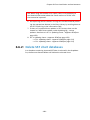
6.6.2:Delete S57 chart databases
181
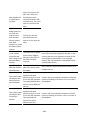
Chapter 7:System settings
7.1:Settings menu
182
185
7.2:The Setup menu
186
7.2.1:Ship draught
186
7.2.2:Language
187
7.2.3:Time zone adjustment
187
7.2.4:NMEA input status
187
7.2.5:Navigation position offset
188
7.2.6:Chart utilities
188
7.2.6.1:INT-1 Dictionary
189
7.2.6.2:Radar overlay setup
189
7.2.7:Installed Charts on the computer
190
7.2.8:Alarm volume
190
7.2.9:Auxilary
191
7.2.9.1:F1 and F2 key settings
7.3:The Chart menu
191
193
7.3.1:Chart information
193
7.3.2:Selectable layers
194
7.3.3:Chart presentation
194
7.3.4:Overview of available chart information
195
7.3.5:Chart data information
196
7.4:The Ship menu
197
7.4.1:Ship symbol offcenter
197
7.4.2:Auto sensitivity
197
7.4.3:Viewing the double circle
197
7.4.4:View vessel contour
197
7.4.5:Course vector
197
7.4.6:ROT curved
197
7.4.7:Auto route activation
197
7.4.8:Wheelover
198
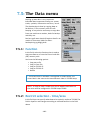
7.5:The Data menu
199
7.5.1:Function
199
7.5.2:Restrict selection - time/area
199
7.5.3:Restrict selection - data type
200
7.5.4:Execute
200
7.5.5:Importing primary and secondary routes
200
7.5.6:Route synchronisation
200
7.5.6.1:Manual route synchronisation
201
7.5.6.2:Automatic route synchronisation
201
Activate automatic replication
201
Disable Automatic Route Replication
202
7.6:The Log menu
203
7.6.1:Log text
203
7.6.2:Visual Replay
204
7.6.3:AIS ship data
205
7.6.4:Delete Old Log Data
205
7.6.5:Screenshots
205
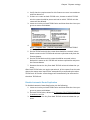
7.7:The Safe menu
206
7.7.1:Safe, Deep and Shallow
206
7.7.2:Check time and angle (anti grounding parameters)
207
7.7.3:Auto Safe Hazard display setting
208
7.7.4:Camera control (formerly FLIR)
208
7.7.5:Alarm
209
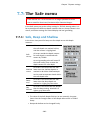
7.8:The AIS menu
210
7.8.1:Display filter
210
7.8.2:Lost active targets
210
7.8.3:Danger CPA all Targets
211
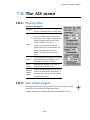
7.9:Monitor calibration
212
7.9.1:Controlling the monitor contrast
212
7.9.2:Check the colours
213
Appendix A:TECDIS Setup
215
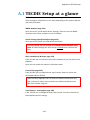
A.1TECDIS Setup at a glance
217
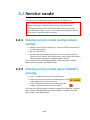
A.2Service mode
218
A.2.1Entering service mode during system startup
218
A.2.2Entering service mode when TECDIS is running.
A.3NMEA Data
A.3.1NMEA Input
218
219
219
A.3.1.1:Info text
220
A.3.1.2:NMEA sentence
220
A.3.1.3:Input port
221
IP ports
221
A.3.1.4:The Baud/TPA field
221
A.3.1.5:Serial port activity
222
A.3.1.6:Received data on selected port
222
A.3.1.7:Other COM port connections
222
A.3.1.8:COM-port for Monitor ctrl
223
A.3.1.9:COM-port for Alarm ctrl
223
A.3.1.10:COM-port for Furuno Keyboard (RCU-018)
223
A.3.1.11:COM-port for CAM control
223
A.3.2NMEA Output
A.3.2.1:Enabling IP server
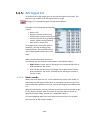
A.3.3Supported NMEA sentences
A.4Vessel settings (Specification)
224
224
225
227
A.4.1More about restoring saved default values
230
A.4.2More about T-setup/TSZ files
231
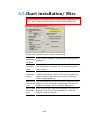
A.5Chart installation/ Misc
A.5.1More about Monitor Calibration
A.6Licences
A.6.1System licenses (TELcahrt License)
A.6.1.1:Activating add-ons
A.6.2Jeppesen licenses (C-Map License)
232
233
235
235
236
236
A.6.2.1:Add license manually
236
A.6.2.2:Get Expired licenses
237
A.6.2.3:License list
237
A.6.2.4:Add license from file
237
A.6.2.5:License orde
238
A.7Track Control - Settings
239
A.7.1The autopilot field
239
A.7.2The Startin Requirements field
240
A.7.3The Default values new route field
240
A.7.4Other settings
240
Appendix B:Optional add-ons
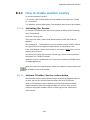
B.1Weather overlay
B.1.1How to enable weather overlay
243
246
247
7.9.2.1:Activating the license
247
B.1.1.1:Activate Weather Service subscription
247
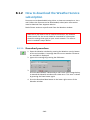
B.1.2How to download the Weather Service subscription
B.1.2.1:Download procedure
248
248
B.1.3Control of weather subscription licenses
251
B.1.4Downloading a new weather forecast
251
B.1.4.1:About weather models
251
B.1.4.2:Download Window
252
B.1.5Controlling the Weather overlay on the chart
253
B.1.5.1:Time management field
253
B.1.5.2:Display Controllers
254
B.1.6Custom Views
B.1.6.1:Ending a custom view
255
255
B.1.7Cursor info
256
B.1.8Explanations of weather data chart symbols
256
B.1.9Selection of units for wind speed, temperature, etc.
257
B.1.10Treatment of downloaded weather forecasts
258
B.1.11Alarm Settings
259
B.1.12Set the alarm settings
259
B.1.13About alarm conditions
260
B.1.14The timeline feature
261
B.2Radar overlay
264
B.2.1Radar overlay correction
264
B.2.2Radar display slider control
265
B.3Piracy Information
266
B.3.1Activation of Pirate option
266
B.3.2Turn on display
266
B.3.3Adjust the viewing of piracy data
267
Time Period
267
Incident types
267
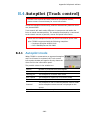
B.4Autopilot (Track control)
269
B.4.1Autopilot mode
269
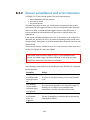
B.4.2Sensor surveillance and error tolerance
270
B.4.3TECDIS TCS operation
271
B.4.4Activating Heading Control mode
272
B.4.5Activating Track Control mode
272
B.4.6External (Remote) mode
273
B.5TECDIS keypad
274
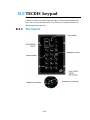
B.5.1The layout
274
B.5.2Keys
275
B.5.3Alarm functionality
277
B.5.4Navigating your TECDIS with the keypad
277
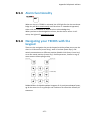
B.5.5Numeric mode
278
B.5.5.1:Alternative numerical functions
278
B.5.6User defined keys
279
B.5.7Video switching
279
B.6Furuno RCU-018
Appendix C:Frequently asked questions
281
285
C.1Why isn't my route activated?
287
C.2The quickest way to make a route - quick route
288
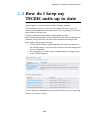
C.3How do I keep my TECDIS units up to date
289
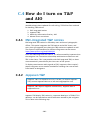
C.4How do I turn on T&P and AIO
290
C.4.1ENC-integrated T&P notices
290
C.4.2Jeppesen T&P
290
C.4.3Admiralty Information Overlay - AIO
291
C.4.4Manual chart corrections
292
C.5How do I activate Tides
293
C.6How to transfer system configuration
295
Appendix D:Troubleshooting
297
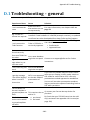
D.1Trobleshooting - general
299
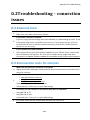
D.2Troubleshooting - connection issues
301
D.2.1General tests
301
D.2.2Connection tests for internet
301
D.2.3Connection tests for email
302
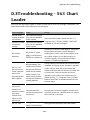
D.3Troubleshooting - S63 Chart Loader
303
D.4Troubleshooting - Weather overlay
308
D.4.1Connection errors
308
D.4.2Error messages
308
This blank page is automatically inserted where appropriate to ensure that
new Chapters begin on a recto page.
Introduction
Introduction
This user manual is intended to give you a basis for using the vessels
TECDIS-unit in accordance with good maritime navigation customs and
the governing rules and regulations.
We recomment that all users of TECDIS attend an IMO-approved ECDIS
course for use of the software. For more information about TECDIS typespecific training and ECDIS-training in general, please contact Furuno
Norway.
Navigating the user manual
The user manual is divided into:
l
l
A main section with 8 chapters explaining the different functions
and menu choices TECDIShas
4 appendixes that outline different use-scenarios, optional add-on
functionality and the TECDIS Setup software.
Textboxes
This user manual uses two textboxes for special information:
NOTE: The red box gives important information/alerts on correct
use
TIP: The blue box gives tips and advice for advanced use
- 17 -
Help and support
To find out more on how to use your TECDIS you can:
l
l
l
contact your local Furuno Norway dealer
contact Furuno Norway directly
download the latest version of the TECDIS documentation on our
(Telko AS) website: http://telko.no/site/Support/TECDIS
An overview of Furuno Norway's dealer network can be found on the
following website: http://www.furuno.no/en/index.php/forhandlere
An overview of the employees at Furuno Norway and their contact information can be found on the following website: http://www.furuno.no/en/index.php/kontakt
- 18 -
Reservations
Reservations
The TECDIS -system and its navigational aid software, including electronic
chart display and automatic navigation and track control system, is an aid
in safe maritime navigation.
All such maritime navigation aids are subject to certain inaccuracies and
deviations that, if used carelessly, can result in maritime accidents or
events, which could be followed by the loss of lives, vessels and cargo, and
by environmental damage.
Hence the navigator should not account solely on one single navigation aid
(including the TECDISsystem) for safe navigating of the vessel.
The sensible navigator will collect navigation information from several
sources, crosschecking all information for any possible flaws or deviations,
when deciding the vessel position, course, speed and planned route.
- 19 -
Compliance with Current
Standards
TECDIS comply with the following standards or other normative
documents:
Version 4.7.1 and higher:
l
l
l
l
l
Marine Equipment Directive, Module B (MED-B)
IMO Resolution MSC.232(82)
IMO Resolution MSC.191(79)
IMO Resolution MSC.74(69) Annex 2
IMO Resolution A.694(17)
Version 4.6.0 to 4.7.0:
l
l
l
l
Marine Equipment Directive, Module B (MED-B)
IMO Resolution MSC.74(69) Annex 2
IMO Resolution A.817(19) as amended by MSC.64(67) Annex 5 and
by MSC.86/70) Annex 4
IMO Resolution A.694(17)
For a current list of software versions, compliance with standards and
instructions for updating TECDIS software, to comply with new standards
and regulations, refer to the following web page:
http://www.telko.no/site/support/tecdis/compliance
- 20 -
1:
TECDIS at a glance
In this chapter you will get an insight in what electronic chart systems and ECDIS is, and what a
TECDIS system is.
In short TECDIS is a certified electronic chart- and navigationsystem;
ECDIS (Electronic Chart and Display Information System) for navigation,
voyage planning and voyage monitoring.
TECDIS is certified by the ECDIS standard as specified by IMO and the
SOLAS convention. The installation of the TECDIS system can be
configured for paperless sailing.
Flagstates and vessel classes have different requirements for backup
solutions for paperless sailing. Check the requirements for your
vessel by the flag state or vessel class before configuring your
TECDIS for paperless sailing. Vessels registrered in Norway can
contact Sjøfartsdirektoratet - the Norwegian Maritime Authority.
- 22 -
Chapter 1:TECDIS at a glance
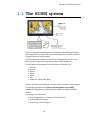
1.1: The ECDIS system
TECDIS is designed and developed in accordance with IMO specifications
and emphasizes on simple and user-friendly operations without compromising the functional requirements.
TECDIS is based on computer units that are approved for maritime use
and tailored to meet the requirements of the ECDIS standards.
TECDIS collects information from instruments and sensors for:
l
l
l
l
l
l
l
Position
course
Speed
Depth
Wind
AIS
Radar etc. (ARPA, EBL, ROT)
Position and information both for the own vessel and other vessels appear
on officially approved charts [Electronic Navigation Chart (ENC)]
Scheduled Voyage Route is displayed and checked for depth and other
hazards.
The voyage is monitored by:
l
l
l
controlling position in relation to the Route Plan
controlling safe passage
controlling collision dangers
- 23 -
TECDIS offers several advanced features, such as:
l
l
l
l
l
l
l
l
l
l
l
l
l
l
Dynamic licensing of ENC charts (pay-per-view)
Detailed weather overlay with customizable display and integration
with the voyage planner
C-routes - Automatic generation of routes between a multitude of
positions and harbours.
Powerful voyage planning tool, with both primary and secondary
routes
Automatic antigrounding system with safety contour and safe depth
settings that are both adjustable by the navigator
Tight integration with AIS and ARPA radar
Advanced sensor filters
Flexible saving of routes, tracks, symbols, objects and log-files
User friendly, customizable and feature-rich alarm system
Highly adjustable chart presentation
Custom made conning and docking modules
Automatic storage of all navigational data for playback at a later
time
Radar overlay with Furuno radars
Track Control with adaptive autopilot
- 24 -
Chapter 1:TECDIS at a glance
1.2: Charts at a glance
TECDIS is using chart data from multiple vector map databases simultaneously and seamlessly. Typically it is using CM93/3-format, provided by
Jeppesen (C-MAP) of a Professional + (World) chart as basis, as it provides
global coverage of all relevant scales.
Officially approved charts (ENC) is a requirement for ECDIS when paper
charts are not used. These charts are available in two ways; Either precompiled in the Jeppesen (C-MAP) SENC format (System ENC), or in uncompiled s57 standard format ENC which can be loaded and compiled through
the S63 Chart Loader software.
S57 og S63 charts are identical, however the S63 charts are
encrypted.
To use ECDIS as a legal substitute for paper charts, two conditions
have to be met:
1: The system must show the official ENC (Electronic Navigation
Chart), issued by a national hydrographic authority. (for Norway:
Primar)
2: These charts have to be updated regularly.
TECDIS automatically displays the best available charts. Jeppesen C-MAP
ENC (SENC) is preferred and is shown where it is available, otherwise
charts from Jeppesen C-MAP Professional+ (CM-93/3) are used.
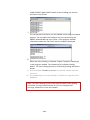
Important: The TECDIS program will from version 4.7.x.18 start even
if no chart database is installed/selected. This allows database
synchronization with TELKO Synchronizer. TECDIS is not an approved
navigation tool for paperless sailing when no chart databases are
selected or installed!
- 25 -
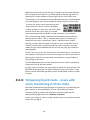
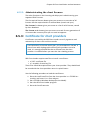
1.2.1: About Chart Databases and Simplified
ENC Distribution
ENC data (S-57 format) is not used directly in the ECDIS system. ENC files
are compiled into a seamless database [System ENC (SENC)] that contains
all the required ENCs and are optimized for operational use on board.
All charts displayed in TECDIS are saved in C-MAP SENC (System
Electronic Navigational Chart) format. The charts can either be received
in this format from the supplier, or it can be generated from other
formats such as S-63.
Vi anbefaler at man ombord på fartøy kun benytter ferdigkompilerte kart.
Kartkompilering fra ENC data i S57 format bør kun utføres i kontrollerte
omgivelser på land.
Dette er fordi kompileringen til SENC krever at S57 data må tolkes av
kompileringsprogrammet. Kompileringsprogrammet vurderer ENC-data
og avgjør om informasjonen er gyldig eller ikke, og det kan oppstå situasjoner der den vurderer innholdet til "non-compliant". Slike data bør ikke
importeres inn i TECDIS-systemet, ettersom det kan inneholde ukorrekt
informasjon og feil.
En annen fordel med å motta kartene i SENC format er at navigatøren
ombord ikke behøver å bruke tid og tålmodighet på å importere ENCer til
kartdatabasen, en prosess som krever at ENCene er 100 % "compliant".
Distribution of ENC in SENC -format has been approved under CHRIS
meeting in Athens in April 2002. A number of hydrographic organizations
(HO) admits that it facilitates access to official digital cartography, and
that it has no negative effect on compliance (accordance) with IMO.
C-MAP provides official data in SENC format in accordance with the "IHO
amendment two paragraph 3.3 of S-52" and a new "Technical Resolution
A3.11", adopted by the IHO's 16th International Hydrographic Conference.
C-MAP CM-93/3 SENC distribution system was also type approved by the
Norwegian VERITAS (DNV) in March 2003, as required by the IHO. The
distribution system includes Real Time Updating infrastructure that allows
users of this system to download chart corrections directly online.
ENC data, from states / countries that still have not approved the distribution of data in the SENC format, are distributed in the S-63 format and
converted on board.
- 26 -
Chapter 1:TECDIS at a glance
1.3: Positions / Chart Datum
The Chart Datum is a mathematical model used by the chart producer to
adapt the earth’s surface curvature.
In the TECDIS system, position reference, always use the datum with references to the "World Geodetic System 1984" (WGS84). This format is
considered the most accurate chart datum available. All charts and chart
objects in TECDIS are shown in the "World Geodetic System 1984" (WGS84) and all the inputs for position data to TECDIS (GPS) must use this
datum.
Any translation (recalculation) can easily be made with tools for
”Maritime calculations”
All sensor inputs with position references must use the WGS-84
format.
- 27 -
This blank page is automatically inserted where appropriate to ensure that
new Chapters begin on a recto page.
ter 2:
The basics
In this chapter we will give you the basics of how TECDIS is used, in the following sub-chapters:
2.1:Keyboard and trackball/mouse
31
2.1.1:Trackball/mouse
31
2.1.2:Keyboard
31
2.1.3:Other peripherals
33
2.2:Navigating menus and tools
34
2.2.1:Chart panning
34
2.2.2:Zooming in the chart
34
2.2.3:Set chart center
34
2.2.4:Activating functions/tools
34
2.2.5:Dropdown menus
35
2.2.6:Popup windows
35
2.3:The TECDIS screen
36
2.3.1:Parts of the screen
36
2.3.2:Own vessel position
37
2.3.3:Screen light setting: Day - dusk - night
38
2.3.4:The information panel
39
2.3.5:The main toolbar
40
Helptext:
If you do not already know how to use your TECDIS, enabling the
"helptext" feature is a useful tip. By moving the pointer over any
toolbutton or parameter value, the system will show an explanatory
text on a yellow base.
- 30 -
Chapter 2:The basics
2.1: Keyboard and
trackball/mouse
TECDIS can be operated with both keyboard and trackball/mouse. For
most functions you can select which peripheral to use yourself.
2.1.1: Trackball/mouse
All functions and operations can be controlled by moving the pointer
across the monitor with the trackball/maouse, and using the right and left
mouse buttons to call to action. Functions can be activated and
deactivated, and the chart can be panned and zoomed.
1. The left mouse button is used to operate primary functionality for
all tools, functions and icons. In addition you zoom inwards in the
chart with this button, centred on the point you have placed the
pointer.
2. The right mouse button is used to operate secondary functionality
for all tools, functions and icons, in addition to zooming outwards in
the chart.
3. The centre mouse button, alternatively the scroll wheel, centres the
chart at the point where the pointer is placed.
If you have a trackball with a scroll wheel as the middle button, you can
configure TECDIS to zoom by scrolling the wheel. See 7.2: The Setup menu
(see page 186).
2.1.2: Keyboard
The keyboard that is supplied with TECDIS is pre-configured with combination commands for the most important functions. In addition a digital
keyboard will appear on-screen, and this is operated by the mouse and
pointer when keyboard input is needed. The combination commands are
as follows:
F1: Info on chart functions
F2: Chart query by cursor
F3: Name search (add-on)
F4: Chart Legend
F5: Settings menu
F6: Route menu
- 31 -
F7: Mariner symbol object menu
F8: Mariner line/area object menu
F9: Timestamp past track
F10: Man over board (MOB)
F11: Own ship position fix
F12: Event mark
1. Screen day/night colours
2. Display orientation
3. STD S52 AUTO presentation
4. “USER” presentation
5. Conning display
6. Værdisplay (opsjon)
7. Radaroverlay (opsjon)
8. EBL/VRM functions
9. ARPA
0. AIS
W-A-B-C-D-E-F-G: Kartnivåer
S: simulated position and DR
Arrow keys: Move chart
Page Up: Zoom out at selected level
Page Down: Zoom in at selected level
- : Zoom out auto level
Ins: Move cursor/chart to a position
Del: S52 chart presentation + auto-positioning
Enter: Left mouse key at cursor position
/ or <: Darker screen colours
* or >: Brighter screen colours
Esc/space: Alarm off (list/sequential)
Ctrl +PrtScr: Save present screenshot
Ctrl+ Alt +Shift + T: Monitor calibration test
- 32 -
Chapter 2:The basics
2.1.3: Other peripherals
TECDIS can be equipped with alternative keyboards and trackballs.
Contact your local Furuno Norway dealer or Furuno Norway for more
information and purchase.
In addition you can expand the functionality by using custom keyboards/keypads:
TECDIS has two available custom keyboards:
l
l
The Furuno RCU-018 keyboard, with the same layout as Furunos
radar keyboards.
TECDIS Keypad, a 21-digit fast access keypad custom made for
TECDIS, that can be mounted in the TECDIS-console or on the armrest for easy access to the most important features.
More information about Furuno RCU-018 and TECDIS Keypad can be
found in appendix B.
- 33 -
2.2: Navigating menus and
tools
TECDIS has icon based tools, and all user-controlled settings are placed in
menu tabs. Below is a description of how to navigate your TECDIS.
2.2.1: Chart panning
When you move the cursor to one of the edges of the chart view, it will
change shape to a directional arrow, and by left clicking the mouse you
will move the chart view in the arrow's direction.
Alternatively you can pan the chart with the arrow keys on your keyboard.
If you move the pointer to a corner in the chart view, you will be
able to pan diagonally in the chart.
2.2.2: Zooming in the chart
To zoom into the chart, you place the pointer where you want the centrepoint of the new chart display to be, and click on the left trackball button.
To zoom out from the current chart display, click on the right trackball
button. The new chart display will centre around the point where the
mouse-pointer was.
2.2.3: Set chart center
To move a point in the chart view to the centre of the chart view, you
move the pointer to that point and click the middle mouse button.
2.2.4: Activating functions/tools
Activating tools and functions in TECDIS is done by moving the pointer to
the icon of that function/tool, and left-clicking. Ved å venstreklikke starter
du funksjonen. Some icons have secondary functionality; this functionality
is accessed by right-clicking the icon
- 34 -
Chapter 2:The basics
Both the primary and secondary function associated with an icon is
displayed in the help-text that appears when you let the pointer
hover over the icon.
Some icons are connected directly to a specific tool/function, while others
are connected to a menu for a specific tool group, such as the route tool
menu.
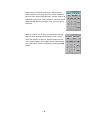
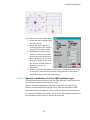
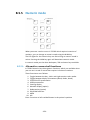
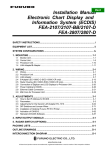
2.2.5: Dropdown menus
Dropdown menus are opened by clicking the small
arrow icon on the right side of the dropdown
menu. Choose between available values by leftclicking the desired value. Arrow keys and the
enter key on the supplied keyboard can also be
used. Use the tab key to switch between function
fields.
In dropdown menus for date selection a calendar
will appear as illustrated. Right and left arrow are
used to cycle between months. By clicking the
month name you will also be able to select the
month in a dropdown list.
To change the year, simply click on the year
displayed and select using the displayed up and dawn arrows.
Months are selected by clicking the right and left arrow or by selecting
from the dropdown list that appears when you click the name of the
month. When you click on the desired day/date, the calendar will close
and you have selected that date.
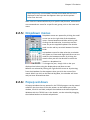
2.2.6: Popup windows
All popup windows that are opened in the TECDIS program can be moved
around in the chart view. Place the pointer on the header-part of the
window, left-click and hold, and pan the window to the desired position.
Windows with the TECDIS icon in the header, can be resized by dragging
the window borders to the desired positions.
- 35 -
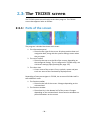
2.3: The TECDIS screen
The TECDIS system starts directly to the chart program. The TECDIS
screen that appears looks as follows:
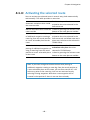
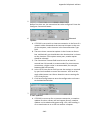
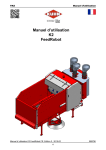
2.3.1: Parts of the screen
The program is divided into three main areas:
1. The information panel
l Placed to the right of the screen. Displays position data and
navigation data, along with the system settings menus when
they are open.
2. The main Toolbar
l Placed at the top or to the left of the screen, depending on
the configured setting. This is configured in TECDIS setup, see
A.4 Vessel settings (Specification)(see page 227)
3. The chart view
l Covers most of the screen. Chart, symbols, routes and past
track are some of the functionality displayed here.
Depending of how you navigate in TECDIS, the screen will divide itself in
two additional areas:
1. The function toolbar
l Placed to the left of the screen. Changes depending on the
activated tool.
2. The function window
l Placed mainly in the bottom half of the screen. Changes
depending on the activated tool. Some function windows are
placed elsewhere on the screen.
- 36 -
Chapter 2:The basics
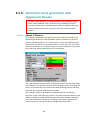
2.3.2: Own vessel position
Own vessel position is displayed graphically with the shape that is set in
the Ship menu 7.4.3: Viewing the double circle(see page 197)
Beam line & Heading line
l
l
l
l
l
l
Double circle
Ship contour
Heading line indicates the present vessel heading.
Beam line is perpendicular to the Heading line.
The Course Vector indicates the current vessel course over ground
(COG). The end point of this line shows where the vessel will be if
the appointed course it is followed - after a certain time (minutes),
specified in the Ship menu.
If Show Double Circle is selected in the Ship menu, the vessel position will be marked with a double circle.
If Show ship contour is selected in the Ship menu, the vessel's relative size compared to the chart scale will be displayed.
If both options are selected the chart system will select the best display given the current conditions.
If both the double circle and ship contour is selected, the system will
automatically select which of the two symbols to display. When the vessel
symbol becomes to small, TECDIS automatically switches to the circle
symbol; and opposite when a smaller scale is selected.
In all chart orientations except Head the charts will be static and the
vessel will move(true movement). When the chart orientation is set to
Head the vessel will have a fixed position on the screen while the charts
move (relative movment).
- 37 -
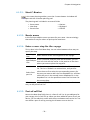
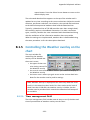
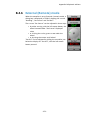
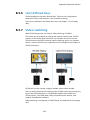
2.3.3: Screen light setting: Day - dusk - night
The colours displayed on the screen can be adjusted for different lighting
conditions. The screen light dropdown menu is found to the right of the
STOP button on the main toolbar. By pressing the text or the arrow
besides it the dropdown menu will open. Select the screen lighting option
that suits the conditions with the left mouse button.
The selected configuration will remain visible in the dropdown menu
when it is closed, for quick review of the selected mode.
For optimal lyssetting må også skjerm justeres for lys og kontrast.
Dersom skjermen er for mørk, kan dette begrense synligheten av
informasjon, spesielt ved bruk av kveld- og nattlyssettingene.
Lysstyrkekontrollen på skjermen har en markering for kalibrert
verdi. See 7.9: Monitor calibration(see page 212)for more information.
- 38 -
Chapter 2:The basics
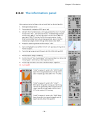
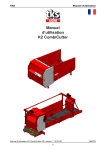
2.3.4: The information panel
- 39 -
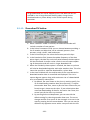
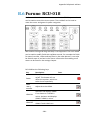
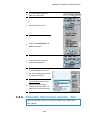
2.3.5: The main toolbar
At the top of the screen you find the main toolbar, which gives access to
main system functions. This section contains a brief description of the
different functions.
Stop TECDIS
Auto chart repositioning
Monitor colour
Query cursor
Chart orientation
EBL/VRM Bearing
STD S52 AUTO chart presentation
USER configured chart
presentation
Show ARPA targets
Show AIS targets
Conning and anchorwatch
MOB symbol / eventmarker
Weather overlay
Route planner
Radar overlay
Past Track
Video switching
Symbols
Zoom in
Maritime calculations/LOP
Chart scale
NAVTEX
Zoom out
Settings menu
Show overview chart
Chart scales:
- 40 -
r 3:
The chart view
In this chapter we will look closer at how charts are presented in TECDIS, and how you move
around in the charts.
3.1:Moving around in the chart
43
3.1.1:Chart panning
43
3.1.2:Set chart center - visually
43
3.1.3:Set chart center - enter position
43
3.2:Automatic Chart Centering
45
3.3:Chart scale
46
3.3.1:Chart zooming - automatic scaling
46
3.3.2:Chart zooming with manual scaling
47
3.3.3:Automatic zooming during route sailing
47
3.3.4:Zooming without changing chart scale
47
3.3.5:NB! Overscale and underscale
48
3.4:Chart symbols - IHO Presentation library
49
3.5:Chart presentation
50
3.5.1:Standard presentation mode (STD)
50
3.5.2:User defined presentation mode (USER)
50
3.5.3:Full hazards display
51
3.6:Chart symbols - own objects
53
3.6.1:MOB symbol / eventmarker
53
3.6.2:Opening the symbol menu
53
3.6.3:Add new, modify or delete symbol (objects)
55
3.6.4:Add new, modify or delete custom lines / areas
57
3.7:Chart orientation
- 42 -
59
Chapter 3:The chart view
3.1: Moving around in the
chart
3.1.1: Chart panning
When you move the pointer to one of the chart view edges, it will change
shape to a directional arrow. By left-clicking you will then move the chart
view in the arrows direction.
Alternatively you can pan the chart with the arrow keys on your keyboard.
If you move the pointer to a corner in the chart view, you will be
able to pan diagonally in the chart.
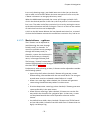
3.1.2: Set chart center - visually
To move a point in the chart view to the centre of the chart view, you
move the pointer to that point and click the middle mouse button.
3.1.3: Set chart center - enter position
The chart center can be moved to a given position by
pressing the Pos. button in the sensor field in the
information panel.
In the window that appears in the left upper side of
the display, you enter the desired position in the
fields. The Ins button on the keyboard will also open
this window.
You can enter the position in either degrees, minutes
and decimals, or in degrees, minutes and seconds. To
switch between these mode, you press the button to
the far left of the position window. To show an onscreen keyboard, press the downward pointing arrow
to the right in the window.
- 43 -
When you are finished entering the desired chart
center position, you press the Chart center button to
pan the chart view to that position, and the position is
indicated in the chart. This function is also very useful
when placing objects (symbols, lines, areas) in given
positions.
When a symbol, line or area is selected for placing,
and you have selected which colour to use, simply
enter the position in the Pos. window and press the
Chart Center button. Press again on the same button,
now called Save. Exit the window by pressing the OK
button.
- 44 -
Chapter 3:The chart view
3.2: Automatic Chart
Centering
TECDIS can automatically ensure that the chart is oriented so that own
vessel always is visible ( the chart is moving according to the vessel).
This function is activated by clicking on the Auto button on the Main
Toolbar, the Home key on the keyboard or by clicking with the cursor
anywhere in the Sensor Data field in the Information panel.
Auto chart switch is ‘Off’.
Auto chart switch is ‘Off’, but Auto function will remain
active when zooming with mouse clicks in the chart
area.
Auto chart swich is ‘On’ until zooming with mouse clicks
in the chart area.
Auto chart switch is ‘On’, and will not be deactivated
when zooming with mouse clicks in the chart area.
Setting the Chart Scale and zoom level by using the Zoom buttons on the
Main Toolbar, will NOT turn off Auto mode. Locking the Auto mode is
done by clicking Auto with the right mouse button.
Auto sensitivity (how often shall the chart view be redrawn to keep
up with the vessel movement) and Ship symbol offcenter (how much
of the chart view shall be in front of the vessel) can be adjusted in
the Ship menu.
- 45 -
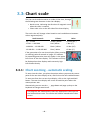
3.3: Chart scale
The chart scale and orientation is visible all the time, through
the following two elements in the chart display:
l
l
North arrow, indicating the direction of magnetic north
when the chart is rotated
Chart scale ruler on the left side of the chart display
The scale ruler will change colour based on scale and distance between
colour-segments(units):
Scale interval:
1:1 – 1:7500
1:7501 – 1:100 000
1:100 001 – 1:2 000 000
1:2 000 001 – 1:100 000 000
Colour:
Yellow / White
Red / White
Black / White
Blue / White
Units:
0,1 Nm (0,1’)
1 Nm (1’)
10 Nm (10’)
60 Nm (1°)
If the generation of a new chart display (after panning
or zooming) takes 6 seconds or longer, an indicator
for expected generation time will appear in the upper
left corner of the chart display. This indicator will only
be displayed on chart displays with extremely high
information density.
3.3.1: Chart zooming - automatic scaling
To zoom into the chart, you place the pointer where you want the centrepoint of the new chart display to be, and click on the left trackball button.
To zoom out from the current chart display, click on the right trackball
button. The new chart display will centre around the point where the
mouse-pointer was.
Alternatively you can use the +, - , page down and page up keys on the
keyboard to change zoom levels.
The program will automatically select the appropriate chart-type for
the selected chart scale. The marker will now be moved to the chart
centre.
- 46 -
Chapter 3:The chart view
3.3.2: Chart zooming with manual scaling
From the main toolbar you can select the chart scale directly. The
numbers represent the scale times 1000. You select the scale by clicking
on one of the buttons on the main toolbar. Alternatively you can set the
scale directly from the keyboard, using the letter for the wanted chart
scale (W, A, B, C, D, E, F or G keys).
When the letter of the different scale buttons is displayed with yellow text
and a green background, it indicates that official charts are available at
this scale level. These official charts will always be prioritized.
If the system is in auto mode, the displayed chart scale is at the position of
your own vessel. If you manually navigate the charts, the displayed chart
scale is for the centre of the chart display. If your own vessel is outside the
chart display, the displayed chart scale is for the centre of the chart
display. The button indicating the presently selected chart scale.
Under the main toolbar, text warnings are
shown for the following situations:
l
l
l
l
l
No ENC available
Better ENC available
No charts are available, refer to paper charts
Not official chart display
Over-scaled
3.3.3: Automatic zooming during route sailing
For version 4.7.x.19 and above it is possible to configure automatic
zooming to given scales for each waypoint in a route. This is done in the
voyage planner, by adding the following shortcode in the text field of the
wanted waypoint: Scale 1:xxxxx, where xxxxx is replaced by the wanted
scale.
3.3.4: Zooming without changing chart scale
The zoom buttons on the main toolbar can be
used to change the scale the chart is viewed
in. If you use the Zoom in or Zoom out buttons
- 47 -
with the left mouse button, the chart view automatically changes so that
details are viewed using the most appropriate chart database.
If you use the right mouse button on the Zoom buttons, the details will be
viewed using the chart scale last used before you zoomed in or out. The
number in the centre shows the current scale.
If you hover the mouse pointer over the
middle field, a yellow helptext-line will
appear, showing you the original scale for
the currently shown chart. By clicking in
the field you will set the current chart scale to the displayed original scale.
This function can be overridden by charts from another chart
database TECDIS uses several types of charts, but will always prioritize official charts.
3.3.5: NB! Overscale and underscale
When the lowest scale available in the chart database is reached, you can
still zoom further into the chart, but this will only be a graphical
enlargement and there is no more refinement in displayed chart information. This is called overscale.
Any flaws that might be in the charts will be enlarged together with the
chart display. The field that indicates your currently selected scale will be
displayed in orange when the chart display is in overscale mode.
Overscale will in addition be displayed with vertical lines on the
chart. When parts of the displayed chart is in overscale, only these
parts are marked with vertical lines.
When you zoom out from your current chart display, you may enter a
state of underscale. The chart information display can then be to dense
and chart information may not be displayed. The field that indicates your
currently selected scale will be displayed in green when the chart display
is in underscale mode.
- 48 -
Chapter 3:The chart view
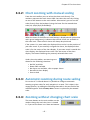
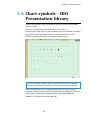
3.4: Chart symbols - IHO
Presentation library
The IHO Presentation library provides an overview of all ECDIS symbols
and test images.
The library is opened by pressing Control + Alt + Shift + T.
By pressing the keys 0 to 9 on your keyboard, you cycle between the pages
of symbols in the presentation library. To view a description of the
different symbols, utilize the chart inspector/query cursor.
The main toolbar is hidden when the presentation library is opened,
but can be accessed by moving the pointer to the top of the monitor.
The presentation library is closed by pressing the Esc button on your
keyboard. You can view the version number of the presentation library by
pressing the ? button (chart legend button) in the Chart menu See
chapter7.3: The Chart menu(see page 193)
- 49 -
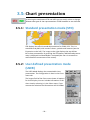
3.5: Chart presentation
By pressing the two buttons STD and USER you can easily select or change
between two types of chart presentations: ECDIS Standard or user defined.
3.5.1: Standard presentation mode (STD)
STD displays the official standard presenation for ECDIS, S52. This is a
standard set by IMO, with certain colours, symbols and contents (see the
illustration to the left). The image to the right displays the use defines
INT1 chart presentation. By pressing the STD button, IMO-defined presentation is displayed and Auto Mode is activated (the chart is centered on
and follows the movements of the vessel).
3.5.2: User defined presentation mode
(USER)
The USER Mode displays the customizable chart
presentation. The configuration is done in the Chart
menu tab.
The largest field of the Chart menu shows all options
for chart display. You can include information in the
chart view by selecting it in the Chart menu; if you
remove the selection the information will be hidden.
- 50 -
Chapter 3:The chart view
On the button row below you will find five
different presets for the USER Mode:
Base displays a bare minimum of chart information.
Standard contain the same chart information as STD Mode.
1, 2 and 3 are user customizable presets.
On the bottom line you can select if you want to use S52 or INT1 presentation modes.
When using INT1 a warning is give: Not official presentation.
The button to the far right determines the size of text and symbols in the
chart. In STD Mode this is set to 1.0.
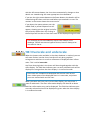
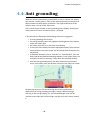
3.5.3: Full hazards display
With Full hazards display on the hazards placed (displayed) within safety
contour and the isolated dangers placed outside the safety contour, which
are deeper than "Safe" depth. In STD mode this is turned off as standard,
but it can also be activated from the Chart menu tab.
3.5.3.1: Full safe hazards on anti grounding alarms
In TECDIS it is possible to set the system to turn on full safe hazards when
an anti grounding alarm is generated. Depending on other settings in the
Safe menu, you will then be warned in good time before a grounding, and
get all necessary information for situation evaluation.
Auto safe hazards and Shallow soundings can be turned on for anti
grounding alarms in the Safe menu tab. See 7.7.3: Auto Safe Hazard
display setting(see page 208).
- 51 -
3.5.3.2: Danger symbol
The setting “Danger Symbol” marks any hazard on the chart with a danger
symbol. This setting is active by default in STD mode and when the “Safe
Hazards” is activated in STD mode, all risks (including those within safety
contour ) are marked with danger symbols. When this is deactivated, only
isolated dangers outside the safety contour is shown with danger symbols.
Safe hazards OFF
Danger symbol ON
Dangerous objects outside safety contour are displayed
with danger symbol.
med faresymboler.
Dangerous objects within safety contour are not displayed.
Hazards deeper than safety depth are not displayed.
Safe hazards ON
Danger symbol ON
Dangerous objects outside safety contour are displayed
with danger symbol.
Dangerous objects inside safety contour are displayed with
danger symbol.
Hazards deeper than safety depth are displayed normally.
Safe hazards ON
Danger symbol OFF
Dangerous objects outside safety contour are displayed
normally ( with black text).
Dangerous objects within safety contour are displayed
normally.
Hazards deeper than safety depth are displayed normally
(with gray text)
NB: In STD mode, hazards deeper than the safety depth are not
displayed, regardless of “Safe hazards” settings!
- 52 -
Chapter 3:The chart view
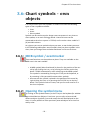
3.6: Chart symbols - own
objects
It is easy to insert your own symbols in TECDIS. You have the following
types of chart symbols available:
Lines
l Areas
l Point symbols
Symbols can be used to mark a danger zone not present in any chart or
chart update, or to mark fishing grounds. Lines and areas can be
connected to the alarm system in TECDIS, and it can be colour coded in 5
(6) available colours.
l
At a glance you can set symbols where you want, to mark what you want.
In the following subchapters we will explain how you place symbols in the
chart, how you change them and what attributes can be set for them.
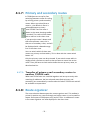
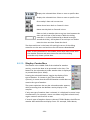
3.6.1: MOB symbol / eventmarker
These two functions are the quickest to place. They are available on the
MOB icon in the main toolbar.
l
l
A MOB symbol (Man OverBoard) is placed in the position of the vessel by left clicking the icon, or by pressing the F10 key on the keyboard. TECDIS automatically starts a bearing to the MOB symbol.
The symbol is removed by pressing the F7 key on the keyboard, or
by removing it like you would remove other symbols.
An event marker symbol is placed in the position of the vessel by
right clicking the icon, or by pressing the F11/F12 key on the keyboard. This symbol marks an event, and you can enter text for it in
the chart inspector.
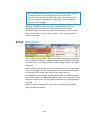
3.6.2: Opening the symbol menu
By clicking on the Symbol button (or the F7 key on the keyboard) a window
opens titled Mariner Objects. From here you can edit, select and add
different objects (symbols, lines and areas) that will be displayed on the
chart. It is also possible to filter previously entered objects on a time line
and by color.
- 53 -
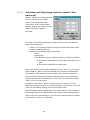
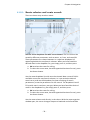
3.6.2.1: Selecting and displaying objects (symbol, line
and area)
Mariner objects are displayed in the
chart by clicking on the "Show"
button and removed from the
screen with "Hide" button. When
Mariner objects are visible, the icon
button from Main Toolbar is
activated.
The upper frame of the dialog box provides control over which Mariner
objects to be displayed.
l
l
Check "All" to display all Mariner objects (tick the box when add or
modify symbols/line/area).
Uncheck All to display objects filtered by:
o Colour
o Symbol type
o If the Show time box is checked, display is limited to symbols:
n that where made after the From data, but before the To
date
n that where made after the After date
Note that only the first two date conditions ("From" and "To"), or only the
third condition ("After") must be satisfied, for an object to be displayed.
For example, if the operator wants to display only symbols created in a
certain previous time period (without viewing recent created symbols),
the time period can be introduced in "From" and "To" date fields, whiles
"After" is set to a future date.
In addition, “boat hook “ button is used to select a single line or area
object by selecting the name or directly clicking on it in the chart. Circular
areas are selected by clicking on the circle center mark.
Selected objects appear highlighted in the chart and the “print “button in
the dialog window is activated and can be used to create a position/waypoint list for the selected objects. This list can be saved to external media
or printed (if a printer is connected).
- 54 -
Chapter 3:The chart view
3.6.3: Add new, modify or delete symbol
(objects)
By pressing "F7" or "Edit Symbol" in the "Mariner Objects" window,
a new (vertical) toolbar appears on the left side of the chart display.
The top three buttons functions: Delete object symbol,
Change/Move object symbol and Add new symbol. The rest of the
buttons enables the use of different objects symbols and colors.
Delete symbols: enable Delete function/mode by clicking on the
"Delete" button. The button will now be activated while the
deletion mode is active. Delete individual symbols by clicking the
left mouse button with the cursor over the icon.To exit the Delete
function/mode click "OK" or right mouse button.
Change / Move symbols: enable Edit / Move mode by clicking
the "Change / Move" button. The button will now be activated
while the modification mode is active. By clicking the left mouse
button with the cursor over a symbol on the chart, this will be
changed,moved and /or colored, to currenly selected symbo/color
in the vertical toolbar.The new symbol will move with the cursor
until is placed in the desired position by clicking the left mouse
button again (the previous position and appearance of the symbol
will be marked as deleted). To exit the Edit /Move mode click “OK”
or the right mouse button.
Add New Symbol: enable New Symbol mode by clicking on the
“New Symbol” button.The button will now be activated while
the mode is active. In this mode, a new icon/symbol will be placed
on the chart, with the selected shape and color (from the vertical
toolbar), by clicking left mouse button in the desired position.
A window will open in the lower part of the chart. Information about
the new object, can be introduced here. This is stored as a short
visible text displayed in the chart and as a detailed text not visible in
the chart. Click the left mouse button or the "OK" button when data
is entered, to close the window.
- 55 -
OK: This button will terminate any of the three active modes described
above. If none of the modes are activated, this button will exit the symbol
menu.
17 Symbol Buttons: There are a total of 17 icons available in the toolbar,
where the currently selected symbol is marked as inactive.
Note: The top four symbols are fixed, cannot be changed and will
always be presented in orange
Open Symbols Selection: Symbols, other than those
found in the menu, can be accessed from the
symbol library. Open symbol selection with the
folder icon. First select the symbol that will be
replaced in the toolbar. Then select the new symbol
from the symbol library, by clicking it. The new
symbol will now appear in the toolbar. Close
symbol library by clicking the folder icon
Velg først det symbolet som skal byttes ut fra
verktøylinjen. Velg så det nye symbolet fra symbolbiblioteket. Symbolet på verktøylinjen byttes da
automatisk ut. Lukk symbolbiblioteket ved å trykke
på mappesymbolet.
6 color selection buttons: These buttons show color choices available
symbol colors. The selected color appears as a activated button.
The above mentioned functions only works with symbols added by
you. Symbols placed in the charts by the chart provider cannot be
edited.
- 56 -
Chapter 3:The chart view
3.6.4: Add new, modify or delete custom
lines / areas
By pressing "F8" key or "Edit line/Area " in the "Mariner objects " window,
a different (vertical) toolbar appears on the left edge of the chart display.
This toolbar provides access to functions that enables the creation,
modification and deletion of lines and areas on the chart. Toolbar functionality is the same type as in the previous chapter.
Position list: Gives an overview of the different positions for the points the
line/are is made of. You can also edit the point placement by inserting
new values directly into the list. Position is given in degrees and decimal
minutes.
“Delete” ( lines and areas): The Delete feature is enabled by clicking
on the "Delete" button. The button will now be activated. Delete
custom lines / spaces, by clicking on the left mouse button with the cursor
over the line symbol or on the center of circular areas. Exit delete mode
by clicking "OK" or right mouse button.
“Edit line /change color” (modify / move lines and areas): This
feature is only available for multipoint lines and areas. Enable the
modify / move mode by pressing the "Edit line/change color" button. The
button will now be activated and several operations can be performed.
to move/modify a corner: left-click on the corner. Move it to the new
location and left-click once again to anchor it.
to add a new corner to a straight line: left-click on a straight line. Move it
in the desired location and left–click to anchor it.
to delete a corner: right-click the point to delete.
OK button to exit the mode.
Add new line/area: you can insert the following lines/areas:
Lines
l Circular areas
l Multi-point areas
l Rectangular areas
The selected function will be displayed with a light background when
activated. Simple lines, circular and rectangular areas' extent / size are
set in by another click on the left mouse button. For multi-point lines or
areas, each click of the left mouse button will place a new ‘grip’ point.
Click the "OK" button or right mouse button to finish the line.
l
- 57 -
When begin to draw an item, a window will open in the lower part of the
chart. Here you can register a brief or detailed information text about the
new object. The short text is visible on the chart whilst the detailed
description is hidden. Press "Enter" - or "OK" button when data is entered,
to close the window.
Position Line (bearing line): To mark a bearing position in the chart,
select “Position line” drawing feature and activate the drawing mode
by clicking “Draw new “ icon. When the start point of the bearing position
is placed on the chart - by clicking the left mouse button a small window
opens where a specified angle can be entered and so locking the bearing
line. Left-click again to place the end point of the bearing position and a
new window will open in the lower part of the chart, where a brief or
detailed information text, about the new formed object, can be entered.
Click the left mouse button or the "OK" button when data is entered, to
close the window.
“Marked area” (multi-point area): This button is used to enter multipoint/multiple-line areas. After the first point is placed in the chart a
window pops up at the bottom of the chart where a brief or detailed
information text, about the new object, can be entered. The short
description is visible on the chart whilst the detailed description is hidden.
Also, in the same pop-up window by checking the feature box "Fill", the
newly created surface can be shaded. Click the left mouse button or the
"OK" button when data is added, to close this window.
6 colour selection buttons: These buttons show available colour choices for
lines and areas. Red colour indicates danger and the red objects will
generate alarms when anti-grounding alarm zone is overlapping with the
object. Red objects are also displayed regardless of symbol visibility,
status and filtering.
The above mentioned functions only works with symbols added by
you. Symbols placed in the charts by the chart provider cannot be
edited.
- 58 -
Chapter 3:The chart view
3.7: Chart orientation
In TECDIS you can change the chart orientation freely between up to 5
modes.
By clicking either the text or the arrow besides it you will open a
dropdown list where you can select the orientation you want:
l
l
l
l
l
NORTH(standard)
l stands for "north up", and means that north will always be
towards the top of the monitor, regardless of own vessel
course. Will automatically be selected by the system if placed
in STD mode
COURSE
l stands for course up, meaning that the current course the vessel is travelling at will be shown towards the top of the display. It will not change even if the vessel later changes
course.
HEAD
l stands for head up, meaning that the vessels bow will always
be shown towards the top of the display. The vessel will have
a fixed position on the display, and the chart view will alter
during sailing (relative motion)
Radar
l means that the chart orientation always will follow the connected radar orientation. If you change the orientation or the
range of the radar, TECDIS
will automatically reorient itself with the same chart view and
chart scale as the radar.
(RADAR 2)
l Only appears if two radars are connected to TECDIS. TECDIS
- 59 -
ter 4:
Navigation
In this chapter we will look closer at how TECDIS can be used during planning and performing
voyages. You will also get an in-depth view of how TECDIS works as an anti-grounding system,
and how you can maintain a safe voyage even if all sensors are lost.
4.1:Route planning
63
4.1.1:An introduction
63
4.1.2:Starting the route planning tool
64
4.1.3:Draw a route directly in the charts
65
4.1.4:Activating the selected route
68
4.1.5:Automatic route generation with Jeppesen C-Routes
69
4.1.6:Search and Rescue - SAR
73
4.1.7:Primary and secondary routes
75
4.1.8:Route organizer
75
4.1.9:Delete selected route
77
4.1.10:Voyage planner
79
4.1.11:Saving and exporting a route list
82
4.1.12:Extending a route
82
4.1.13:Modify waypoints directly in the charts
83
4.1.14:Merge routes
84
4.1.15:Copy selected route
85
4.1.16:Great circle route
85
4.1.17:Add index lines
86
4.1.18:Display sight lines
87
4.2:Route navigation
88
4.2.1:Navigation information
88
4.2.2:Larger CTS values
90
4.2.3:Route name text field
90
4.2.4:Calculation of the voyage duration
90
4.2.5:Primary and secondary routes
91
4.2.6:Notify Waypoint / Critical Point on the voyage
91
4.2.7:Hazards and alerts on a route
92
4.3:EBL/VRM Bearing
94
4.3.1:Bearing functions
94
4.3.2:General about EBL / VRM operation
94
4.3.3:Temporary/quick route - route with route monitoring in
three clicks.
95
4.3.4:Storage and export of Bearing Position and of Line Of Position (LOP )
96
- 61 -
Chapter 4:Navigation
4.4:Anti grounding
98
4.5:Notifications and alarms
99
4.5.1:Confirm alarms and warnings
100
4.5.2:Alarm list
101
4.5.3:Alarm texts
102
4.5.4:Warning text
104
4.5.5:Text messages
106
4.6:Past track lines
107
4.6.1:Primary position source
107
4.6.2:Secondary position source
108
4.6.3:Convert past track to route
108
4.6.4:Show and Hide buttons
109
4.7:Maritime calculations
110
4.7.1:Calculate
110
4.7.2:Lines of Position (LOP)
112
- 62 -
4.1: Route planning
Route planning in TECDIS is easy to master, and at the same time it is a
powerful toolset. In this chapter you will get an introduction to route
planning in general and an overview of the tools available for you.
Knowledge of navigation in general, and approved training in the
use of ECDIS is a prerequisite for correct use of TECDIS in route
planning and navigation.
4.1.1: An introduction
Route planning is a key activity that forms the base of any safe voyage. A
route plan is a comprehensive, port to port guide, developed by and
utilized by the vessels navigators to find the best route, to identify
potential dangers or issues along the voyage, and to commit the day to
day decisions to a plan with safety for the vessel and crew at its core.
During route planning those parts of a route that has the highest potential
risks involved, should be reviewed an extra time. During those reviews
restrictions for ensuring safe sailing should be outlined. This should be
done before sailing begins.
- 63 -
Chapter 4:Navigation
4.1.2: Starting the route planning tool
The route planning button is placed in the main toolbar. It
activates the route planning toolbar on the left side of the display.
When a route is selected, or activated for sailing, this toolbar will appear
automatically when the cursor is hovered over the upper left corner of the
display. The route planning toolbar is automatically hidden by the system
if it has not been in use within the last minute.
The toolbar has the following functions:
Make new routes
Draw a new route directly in the charts
l Make a route with coordinates directly in the voyage planner
l Activate the selected route
l C-routes automatic route generation
l Search And Rescue (SAR)
Organizing the routes
l
Primary and secondary routes
Route selector and route search, with route export
l Delete selected route
l Voyage planner
l Save and export the route list
Modify existing routes
l
l
l
l
l
l
l
l
Extending a route
Modify waypoints directly in the charts
Merge routes
Copy selected route
Great circle route
Add index lines
- 64 -
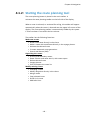
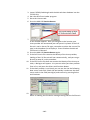
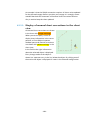
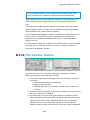
4.1.3: Draw a route directly in the charts
Press the Make a new route button to start the process of creating a
route.
1. The cursor is placed on the position in the charts where you want to
place the first waypoint. Press the left mouse button to set the first
waypoint(W1). This will start the voyage planner, and a new window
will appear at the bottom of the display. In it you can enter the
route name and several describing tags ?(from, to, owner, tags) This
information is used in route search and the route organiser
2. Continue drawing the route by moving the cursor to the desired location for the next waypoint, and press the left mouse button to
place the waypoint. A line will now appear between the two waypoints, indicating the route leg. You are now ready to place the next
waypoint. Continue placing waypoints until you are satisfied with
the route displayed in the chart.
3. Finish drawing the route by pressing the right mouse button, or by
selecting OK in the route planner toolbar. A route can contain up to
500 waypoints.
The corridor width is set in the voyuage planner as described in
4.1.10: Voyage planner(see page 79).
If a turn radius is deemed invalid by the system (if it is too big), the
turn will not be drawn in the chart, and a warning will be given each
time the route is selected.
Waypoint coordinates can be entered manually with the keyboard.
- 65 -
Chapter 4:Navigation
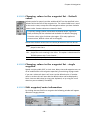
4.1.3.1:
How to change the chart view during route
drawing
To move the chart view during waypoint placing, use the middle mouse
button to recenter the chart to the position where the cursor is. Alternatively you can move the cursor to the chart view edges, and press the left
mouse button when the cursor changes form to an arrow.
Chart scale is changed in the main toolbar, alternatively by using the
scroll wheel (if available). Navigating the charts can with great benefit
also be done by using the scale shortcuts on the keyboard, see 3.3: Chart
scale(see page 46).
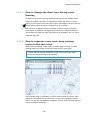
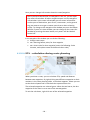
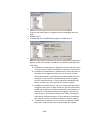
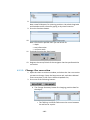
4.1.3.2: How to separate a new route from existing
routes in the chart view.
When you are drawing a new route, or modifying an existing, all other
existing routes are shown in the chart view as well, but in grey.
If active lead sectors are turned on (in the Chart menu tab), lead
sectors are shown by the cursor position.
The selected route is marked by a red line with directional arrows. Each
waypoint is shown on that red line with a circle and a waypoint number
(W1,2, etc) On the line between waypoints, you can select to have planned
course and speed displayed.
- 66 -
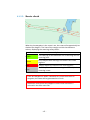
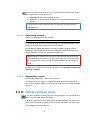
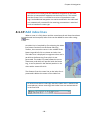
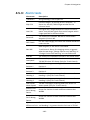
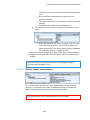
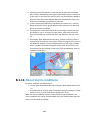
4.1.3.3: Route check
When the last waypoint in the route is set, the route will automatically be
checked for dangers. The lines of the voyage corridor has different
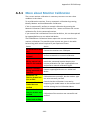
colours, displaying the route leg safety status:
Corridor colour
Explanation
Green
The route leg is safe and there are no warnings for this
route leg/turn.
Yellow
Chart objects with warnings are found in this route
leg/turn.
Red
Danger objects are found in this route leg/turn.
Grey
The safety check for this route leg has failed. Split the
route leg in two.
If the last waypoint is within a distance of 0,1 Nm from the first
waypoint, the route will be generated as a circle.
Automatic route check only happens if Auto route activation is
selected in the Safe menu tab.
- 67 -
Chapter 4:Navigation
4.1.4: Activating the selected route
You can activate you selected route in several ways, both automatically
and manually. This table provides an overview:
Automatic activation when inside
the route corridor
For this to be possible the auto route
activation has to be selected in the
Safe menu tab.
Manual activation when inside the Is done by pressing the activate route
route corridor
button on the route planner toolbar.
Automatic activation, with placing
of additional waypoint creating a
route leg from the vessel position
to a user selectable place on the
route
For this to be possible the auto route
activation has to be selected in the
Safe menu tab, and Allow route activation entry lane has to be selected in
TECDIS Setup.
Manual activation, activation, with
placing of additional waypoint creating a route leg from the vessel
position to a user selectable place
on the route
For this to be possible Allow route
activation entry lane has to be
selected in TECDIS Setup.
Is done by pressing the activate route
button on the route planner toolbar.
Note: If you have configured route activation with placing of
additional waypoint creating a route leg from the vessel position to
a user selectable place on the route, you can from version 4.7.x.23
select any point on the route leg. You are not restricted to only
selecting existing waypoints. Note that a new waypoint will be
created in that position if there is not one there already.
- 68 -
4.1.5: Automatic route generation with
Jeppesen C-Routes
C-Routes is distributed as an integrated part of the Jeppesen Professional+ chart database, and is therefore only available on TECDIS
units with Professional+ installed and activated. In addition there has
to be valid chart licenses for the entire area you intend to create
routes in.
4.1.5.1: About C-Routes
The C-Routes automatic route generation tool includes functionality for
automatic generation of route proposals to/from a wide array of ports
and user defined positions. The system utilises a grid of predefined route
legs all over the world, and combines them in to one route for you. Some
sea areas and ports are not part of the grid, contact Jeppesen if you experience that your desired port/location is not available.
The route proposition takes traffic separation systems into account, along
with all other chart functions and the vessel draught, when calculating the
route. This functionality can shorten the route planning process and help
minimise the navigator workload significantly.
The C-Routes library is developed by Jeppesen Marine and aids the
navigator in the route planning process. The most important feature is the
ability to swiftly calculate the shortest possible route between two ports.
The route calculation is based on matching requirements given by the
vessel with the territorial limitations along the planned route.
- 69 -
Chapter 4:Navigation
4.1.5.2:
Start C-Routes
In the route planning toolbar, press the C-routes button. A window will
open with the C-Routes planning tool
The planning tool is divided in to several fields:
l
l
l
Route name
New Stop
Restrictions
l
l
l
Options
Keyboard
CREATE
4.1.5.3: Route name
In this field you add the name you want for your route. Use terminology
that makes it easy for others to pick up the route later.
4.1.5.4: Enter a new stop for the voyage
This is done in the field New Stop. You can select between three ways to
specify the stop:
Own ship posOften used to set the first waypoint for the voyage.
ition
If this is selected, and you press the Set button, you can
Specified posthen left click with the cursor in the position in the chart
ition
where you want to place the waypoint.
Select from
port list
Used to select ports that are found in the C-Routes port
list. The list is divided in to nationalities, and you thererfore have to first select the corresponding country for
the port you want to add i the first dropdown list, and then
select the port in the second, lower dropdown list. In the
dropdown list it is also possible to enter the first letter for
the country/port.
When the port/position is specified, use the Play button to transfer the
entry to the port-of-call list.
4.1.5.5: Port-of-call list
Next to the New Stop field, there is a Port-of-call list. As you add ports for
your voyage, this list will fill up. When you have added all ports of call you
desire, you can edit their order with the arrow buttons next to the list. You
can delete a port of call by pressing the X button nexct to the list.
- 70 -
You can also get more information about the port of call you have
selected in the list, by pressing the Info button. Information that is
displayed includes (among other) the maximum draught for vessels
entering the port. This information is displayed at the bottom part of the
C-Routes window.
Ports marked in red in the port-of-call list: These ports have a
maximum draught that exceeds the capacity of the port. This port
must either be deleted, switched for an alternative port nearby, or
the navigator has to select ignore ship draft in the C-Routes Options
button.
Ports marked in yellow in the port-of-call list: The port database
does not have information on depth for the port.
To display a port from the port-of-call list in the chart view, press the
Chart button at the bottom of the C-Routes window. Pressing this button
will center the chart on the selected port.
4.1.5.6: Restrictions - add and delete
When a sea area, bridges, canals, objects or
places, are considered obstructions for the own
vessel, it can be inserted restrictions in the form of a red slash across
those areas which C-Routes will not take into the route calculation. Adding
and deleting these restrictions is done using the Add and Del buttons.
- 71 -
Chapter 4:Navigation
In an early planning stage, you should zoom out in the chart so that the
entire route can be visible. When minimum two ports of call are set, the
C-Route is drawn as an orange preliminary route.
When the Add button is pressed, the cursor will change and with a left
click in the desired position in the chart, the first point of a red restriction
line is set. The other end of the restriction line is set by moving the cursor
to the desired location and left click again. There is no limit to the number
of restriction lines that can be deployed.
A click on the Del button deletes the last plotted restriction line, a second
click on the Del button removes the second-last restriction line, and so on.
4.1.5.7: Restrictions - options
The C-Routes can be adjusted to
avoid planning the route through
fairways and / or channels. To
restrict or prohibit certain passages
through the fairways and / or
channels, remove the checkmark in
front of the fairway or channel’s
name, in Passages Allowed field.
The fairway / channel’s name that is
checked (highlighted) in the Passages Allowed field, will be indicated on
the chart with a red marker.
Furthermore, when planning a route, C-Routes can be adjusted to consider
the following options:
l
l
Ignore ship draft; when checked, C-Routes will generate a route
without taking into consideration the own vessel draft. The new generated route must be reviewed in detail before it is used!
Allow river route legs; when checked, the C-Routes will generate
routes using inland waterways where it makes sense.
l
l
l
l
Prioritize deep water route legs; when checked, C-Routes generates
routes preferably in the open ocean.
Allow inshore route legs; when checked, C-Routes can use the fairways within the shoreline for navigation plan. In that case, a route
can be plotted outside the traffic separation schemes and be
shorter.
Use default lane width; when checked, C-Routes uses TECDIS standard corridor width, instead of corridor width from C-Routes that are
highly variable per leg.
- 72 -
Any routes that are generated with Ignore ship draft activated have
to be reviewed in detail before they are used.
4.1.5.8: Create Port-of-call list with the on-screen
keyboard
By pressing the Keyboard button you
bring up an on-screen keyboard. This
way you have easy access to the route
generation tool without a physical
keyboard.
4.1.5.9: Create the route
When all ports of call are placed in the
list, and are displayed in either yellow or green colours (or draft is
ignored), you can press the CREATE button to start the route generation.
What has been an orange line indicating the route, now is converted in to
a preliminary route with waypoints, sailing corridor, speed annotation,
direction and is registered in the Route Organiser menu. Further work on
the route is done via the Route Planning Toolbar before the route is
actually used the navigator must check it both, automatically and
manually.
4.1.6: Search and Rescue - SAR
TECDIS has built in support for generation of search and rescue patterns
directly in the chart view.
There are four types of SAR patterns to choose between, and they can be
defined either as symbols placed in the charts, or as routes with full track
steering compatibility. When you press the SAR button, a new SAR window
opens where you can set settings such as type, start position and symbol
colour. In the chart view a live preview of the default SAR pattern is
shown:
- 73 -
Chapter 4:Navigation
This is how you set up a SAR pattern:
1. Select the search pattern type
you want to use.
2. Select the search pattern’s
anchoring point; own vessel's
position or the chart center.
3. Depending on which search
pattern is selected, you now
have to set some search pattern adjustments. The search
direction, length of line, number of lines and the distance
between lines are all
adjustable.
4. Choose if you want the pattern to become a symbol(line) or a route.
If you select route the search pattern will generate a route that is
activated automatically for route sailing.
4.1.6.1: Special conditions for the QRS pattern type
The QRS search pattern differs from the other because is not a continuous
line and thus cannot be converted to a route.
QRS is a numbered grid where the anchor point, the start and the leg
distance can be selected. Everything else is fixed and cannot be edited.
Up to four QRS search patterns can be visible on the chart simultaneously.
To remove the QRS search pattern, return to the SAR window and deselect
the checkbox of those patterns that will be removed.
- 74 -
4.1.7: Primary and secondary routes
In TECDISyou can set up for fast
switching between routes for sailing
by utilizing primary and secondary
routes. When you select/draw a
route in , the default is that it is
selected/drawn as primary
route.TECDIS Then the route 1
button in the route planning toolbar
is marked. The route will be shown
with a red line in the chart view.
If you press the route 2 button and
then select/draw a route, this is
then set as secondary route, and will
be displayed with a dotted orange
line in the chart view.
You can switch which of these two
routes are primary and secondary. This is done with the route switch
button 1:2.
Only the primary route can be activated. If you switch routes while in
voyage mode, you have to confirm that you want to cancel the active
route. Then you have to check and activate the new primary route, as
described earlier.
4.1.7.1: Transfer of primary and secondary routes to
another TECDIS unit.
When two TECDIS units are installed together and set up correctly with
matching IP-addresses, the last selected route (both primary and
secondary) are automatically transferred to the other TECDIS unit and will
be available as Import data.
4.1.8: Route organizer
The route selection button opens the route organiser tool. This toolbox is
primarily used to sort, search through and select routes. It is also used for
export and import of CSV(export only) and LST files. In addition all routes
in the route organiser are now displayed in the chart view.
- 75 -
Chapter 4:Navigation
4.1.8.1: Route selector and route search
There are three ways to select routes:
Use the route dropdown list with sort activated. The list can then be
sorted by different parameters such as owner, to, from, and name/ID.
These parameters are chosen between in a separate dropdown list
appearing besides the sort/search selector. When you have found the
desired route in the dropdown list, you simply press it, and then press
a. OK to select that route for sailing.
b. To select the same route, but with opposite direction of travel, press
the Return button.
Use the route dropdown list with search activated. Now a search field is
available next to the sort/search selector. In it you write the desired
search term, and use the dropdown list (now consisting of search
parameters) to set the parameters for the search. The dropdown list will
fill up with search results as you type. When you have found the desired
route in the dropdown list, you simply press it, and then press
a. OK to select that route for sailing.
b. To select the same route, but with opposite direction of travel, press
the Return button.
Use the route selector tool directly in the charts. With the route organiser
window open, the cursor changes shape to a boathook and all available
- 76 -
routes are shown in the charts. You can now find the desired route in the
chart, and select it using the cursor.
a. Left click to select the route for sailing.
b. Right click to select the same route, but with opposite direction of
travel.
The direction of the selected route is shown with arrows placed on
the route line.
4.1.8.2: Exporting routes
Routes can be exported in the formats
*.csv
*.lst
*.txt
To export a route to csv/lst, select that route in the route organiser, then
press the Select button, and then the Export button.
In the export window that appears you select export location and file
format. Csv files allows you to view route details in Microsoft Excel and
similar software. Lst files do not contain index lines.
When saving for export you can use file type to filter which file types
are displayed in the folders. This does NOT alter the file format used
for saving the file, that has to be changed manually in the file name
field.
see Saving and exporting a route list on page 82 see Saving and exporting
routelist on page 1.
4.1.8.3: Importing routes
TECDIS can import files in the *.lst file format.
To import an lst file, press the import button in the route organiser. A
new import window appears, and here you select the file and file location
of import.
4.1.9: Delete selected route
If you want to delete a route from the route database, you use the Delete
button om the route planning toolbar.
If a route is selected or activated, then it will be deleted. If no routes are
selected or activated, all routes in the chart will be shown and the cursor
will change to the route selector.
- 77 -
Chapter 4:Navigation
Now you can select a route for deletion. You have to confirm that you
want to delete the selected file. Press OK to confirm, or abort to stop the
deletion.
- 78 -
4.1.10:Voyage planner
The Voyage planner button gives access to a voyage planner window with
detailed information and settings for the selected route and all its
waypoints.
When you press the voyage planner button you activate a table with
detailed waypoint-information. This table is displayed in the lower part of
the screen.
The following abbreviations are used in the waypoint table:
WP
Waypoint number
GC
Great circle route leg
Lat.
Waypoint latitude
Lon.
Waypoint longitude
Dist.
Distance to next waypoint
Course
Course to next waypoint
Speed
Planned speed
Lane
Lane/corridor width
Radius
Turn radius
ROT
Rate Of Turn
Arrival
ETA to waypoint
Delay
Stop time at waypoint (min)
Text
Waypoint name and additional information
NB! When the Route Planner is in edit waypoint mode, the route
monitoring function is turned off ( the route control signals will not
be generated to the autopilot).
NB! By clicking one of the data fields in the list belonging to a
waypoint that is not displayed, the chart will center at the specified
waypoint. This feature is disabled if the Auto Chart Reposition is
enabled.
- 79 -
Chapter 4:Navigation
4.1.10.1: Changing values in the waypoint list - Default
values
Default vaules for speed, corridor width and ROT can be specified in the
Default field to the left of the waypoint list. The values listed here is used
for the entire route, except for those waypoints where you have locked a
custom value. Custom values are viewed in black.
To quickly change custom values back to default values, right click
them, and they will be unlocked and available for default changing.
To lock a value, right click that value agian. (This only applies to
custom values, default values will be changed).
Below these default values there are three parameters that can be set:
Lane
With this activated the specified lane/corridor width will be displayed in the chart.
With this activated both planned speed and course will be disInfo played for each routeleg in the chart. This option is deactivated for
TECDIS systems with Track Control.
Zone Here you can specify the time zone for the route.
4.1.10.2: Changing values in the waypoint list - single
waypoint
Speed, corridor width, ROT, arrival time, delay time and waypoint text can
all be modified for each waypoint separately, even during voyage mode.
If you set a value to 0 then it will revert to the default value. If another
value is set then this will override the default value and be displayed in
black. You can add values by using your keyboard, or by using the scroll
wheel on your trackball(if available).
4.1.10.3: Edit waypoint/route information
By clicking the text field for a waypoint the following window will appear
above the voyage planner:
- 80 -
Here you can change information about the route/waypoint.
NB! If you have selected the first waypoint in the list, you will open
the route info window. All other waypoints open in to the waypoint
info window. In the route info window you can enter information
such as port of destination, port of call, route owner, and a general
tag you want to set to get a custom search term when selecting
routes. To change to the waypoint info window you press the button
WPinfo. If you are in that window, you can change to the route info
window by pressing the same button, only now it will be labeled
Route into.
In the waypoint info window you can do the following:
a. change route name
b. set a warning before point, for that waypoint
c. set a chart scale for that waypoint (enter the following: Scale
1:xxxxxx, and replace xxxxx with desired chart scale)
4.1.10.4: ETA - calculation during route planning
When you draw a route, you can calculate ETA, speed and distance
between two waypoints. By right-clicking two different waypoints or their
numbers in the route planning table, a calculator appears, where you can
set the desired speed and it calculates the expected time use.
The selected waypoints are colored green. When the tool starts, the last
waypoint of the route is set as one of the two waypoints.
To exit the calculator, right click one of the selected waypoints.
- 81 -
Chapter 4:Navigation
4.1.11:Saving and exporting a route list
By pressing the save, edit and print route list button a new window will
appear with a route list with waypoint details, total voyage distance and
total voyage time. This list can be saved as a txt, lst or csv file.
When saved, the file can be transferred to another computer for:
a. printing
b. sending to the shipping company
c. assessment in excel or similar software
l (only the csv file)
d. loading in to DNV Navigator
l (only txt files)
e. loading in to a TELchart ECS Planning Station
l (only lst files)
Important: When saving you can use file type to filter which file
types are displayed in the folders. This does NOT alter the file
format used for saving the file, that has to be changed manually in
the file name field.
4.1.12:Extending a route
A route that has only been partially finished before, can be extended by
selecting it, and then selecting the route extension tool from the route
planning toolbar. This will reactivate the route edit mode and you will get
the opportunity to add waypoints atfer the last added from the previous
session.
- 82 -
4.1.13:Modify waypoints directly in the charts
To change an existing route, select the desired route to be changed, and
then press the route modify button on the route planning toolbar. This
will reactivate the route edit mode and you will get the opportunity to do
the following:
Left click with the cursor placed on the desired wayMove a waypoint point, move the cursor to the new position, and left
click again to set the waypoint placement.
Delete a waypoint
Right click with the cursor placed on the desired waypoint.
Add a waypoint
on a route leg
Left click in the route leg line between two waypoints
to add a waypoint. Move the cursor to the desired
position for that waypoint and left click.
End edit mode
Press the OK button in the route planning toolbar.
An active route can also be edited without exiting vouage mode, but
the three waypoints closest ahead of the vessel are locked for
editing.
- 83 -
Chapter 4:Navigation
4.1.14:Merge routes
Two or more routes can be combined to one new route.
To do this, first select one of the routes to be combined.
When the first route has been selected, you can start the route merging.
Left click the merge button, and select the route to merge the first route
with.
If you instead want to draw a new route to later on connect to a
previously drawn route, simply draw that route, and as all routes are
displayed in grey when drawing routes, you will be able to see the
route to merge it with during route drawing. You can view the route
you want to merge it with in the background, as all previously
created routes are displayed in grey in the background when a new
route is created or edited.
Waypoints in selected route and the one you are adding, are controlled
against each other so that the routes are joined in intersecting or
coinciding waypoints as shown below. This gives flexible opportunities for
merging routes.
Example 1: expanding a route
The last waypoint coincides with the first
on the other route, or a connection is
made between them.
Example 2: one intersecting waypoint
(<0,1Nm)
When one intersecting waypoint is
present, the result is a combination of
the two routes. The route legs not in use are discarded.
Example 3: two intersecting waypoints (<0,1Nm)
When both the first and last waypoint of a new route part intersects
waypoints on the original route, the original route part in between those
intersections is replaced by the new route part.
4.1.14.1: Save the new merged route
The merged routes will appear a a new route, and TECDIS will automatically reset the waypoint numbering. You can now save the route as a new
route, by pressing the Copy active route to new route button.
- 84 -
4.1.15:Copy selected route
If you want to create a new route based on an existing one, a copy of the
original route can be created using the Copy active route to new route
function.
First, the existing route should be selected. When pressing the Copy active
route to new route button, a dialogue box opens ; click OK button to
confirm copying and saving of the original route. The route that appears
on the screen is a copy with an independent status and can be modified in
the usual way, and it will be saved as a new route.
4.1.16:Great circle route
Routes in TECDIS can be configured as great circle routes. This is done in
the voyage planner (requires that you have entered it through starting
route edit mode.
In the column for GC (Great circle) in the voyage planner you can select if
a route leg should be a great circle leg or a loxodrome leg. This is
changed by left cliking in the GC column for the starting waypoint of that
route leg. A requirement is that the route leg has to be longer than 300
NM.
If great circle leg is selected the symbol in this field will be a curved line
in edit mode and dotted line in finished/active mode. The colour of the
symbol will also set the security status, having the same colour code as
the route corridor.
- 85 -
Chapter 4:Navigation
The Great Circle route generate additional waypoints on the table,
which are intermediate waypoints on the Great Circle. This means
that the Great Circle is recorded as a series of Loxodrome route
legs. Such additional waypoints can not be modified in the table and
are automatically removed if the route leg presentation is switched
back to Loxodrome route type.
4.1.17:Add index lines
When a route is is fully drawn and the route hazards and alerts have been
reviewed and accepted, Index Lines can be added for even safer navigation.
An Index Line is launched by first selecting the Index
line button function from the Route Planning
Toolbar, then move the cursor in the middle of the
Route Leg and left click to release an Index Line.
The Index Line is displayed in magenta colour and is
parallel to the Route Leg from which it was
generated. The Index Line now follows the cursor
movement, and while still parallel with the Route
Leg, it can be placed in the desired position in the
chart with a mouse left click.
The distance from the route line to the index line is
presented in NM at the center of the index line.
An overview of which route legs that have index lines is found on the
route planner, where route legs with index lines are marked with IX
in the text field.
- 86 -
4.1.17.1: Change index line length
The end of each Index Line, is marked with a square symbol. A left click on
one of these square symbol, enables the extension /shortening of Index
Line. Lock the Index Line in to position by left clicking again. The distance
from route to Index Line is given in NM at the Index Line middle point.
4.1.17.2: Deleting and restoring index lines
To delete an index line you simply right click with the cursor placed on an
end point of the index line.
To undo last deletion and restoring the last deleted line is achieved by
double clicking the route leg line that indexline belongs to.
4.1.18:Display sight lines
Sight lines are shown straight ahead of the vessel, and at 45 and 90
degree angles from the ship bow, when you are placing waypoints in the
chart. The sight lines are also available after the route has been drawn, by
hovering the cursor over the selected waypoint.
- 87 -
Chapter 4:Navigation
4.2: Route navigation
When activating a selected route, TECDIS enters navigation mode, giving
you all necessary information to steer the vessel according to the route
you have created.
4.2.1: Navigation information
When a route is activated and you have entered navigation mode, a navigation information window will appear in the bottom of the information
panel.
Route name
text field
see Route name text field on
page 90
2
WP end / WP
X
Toogles between showing
DTG and ETA for the entire
route and your selected waypoint. You select the waypoint
in the chart by clicking it.
3
Planned speed Lets you switch between
/ Present
planned and present speed
speed
for ETA calculation.
4
DTG
Remaining distance (Distance
To Go)
5
ETA
Estimated time of arrival
6
CTS
Course to steer by and course
for next route leg
7
DTG
Remaining distance to the
next route leg
8
TTG
Time to the next Wheel Over
Point (Time To Go)
9
The vessels position in the corPosition in the
ridor is shown with red for
route leg corport side, and green for the
ridor
starboard side.
1
10 XTE
Indicates Cross track error for
the current course, measured
in the same unit as the cursor
range, see see EBL/VRM Bearing on page 94
- 88 -
1
Dev
Deviation from course
- 89 -
Chapter 4:Navigation
4.2.2: Larger CTS values
If the size of the CTS values needs to be enlarged, this is achieved by
clicking the field they are in with the cursor.
In addition the Rate Of Turn (ROT) is displayed, while the graphic representation of the current heading, is removed with only the XTE (X-cross
Track Error) value is presented.
4.2.3: Route name text field
In the route name text field either waypoint text or routename is
displayed, with the following priority:
1. Text for next waypoint
2. Text for ETA waypoint
3. Route name
4. Route ID
4.2.4: Calculation of the voyage duration
There are two ways in which you can calculate ETA for the route
Planned
speed
Planned speed uses the speed values listed in the route
planner.
Present
speed
Present speed calculates ETA from the actual speed the
vessel is sailing with when the calculation happens. The
exception is if a speed value listed in the route planner is
locked by the navigator. Then the system will calculate
the ETA based on a combination of current speed and
planned speed. Locked route leg speeds are shown with
black text in the speed column in the route planner.
- 90 -
The navigation information window shows ETA/DTG either for the last
waypoint or for a user selected waypoint. To switch between these modes,
press the EP end / WP X button.
When WP end is active, the button will display WP end. The same
adheres to the planned speed button.
To calculate DTG/ETA between waypoints during route planning, see
4.1.10.4: ETA - calculation during route planning(see page 81).
4.2.5: Primary and secondary routes
In TECDIS you can use two routes simultaneously, allowing you to easily
switch between routes when in navigation mode. When set up, you can
have a primary route that is active, and a secondary that is checked and
pre-activated, available for switching on demand. For more information,
see chapter 4.1: Route planning(see page 63).
4.2.6: Notify Waypoint / Critical Point on the
voyage
If a critical WP on the route is of particular interest, TECDIS
caTECDISn provide an warning at a pre-determined
distance.
To use this feature, enable the Chart object inspector
function (from the Main Toolbar) and click on the WP
where the warning is to be placed.
An information window, that provides details on the selected waypoint,
opens in the lower part of the chart. In the lower left corner of this
window, check (activate ) “Warning before point” feature and specify the
time or the distance before the particular waypoint, when the warning
should be given. Put a checkmark in the box to the left, and then when
point shall be notified in time or distance. A critical waypoint is marked
with four red exclamation marks.
When the predetermined limit for a critical point is reached, an Point Info
alarm is activated and the info window for this critical waypoint, appears
at the bottom of the chart. Any info text entered previously to describe
this critical waypoint, will also be visible in the information window.
- 91 -
Chapter 4:Navigation
NB: Critical waypoint warning is triggered when the vessel moves
within the specified range from any heading, not just along the
route. When the warning has been raised, the marking of the critical
waypoint in the chart will change in to four green exclamation
marks.
To delete a critical waypoint, click it with the Chart object inspector and
deselect the Warning before point checkbox.
4.2.7: Hazards and alerts on a route
When a new route is created, or when an existing route is selected, the
system will conduct a safety check of the route and generate a list of all
hazards and warnings for the entire route.
you get access to the list of hazards and alerts by clicking on the List route
dangers and cautions button on the Route Planning Toolbar. This button
can either be displayed as an exclamation mark or as a question mark. An
exclamation mark indicates that the safety check of the route must be
done again.
Click this button to start the security check of the route, which will start
and run in the background. While security is running, a reminder of this is
shown in the upper part of the anti-grounding chart. A question mark
indicates that the route safety check has been completed and the dangers
and cautions list can be displayed.
The list of hazards and alerts (Route Alerts) it is a table where:
l
l
The first column contains the identification number of each waypoint the warning/danger relates to, accompanied by the “=” sign
indicates that the warning applies to the route leg between two waypoints, while the “+” sign shows that the warning is concerning a
turn (wheel over) with a single waypoint.
-the second column gives a short description of the item, followed
by the object's depth (if available).
- 92 -
l
-the last column gives information about the chart database where
the object originated.
The warnings, highlighted in yellow, are
listed first. Then follows a list of all the
dangers on the route, which are
highlighted in red. By clicking on one of the
yellow warnings, an information window
with more info details and a description of
that warning /area opens.
All the warnings are also marked on the
chart display(with red markings) when the clicking on the notification in
the list. This is the modality to get a quick visual overview of where the
dangers are.
If the current way point is outside the displayed section the chart
will move automatically, if the auto function is not activated.
- 93 -
Chapter 4:Navigation
4.3: EBL/VRM Bearing
TECDIS has a bearing function (electronic bearing line) that allows you to
make bearings both from the vessel position and from any point in the
chart.
When the bearing is anchored to the vessel it will follow the vessel
movements dynamically.
The bearing tool is activated form the main toolbar.
4.3.1: Bearing functions
The bearing tool has the following functions:
l
l
l
l
l
Bearing from own and selected position in the chart
Bearing slit with all saved bearings and place lines
Cursor information for the bearing with distance and direction
Two bearing modes: relative and true
Temporary/quick route - route with route monitoring in three clicks.
4.3.2: General about EBL / VRM operation
Bearing and range information is displayed in the cursor info field.
The measure unit for the distance is indicated in the lower right corner of
the info field, and it can be switched between nautical miles (NM) and
meters (m) by pressing it.
- 94 -
When the anchor point of the bearing is locked on to own vessel position,
ETA is displayed, with SOG as a constant speed, to the bearing point.It is
displayed in a small window at the top right corner of the chart view.
The bearing can be locked to a fixed heading by entering a value between
0 and 360 degrees in the small window by the bearing line anchor point.
The font size of the cursor data (bearing and
range numerical values), can be changed by
clicking anywhere in the cursor info field. When
the font size of the cursor data is increased,
switching between EBL A and EBL R mode operation is not available.
The current bearing mode is indicated on the button that precedes the
bearing numeric value. "EBL T" indicates that a given, true bearing is
displayed in the chart, respectively "EBL R" indicates that a relative
bearing is shown. Bearing mode is set back to ‘true’ mode (EBL T) each
time the anchor point is moved outside own vessel’s position. Peilingsmodus for eget fartøy beholdes slik det var satt sist gang eget fartøy var
ankringspunkt.
By left click in the chart, the anchor point of the bearing line is moved in a
new location. Estimated time commitment to go from the anchor point to
bearing point, with the current speed, is displayed in a small window at
the top right of the chart.
The EBL/VRM origin point can be moved back to own vessel’s position,by
mouse left click on the boat symbol.
By right click in the chart, the target point is locked to cursor position. The
EBL/VRM origin point will no longer follow the cursor movements. To go
back to normal EBL/VRM operaiton, switch off EBL/VRM, and turn it back
on again.
4.3.3: Temporary/quick route - route with
route monitoring in three clicks.
EBL/VRM funksjonen kan også benyttes til å generere en midlertidig rute.
Egen posisjon er startpunkt (WP1). Plasser neste WP med venstre
musetast (WP2) og avslutt rute med høyre musetast (WP3) og svar
bekreftende på spørsmålet om å Aktivere ruteseilas.
Denne ruten fungerer som en vanlig 3-punkts rute, men med det unntaket
at den ikke kan lagres.
- 95 -
Chapter 4:Navigation
4.3.4: Storage and export of Bearing Position
and of Line Of Position (LOP )
To save and export bearing lines, right click on "Bearing EBL / VRM" icon,
on the Main Toolbar, to open the "Bearing list" window. Da åpnes Bearing
list-vinduet samtidig som alle lagrede peilings- og stedlinjer vises i kartbildet.
All saved bearing lines are displayed on the chart. On the far left of the
window is the column for line selection. The selected lines are displayed
on the chart with a bold line and text.
At the bottom of the “Bearing list”window, buttons is provided with
functions necessary to amend the status of bearing lines:
1.
2.
3.
4.
select All lines
select No lines
delete the selected lines
Save EP (calculate and display the estimated position of 2 and 3 position lines)
5. export the selected lines
6. move lines individually
“ReAnchor” - when this command is activated, the cursor must be
positioned over the anchor point or over the arrowhead of the bearing
line, and then left click to retreive it. The bearing line now follows the
cursor movement,without changing the angle (parallel shift), and can be
placed by clicking again the left mouse button.
New bearing lines can be added to the "Bearing list" by enabling "Bearing
EBL / VRM" (left click) icon form the “Main Toolbar” ( if the function is
not activated). To save a bearing line, click on the middle mouse button.
Then the bearing line appearance changes from dashed to solid line (fig.5.
- 96 -
placed bearing lines in bold solid brown ). This modification indicate that
the bearing line is saved and is visibile as long as “Bearing list” window is
activ. Here the bearing line’s data and status can be modified. This
process can be repeated as many times as desired.
To save data from "Bearing list", for later use or for transport to another
computer, use the “ Export” function,. The Bearing Positions and / or the
Lines of Position data that will be exported, must be selected with a tick in
the checkbox.
Data is exported to the location and under file name which is specified in
the "Save As" window. The file format is not selectable;it is saved under "
*csv " format, which is a text file readable in the Excel.
In the table above such a " *csv " file is illustrated opened in Excel and
some formatting are made for easier readability. The positions are
specified in decimal grades and the time is indicated in the Date and Hour
separate columns. LOP is indicated either by a "0" or "1", where "0"
indicates a Bearing Line while "1" indicates a Line of Position. In the Type
column the following is set:
1= Bearing
2= LOP or a moved bearing
3= NMEA data received from the optical sounding instrument
4= NMEA data received from VHF
In the column labeled "Brg" is indicated the bearing of the line, while in
the column marked "Dist mtr." is specified the length of the line in
meters. The last column contains the text that was entered in the "Notes"
field in the "Bearing list" window.
All bearings and / or Lines of Position are saved and available in the
"Bearing list", until are removed by operator. Deletion of data is
performed using the "Delete" function and it can be done without further
verification.
- 97 -
Chapter 4:Navigation
4.4: Anti grounding
When the vessel's speed over ground (SOG) is over 1.0 knots, the system
will oversee a safety zone in front of the vessel and notify all the hazards
objects and areas with special conditions. The angle and extent of this
security zone is set up in the Safe menu.
The vertical menu includes an anti-grounding chart display, showing the
safety zone at all times is fixed to course –up mode.
If any hazards are detected, the following actions are triggered:
l
l
l
l
l
l
an anti grounding alarm starts
the anti-grounding chart will highlight the dangerous chart objects
within the safety zone
the safety zone will be in the main chart display
if the main chart display has been repositioned away from the own
vessel position, the chart center will be moved back to the own vessel position.
if Auto Safe Hazards is set to “Auto On" or “Auto On+Off", then the
Safe Hazards and Shallow Soundings options, in the Chart menu, are
turned on at the first warning, if they were not selected already.
Until the anti-grounding alarm has been examined, the alerted
areas in the safety zone will also be marked in the main chart view.
By entering the alarm list and selecting one of the notifications, a
separate list of anti-grounding warnings is shown. When clicking a
warning in the anti-grounding list, the selected danger zone will be
marked in the chart with red markings, and the chart will center around
it.
- 98 -
4.5: Notifications and alarms
A range of situations will lead to events where TECDIS generates alarms,
warnings or notifications. These alerts are displayed in the lower right
corner of the screen.
All alarm and notification settings that are set in TECDIS Setup, are
set from the tab Specification.
This area contains:
I. a warning field with large text
II. system status field with counters for
alarms, warnings and notifications. In the
lower right corner of the system status
field, the show button gives access to the
complete list of active warnings and
alerts.
The list of active warnings, alarms and notifications shows which notices that require confirmation from the navigator. If there aren't any
active notices in need of confirmation, but an
alarm is still active, this alarm will still be
shown.
If several confirmed alarms are active, the
warning field will show the text ALARMS. When
no alarms are active, and no notices require
confirmation by the navigator, the warning field will be blank.
When several notices require confirmation, they are presented for
confirmation in the following order:
1. Alarms
2. Warnings presented with audible signal
3. Warnings presented without audible signal
Each warning group is sorted chronologically:
Alarms, warnings and notifications are presented in the following manner:
- 99 -
Chapter 4:Navigation
Warning field
Alarm list
Audible
signal
Unconfirmed
alarm
Red background with
blinking text in yellow/black
Red background
with yellow text
Yes
Confirmed
alarm
Red background with yelRed text
low text
Unconfirmed
warning
Yellow background with
black text
No
Yellow background with
black text
No
Confirmed warnNot displayed
ing
Yellow text
No
Message
Black text
No
Not displayed
The colour palette will change when screen is set to dusk and night
mode.
For unconfirmed alarms an audible signal will be presented through the
sound source specified in TECDIS Setup.
Note that it is possibble to activate Standby Mode, if this is marked as
allowed in TECDIS Setup. In this mode, no audible signals will be
generated. A protruding and blinking standby mode window will be shown
in the chart view when Standby Mode is activated.
4.5.1: Confirm alarms and warnings
Alarms and warnings will remain unconfirmed until they are confirmed by
the navigator, and will be visible as long as the alarm and/or warning
state is active.
Notifications require no confirmation by the navigator. Events can be
confirmed one by one separately by clicking the text in the warning field,
or by pressing the space key on the keyboard. If a Furuno RCU-018 or
TECDIS Keypad is connected, events can be confirmed by pressing the
ALARM ACK key.
- 100 -
Several unconfirmed warnings can be confirmed at once by clicking
in the chart view or by pressing the ESC key 3 times on the
keyboard. The first key press will bring up the complete alarm list,
the second key press will confirm all warnings, and the third will
close the alarm list again.
Warnings can also be confirmed from an external alarm central, if
connected. During the installation the technician can configure
TECDIS/TELchart ECS Setup so that the confirmations from the external
alarm central closes only for alarm sound or closes when the alarm is
actually confirmed.
4.5.2: Alarm list
The number of active alarms, warnings and alert messages are specified
in the notification field. By clicking the Show button a window opens with
a list of all alerts, including information about triggered time, alert type
and status.
When the warnings and the alerts are confirmed, they will still be shown
in the list as long as they are active. Some notifications contain detailed
information that is visible when you click the notification list.
For added detail information "Anti-grounding" alert and "Possible danger"
alert show its own list of dangerous objects. When you click on each of the
dangerous objects in the list, its graphic representation is highlighted on
the chart.
When it is confirmed the alarm "Ship CPA" will display the AIS-/ARPA
target window with details.
- 101 -
Chapter 4:Navigation
4.5.3: Alarm texts
Alarm text
Description
! DANGER !
Anti grounding. Click to open list.
Ship CPA
Collision danger. By clicking on the “Ship CPA “ in
alarm list, the AIS / ARPA target window for the
relevant vessel.
Lost CPA
Lost signal for a target that has an active CPA alarm
opens. Lost AIS Lost signals from an AIS targets within
range specified in AIS menu folder.
Point Info
The vessel has reached a WP with a notice before
waypoint /Critical WP.
OFF TRACK
For this route voyage, the vessel has moved outside the
route corridor.
New waypoint, if this alarm is activated.
New WP
Track Control: Alarm for changing course, triggered
when the warnings "Change Course early warning" or
"Change Course LAST warning" are not confirmed.
Last WP
The vessel has reached the last WP in the active route.
Low Speed
The vessel's speed is below the limits set in
TECDIS/TELchart ECS Setup. (Only for Track Control)
Lost Sensor!
Position 1
TECDIS is no longer receiving data from sensor to
Position 1.
Lost Sensor!
Position 2
TECDIS is no longer receiving data from sensor to
Position 2.
Lost Sensor!
Heading 1
TECDIS is no longer receiving data from sensor for
Heading 1. (Only for Track Control)
Lost Sensor!
Heading 2
TECDIS is no longer receiving data from sensor for
Heading 2. (Only for Track Control)
Lost Sensor!
Water Speed
TECDIS is no longer receiving data from sensor for
water speed. (Only for Track Control)
Sensor Error!
Pos.1 Wrong
Datum
Sensor for Position 1 sends a different datum than
WGS84
Sensor Error!
Pos.2 Wrong
Datum
Sensor for Position 2 sends a different datum than
WGS84
Gyros
The course deviation between the sensors Heading 1
difference limit and Heading 2 is greater than the limit set in TECDIS
- 102 -
exceeded
Setup. (Only for Track Control).
Pos sensors
The course deviation between the sensors Position 1
difference limit and Position 2 is greater than the limit set in TECDIS
exceeded
Setup. (Only for Track Control).
MONITOR
TECDIS has lost serial communication with the monitor.
AUTOPILOT
TECDIS has lost communication with the autopilot.
(Only for Track Control)
Danger OBJ
Own /designated object with danger mark in the
security zone.
Chart license
expired Check
license status
Alarm for expired licenses is triggered if more than half
of the licenses have expired for less than 30 days ago.
Check the license status and contact chart provider.
Dynamic
licensing
update
deadline
Only for dynamic licensing. If it's been a long time since
last update, perform an online chart update, and
restart TECDIS.
Only for dynamic licensing. If the credit limit is
Dynamic
exceeded, contact Jeppesen Marine to update your
licensing out of
subscription. Perform an online chart update, and then
credits
restart TECDIS.
ALARM
Other alarm conditions, check the alarm list.
ALARMS
Appears when there are two or more active alarms and
all alarms and warnings have been confirmed.
- 103 -
Chapter 4:Navigation
4.5.4: Warning text
Warning text
Description
The vessel is entering a new area where special conditions applies. Clicking on "new Caution" in the alarm
new CAUTION
list, the danger object is highlighted with red in the
chart.
Lost Sensor!
COG/SOG 1
TECDIS is no longer receiving data from sensor for COG
/ SOG 1
Lost Sensor!
COG/SOG 2
TECDIS is no longer receiving data from sensor for COG
/ SOG 2
Lost Sensor!
Heading 1
TECDIS is no longer receiving data from sensor for
Heading 1
Lost Sensor!
Heading 2
TECDIS is no longer receiving data from sensor for
Heading 2
Lost Sensor!
Water Speed
TECDIS is no longer receiving data from sensor for
water speed
Lost Sensor!
Radar Arpa 1
TECDIS is no longer receiving data from sensor for
Radar Arpa 1
Lost Sensor!
Radar Arpa 2
TECDIS is no longer receiving data from sensor for
Radar Arpa 2
Lost Sensor!
TECDIS is no longer receiving data from sensor for
Radar Cursor 1 Radar Cursor 1
Lost Sensor!
TECDIS is no longer receiving data from sensor for
Radar Cursor 2 Radar Cursor 2
Lost Sensor!
AIS
TECDIS is no longer receiving data from sensor for AIS
Lost Sensor!
Depth
TECDIS is no longer receiving data from sensor for
Depth
Lost Sensor!
Relative Wind
TECDIS is no longer receiving data from sensor for
Relative Wind
Lost Sensor!
Route
TECDIS is no longer receiving data from sensor for
Route
Possible
Danger
Anti grounding. Possible dangerous objects in the safety
zone
Lost backup
link to other
TECDIS
Error in transferring active route between primary and
secondary TECDIS.
Change Course First warning for upcoming course change. (Only for
- 104 -
- early warning Track Control)
Change Course Final warning for upcoming course change. (Only for
- LAST warning Track Control)
Chart license
expiring check license
status
One or more chart licenses will expire in less than 14
days. Check the license status and contact chart
provider.
Dynamic
licensing
update
deadline
Only for dynamic licensing. If it's been a long time since
last update, perform an online chart update, and restart
TECDIS.
Dynamic
licensing
credits low
Only for dynamic licensing. The credit limit is about to
be exceeded, contact Jeppesen Marine to update your
subscription. Perform an online chart update, and then
restart TECDIS.
Missing netw.
connection
(TECDIS Setup
Export IP)
The physical network connection to another TECDIS
device does not work. Check the connection.
Target buffer
use > 95%
Reduce AIS
range
TECDIS receives too many AIS targets, reduce the AIS
area
Target buffer
TECDIS receives too many AIS targets, reduce the AIS
full! Reduce Ais
area
range
Ship CPA
Risk of collision. If CPA alarms are deactivated, a
warning is issued instead.
WARNING
Other warning, check the alarm list.
- 105 -
Chapter 4:Navigation
4.5.5: Text messages
Text message
Description
Refer to paper charts
Unofficial chart is displayed.
Refer to paper charts
or S52 presentation
The chart is not shown in S52 presentation.
AIS range is limited
AIS targets outside the specified range are not
displayed.
Sleeping Ais class B
vessels are hidden
Sleeping AIS class B targets are not displayed.
No alarm raised for lost
Alarm for lost AIS target has been disabled,
close targets
All time limited chart
objects shown
All time-limited chart objects are displayed.
- 106 -
4.6: Past track lines
In TECDIS you can see your past track lines (also
known as a towbar), which displays your voyage
history Past track lines selected with the query
cursor is displayed in red in the chart view.
The Past track menu is divided in four:
The button to open the past track tool/menu is in
the main toolbar. This button gives access to the
past track lines of previous voyages.
l
l
l
l
Primary pos. source gives you control of the
past tracks generated by the primary position
sensor
Secondary pos. source gives you control of the
past tracks generated by the secondary position sensor
Convert past track to route
The Show and Hide button control the display of the tracks you have
selected
4.6.1: Primary position source
The Primary pos. source field enables display of the previous routes (Past
Tracks), from primary position sensor. The selected Past Tracks can be
displayed with name (if previously entered, using the query cursor/chart
inspector) and the performing date.
If the Timemark feature is selected the Past Tracks are displayed
with time indicators. You can set the interval at which these are
displayed next to the checkbox.
Which past track to display in the chart view is selected by setting the
time interval in the date selectors. Here you can set up two independent
intervals. One with the From and To date, and one with the After date
(creating an interval from that date until today).
Alternatively you can select a preset in the dropdown at the bottom of the
date field, with display of tracks from a period of:
l
l
l
a given number of days
a given number of weeks
a given number of months
- 107 -
Chapter 4:Navigation
or you can select All. Time marks are displayed for all visible routes, as
long as only routes from the past month is displayed.
The information field Total displays the number of Past Tracks that appear
for the selected time interval.
The Past Track Select function is used to select and edit (colour change) a
previous track. It can also be used to select a specific track for display
even with a non-specified age.
Activating the colour function is indicated by the cursor changes to an
arrow with a small sheet icon to the edge. Left click with this arrow
positioned over a track, will change its colour (assuming that INT 1 chart
presentation is activated). Right click anywhere in the chart to exit this
mode.
The Past Track Delete function is activated when the cursor changes to a
‘cross’ (same functional behaviour as the Delete function in the past track
menu). Left click with this ‘cross’ positioned over a track to deleted it.
Note that only the tracks older than 90 days can be deleted. Right click
anywhere in the chart to exit this mode.
4.6.2: Secondary position source
The field labelled Secondary
position source enables display of
the previous routes (Past Tracks),
from secondary position sensor. In
this frame the operator can choose
whether the Past Tracks are visible
on the chart and for how long time
they will be displayed (1 or 12 hours). If the Timemark feature is selected
the Past Tracks are displayed with time indicators. You can set the interval
at which these are displayed next to the checkbox.
The Past Tracks from the secondary sensor position are always
displayed in grey.
4.6.3: Convert past track to route
Tecdis has capability to convert a previous track to a sailing route. If Allow
is ticked, a user can select a previous track instead of a route with the
cursor. A new route will be generated following this track. Route accuracy
(WP-density) is governed by allowed max deviation.
- 108 -
4.6.4: Show and Hide buttons
When the Show function is selected, the Past Track lines that match the
criteria in the date fields, are displayed on the chart.
The Show button will appear in the active mode, until the Hide button is
selected in the Past Track menu.
- 109 -
Chapter 4:Navigation
4.7: Maritime calculations
Pressing the Maritime calculations button on the top menu opens the
Maritime calculations window in the lower left corner of the screen.
This window has two functions as selectable tabs;
l
l
a Calculate Tab which is a maritime calculator
a LOP Tab (Lines of Position) which is an interface for entering
manual positions using bearing and/or distance observations
4.7.1: Calculate
In the tab Calculate you can make
maritime calculations based on:
l
l
l
a From position, and
data for Distance and bearing,
or
a To position.
If the To position is known, all fields in the Distance and bearing
field will be filled with correct data when you press the Calculate
button in the area where the data is calculated.
4.7.1.1: Setting calculating position to chart center
The position fields also have a feature where the position is set to the
center of the current chart view. This can be used by pressing:
the Chart Center button in the From field, or
l the Center button in the To field
The position is then set automatically.
l
4.7.1.2: Set a great circle route
In the Distance and bearing there is a selector button for great circle
route (GC) and loxodrome route (RL). The distance values can be specified
either in NM or meters.
- 110 -
4.7.1.3: Calculation of time
In the Time field information about the start time and end time for the
intended voyage is displayed. Here you can set one value manually, then
the second will update itself automatically from the prerequisites of the
voyage.
Time and date values are initially set to the current time and date when
you started the calculating tool.
By entering a value for speed, the sailing time is shown in the field below
Speed. Time- and date fields can be adjusted, and the time/date value
that you have set will be adjusted accordingly to show the correct duration
of the voyage.
4.7.1.4: Datum
The Datum field at the bottom of the calculator makes it possible to
translate both From and To positions between different datum.
The positions in the From and To fields will always be set to the datum
selected in the Datum field directly below. If another datum is selected
with the dropdown menu, the numeric values for the corresponding
position value changes immediately to reflect the changed datum choice.
Some examples of how "Maritime calculations" may be used:
l
l
l
Calculation of a new and unknown position based on the distance
and bearing from a given position. Move the chart center to the
From position by clicking with the middle mouse button with the
cursor over the point on the chart that you want to select as From
position, or place it in by entering values directly in the fields of Lat
and Lon. Select RL or GC in the Distance and bearing field and enter
the appropriate values for distance and bearing. Click on the Calculate button in the To field to calculate the To position.
Calculation of distance and the distance between two points. Move
the chart center to the first position by clicking with the middle
mouse button with the cursor over the desired place, and do the
same with the second point. Alternatively you can enter values directly in the fields of Lat and Lon. Click on the Calculate button in the
Distance and bearing field to calculate both loxodrome/great circle
distance and routed distance.
Calculate the time spent on a voyage between two points in a given
speed. Move chart center to the first position by clicking with the
middle mouse button with the cursor over desired place in the chart
and do the same with the second point. Alternatively you can enter
- 111 -
Chapter 4:Navigation
l
values directly into the fields of Lat and Lon. Add Speed value in the
field Time and the time it takes for a voyage between two points is
shown in the box below.
Convert a position to WGS 84 datum. Choose the datum which the
known position is stated as in the Datum field, and enter position values as above. Change datum to WGS84 in the lower Datum field and
the position is then converted to the WGS84 datum.
4.7.2: Lines of Position (LOP)
If it is determined that both the primary and the secondary position sensor
fails or produces the wrong position, you can take advantage of
positioning based on manual observations and dead reckoning.
In the tab LOP you can determine the
ship's position based on observations
made with Bearings and/or Distance.
The bulk of this tab is set aside for
registration of bearing and distance
observations. Up to three of each can
be recorded on each recording line.
Each entry contains the following
control set and information (from left
to right):
l
l
l
l
l
l
An * button to set a record
A check box to select whether registration should be displayed on
the chart or not
The value of the recorded bearing/distance
Time of registration
Age of the registration
Text that describes the registration (eg. Observational method)
4.7.2.1: Register observations
1. Press the * button on the desired entry line.
2. Place the cursor over the target (the chart object the bearing or distance is measured to) on the chart which is observed, and click the
left mouse button.
3. An EBL / VRM function (electronic bearing line and variable distance marker) is now enabled anchored to the target.
4. The observed value can now be entered into the the small field near
the anchor point (distances are entered in Nm).
5. If a numeric value is not entered, adjust the EBL / VRM so that the
correct observation value is shown on the registration line. For
- 112 -
bearing lines, the line should extend throughout the area where the
ship can be.
6. Press the left mouse button to exit the placing of the observation in
the chart.
7. If the observation was made more than one minute ago, set the
time of observation in the registration line.
8. Write a brief description of the observation in the text box on the
registration line (optional).
When an observation is made, it will appear on the chart, and labeled
with the name and date of observation.
Two versions of each observation will be visible on the chart. The first
version remains where the observations were recorded. The second (bold)
version is tweaked in real time according to current dead reckoning
parameters (course, speed). This ensures that observations made at
different times can be used together to provide a position.
4.7.2.2: Features of the LOP tab
The buttons in the LOP tab works as follows:
The Minimize button minimizes the entire Maritime calculations window,
but retains all the keys for function selection and registered values and
any DR.
The Auto 2xLOP button opens to put out two bearings immediately after
another without having to move the cursor back to the * button in the LOP
tab between the bearings.
The Auto DR button is selectable when the Auto 2xLOP button is selected.
DR starts immediately when the two intersecting bearings are set out in
chart view.
The Extended LOPs option extends the bearing lines to the outside of the
visible map image, regardless of scale.
The Move button allows you to parallel displace a bearing. When the
Move button is active, the cursor placed over the anchor point for any of
the original bearing line (the one that is standing still and is made with
thin line), the end of the bearing line is marked with a circle, and click the
left mouse button .
The Mark EP button manually places an estimated position symbol in the
chart. After pressing the button, the cursor is placed on the chart on the
vessel's estimated position. The EP-symbol can now be placed in the chart
by clicking the left mouse button. The EP symbol is marked with the date
of entry. A window will pop up at the bottom of the screen so that the
- 113 -
Chapter 4:Navigation
operator can enter text that is visible on the chart, and complementing
information that is displayed when viewed with the object inspector. The
EP symbol is stored in the system and can be deleted later using the
symbol editor.
Select EP for DR is used to select one of the previously registered EP
symbols as base for dead reckoning. After pressing the button, place the
cursor on one of the previously mentioned EP marks on the chart and
press the left mouse button. Dead reckoning will now be initiated and the
vessel symbol is moved to the selected position.
The Auto DR button is only available when two or more observations are
made and selected for display. When this button is pressed, the system
will use the top two registration lines to automatically calculate and place
an estimated position symbol. As for the Mark EP button, a window is
displayed so that the operator can enter text that is visible on the chart,
and complementing information that is displayed when viewed with the
object inspector. Dead reckoning is immediately initiated with the calculated position as a starting point.
The DR off button can be used to disable dead reckoning mode and lets
you return to use the position sensor data to position the vessel. But this
presupposes that dead reckoning was initiated from the LOP tab using
either the Select EP for DR or the Auto DR buttons. Note that this button
will be unavailable if both position sensors are lost.
The Reset button removes all observations from the LOP tab and selected
observations from the chart.
Note that when dead reckoning has been initiated using the LOP-tab,
all input from the primary and secondary position sensors are
ignored until dead reckoning is deactivated in the same tab!
Details on using the LOP tab to generate estimated positions and position
observations are logged. To access these logs, use the DR fix button in the
Log menu.
- 114 -
5:
Other functions
In this chapter we will look closer at other tools and functions TECDIS offers.
Her finner du blant annet kartinspektøren, som er det mest alsidige verktøyet i TECDIS.
5.1:Query cursor
117
5.1.1:The chart inspector window
117
5.1.2:Inspecting past tracks, routes, own symbols, etc.
117
5.2:Conning and anchor-watch
119
5.2.1:Conning display for mooring
119
5.2.2:Conning Anchorguard
120
5.3:ARPA and radar targets
122
5.4:AIS - operation
124
5.4.1:Displaying AIS information from other vessels
124
5.4.2:Displaying AIS information from own vessel
126
5.4.3:AIS Broadcast messages
127
5.4.4:AIS direct messaging to selected vessel
127
5.4.5:AIS target list
128
5.5:AIS - vessel monitoring
129
5.6:Tidal information
130
5.6.1:Tides
130
5.6.2:Tidal current
131
5.6.3:Tidal forecast points for ebb and flow
131
5.7:Dead Reckoning Mode
132
5.8:NAVTEX
133
5.8.1:Message types
133
5.8.2:Radio channels
134
5.8.3:Older messages
134
5.8.4:Show messages
134
- 116 -
Chapter 5:Other functions
5.1: Query cursor
The query cursor is a general tool in TECDIS, with multiple functions
depending on which tool you use it together with.
In common for all use areas is that the tool gives information beyond what
is normally displayed. It's name is derived from it's main function - to
display extra information about elements you select with your cursor.
when the query cursor tool is activated, the cursor changes. It now
displays both a cursor and a question mark. Now you can left click any
point in the chart view, and a chart inspector window will appear.
5.1.1: The chart inspector window
While the query cursor is active, a click anywhere in the chart view will
open the chart inspector window at the bottom of the screen. The cursor
position is displayed in the window headline.
The left part of this window will give a list of all chart objects near the
cursor position. The first entry in this list gives details of the chart cell the
objects are connected to. Each entry is marked with a symbol indicating if
the object is a; point, line or a geometric area. Entries that have been
changed or added through chart corrections, will be displayed with
symbols with yellow backgrounds.
By clicking each single entry in the list you will view more information
about that object in the right part of the window, and the object is
displayed with a red contour in the chart view.
5.1.2: Inspecting past tracks, routes, own
symbols, etc.
The query cursor can also be used to inspect own objects added to the
chart view, for example
- 117 -
l
l
l
l
l
past track lines
routes
own symbols
route recording
etc
When such objects are selected, another window (Mariner object) will be
displayed at the bottom of the screen.
Unlike the chart inspector, values in this window can be manipulated/changed. For example you can edit the text displayed in the chart
view for a symbol you have added.
The text displayed in the chart view can contain up to 30 letters.
Added text can contain up to 4800 letters. Own objects containing
additional information is marked with an exclamation mark in the
chart view.
If the Mariner object window is displayed, but you wanted access to the
chart inspector window, you can easily switch by pressing the Chart data
button at the bottom of the window.
JPEG image files on the system hard drive, can be attached to own objects
in the chart. To attach an image you press the Image file button, and
select the image. The text in the Mariner object window will now include
the name of the image file. The image is shown by pressing the Image file
button.
- 118 -
Chapter 5:Other functions
5.2: Conning and anchorwatch
The Conning Display button in the Main Toolbar is used to display a mini
conning image in the lower left corner of the screen. Alternatively an
anchor-watch display can be selected by right-clicking the icon.
5.2.1: Conning display for mooring
By left-clicking the Conning display
button in the main toolbar a mini
conning display is shown.
The feature gives excellent viewing
of
movement
l course
l wind information
that is essential to manoeuvring
when mooring. If placing the pointer
in the conning image, outside the
number areas, left-clicking and
holding will allow you to move the
conning image position to other
parts of the display.
l
The wind direction can be toggled
between the ‘true’ and ‘relative’
mode, by clicking on the wind vane.
When the true wind direction is
shown this is indicated with a "T"
next to wind speed frame and so for
the relative direction with a “R”. The
wind speed can be changed from meters per second (m / s), knots (kn)
and Beaufort (B), by clicking on the wind speed frame.
- 119 -
5.2.2: Conning Anchorguard
By right-clicking the conning
display button in the main toolbar
an anchor-watch conning display is
shown.
The anchor-watch displays
drifting
heading in relation to the
anchor point
l wind information
The Anchorguard feature has the
same functionality as Docking
display in relation to the wind.
l
l
Click the "Reset" button to set the
anchor point ;the current position is
placed in the center of the Circle
"Safe radius" whose size is ajusted
with the slider. Størrelse på sikker
radius-sirkelen settes med skyvekontrollen. Circle radius is read from
the display for maximum drift (max
drift: 1000 meters).
Select the alarm mode with the
slider situated in lower left corner. In the following table the alarm display
modes are presented. The anchor watch functionality has to be
deactivated manually.
- 120 -
Chapter 5:Other functions
Chart view and
the warning
Description
field
Off
"Off" option turns off all Anchorguard functionality and removes any Anchorguard circle from
the chart.
View
“View” option selects a blue Anchorguard
circle in the chart, with a radius having the
dimension displayed in the “Circle“ frame and
so the plotting begins with yellow plot (past positions) in "Safe radius" circle.
Warn
“Warn" option has the same functionality as
the "View" option but is marking with a yellow
Anchorguard circle in the chart display and will
also trigger an yellow visual warning.
Alarm
"Alarm" option has the same functionality as
the "Warn" option, but a red Anchorguard
circle will appear in the chart, in addition to a
visual (red signal) as well as auditive alarm notification.
- 121 -
5.3: ARPA and radar targets
You can connect up to two radars to TECDIS, and display ARPA/radar
targets for both. Display of radar echo and radar cursor is also available.
To activate ARPA/radar targets in the chart view, simply press one of the
two ARPA/radar target buttons on the main toolbar.
These buttons are only available if ARPA/radar targets are received from
the radars.
The help text displayed when you hover over these buttons is the
name set for that radar in TECDIS Setup, and allows for easy differentiation.
1. By left clicking the buttons ARPA and radar targets will be shown in
the chart view.
2. By right clicking the buttons you activate radar echo and radar
cursor. Activation of this will alter the button to be displayed as
shown in the illustration to the left.
All tracked radar targets are shown as
green rings with course vectors.
Deactivated/sleeping radar targets are
shown without the green tracking ring
and vector.
The target ID or name, if available, is displayed in the chart view
when you hover over it with the cursor. Shown ID number is the ID
number from the radar plus 1000 or 3000 for targets from Radar 1,
or plus or 2000 or 4000 for targets from Radar 2.
- 122 -
Chapter 5:Other functions
By clicking on a radar tracked
target, a detailed ARPA target
information window will be
displayed together with CPA information. The tracked target (past
positions) can be saved (click Save
button) or deleted (click Delete
button). The target can be
enabled/disabled by check/uncheck
the Enable box.
The CPA marking is shown in the chart by checking the CPA box. Click the
OK button to close the window.
The behaviour of the ARPA/radar targets is affected by the settingssee
The AIS menu on page 210 the AIS menu tab, see AIS menu.
- 123 -
5.4: AIS - operation
With AIS in TECDIS you get access to displaying AIS targets in the chart
view, expanded vessel information, and an AIS list of all vessels equipped
with AIS within range.
Display of AIS targets is activated by left clicking the AIS button in the
main toolbar.
The AIS list will appear when you right click the AIS button.
When AIS targets are displayed, you also have access to other AIS
features, such as:
l
l
l
l
detailed AIS information from other vessels
detailed AIS information from own vessel
AIS broadcast messages to all vessels within range
AIS direct messaging to selected vessel
To set AIS setting, see The AIS menu on page 210
5.4.1: Displaying AIS information from other
vessels
AIS targets are presented in the chart view as
green triangles. Non-activated targets have
smaller triangles, and no vectors, past track
or name/MMSI number are shown and they
point up in the chart view if information
about course and heading is missing.
Activated targets point in their heading
direction and have past track displayed,
along with heading and course vector. The
points indicating past track are placed with a
1 minute interval.
IF The Ship menu(see page 197)is selected in
the The Ship menu(see page 197), then the
true ship contour is shown for the displayed
targets.
- 124 -
Chapter 5:Other functions
A sleeping/non-activated AIS target can be activated temporarily by
placing the pointer over it. This will also display the vessel name/MMSI
number in the chart view. When the pointer is removed from the sleeping
AIS target, it will again be de-activated and appear as standard for
sleeping mode.
AIS targets are displayed with distance CPA and time CPA on mouse
hover. Note that Danger CPA has to be activated for this functionality to work.
All targets within range can be activated by selecting No Limit in the
dropdown list for Active in the The AIS menu(see page 210). An AIS target
is selected by left clicking it(it will then be marked in the chart view with a
black rectangle), and a window will appear, showing detailed information
about the target, in the upper left corner of the chart view.
If there are several AIS targets in the same
position, as a result of the selected scale
and/or vessel density, click the same position
several times and the ASI window will cycle
between the overlapping AIS targets.
The chosen target can be activated by
checking the Activate box. In addition the
CPA information for the target can be
displayed in the chart view by checking the
CPA box.
- 125 -
Past track can be saved by pressing the Store button, or deleted by
pressing the Delete button.
The Message button gives access to AIS message log for the selected
target and allows sending of new messages to the vessel.
The AIS button expands the information window so that it now also shows
details such as destination, status, vessel type etc.
The AIS target window can be removed form the chart view by pressing
the OK button
5.4.2: Displaying AIS information from own
vessel
Access to own vessel AIS information is
gained by clicking own vessel in the chart
view. This brings up Own Ship AIS data,
with some minor differences from the AIS
target window.
In sted of the buttons for activation, CPA
and past track alternatives, the text Own
Ship AIS data is visible
In addition information such as;
Status
Type
l Destination
l ETA
l Hzd. cargo
l Draught
l Persons
can be changed by pressing the Change
button.
l
l
To change information, simply write in the
new information in the fields and press the Set button. Values that are
changed will appear in red writing.
Notice that earlier saved Destination values are available in the
dropdown menu for easy and quick selection. Draught values larger
than 25,5 meters will be reset to 25,5 meters.
The on-screen keyboard at the bottom of the window can be used, as an
alternative to the regular physical keyboard for data input. To finish and
closing the window without making changes, press Cancel.
- 126 -
Chapter 5:Other functions
5.4.3: AIS Broadcast messages
To send an AIS broadcast message(message to
all vessels within VHF range) or to review
recieved broadcast messages, open Own ship
ASI data(se above) and press the Message
button.
This will open the broadcast message window,
where received messages can be selected for
viewing in the dropdown list at the top of the
window.
A new message is written by pressing the New
button.
When you have inserted your message text,
press Send to send the message.
To confirm that you have received a message,
press the ACK button.
5.4.4: AIS direct messaging to selected vessel
AIS can be used for sending direct messages to
other vessels. The functionality is available
from the AIS window of the vessel you wish to
communicate with.
To write a message to the vessel, press the
Message button to display the message
window. Earlier messages are available for
review through the dropdown list in the upper
part of the window.
A new message is written by pressing the New
button.
When you have inserted your message text,
press Send to send the message. The on-screen
keyboard at the bottom of the window can be
used, as an alternative to the regular physical
keyboard for data input.
Note: messages older than three months, will be automatically
deleted.
- 127 -
5.4.5: AIS target list
To quickly find an AIS target you can use the AIS target list function. This
tool gives you a table of all AIS targets withi n range.
AIS target list is opened by right clicking the AIS button.
The table can be sorted by the following
criteria:
Name (A-Z)
l Distance (closest vessels first)
l CPS distance (closest vessels first)
l CPS time (closest first, grouped so
that all vessels coming towards
own vessel is shown first.
To change which criteria the table is
sorted by, click the heading of the
wanted column. The selected criteria
will be displayed with blue text in the
table.
l
When you have found the vessel you
are seeking, you can show the information in two different ways:
1. Right click on vessel name in AIS target list to open the AIS information window for the vessel.
2. Left click the vessel name in AIS target list to open the AIS information window for the vessel, and display the AIS target centred in
the chart view.
5.4.5.1: Static mode
When you scroll down the list, it will automatically enter static mode. In
that mode only AIS target information is refreshed, not the list itself. The
targets keep their position in the list, and no new targets are added to the
list.
With this functionality you can monitor vessels directly from the AIS target
list for shorter periods. After 3 minutes of inactivity the list returns to
dynamic(normal) mode, and the list is updated as before.
This also happends when you scroll back to the top of the list and when
you press one of the column headers.
- 128 -
Chapter 5:Other functions
5.5: AIS - vessel monitoring
It is possible to configure TECDIS with vessel monitoring via AIS. This
functionality gives you warnings or alarms when the course vector of an
AIS target intersects a line/area in the chart that is marked Danger.
AIS vessel monitoring has to be set up by a service technician.
Contact your TECDIS dealer or direct for installation of this functionality
This function has no user controls and it will remain in same mode until
the TECDIS technician makes a change again.
1. This function is disabled in default setting.
2. When the "Ais vessel watch" is set to “1 “, a warning is displayed if a
vessel's course vector crosses a line or edge of a hazardous area.
The warning is not audible.
3. When the "Ais vessel watch" is set to 2, an alarm is issued when a
vessel's course vector crosses a line or edge of an hazardous area.
The alarm will also be audible.
- 129 -
5.6: Tidal information
TECDIS can use and display tidal information from Jeppesen's Tidal
service. This service gives access to information about the tidal
movements for a large part of the world.
Note: Tides require Professional+ or Jeppesen PRIMAR chart to
function. Contact Jeppesen for information about the coverage in
the Tides service for your voyages.
The tidal information is displayed in a separate
window inside TECDIS. This window is opened
by pressing the Tide button to the right of the
depth sensor display in the TECDIS information
panel.
The tides are displayed for the tidal station
closest to the vessel, or closes to the chart view center if the vessel is
outside the chart view. The tidal information is available independently of
the depth sensor.
5.6.1: Tides
The tidal window gives a graphical display of the tides for the next 24
hours. The name of the tidal window is the same as the name of the tidal
station shown. Time and level of the highest and lowest tide of the viewed
period, along with the current tidal levels are presented in the lower part
of the window.
The time can either be shown in GMT or in local standard time for the
forecast point. Tides for other dates may also be selected for display. By
placing the cursor on the curve in graphic presentation, the corresponding
time and tide levels are displayed with green numeric values in the lower
right part of the notification window.
- 130 -
Chapter 5:Other functions
As long as a tide notification window is opened in the chart, the other near
forecast points are marked in the chart with a yellow symbol. Left click on
the symbol to expose the tide data from that particular forecast point.
5.6.2: Tidal current
In addition, as long as the tidal window is shown in the chart view, yellow
tidal current indicator arrows will be displayed. These arrows reflect the
present direction and speed of the tidal current.
By placing the cursor over one of these arrows a tidal power indicator
window opens, that works in the same way as the tidal notification
window.
5.6.3: Tidal forecast points for ebb and flow
In TECDIS it is also possible to control when the tide changes direction,
through forecast points for ebb and flow. To view this display mode, press
the Flood/Ebb button (if available).
With this functionality activated, the crosshairs for the next flow or ebb is
displayed. The tidal graph displayed will also change shape, and now
displays the difference between the median sea level and the current sea
level. When the crosshairs align with this new tidal curve, the tidal
direction changes.
- 131 -
5.7: Dead Reckoning Mode
The loss of both primary and secondary position activates
automatically Dead Reckoning Mode.
Dead Reckon Mode can also be activated manually by
inserting "Lines of Position"
Data from log and gyro are used when available, or
values must be entered manually.
Position is inserted or updated to the position shown in the center of the
map by pressing the "S" key on keyboard.
- 132 -
Chapter 5:Other functions
5.8: NAVTEX
If a NAVTEX receiver is connected to TECDIS, the Navtex button will be
available on the main toolbar.
First you have to select the NAVTEX stations. This is done from the
overview charts.
Press the Navtex button and the NAVTEX stations are displayed over the
charts in gray. Left click a station to select it. Selected stations are
displayed in blue. TECDIS will only shown information for the selected
NAVTEX stations.
In the NAVTEX window you can select which data to display.
5.8.1: Message types
In the field at the top left you select the message types for display.
Nav.
Navigation warnings
Met.
Meteorological warnings and alerts
Ice
Ice rapports
SAR
Search and rescue, piracy, and armed robbery
information
Other
Other messages (system messages, other navigational aids)
- 133 -
5.8.2: Radio channels
In the mid left field you select which radio stations to retrieve
data from. all frequencies relate to the standard frequencies
as NAVTEX and are given in KHz.
The international frequency is 518KHz where messages in
English is transmitted, while the 490KHz is used for local language transmissions and 4209,5 KHz is intended for tropical waters, but not much
used.
5.8.3: Older messages
In the bottom left field you can set display of:
NEW Only unread messages are displayed
66 hr.
Only messages from the last 66 hours are
displayed
All
All messages are displayed
5.8.4: Show messages
Messages are displayed when you press the entry for that message in the
NAVTEX window. A text field opens to the right in the window, and the
message text is shown.
Messages are closed again by pressing their entry once again.
- 134 -
6:
Chart installation
and maintenance
In this chapter you will find the procedures for installing and maintaining your charts.TECDIS
In this chapter you will also receive important information about chart licenses and chart corrections.
6.1:Installing chart databases
137
6.1.1:Quick installation with Jeppesen SENC charts
137
6.1.2:Quick installation with Navtor Navstick
139
6.1.3:Quick installation with Neptune from Nautisk Forlag
141
6.1.4:Create the User Permit file
143
6.1.5:Standard chart installation with S63 Chart Loader
145
6.2:Updating chart databases
154
6.2.1:Updating charts - Jeppesen SENC
154
6.2.2:Updating charts - S63 Chart Loader
156
6.3:Chart corrections
157
6.3.1:T&P for charts from Jeppesen
158
6.3.2:AIO for AVCS charts
159
6.3.3:Manual chart corrections
163
6.3.4:Update log
168
6.4:Delete chart databases
170
6.5:Chart Licenses
171
6.5.1:View your chart licenses in the TECDIS program.
171
6.5.2:Chart licenses - Jeppesen SENC
172
6.5.3:Certificate for chart providers
173
6.5.4:Dynamic Licensing
176
6.6:IHO Chart library
179
6.6.1:Importing S57 data
180
6.6.2:Delete S57 chart databases
181
- 136 -
Chapter 6:Chart installation and maintenance
6.1: Installing chart databases
Chart databases can be installed in several ways in TECDIS.
Standard method of chart installation is with S63 Chart Loader. All charts
that are compatible with TECDIS can be installed in S63 Chart Loader.
Some charts can be installed easier/quicker in TECDIS, by using our quick
installation:
Charts from Jeppesen (ENC, Primar & Professional+) has quick
installation in TECDIS Setup.
l Charts from Navtor (with the Navstick service) has quick installation
in the S63 Chart Loader.
l Charts from Nautisk Forlag (with the Neptune service) has quick
installation in the S63 Chart Loader.
In the following subchapters you will get an overview of the different
chart installation methods.
l
6.1.1: Quick installation with Jeppesen SENC
charts
If you use charts from Jeppesen C-Map, TECDIS offers a rapid chart installation in the TECDIS Setup program.
This procedure is the same for:
l
l
l
Jeppesen ENC
JeppesenPRIMAR
Jeppesen Professional+
The procedure is as follows:
1. Insert a TECDIS Service Key in an available usb port in the TECDIS
unit.
2. Wait until the text label Servicemode appears in the lower right
corner of the chart view.
3. Exit TECDIS
4. Insert CD or usb dongle with the chart database that you want to
install, in the TECDIS unit.
5. Start TECDIS Setup.
6. Go to the Chart installation/Misc tab.
- 137 -
7.
Press the Copy chart Database to Harddisk button. A new window
appears in SeTECDIStup.
8. Select source(CD, usb dongle) where the chart database you want to
installed is placed. If you use a usb dongle, the chart database has to
be placed on the root folder of that dongle.
9.
Select one of the alternatives install, update, remove or Set as Standard.
l Select install if available.
l Selec
t updat
e if available.
10. Press the Start button to start installation.
11. When the system is finished with the automated part of the chart
installation, a window will appear. Press OK in that window.
- 138 -
Chapter 6:Chart installation and maintenance
6.1.2: Quick installation with Navtor Navstick
If you use charts from Navtor, with the
Navstick service, TECDIS offers a quick
chart installation from the S63 Chart
Loader program.
Before you begin - acquire Cell Permits
Installation of chart with S63 Chart Loader requires Cell Permits for
licensing.
Cell Permits are received from your chart provider. For your chart
provider to give you correct cell Permits you have to prepare and
send your unique User Permit to your provider.
The procedure for preparing and sending User Permits can be
found in the cha6.1.4: Create the User Permit file(see page 143)
crate user permit.
The procedure for installation is as follows;
1. Insert a TECDIS Service Key in an available usb port in the TECDIS
unit.
2. Wait until the Service mode label appears in the bottom right
corner of the chart view, and then you exit the TECDIS program.
3. Insert Navot Navstick in the TECDIS unit.
4. Start the S63 Chart Loader program.
5. Navigate the file structure until you find and select Navstick.
6.
The system automatically recognizes Navtor Navstick. Press the
- 139 -
LOAD PERMITS AND CHARTS button to start loading cell permits
and charts into TECDIS.
7.
The cell permits and charts are now loaded, and a progress window
appears. You can abort the loading at any time by pressing the
ABORT button in the top right corner. In the progress window
information about the chart cells that are loaded is displayed.
8.
When the chart loading is complete, Import Complete is displayed
in the progress window. The window will also display loading
details. The chart loading process is finished by pressing the Return
button.
9. Press the Show README.txt button to read the release notes for
the chart.
10. The loaded charts are now available in TECDIS in a separate chart
database.
Note: The chart loading log has to be inspected when chart loading
is finished. The log contains details of all error messages and
warnings. Read more in the next chapter.
- 140 -
Chapter 6:Chart installation and maintenance
6.1.3: Quick installation with Neptune from
Nautisk Forlag
If you use charts from Nautisk Forlag, with the Neptune service, TECDIS
offers a rapid chart installation from the S63 Chart Loader program.
Before you begin - acquire Cell Permits
Installation of chart with S63 Chart Loader requires Cell Permits for
licensing.
Cell Permits are received from your chart provider. For your chart
provider to give you correct cell Permits you have to prepare and
send your unique User Permit to your provider.
The procedure for preparing and sending User Permits can be
found in the cha6.1.4: Create the User Permit file(see page 143)
crate user permit.
The procedure for installation is as follows;
1. Insert a TECDIS Service Key in an available usb port in the TECDIS
unit.
2. Wait until the Service mode label appears in the bottom right
corner of the chart view, and then you exit the TECDIS program.
3. Insert the usb dongle with the files received from Nautisk Forlag
inthe TECDIS unit.
4. Start the S63 Chart Loader program.
5. Navigate the file structure until you locate and select the usb
dongle.
6. The system automatically recognizes the files from Nautisk Forlag.
Press the LOAD PERMITS AND CHARTS button to start loading cell
permits and charts into TECDIS.
- 141 -
7.
The
charts are now loaded, and a progress window appears. You can
abort the loading at any time by pressing the ABORT button in the
top right corner. In the progress window information about the
chart cells that are loaded is displayed.
8.
When the clart loading is complete, Import Complete is displayed in
the progress window. The window will also display loading details.
The chart loading process is finished by pressing the Return button.
9. Press the Show README.txt button to read the release notes for
the chart.
10. The loaded charts are now available in TECDIS in a separate chart
database.
Note: The chart loading log has to be inspected when chart loading
is finished. The log contains details of all error messages and
warnings. Read more in the next chapter.
- 142 -
Chapter 6:Chart installation and maintenance
6.1.4: Create the User Permit file
If you are using Navtor Navstick or the Neptune service by Nautisk Forlag,
you can use this procedure when creating User Permits for the rapid
installation. The same applies to chart loading in the S63 Chart Loader in
general.
Cell Permits are the chart licenses used for chart cells added to TECDIS in
an S63 chart database.
Before a chart providor can issue Cell Permit files for your S63 chart
databases, a User Permit file has to be created.
The UsTECDISer Permit fTECDISile is unique for each unit, and is
generated by the S63 Chart Loader. In this process encrypted data from
your license key is used.
The chart provider has to recieve your unique User Permit file to create
Cell Permits for your charts.
To create a User Permit, do the following:
1. Insert a TECDIS Service Key in an available usb port in the TECDIS
unit.
2. Wait until the Service mode label appears in the bottom right
corner of the chart view, and then you exit the TECDIS program.
3. Start the S63 Chart Loader program.
4. Go to the Licenses tab.
5.
Press the Generate User Permit button.
- 143 -
6.
A new window appears. Here you need to select where you want to
store the User Permit file. Select the location for the Service
Key.TECDIS
7. Press OK to save the file on the TECDIS Service Key.
8. Close the S63 Chart Loader, remove the TECDIS Service Key from
the unit, and repeat the process on the other TECDIS units.
9. Send all User Permit files to your chart provider together with a confirmation of which chart areas you want Cell Permits for.
Contact your chart provider if you need advice about which chart
areas you should purchase.TECDIS
6.1.4.1: View your User Permit
In the S63 Chart Loader, in the
Licenses tab, you can press the
About button in the bottom left
corner to open a new window with
the User Permit displayed in clear
text.TECDIS
- 144 -
Chapter 6:Chart installation and maintenance
6.1.5: Standard chart installation with S63
Chart Loader
ENC charts are installed in the S63 Chart Loader program. The program is
bundled with all TECDIS installations.
A shortcut to the program is found on the Windows desktop.
If you use charts from one of the following providers, a rapid installation procedure is available:
l
l
l
Jeppesen - chapter 6.1.1: (see page 137)
Navtor (Navstick) - chapter 6.1.2: (see page 139)
Nautisk Forlag (Neptune) - chapter 6.1.3: (see page 141)
Encrypted charts are delivered by chart providers on one or more
CD/DVD-ROM, alternatively on USB sticks. The chart loading process uses
Cell Permits to decrypt chart cells, confirm their contents against the S57
standard, and compile them to SENC format (CM93/3) which is used by
TECDIS to display the charts.
Before you begin - acquire Cell Permits
Installation of chart with S63 Chart Loader requires Cell Permits for
licensing.
Cell Permits are received from your chart provider. For your chart
provider to give you correct cell Permits you have to prepare and
send your unique User Permit to your provider.
The procedure for preparing and sending User Permits can be
found in the cha6.1.4: Create the User Permit file(see page 143)
crate user permit.
6.1.5.1: Adding Cell Permits
The procedure is as follows:
1. Insert a TECDIS Service Key in an available usb port in the TECDIS
unit.
2. Wait until the Service mode label appears in the bottom right
corner of the chart view, and then you exit the TECDIS program.
- 145 -
3. Insert CD/DVD/usb dongle with the desired chart database into the
TECDIS unit.
4. Start the S63 Chart Loader program.
5. Go to the Licenses tab.
6. Press the Add Cell Permits button.
7.
8.
9.
10.
11.
A new window appears. Here you navigate to the location your
chart provider has announced your cell permit is placed. If the Cell
Permit is not in the txt file type, remember to select the correct file
type in the dropdown list to display it. Press OK when the desired
Cell Permit is selected.
Press the Add Cell Permits button again.
If the Cell Permit file contains the identity of the chart provider,
loading of the Cell Permits will start automatically, and you can go
directly to step 12 in this procedure.
If the Cell Permit file does not contain the identity of the chart provider, a dialogue will appear. In it you can select you chart provider
from a list, and press the Select and Continue button.
If the chart provider is not listed, you can use the Use the following
data server code field. Check the box besides it and enter the dataserver code in the field (two digits) and confirm by pressing Select
and Continue.
12.
When all loading has finished a message stating that the Cell Permit
- 146 -
Chapter 6:Chart installation and maintenance
Loading was successful is displayed. Here the number of loaded Cell
Permits is displayed. Press OK to close this message and confirm
loading of Cell Permits.
13. The left field of the License tab will now display details of the
loaded Cell Permits, colour coded by expiry status:
An overview of all Cell Permits installed on the unit is found in the
file Permits.txt in C:\Program Files\TECDIS\S63SYS.
6.1.5.2: Deleting Cell Permits
If you want to delete a cell permit, that is done from the Licenses tab.
Select the cell permit you want to delete, and then press the Delete
Selected Permits button.
6.1.5.3: Adding S63 charts
S63 charts are encrypted and is delivered oin a CD/DVD or can be
downloaded to a usb dongle.
The chart provider delivers two types of chart media: BASE and UPDATE.
If you have received both and you are loading charts for the first time, you
have to add BASE first, then UPDATE, unless another procedure is stated
by the chart providor Forøvrig er det kartleverandørens instruksjoner som
gjelder med hensyn til hvilken rekkefølge UPDATE CD-ROM eller DVDROM er legges inn i.
Note that the first chart loading process with a new chart provider
can be time consuming, and it may even take hours.
Loading of UPDATE media takes less time. For example; loading all
Norwegian ENC cells will take about 30 minutes to 1 hour in TECDIS
(depending on hardware).
Adding an UPDATE CD for the same selection usually takes about
20 to 40 minutes in TECDIS.
Below is the procedure for loading BASE charts.
The procedure is the same for both BASE and UPDATE, and is as follows:
1. Start the S63 Chart Loader program.
2. Insert CD/DVD/usb dongle labeled BASE.
- 147 -
3.
From the tab Load Charts, navigate to the file catalogue My Computer.
4. Double click it.
5. A connected drive (CD/DVD/usb) appears. Double click it.
6.
Now the chart media is being read, and the authenticity information
appear in S63 Chart Loader. Confidence of authenticity decides the
next steps:
A. Confidence of authenticity is high(6-10) means that the source
is secure and no further assessment is necessary. Go to step 7.
B. Confidence of authenticity is medium(4-5) means that the system does not recognize the source as very secure, and the
information stated in grey below has to be considered by the
navigator. If the source is considered safe by the navigator,
you can continue to step 7. If this cannot be considered safe,
please contact your chart provider for further support.
C. Confidence of authenticity is low (1-3) means that the system
recognizes the source as quite unsecure, and the information
stated in grey below has to be considered by the navigator. If
the source is considered safe by the navigator, you can continue to step 7. Hvis kilden vurderes som sikker, kan du gå til
neste punkt i denne prosedyren. If this cannot be considered
safe, please contact your chart provider for further support.
D. If confidence of authenticity is 0, you will not be able to load
the charts. Please contact you chart provider for support.
- 148 -
Chapter 6:Chart installation and maintenance
7. Press the Show README.txt button to read the release notes for the
chart.
8. Start the chart loading by pressing the LOAD CHARTS button.
If the Ignore S-57 Import Errors/Warnings selection is marked,
chart loading will continue automatically independent of the S57
verification and error handling. If any critical errors occur with a
chart in the chart loading, the chart will be discarded. The chart
loader window will tell you that any error messages are logged.
9. If confidence of authenticity is below 6, a dialogue will now appear.
In it you have to confirm that you have performed a manual safety
assessment of the chart source, and that you want to continue. Press
the Yes button to continue installation.
10.
The charts are now loaded, and a progress window appears. You
can abort the loading at any time by pressing the ABORT button in
the top right corner. In the progress window information about the
chart cells that are loaded is displayed.
11. If an error occurred during download this is displayed in a separate
log window. From this window you can select if you want to:
A. load the chart cell despite the warning.
B. skip the chart cell and continue chart loading.
C. Stop the chart loading.
If you are unsure if S57 error messages or warnings affect the
chart validity and/or navigation, you should consult with your
chart provider.
12. When all chart cells are loaded, the program has to update the
chart coverage area, and internal data. In the progress window this
is shown as Finalizing import. This can be time consuming, and
- 149 -
might take up to an hour. It cannot be aborted.
13. When the clart loading is complete, Import Complete is displayed in
the progress window. The window will also display loading details.
The chart loading process is finished by pressing the Return button.
14. The loaded charts are now available in TECDIS in a separate chart
database. TECDIS creates a unique chart database for each chart
provider loaded with S63 Chart Loader. The database is named S63XX, where *XX represents the chart providers Data Server Code.
Note: The chart loading log has to be inspected when chart loading
is finished. The log contains details of all error messages and
warnings. Read more in the next chapter.
6.1.5.4: Review of the chart loading log
1. Start the S63 Chart Loader program.
2. Open the View Logs tab.
3. To the left in the window, a date list is displayed. Select the date in
the list that corresponds to the update you want to review.
4. The S63 chart loading log will now be displayed. The window can be
enlarged if needed.
- 150 -
Chapter 6:Chart installation and maintenance
6.1.5.5: Considering authenticity information
In the authenticity information field, a calculated trust factor is displayed
in the headline. A trust factor of 0-3 is considered low, while a factor of 45 is considered medium. A trust factor of 6-10 is considered high and does
not require any manual consideration/assessment.
If the trust factor(Confidence of authenticity) equals 0. it is not possible to
load the supplied charts. The trust factor is to be used by the navigator to
decide if the chart media is authentic and can be trusted to originate from
the chart provider.
A detailed overview of how the trust factor is calculated and the criteria
for the different assessment points is given in the table on the next page:
Value
Text in the Load
Charts tab
Line 1
Does the chart CD contain a signature for each chart and have
these signatures been verified by the chart loader?
+0
No certificates
verify ENC sigIf the ENCs are not properly signed, the chart
natures, data
CS is not valid according to the S63 standard
authenticity canspecification.
not be confirmed!
+2
If ENCs are signed and this is confirmed with a
ENCs are signed certificate included on the media. This only
with included
confirms that the signature is technically in
data server certi- order. Since the certificate is included with the
ficate.
data, the origin of the data are not independently confirmed.
+4
ENCs are signed
by XXX,
confirmed with
trusted certificate.
If the ENCs are signed by the provider, and this
is confirmed with a preinstalled certificate, the
authenticity of the data is independently
confirmed, and the data can be trusted.
+7
ENCs are signed
by IHO,
confirmed with
trusted certificate.
If the ENCs are signed by IHO and this is
confirmed with a preinstalled certificate, the
authenticity of the data is independently
confirmed, and the data can be trusted.
Explanation
Line 2 Does the chart CD contain a Data Server Certificate issued by the
- 151 -
chart provider?
+0
Data Server certi- The Data Server certificate is not included on
ficate is not
the chart media, and authenticity has to be
provided.
assessed manually
+0
Data Server certificate is
provided, but
does not match
any trusted certificates.
Et Data Server-sertifikat er inkludert på kart
CD’en, men det er ikke identisk med et av de
forhåndsinstallerte og klarerte sertifikater. Ask
you chart provider for a valid certificate, and
install this as described in chapter 6.9.7.
+
Data Server certificate is provided
and matches a
trusted certificate.
Et Data Server-sertifikat er inkludert på kart
CD’en og er identisk med et av de forhåndsinstallerte og klarerte sertifikater. This is an
additional confirmation of the chart media
authenticity.
Line 3 Is the chart provider (Data server code) preregistered in TECDIS?
+0
Data is not
provided by a
known data
server.
+1
TECDIS har liste over kjente S63 kartleverData is provided
andører (Data Server). Kart CD’en er utstedt
by a known data
av en leverandør i denne listen, noe som er en
server.
positiv indikator på ekthet.
Kartleverandøren (Data Server) er ikke registrert i TECDIS. The chart provider has to be
assessed manually.
Line 4 Is a valid IHO certificate included on the chart media?
+0
IHO certificate is
Authenticity has to be assessed manually.
not provided.
+0
IHO certificate is
provided, but
does not match
trusted IHO certificate.
TECDIS finner et IHO sertifikat på kart CD’en,
men det matcher ikke det forhåndsinstallerte
og klarerte serti¬fi-katet. Authenticity has to
be assessed manually.
+1
IHO certificate is
provided and
matches trusted
IHO certificate.
TECDIS finner et IHO sertifikat på kart CD’en
som matcher det forhåndsinstallerte og
klarerte sertifikatet, noe som er en positiv
indikator på ekthet.
Line 5
Additional authentication information that is only displayed if
necessary.
-1
ENC signature
Kart CD’en inkluderer ikke signaturfiler for
- 152 -
Chapter 6:Chart installation and maintenance
-1
files are not
present.
kartene og ektheten av kartdata kan ikke
bekreftes. Authenticity has to be assessed
manually.
ENC signature
file checksums
are invalid.
Kartsignaturens sjekksum er ugyldig. The
signature files might have been manipulated
and unreliable. Authenticity has to be assessed
manually.
- 153 -
6.2: Updating chart databases
Keeping the chart databases updated is the navigators responsibility, to
ensure safe sailing.
Contact your chart provider for more information about how often you
should update your charts, and what chart update services they can
provide for you.
TECDIS offers the following update methods:
1. All chart databases can be updated in the S63 Chart Loader.
2. Jeppesen SENC (ENC, Primar and Professional+) can also be updated
directly in the TECDIS program.
6.2.1: Updating charts - Jeppesen SENC
With charts from Jeppesen (SENC) you have access to chart updates
directly from the TECDIS program.
This chart update can be done without setting the TECDIS unit in Service
Mode.
You can also use TECDIS Setup to update charts from Jeppesen. To
do that, follow the same procedure as for the quick installation, see
6.1.1: Quick installation with Jeppesen SENC charts(see page 137)
There you use the Update function.
Procedure for updating charts from Jeppesen is as follows:
1. In the TECDIS program, open the Setup menu, and select C-Map
chart update in the Chart Utilities dropdown list.
2. A new window appears. Here you can select between three actions:
A. Auto Updating lets you perform an automatic update of the
installed charts. TECDIS will then collect the needed information from Jeppesens server by itself. Go to step 3.
B. Semi Auto chart update lets you perform a semi-automatic
chart update. The system will create order files for the charts
you select, and you can send the files from another computer
to Jeppesen. The answer files are then imported into TECDIS.
Go to step 4.
C. Updating Log Review Updates which gives you an overview of
all changes made to the chart databases. Gå til punkt 5 for
videre prosedyre.
- 154 -
Chapter 6:Chart installation and maintenance
3.
For automatic update do the following:
A. Select the desired chart database from the dropdown list.
B. Make sure Use HTTP Protocol is selected
C. Press the Download Updates button
D. The progress will now be displayed in the dropdown list at the
bottom of the window. A confirmation window appears when
the update is complete. Press OK to finish the update tool.
Repeat all steps under step 3 for all other chart databases.
When finished, go to step 5.
4.
For semi-automatic update do as follows:
A. Insert a TECDIS Service Key in an available usb port.
B. Select the desired chart database from the dropdown list in
the semi-automatic update window.
C. Select which folder on TECDIS Service Key the order files
should be saved.
D. Press the Save order button
E. Move TECDIS Service Key to a computer with email access.
F. Send an email with the order files to [email protected]
G. Updates is an automated service, and C-MAP will reply within
5 minutes. The answer file has to be copied to the TECDIS, so
transfer the files to the TECDIS Service Key and insert it in an
available usb port. In the semi-automatic update window,
select the file location, and press the Get updates from directory button.
H. The progress will now be displayed in the dropdown list at the
bottom of the window. A confirmation window appears when
the update is complete. Press OK to finish the update tool.
5. Close the update window for the changes to take effect.
- 155 -
6.2.2: Updating charts - S63 Chart Loader
For correct procedure for updating charts with the S63 Chart Loader, see
6.1.5: Standard chart installation with S63 Chart Loader(see page 145)
S63!!!!
Updating of charts using UPDATE-DVD follows the same procedure as a
first install of the database with BASE-DVD.
If you are using Navtor Navstick or the Neptune service by Nautisk
Forlag, you can use the rapid installation procedure for chart
updates as well.
- 156 -
Chapter 6:Chart installation and maintenance
6.3: Chart corrections
TECDIS offers several ways of inserting chart corrections.
The general method for inserting elements in the charts is with manual
chart corrections.
In addition TECDIS has three semi-automatic methods for temporary and
preliminary notices from Notice to Mariners:
1. Most chart providers include T&P notices in their ENC charts. It is
however not possible to separate the display of these notices from
the regular chart data. Contact your chart provider for more information.
2. With charts from Jeppesen you get access to T&P as a separate
layer.
3. With AVCS charts from UKHO you et access to T&P as a separate
layer called Admiralty Information Overlay(AIO)
- 157 -
6.3.1: T&P for charts from Jeppesen
In TECDIS you can, with charts from Jeppesen, get access to temporary
and preliminary notices, from Notice to Mariners. This information is
available as a separate layer for the desired Jeppesen database, see
chapter 7.3.2 for more information on layers.
With charts from Jeppesen this functionality is only available from
TECDIS SW ver. 4.7.2.15 and newer.
T&P form Jeppesen is automatically loaded in TECDIS when you load chart
updates.
Open the query cursor and select the chart object you want to inspect. The
selected chart object is displayed in the chart view with a red ring around
it, and a Selected Object window appears, as displayed in the image
above.
By activating Navigational Information Object in the list, the attributes for
the chart object is displayed in the Attribute tab in the window.
Text in the chart view for the different T&P notices are displayed when
Text (other) is selected in the Chart Menu tab.
- 158 -
Chapter 6:Chart installation and maintenance
6.3.2: AIO for AVCS charts
In TECDIS you can, with AVCS charts from UKHO, get access to temporary
and preliminary notices, from Notice to Mariners. This information is
available as a separate layer for the S63-GB database, see 7.3.2:
Selectable layers(see page 194) for more information on layers.
With AVCS charts this functionality is only available from TECDIS
SW ver. 4.7.2.23 and newer. In addition TECDIS AIO Update has to
be installed.
6.3.2.1: Loading AIO
AIO is loaded in TECDIS with the S63 Chart Loader. Follow the same
procedure as for standard chart installation with S63 Chart Loader
The only difference is that when you have selected the correct AIO source
in the file tree, the source is automatically recognized as AIO, and this is
displayed in the name of the installation media:
6.3.2.2: Remove AIO notices
AIO notices can also be removed. This is done in the S63 Chart Loader. To
delete installed AIO notices, a source containing new notices has to be
recognized by the system.
When recognized, the Remove Installed button will become available, as
shown in the image below. You also have to confirm that you want to
remove the AIO notices.
- 159 -
6.3.2.3: AIO: types and display
The AIO service contains four different object types:
Temporary objects
Placed in the chart to mark a temporary
change in conditions affecting navigation.
Preliminary objects
Placed in the chart to mark important
changes affecting navigation, that are either
planned for the future, or are implemented
but with lacking information. It is also used
to alert to changes that are so complex that
new chart editions are needed to give full
information.
ENC preliminary objects
Preliminary notices that are specific to
certain ENCs. Displayed with the same colors
as Preliminary notices, but with “EP” instead
of “P” in the name. Vises med EP i navnet.
No Information objects
Indicates an area on an ENC where there is
no equivalent BA chart coverage of the area.
- 160 -
Chapter 6:Chart installation and maintenance
The AIO objects can be displayed in different manners:
Text
Area box with fill
Area box without fill
These display forms can be combined as you wish, and they are set in the
options-panel in the AIO viewer. Dette styres i AIO-inspektøren. Note that
when details of an AIO notice are viewed, this selected notice will be
shown with all display manners activated and a red additional fill
l
l
røde krysshakkede linjer vises i området
tittelen på AIO-objektet vises med større tekst
Note that AIO objects are only displayed in the charts tey are
specified for. This means that a chart sheet that is in a bigger scale
than the object is scaled for, will not display the object
6.3.2.4: Review AIO information using AIO viewer
When the query cursor tool is used on an AIO object, the AIO viewer is
opened, with a separate window for the different tools and settings for
AIO.
- 161 -
The AIO viewer has several parts:
AIO object list
This list gives an overview of all AIO objects displayed in the current chart
view.
Query chart
This button opens the regular query cursor tool, and allows you to view
information about other objects in the chart that are placed in the same
position as the AIO object.
Detailed view
When you press the Details button, a more detailed view of the attributes
and attached text/images is shown. You cycle between attributes, text and
images by selecting their appropriate tab.
Information/attributes Text
Image
Images can be zoomed in and out on; this is done with the zoom
buttons to the right of the image display.
AIO Status
By pressing the AIO Status button, you will enter the status mode, giving
you information on the current update status of all loaded AIO data. Dette
viser status for når all AIO data sist ble oppdatert.
- 162 -
Chapter 6:Chart installation and maintenance
6.3.2.5: AIO Options panel
Innstillinger for AIO settes fra AIO-inspektøren. The AIO Options panel is
opened by clicking the Options button.
In the options panel you can:
T = Temporary notices
Select which AIO objects to
display
P = Preliminary notices
EP = ENC-specific preliminary notices
N.I. = No information
Select how to display the AIO
see AIO: types and display on page 160
objects
Search for objects/notices
In this field you can enter a search phrase
and search for any AIO notice installed in
TECDIS. Press Enter to start the search.
NB! By entering / in the search field all
installed AIO objects are displayed.
6.3.3: Manual chart corrections
Note: When two TECDIS units are connected, make sure to perform
the same chart corrections on both units
TECDIS has full support for automatic chart corrections, but the manual
corrections functionality is still important, as local report on changes to
charts can be left out of the official Notices to Mariners that are used as
base for the automatic chart update.
- 163 -
An example is that the SOLAS convention requires all charts to be updated
for the planned voyage. Before you plan your voyage it is strongly recommended that both the automatic and manual chart correction functionality is used to keep the chart updated.
6.3.3.1: Display of manual chart corrections in the chart
view
All manual chart corrections are drawn
in the chart with orange markings.
When you use the query cursor to
display chart information in the cursor
position, a Chart Object Inspector
window opens and manual corrections
are shown with yellow markings in the
chart view.
In the field to the right information
about the selected object is displayed.
Every change made to the object is
shown in a separate entry in the list, below the object. By clicking one of
the entries the object is displayed as it was in the selected configuration.
- 164 -
Chapter 6:Chart installation and maintenance
6.3.3.2:
Enter manual chart corrections
The procedure for adding manual chart corrections is as follows;
1. In the TECDIS program, open the Setup menu tab, and select
Manual chart corrections in the Chart Utilities dropdown list,
2. A new window appears. In this window you perform all manual
chart corrections, an you gain access to all previous corrections and
changes to them. The window can also be displayed by using the
query cursor tool.
3.
Press the Create New button
4.
Now a new field is opened, with an object list. Select type of object
from the list. Alternatively you can search in the bottom right
corner of the window.
5. If the object you are adding is from Notice to Mariners, mark this
checkbox now. With it selected the correction will only be displayed
for the active chart.
6.
In the window that appears you have to fill inn:
l Chart database
l Provider
l Name of the chart sheet(source identification code)
l Source information in the Notes field
7. When you have selected the object type in the list, you can press
Continue.
- 165 -
8.
Now a new field opens, for entering positions. Here both longitude
and latitude can be entered by typing or by visual insertion.
9. Press the Continue button.
10.
Now a last field is opened. Here you set values for
l depth
l text information
l min/max scale
11. Finishnby pressing the Save button.
12. Register the name/initials of the navigator that has performed the
correction.
6.3.3.3: Change the correction
1. Open the chart corrections window, and select the chart correction
you want to change. Open the Setup menu tab, and select Manual
chart corrections in the Chart Utilities dropdown list,
2. Press one of the following buttons:
A. The Change Geometry button for changing position data for
the object:
l
The TAB key and Shift+TAB moves the cursor between
lat and lon for a point.
- 166 -
Chapter 6:Chart installation and maintenance
The Enter key sets a new position after the marked position.
l Arrow up and arrow down keys move the cursor
between positions.
l The Insert key inserts a new position in front of marked
position.
l The Delete key deletes the marked position.
B. The Change attribute button to change the attributes of the
object.
l
Select the attribute you want to change in the list, and
insert the desired value in the Value field below. For
some attributes you can select values from a dropdown
list, and some feature a locked selection.
3. When the desired changes have been made, press the Save button.
4. Register the name/initials of the navigator that has performed the
change.
l
Chart corrections can also be selected for changing/deleting by
selection with the query cursor.
6.3.3.4: Delete chart corrections
The remove button deletes the entire update history for the selected
object(s) in a selected chart sheet. The Remove button is found at the
bottom left side of the manual chart corrections window.
This functionality is only available while in Servicemode.
- 167 -
6.3.4: Update log
To see all updates made to your charts, you can review them in the
update log. The update log also logs chart corrections.
1. In the TECDIS program, open the Setup menu, and select C-Map
chart update in the Chart Utilities dropdown list.
2. A new window appears. Here you select Updating Log Review
Updates which gives you an overview of all changes made to the
chart databases.
3.
To see the update log do the following:
A. Select the desired chart database in the dropdown list
B. The field Updates Log now displays a list of all updated that
have been added.
l Name, Status, Number and Date are all shown for each
update.
l The Status column will either contain Accepted or Rejected.
l De oppdateringene som er Rejected har blitt avvist
eller fjernet. If the Remark button is active, an update
note will be displayed by pressing it.
C. The Review field contains a tree structure of all the chart
updates, sorted under the update publisher, chart sheet and
book number where the correction was published
l Under each book number you will find information in
cue-form about all changes objects
l Point objects are marked with a red circle in the charts,
lines are draw in red, and areas are cross-hatched in
red.
l By double clicking on an object in the list the chart view
will move to that object, and it will be marked in red.
l Under each book number you will find information in
cue-form about all changed objects.
- 168 -
Chapter 6:Chart installation and maintenance
Point objects are marked with a red circle in the charts,
lines are draw in red, and areas are cross-hatched in
red.
D. When a new CD from C-Map is isntalled, all previous updates
will be removed.
E. Manual rejection of updates:
l Left click the desired update in the list, and then right
click it. Select Reject Update.
4. Close the update log window for the changes to take effect.
l
- 169 -
6.4: Delete chart databases
Chart databases are deleted/removed in the C-Map Chart Manager
program. This program is accessed by opening TECDIS Setup.
Do the following:
1. Insert a TECDIS Service Key in an available usb port in the TECDIS
unit.
2. Wait until the text label Servicemode appears in the lower right
corner of the chart view.
3. Exit TECDIS
4. Start TECDIS Setup.
5. Go to the Chart installation/Misc tab.
6. Press the Start C-Map Chart Manager button. The C-Map Chart
Manager program starts.
7. Select the database you want to delete by clicking on the entry for it
in the Registered databases table.
8. Press the Unregister database button. The database is now deleted.
9. Close C-Map Chart Manager and TECDIS Setup.
10. Start the TECDIS program.
- 170 -
Chapter 6:Chart installation and maintenance
6.5: Chart Licenses
There are several ways to administrate chart licenses in TECDIS.
Type
Supplier/base
name
Jeppesen
SENC
Jeppesen PRIMAR, These use license keys that are adminENC and Proistered in TECDIS Setup, or in C-Map
fessional+
Chart Manager.
S63
These use Cell Permits for licensing.
Navtor, Nautisk
This is administered in S63 Chart
Forlag, and others
Loader.
These do not use any form of
licensing. The charts are loaded in
S63 Chart Loader.
S57
l
l
Tool
Read more a6.1.5: Standard chart installation with S63 Chart Loader
(see page 145)rmits in chapter Standard chart installation with S63
Chart Loader.
Read more a6.5.2: Chart licenses - Jeppesen SENC(see page 172)
chapter Chart licenses - Jeppesen SENC.
6.5.1: View your chart licenses in the TECDIS
program.
Chart licenses are viewed in TECDIS by going to the menu tabs. Here you
select the Setup menu tab.
There you will find a dropdown list called Chart Utilities. In that list, select
Check licenses.
A new window appears, and displays
a list of all chart licenses entered in
the TECDIS system.
l
l
l
Licenses with a green background are valid more than
14 days beyond today.
Licenses with a yellow background will expire within the next 14
days.
Licenses with a red background are expired.
- 171 -
6.5.2: Chart licenses - Jeppesen SENC
All functionality described in this chapter is valid for chart databases in
the CM93/3 format distributed by Jeppesen(C-Map). For chart databases
in other formats (S63), see chapter6.5: Chart Licenses(see page 171) for
more information.
Licenses for Jeppesen SENC is administered from the TECDIS Setup
program.
6.5.2.1: Adding a chart license
To add a chart license, do the following:
1. Insert a TECDIS Service Key in an available usb port in the TECDIS
unit.
2. Wait until the text label Servicemode appears in the lower right
corner of the chart view.
3. Exit TECDIS
4. Insert CD or usb dongle with the chart license(s) received from
Jeppesen in the TECDIS unit. If you have received a license code
instead of a license file, skip this part.
5. Start TECDIS Setup.
6. Go to the Licenses tab.
1. If you have received a license file, continue to the next step.
2. If you have received a license code, skip to part 10
7. Press the Add license from file button.
8. This opens a new window, where you navigate to the location of the
license file (password.usr). Select the file, and confirm adding it by
pressing the OK button.
9. All chart licenses for all chart databases and all areas included in
your purchased license, is now activated. You have now finished
adding the license. If more licenses are to be added, repeat the procedure.
10. Press the Add licenses manually button.
11. The field to the right og the button is now opened and you can now
set:
1. The chart database for the license you want to add in the
Databases dropdown list.
2. Chart areas for the license you want to add in the Data Set or
Area Name.
12. Enter the received license code in the License String field.
13. Press the All License button.
14. Repeat this process for each chart area and each license code in
each chart database.
- 172 -
Chapter 6:Chart installation and maintenance
6.5.2.2: Administrating the chart licenses
The other functions in the Licensing tab helps you in administering your
Jeppesen SENC licenses.
The Get expired licenses button gives you access to an overview of all
licenses that has expired within a selected date (month and year).
The Licenses list button gives you access to a list of valid licenses, sorted
by chart database.
The License order button gives you access to a tool for easy generation of
a license order summary that you can send to Jeppesen.
6.5.3: Certificate for chart providers
Certificates are used by the S63 Chart Loader to verify signatures and
authenticity of chart cells and chart media.
Two certificates, from IHO and Primar, are preinstalled in TECDIS. If
charts from other hydrographic offices/chart providers are to be
used, it is strongly advised that the certificate from the chart
provider is installed before you start the chart loading process.
S63 Chart Loader requires two files to install a certificate:
a*.CRT certificate file
l a *.txt public license key file
These files should be acquired from your chart provider. They should both
be named with the chart providers name in capital letters.
l
Use the following procedure to load the certificates:
1. Place the certificate files from the chart provider in a TECDIS Service Key and insert it in a free usb port.
2. Start TECDIS to Windows desktop (Service Mode).
3. Start the S63 Chart Loader program.
4. Go to the Certificates tab.
- 173 -
5.
An overview of all installed certificates is shown in the left column. To load
a new certificate, press the Load Certificate button.
6.
A new window appears. Here you select the correct location for
your certificate. At this point it is the *.CRT file you should select.
7. Press the OK button.
8. If the system finds a public license key file in the same folder as the
*.CRT file you just selected, this is installed automatically. If not, you
will receive a message about this, and you have to find the file
manually. If so, repeat steps 6 and 7, but select file type *.txt.
9.
When both files are loaded, and the system recognizes the certificate and public license key as valid, a confirmation is shown.
Press the OK button.
- 174 -
Chapter 6:Chart installation and maintenance
10.
The certificate information is now displayed in the S63 Chart Loader, and
authenticity confirmation remains. When the contents of the
columns Certificate contents and Public key text file match, they are
shown with green backgrounds. A confirmation of 100% match is displayed when the text MATCHES over the columns turn green.
11.
When you are confident of the authenticity of the certificate, either
through the information matching, or through contact with the certificate issuer, you can press the Trust selected button to the left in
the window. By pressing you confirm that the certificate can be
used to approve S63 charts for loading.
12. Press OK
13. The certificate loading is now completed.
- 175 -
6.5.4: Dynamic Licensing
Dynamic licensing function in TECDIS includes full support for "Jeppesen
Marine Dynamic Licensing" for ENC and JeppesenPRIMAR charts in CMAP SENC format.
Dynamic licensing provides a cost effective method to ensure a continuous
ENC chart coverage with minimal administrative costs.
Dynamic licensing is a subscription agreement between the vessel
operator and Jeppesen Marine, which provides instant access to charts
within the subscription limits.
Vessel operator doesn’t supports any cost at the time of subscription to
dynamic licensing. However, the vessel gets immediate access to all
charts within the subscription restrictions, for use of route planning or
actual voyage, without specifying any license codes..
6.5.4.1: Credit Limit
To prevent uncontrolled license costs, the subscription include an annual
credit limit based on estimated annual costs for the vessel. When a chart
is used by TECDIS system, the chart licensing cost is charged within the
subscription and the remaining credit is reduced accordingly.
The credit limit can be extended if necessary.
6.5.4.2: Automatic Licensing
When a new chart is needeed (accordingly with the vessel's voyage),
TECDIS enables immediately a three-month license for that chart.
If the vessel needs again the same chart after this period, a new 3 month
license active. This means that a chart subscriptions is charged from the
time the vessel actually need the chart, with a 3 month license period.
6.5.4.3: Reporting user
The active chart licenses are automatically reported back to Jeppesen
Marine, when "Auto Updating" or "Semi Auto Updating" functions, in "CMAP chart update" option in the "Setup" menu, is used to download chart
updates for ENC or JeppesenPRIMAR-charts.
So, to update a chart is a necessary for the ‘paperless navigation’ and
involves no extra work for the navigators..
- 176 -
Chapter 6:Chart installation and maintenance
6.5.4.4: Billing
Based on the actual chart use, Jeppesen Marine will charge the vessel
operator for accrued chart license.
This can either be done at regular intervals, or when the total outstanding
amount exceeds the credit limit defined in the Subscription Agreement.
All matters relating charts, licensing of charts and chart subscriptions is
between Jeppesen Marine and vessel operator.
6.5.4.5: Use of Dynamic Licensing in TECDIS
After Dynamic Licensing agreement draft between Jeppesen Marine and
ship operator, the function is automatically enabled in TECDIS when then
next chart update is completed.
The chart is automatically licensed within a specified distance from your
vessel. This ensures chart coverage in the vessel's current position and
that the route planning or fake chart requests do not result in Chart
License costs.
The status of the Dynamic
License (credit limit, last
usage report and the next
reporting date) can be
monitored by opening the
"License list" in "Check chart
licenses" option in the "Setup"
menu and click on the dynamic license entry in the list.
Once the credit limit is lower than 200 "credits" or the deadline for the
next reporting is less than 3 days, TECDIS will issue a warning about this.
Lists of chart dynamic license (both reported and unreported) opens the
"C-Map Chart Manager" started from "Chart Installation / Misc" folder in
TECDIS Setup.
6.5.4.6: Adjustment for automatic ENC licensing
Adjustment for automatic ENC Licensing is performed in "License list."
With "TECDIS Service Key" connected, by opening this window is it possible
to adjust the threshold value "Dynamic Licensing Range (NM)" (see illustration above).
- 177 -
6.5.4.7: Route Planning using ENC diagrams
Since only chart within a given distance is licensed automatically in the
default mode, it is possible to plan a voyage, in advance, without being
charged for extra chart license costs.
When it is determined that the voyage will take place, the route should be
checked against the charts to meet the government requirements for
‘paperless navigation’.
“TECDIS Service Key" is required to license a chart outside the parameters
which are set in the "Dynamic Licensing Range (NM)." When "TECDIS
Service Key" is pluged in a USB port, a "Payment" button will be available
in the "Chart" folder in the "Menu" folder. By clicking this button activates
the payment mode.
In the payment mode, all requested
chart cells are licensed, including
outside "Dynamic Licensing Range
(NM)."
A clear warning is displayed on the
screen to show that the payment
mode for the chart opening, is
active.
A route check can now be
performed and all hazards / precautions from the charts will be
displayed. The route can also be
adjusted manually using the charts.
When route check is performed, the
payment mode is disabled either by
clicking the "Checkout" button
again, or by removing the "TECDIS
Service Key".
- 178 -
Chapter 6:Chart installation and maintenance
6.6: IHO Chart library
The Chart library selection in the Chart Utilities opens a chart library
window displaying an overview of installed chart databases in the TECDIS
computer.
By selecting a database from the dropdown list , a list of all licensed
charts is opened, and it is sorted by hydrographic organisations.
Select a chart in the list to get access to more information. This information is displayed in the middle field.
By double clicking a chart in the list, it will be displayed in the chart view
if it is licensed. If own vessel is moving, the chart view will automatically
be changed back to the vessel (unless Auto is turned off)
Note: The chart library only displays the chart databases selected for
viewing in the setup menu tab.
To the right in the chart library window you find the Chart boundaries
function. This draws rectangles outlining the charts in the database for the
selected scale.
The scales match the overview chart scale and the A-G scales on the
main toolbar.
l
l
Licensed charts are outlined with a magenta line
Unlicensed charts are outlined with a black line
The name of the chart is displayed in the bottom left corner of its
rectangle.
- 179 -
6.6.1: Importing S57 data
Note: When two TECDIS units are connected, make sure both units
are updated simultaneously.
An S-57 database consists of datasets (chart sheets). ENC data is sold as
ENC cells in S57 format, and when these are imported to a database, each
ENC cell is converted to a dataset.
This process involves two steps:
1. Verification (validity check)
2. Compilation (convert ENC cell to dataset)
Import of s57 data is done in the chart library. Use the following
procedure:
1. Select chart database in the dropdown list.
2. Click the Import S57 button A folder structure is displayed.
3. Select the drive you want to collect data from in the Import S57
data from.. field. Data is imported to a database named with the
prefix S57.
l If no S57 database exist, a new one
is automatically made. Create a
new s57 database manually by clicking the Create new Database button. You can now enter a name for the new base.
l The S57 database will automatically be added and selected
for display in the Setup menu.
4. When the drive containing the data is selected, the Start button
becomes available. Click the Start button to initiate import. The
data is verified automatically.
If errors occur, am S57 Error Report appears. Here it is shown which
imported file the error applies to, and if the error is critical or noncritical. Files with critical errors are not imported. Files with noncritical errors (potential irregularities of data) can be manually
imported or rejected, by clicking Continue or Skip.
5. The import process can be cancelled by clicking the Stop button. If
the Disable error report option is selected before data import is started, the entire import process goes automatically. S57 import files
with critical errors will be omitted, while files with non-critical
errors are imported.
- 180 -
Chapter 6:Chart installation and maintenance
NB: When using the Disable error report, there is no possibility to
see detailed information about the causes and error of ENC cells
that cannot be imported.
6. An import log will be created. This log can also be viewed by selecting the appropriate dataset in the Chart Library by scrolling down to
the S57 import log in the information field.
7. If there are imported chart updates in S57 format, these can be
viewed in C-MAP chart update, under Updating log - review
updates. Read more in 6.2.1: Updating charts - Jeppesen SENC(see
page 154).
8. 6.2.1: Updating charts - Jeppesen SENC(see page 154)
l 6.2.1: Updating charts - Jeppesen SENC(see page 154)
l 6.2.1: Updating charts - Jeppesen SENC(see page 154)
6.6.2: Delete S57 chart databases
In a database containing imported S57 data is selected in the dropdown
list, the Remove Dataset button will delete the selected chart.
- 181 -
7:
System settings
In this chapter we will look closer at the various system settings that can be set in the TECDIS
program.
7.1:Settings menu
185
7.2:The Setup menu
186
7.2.1:Ship draught
186
7.2.2:Language
187
7.2.3:Time zone adjustment
187
7.2.4:NMEA input status
187
7.2.5:Navigation position offset
188
7.2.6:Chart utilities
188
7.2.7:Installed Charts on the computer
190
7.2.8:Alarm volume
190
7.2.9:Auxilary
191
7.3:The Chart menu
193
7.3.1:Chart information
193
7.3.2:Selectable layers
194
7.3.3:Chart presentation
194
7.3.4:Overview of available chart information
195
7.3.5:Chart data information
196
7.4:The Ship menu
197
7.4.1:Ship symbol offcenter
197
7.4.2:Auto sensitivity
197
7.4.3:Viewing the double circle
197
7.4.4:View vessel contour
197
7.4.5:Course vector
197
7.4.6:ROT curved
197
7.4.7:Auto route activation
197
7.4.8:Wheelover
198
7.5:The Data menu
199
7.5.1:Function
199
7.5.2:Restrict selection - time/area
199
7.5.3:Restrict selection - data type
200
7.5.4:Execute
200
7.5.5:Importing primary and secondary routes
200
7.5.6:Route synchronisation
200
- 183 -
Chapter 7:System settings
7.6:The Log menu
203
7.6.1:Log text
203
7.6.2:Visual Replay
204
7.6.3:AIS ship data
205
7.6.4:Delete Old Log Data
205
7.6.5:Screenshots
205
7.7:The Safe menu
206
7.7.1:Safe, Deep and Shallow
206
7.7.2:Check time and angle (anti grounding parameters)
207
7.7.3:Auto Safe Hazard display setting
208
7.7.4:Camera control (formerly FLIR)
208
7.7.5:Alarm
209
7.8:The AIS menu
210
7.8.1:Display filter
210
7.8.2:Lost active targets
210
7.8.3:Danger CPA all Targets
211
7.9:Monitor calibration
212
7.9.1:Controlling the monitor contrast
212
7.9.2:Check the colours
213
- 184 -
7.1: Settings menu
By clicking the settings menu-button on the main toolbar, a collection of
menu tabs will be displayed in the lower part of the information window.
There are 7 different menu tabs:
Setup
l Charts
l Ship
l Data
l Log
l Safe
l AIS
and only one is shown at a a time. A menu tab is selected by clicking its
tab heading.
l
If you want to hide the Settings menu again, click once on the Settings
menu-button on the main toolbar, or remove the pointer from the Settings
menu area.
- 185 -
Chapter 7:System settings
7.2: The Setup menu
In the Setup menu several generic settings are controlled. The Setup menu
contains:
1.
2.
3.
4.
5.
6.
7.
8.
9.
10.
11.
Ship draught
Language
Time zone adjustment
NMEA input status
Navigation position offset
Chart utilities (dropdown menu)
Chart library field (control which chart databases are viewed and the version number for
the available chart databases)
Alarm volume adjustment bar (only available
when alarm is set to speaker or keyboard in
TECDIS Setup)
Auxilary (dropdown menu):
Scroll wheel zoom
Display help text (see chapter 1)
The dropdown menu chart utilities contains:
1.
2.
3.
4.
5.
6.
IHO Chart library
Manual chart corrections
C-Map chart update
Check licenses
INT-1 Dictionary
Radar overlay setup
The dropdown menu Auxilary contains:
1.
2.
3.
4.
5.
Recalibrate screen
Conning harbour mode
Conning backward mode
Export DB status
F1 F2 key functions
7.2.1: Ship draught
Here you can set a value( with intervals of 0,1 meter) that is between
minimum draught and maximum draught. On system startup, TECDIS uses
- 186 -
the maximum draught as standard, but this can be changed in the Setup
menu to match changes in vessel loading conditions.
There is therefore no need to make changes in the TECDIS Setup program
after loading or unloading the vessel. The value for the draft is used by
TECDIS to interpret sonar data, automatic routing and eventual display in
Conning image.
7.2.2: Language
Standard language for a TECDIS unit is English, which is also consistent
with the language of the Windows Operating System.
But for normal operation of TECDIS it is also possible to switch languages
in the Operator Controls, Tools and menus to Norwegian.
French and German may be available depending on the SW version.
Language can be changed during navigation and will not affect the Chart
Data.
7.2.3: Time zone adjustment
Standard time in TECDIS corresponds to the time received from the GPS
satellites, which corresponds to UTC time.
If a vessel sailing across one or more time zones, the time zone
adjustment is used to adjust the clock shown on TECDIS with + / - ten
minute intervals relative to UTC.
7.2.4: NMEA input status
“NMEA Input Status" button opens a list of:
l
l
l
which ports the various sensor data are retrieved from
what kind of NMEA sentences are used
input description (if entered in TECDIS Setup)
- 187 -
Chapter 7:System settings
The Status column indicates whether the
data is received or not.
This is only a info summary; any changes
to these settings are made in TECDIS
SetuTECDISp
Primary positioning method
In the NMEA Data Input window both
sources for positioning appears, and can
be selected which one shall be primary,
and whether the secondary position is
shown or not on chart display.
In case of failure of the primary source, the secondary source is automatically used.
If the secondary source also fails, the TECDIS system automatically change
to Dead Reckoning Modus (Log+ Gyro). When switching primary position
sensor from position 1 to position 2, COG 1 and SOG 1 will be switched to
COG 2 and SOG 2 in the information panel.
7.2.5: Navigation position offset
The Setting Position Deviation button opens a small
window at the upper right corner of the chart display,
where a fixed value for position deviation can be
entered. The vessel representation will be adjusted automatically when
you change the position deviation value.
In some areas old chart positions are somewhat offset to WGS84 datum. It
is possible to compensate for this type of error at the TECDIS system
entering a position offset.
To close the window and disable the position error, click again on Setting
position deviation. The system will then utilize the primary position
sensor again.
7.2.6: Chart utilities
Most of the functions available in this dropdown list are explained in
chapter 6 Chart Installation and Administration.
They can be found on the following pages:
l
l
Chart library (see page 179)
Manual chart corrections (see page 163)
- 188 -
l
l
C-Map chart update (see page 154)
Check Chart licenses see Chart Licenses on page 171
7.2.6.1: INT-1 Dictionary
When selecting this, you open a dictionary in a new
window, listing INT-1 abbreviations for chart
objects.
7.2.6.2: Radar overlay setup
This option will enable the Radar overlay and display the radar overlay
setup panel.
Note: TECDIS Radar Overlay is made to play against Furuno Radar
FAR-2107/2807 series. Primary TECDIS computer chart, secondary
TECDIS computer chart and connected IP-based collection devices
must be configured with IP addresses in 172.31.xxx IP address space,
to receive data from the radar.
Radar: This value determines the
radar system to be connected. This
number must match "RADAR NO"
value in the Setup menu for Furuno
radar.
Heading (bearing): This sliding-controller is used to adjust the radar orientation relative to the chart display.
Range (distance): This sliding-controller is used to adjust the radar range
so that it matches the chart display.
- 189 -
Chapter 7:System settings
7.2.7: Installed Charts on the computer
Under "Chart Utilities " field in the "Setup" menu folder a list with chart
databases that are installed on the computer is displayed.
Mark with a tick in the box next to the databases which to use.
l
l
l
l
l
ENC: official ENC in C-MAP SENC format
World: non-official C-MAP charts.(CD)
Professional+: non-official C-MAP chart (DVD)
S57: official charts in S57 format
S63: official charts in S63 format
NB! This field does not appear if you only have one chart database
installed.
7.2.8: Alarm volume
Alarm volume is adjustable by sliding controller in the range between 65
to 90 dBA (only displayed when alarm sound is set to PC speaker or
keyboard in TECDIS setup).
It is not possible to reduce alarm volume completely, which would
also be against the certification of the equipment and IMO requirements.
- 190 -
7.2.9: Auxilary
The dropdown menu Auxilary contains the following functions:
Recalibrate
screen
Resets the monitor display to correctly calibrated values.
Conning
harbour
mode and
Backwards
conning
Control commands to any connected Conning display.
Backwards conning is used for a TECDIS unit that is
positioned facing the stern of the vessel, and displays the
vessel up-side-down on the conning monitor.
Export DB
Status
This add-on functionality is only used in agreement with
Telko or Furuno Norway.
F1 and F2
See next section for more information.
key settings
Scroll wheel When the "Scroll Wheel Zoom" check box is enabled, the
zoom
scroll wheel, if available, is used to change the chart scale.
7.2.9.1: F1 and F2 key settings
Selecting this opens the F1 F2 key settings tool.
If a Furuno RCU-018 or a TECDIS Keypad is
connected to the chart system, the operator
will here be able to assign the F1 and F2 keys found on those control units.
The F1 and F2 function keys can be configured as the following:
Function
Description
Chart scale W
1:100M
Set the chart scale to 1:100.000.000
Chart scale W
1:20M
Set the chart scale to 1:20.000.000
Chart scale A:
1:3M
Set the chart scale to 1:3.000.000
Chart scale B:
1:1M
Set the chart scale to 1:1.000.000
Chart scale C:
1:300.000
Set the chart scale to 1:300.000
Chart scale D:
1:100.000
Set the chart scale to 1:100.000
- 191 -
Chapter 7:System settings
Chart scale E:
1:30.000
Set the chart scale to 1:30.000
Chart scale F:
1:10.000
Set the chart scale to 1:10.000
Chart scale G:
1:3.000
Set the chart scale to 1:3.000
Chart content
Show chart content for the current chart view
Chart Basic
Set the chart view to basic mode
Chart selection 1
Set the chart view to user defined mode 1
Chart selection 2
Set the chart view to user defined mode 2
Chart selection 3
Set the chart view to user defined mode 3
ESCAPE function
Emulates the ESCAPE key on the keyboard
Insert manual pos- Allows the navigator to move the chart display to a
ition
specified position
Next menu page
Toggles between the menu pages
Day Dusk Night
Toggles between the day-, dusk- and night monitor
color modes
- 192 -
7.3: The Chart menu
The chart menu is also described in chapter 3.5: Chart presentation(see
page 50).
In the chart menu, you set the configuration for chart presentations, such
as:
l
Which information is displayed in the charts
l
How information is displayed in the charts
l
What additional information layers are displayed in the charts
7.3.1: Chart information
In addition to two predefined chart information
modes, you can select three user definable
information modes. In the second lowest field
of the chart menu you select between these 5
information modes:
l
l
l
B (base) gives a chart with a minimum a
visible chart objects and configuration
options.
S (standard) gived the same chart view
as STD mode, but with full display of
dangers, and all dangers within the
safety contour.
The modes 1, 2 and 3 gives the user
access to setting display of chart objects.
Do this by checking the box besides each
entry.
Read more about the chart information in chapter 7.3.4: Overview
of available chart information(see page 195).
- 193 -
Chapter 7:System settings
7.3.2: Selectable layers
Some chart databases contain
information in selectable layers.
These layers are accessed for
display by pressing the Layers
button in the chart menu. This opens
a new window with selectable
layers. At the top of the window you
select the database you want to
activate/deactivate layers for.
The layers that are available is as follows:
S63(GB) PRIMAR
Temporary and preliminary
notices
Admiralty Information Overlay
x
ENC Professional+
x
x
x
Improved background and
overview charts
x
x
C-MAP Tides
x
x
GMDSS areas
x
x
SAR regions
x
x
Terrain data (gridded)
x
x
Piracy information
x
x
Listen over er ikke uttømmende, og det kan være andre lag tilgjengelig
for din TECDIS installasjon.
7.3.3: Chart presentation
In the field at the bottom of the chart menu tab you can select between
S52 and INT1 chart presentation.
With INT 1 selected, a warning will be shown, stating: Not official view
With the arrow buttons to the right of INT 1, you can adjust the size of text
and symbols. The magnification factor is displayed besides the arrows. Se
kapittel 4.7 for mer informasjon og illustrasjoner.
- 194 -
7.3.4: Overview of available chart information
Function
name
Description
Text (standard)
When enabled, displays all the standard text in the chart
as countries, cities, islands, and other place names.
Text (other)
Shows chart view informations other than that referred to
above.
Full hazards
display
Shows the hazards placed (displayed) within safety
contour and the isolated dangers placed outside the safety
contour, which are deeper than "Safe" depth.
Shallow
soundings
Shows soundings shallower than "Safe" depth.
Deep
soundings
Shows soundings deeper than "Safe" depth.
All depth
contours
Shows all depth contours, even within the safety contour.
Hazard
symbols
Sets the rule that all obstacles shallower than safety
contour will appear with a special UNDERWATER HAZARD
symbol.
Cables and
pipes
Shows registered cables and pipelines.
Bottom type Shows information about bottom types.
Grid
Shows information about chart grid.
Lights
character
Shows light character information in the chart. NB: some
lights, for example those with periods longer than 15
seconds, are accompanied with text instead of active
blinking.
Light cursor
info
Shows lights character information in a textbox when the
cursor is placed over a light.
Active lights
Shows lights blinking with right sequence and color, as
seen from own vessel.
Active lead
sectors
Extension of lead sectors ( covering the vessels current
position ) out from the light
Small
Shows useful information for light and small vessels, such
vessels/boats
as port info etc.
info
Simplified
symbols
Shows simplified S52 standard chart symbols. ( not INT 1)
- 195 -
Chapter 7:System settings
Chart
Quality
Labels
Shows labels for quality on chart.
Simple
border
drawing
In the chart, shows all lines and boundaries as simple
lines.
National
name
Show the location names in the language the chart was
produced in.
Additional
info «!»
Marks objects in the chart, with “!”, where additional
information is available.
All timelimited
Showing all temporary, periodic or otherwise time-limited
chart objects, with no link to the current date / time.
7.3.5: Chart data information
By clicking on “?” -down in the left
corner in the “Chart” menu folder, a
new information window is open.
There is a tab (folder) for each
available chart on display. Area
corresponding to each chart is
shaded in red on the display.
IHO presentation library version
number is displayed as standard text
on window’s title bar. (here: "Chart
legend, preslib v3.4")
The version number of the chart
core of TECDIS is also displayed
(CMap v5.2.1.23), and your version
of the TECDIS program (4.7.2.23).
The chart database the chart you
are viewing belongs to is shown at
the bottom of the list (here: ENC).
- 196 -
7.4: The Ship menu
7.4.1: Ship symbol offcenter
Here you define how much of the charts are to
be displayed in front of the vessel when in Auto
Mode.
This functionality is only available while in Auto
mode.
7.4.2: Auto sensitivity
Here you adjust the sensitivity of the automatic
chart redraw
7.4.3: Viewing the double circle
With this selected the own vessel position is
displayed with a double circle in the charts.
7.4.4: View vessel contour
With this selected, the vessel size displayed in
the charts are relative to the chart scale and
zoom level.
7.4.5: Course vector
Indicates the vessel course and speed in the charts, by a dotted line in
front of the vessel. In the dropdown list you select how many minutes of
travel at the current speed the line should reach. The end point of the line
is where the vessel will be after the selected time.
7.4.6: ROT curved
When this is selected, the course vector is drawn as an arc when the
vessel is approaching a waypoint with a course change and wheelover is
set to a different value than 0.
7.4.7: Auto route activation
Automatically activates the new route. If conbined with Allow route activation entry lane in TECDIS Setup, a route leg will be placed between the
new route and the vessel position as well. Default setting for this option is
off. Read more about route activation alternatives in chapte4.1: Route
planning(see page 63)route planning.
- 197 -
Chapter 7:System settings
7.4.8: Wheelover
Indicates at what distance from the next route leg a new rudder angle
should be given. This is an important setting for correct Track Control turn
behaviour.
Select "---" to disable the Wheelover view.
- 198 -
7.5: The Data menu
Backing up own data is very important.
Individual data important to keep are: routes,
tracks, symbols, information and lines / areas.
The data backup is done by copying data to
hard drive / CD or memory stick for safe
keeping. It may also be necessary to copy data
from one machine to another, both for backup
and daily use.
Det kan også være aktuelt å kopiere data fra en
maskin til en annen, både for sikkerhetskopiering og daglig bruk.
7.5.1: Function
In this field, select the function that is used to
copy own data to or from the file on hard disk
/CD/ memory stick.
You have the following options:
l
l
l
l
l
Copy out to file
Copy in from file
Copy to TECDIS 2*
Copy to TECDIS 3*
Delete
* This alternative is available if configured in TECDIS Setup. The
name label is the same as the entered name label in TECDIS Setup.
NOTE: To copy to other TECDIS units, the IP address and name for
the units must be configured in TECDIS Setup.TECDIS
7.5.2: Restrict selection - time/area
In this field you can specify what data to be copied in to/out of TECDIS.The
field is dynamic and changes according to selected function in the field
above.
- 199 -
Chapter 7:System settings
The All option includes all relevant data. For some functions you can also
restrict the data selection with a from-date.
The Limited area option includes all data within a rectangle. You will be
prompted to draw the rectangle in the chart view after this option is
selected.
If data from TECDIS vers 4.7.1.10 or earlier has been stored or
copied out / in, then the box for Old Format must be selected for the
data to be read it by the newer version of TECDIS SW. The wrong
choice in this box will result in an error, and should be changed
before retry.
7.5.3: Restrict selection - data type
You can now select which data you want to copy in/out of the TECDIS unit.
7.5.4: Execute
When you now have selected the function you want to use, and added
restrictions if needed, you can start the copy process.
To start the process, press the Execute button at the bottom of the Data
menu tab. A save/open dialogue opens and you can select the file destination you want, and finish the process.
7.5.5: Importing primary and secondary
routes
Primary and secondary routes are automatically available for the other
TECDIS unit (when they are connected to each other).
This is described in chapter 7.5.6.1: Manual route synchronisation(see
page 201).
7.5.6: Route synchronisation
TECDIS can transfer routes from primary to secondary TECDIS unit and
vice versa, in two different ways. Both methods allows the operator to
retrieve a planned, active route (for the current voyage) on the secondary
TECDIS unit if the primary TECDIS unit fails. For this to work the following
must be ensured:
- 200 -
1. The TECDIS Setup field Data Export IP must contain the IP address
of the other TECDIS unit.
2. TECDIS units must use the LAN adapter, intended for TECDIS network and both devices must be connected to a network switch. NB!
NB! Do not use crossover cable directly between TECDIS units.
3. LAN adapter used for connecting the TECDIS units should not be
reconfigured to use an IP address outside the 172.31.xxx.xxx /
255.255.0.0 subnet.
4. For the replication to work the TECDIS unit has to have different
license dongles (eTokens).
NB! The method for Automatic Route Transfer is pre-installed on
TECDIS units manufactured after November 1, 2008. It is not
possible to activate route synchronisation on more that two TECDIS
units at the same time.
7.5.6.1:
Manual route synchronisation
When the manual synchronisation is used and a route is active on one or
both TECDIS units, a backup route is copied to the other TECDIS unit. This
backup route is not automatically included in the route list on the
receiving TECDIS unit, but it can be imported, when needed.
The following routes can be imported from the Data directory (C: \
Program Files \ TECDIS \ Data):
Primary route ReceivedPrimaryRoute.lst
Secondary route ReceivedSecondaryRoute.lst
To import a route, select Copy IN From File in the function field, and press
the execute button. The open dialogue now opens, and you can select file
type and location.
l
l
Select Import data file type and then select ReceivedPrimaryRoute or
ReceivedSecondaryRoute from the File name field.
7.5.6.2: Automatic route synchronisation
When Automatic Replication is enabled, then all the new routes, changing
routes and routes deleted automatically, are reflected to the other TECDIS
unit. The result is that the routing databases are identical on both TECDIS
units. Resultatet blir at rutedatabasene blir identiske på begge TECDIS
enhetene.
Activate automatic replication
To enable Automatic Route Replication, do the following:
- 201 -
Chapter 7:System settings
1. Verify that the requirements for this feature are met in accordance
with the above list.
2. If there are routes on both TECDIS units, choose on which TECDIS
unit the routes should be preserved and on which TECDIS unit the
routes will be deleted.
3. Insert service key on both TECDIS units and shut down the chart program to return to Windows.
4.
Run C: \ Program Files \ TECDIS \ Replication.exe on both TECDIS
units.
5. On the TECDIS unit with the routes that should be retained, select
Retain routes on this TECDIS and activate replication and press the
Execute button.
6. On the TECDIS device which routes should be removed, select
Delete ALL routes on this TECDIS and activate replication and press
the Execute button.
7. Remove the service key from both TECDIS units and reboot the systems.
After both TECDIS units are again operational, all the routes from the unit
where the routes were kept will be automatically transfered to the other
TECDIS unit. All further route changes will automatically be reflected to
the other TECDIS unit.
Disable Automatic Route Replication
To disable Automatic Route Replication, do the following:
1. Insert service key on both TECDIS units and shut down the chart program to return to Windows.
2. On both TECDIS units; delete the C:\Program Files\TECDIS\SetRtReplicateActive.txt file.
3. Remove the service key from both TECDIS units and reboot the systems.
- 202 -
7.6: The Log menu
TECDIS stores data for position, course and
speed of a vessel, ARPA and AIS targets, every
minute. History from a specified date can be
displayed in several ways.
7.6.1: Log text
In the Date dropdown list you can select the
date for the log you want to review.
"20 min" button opens a list of position, course
and speed for every twenty minutes for the
date selected in the upper field.
"Noon" button opens a list of position, course
and speed for each hour, from 12.00 the
previous day to 12.00 the day selected in the
upper field. For every 4 hours is displayed
sailed distance ("Distance Watch"), and on the
bottom appears total sailed distance("Distance
total").
"Details" button opens a window with a detailed log of the hours,beginning with the time set in "00.00" field.
The log contains detailed information for every minute, of vessel's
position, course and speed, on the chart display that is used:
the chart center and the scale are represented by a cross if:
Auto Mode was active
the type of chart used (" ENC "," S52 ")
l if the Primary Position Source was used (" PRI ");
l if the GPS position encoder was ok ("X");
if the position was corrected manually, it is shown on a separate, third line
("Offset") Se illustrasjon.
l
l
"12.t ENC" button shows what kind of chart data has been displayed on the
screen, every minute in the last 12 hours.
- 203 -
Chapter 7:System settings
“DR fix "button is active and selectable if L.O.P. functionality was used to
determine the position on the selected date. Clicking the "DR fix" button,
opens a log of completed performed positional decisions, with all
associated observational data. All log files can be saved or printed.
7.6.2: Visual Replay
"Replay voyage" button opens a
"Replay" window where earlier
voyages log data can be simulated
on the chart showing own ship, AIS
and Arpa Target position for the
date and time specified.
"Show Positions" button, opens the view of the situation on the chart, as it
was at the chosen time.
"Start" button starts replaying the situations, as specified in the log, with 1
minute interval.
"Use DR" option allows Dead Reckon Mode for positions between each
saved minute and vessels will be shown with new calculated positions
every second. Replay speed is set with the slider at the bottom of the
window.
Click on "Replay voyage" button again to stop the playback of a certain
earlier plot and return to the present situation.
- 204 -
7.6.3: AIS ship data
"Query AIS database " button opens up the possibility to make queries
against a vessel database where all previously received AIS targets are
stored under a name and registered with MMSI, IMO, Call Sign, and date
of last reception from the vessel.
Enter the name of the vessel when the window is opened, then click on the
"Enter" button.
Last date for stored location is displayed on the Date button. Clicking on
this button the situation is displayed on the chart and "Replay" window
opens automatically.
Replay of the situation can also be started from the "Replay"
window as described in Visual Replay (see page 204)
Click on "Query ais database " button again to close the "AIS database"
window and return to the present situation.
7.6.4: Delete Old Log Data
"Delete old data" button deletes log data older than a year if the deletion
is confirmed in the subsequent "Delete log files older than one year"
window.
7.6.5: Screenshots
Display screenshots from TECDIS can be generated at any time by
pressing "Ctrl" + “Alt” and "PrtScrn" buttons simultaneously or “AltGr” and
“PrintScrn”.
A copy of the screen is automatically saved with a file name that is
generated from the year-month-date-time-second (YYMMDDHHMMSS),
and is available in "C:/ Program Files / TECDIS / Screens" file.
- 205 -
Chapter 7:System settings
7.7: The Safe menu
From version 4.1.7.15 of TECDIS it is no longer possible to set an
alarm sound for Restricted, Caution and/or Potential danger.
In the Safe menu you set the safety settings in TECDIS. Among others it is
here you adjust the different depth contours that are always shown in the
charts, and select settings for hazard display and anti grounding.
7.7.1: Safe, Deep and Shallow
In the chart view you will always see four depth areas with depth
contours:
All areas in the chart shallower than
the safe depth are marked in blue,
and the contour is highlighted.
Safe
Safe dpt
All areas outside the depth contour
for safe depth is considered safe
waters by TECDIS.
An anti grounding alert will sound if
the vessel safety zone crosses the
depth contour for safe depth.
All areas in the chart that are shalShallow lower than the shallow depth are
Shallow
marked in dark blue. Shallow depth
can be used to separate shoals within
the safe depth zone.
Deep
Deep
All areas in the chart that are shallower than the deep depth are
marked in a light grey-blue color.
All areas in the chart that are deeper
Not
than the deep setting. Marked in a
defined
lighter gray-blue color.
l
l
The value of the Safe Depth field can be set manually, but now
lower than the Draught Max or Safe Depth Min values in TECDIS
Setup.
Deep and shallow can be changed freely.
- 206 -
When you start TECDIS the system automatically checks for the set
Draught Max and Safe Depth Min values.
If either of these values are higher than the Safe Depth setting in
the Safe menu, that Safe Depth value will be changed to the highest
value.
In charts without the selected safe depth contour, the next deeper
contour is displayed. Some chart areas can contain incomplete data,
and even though non-closed contours can be displayed on the charts,
they can not be used as safety contours.
7.7.2: Check time and angle (anti grounding
parameters)
The specified values set a safety zone ahead of the vessel where
dangerous objects will generate an alarm.
See chapter 4.4: Anti grounding(see page 98) for details.
- 207 -
Chapter 7:System settings
7.7.3: Auto Safe Hazard display setting
The Auto safe hazard display
settings determine how TECDIS
displays danger objects within the
safety contour during anti grounding
alarm situations.
When an anti grounding alarm
situation occurs this setting will
determine if Safe hazard display and shallow soundings 7.3: The Chart
menu(see page 193) is to be activated or not.
The available settings are:
Disabled
The selections for Safe hazards and Shallow Soundings
in the chart menu determine the hazard display.
On (recommended)
The display of Safe hazards and Shallow Soundings are
activated when an anti grounding alarm occurs, and
requires manual deactivation when the dangerous
situation is passed.
On and Off
The display of Safe hazards and Shallow Soundings are
activated when an anti grounding alarm occurs, and
are automatically set back to their previous setting
when the dangerous situation is passed.
7.7.4: Camera control (formerly FLIR)
When Camera Control is activated in the Safe
menu (Installation of Camera control in TECDIS
Setup is required), a CAM symbol is shown at the
end of a 0,5 NM long vector originating in the
Conning position.
The operator can control the camera by placing
the cursor over the CAM symbol and right click.
The appearance of the CAM symbol changes, ant
it is now highlighted. It will now follow the cursor
movements in the chart, and the camera unit
itself will be moved.
- 208 -
The camera can now be locked at a fixed
position in the charts, such as to a reef or a
light, by placing the CAM symbol in the
desired position and right clicking.
In addition the CAM symbol can be placed
over an ARPA or AIS target, and will then both
lock on to and follow the movements of the
target.
7.7.5: Alarm
The operator can choose some of the alarm functions. See chapter 4.5:
Notifications and alarms(see page 99) for a more detailed descriptioin of
the alarm system.
Function name
Description
This mode is only available if made so by a service
technician.
Standby mode
New WP/CTS
When this option is selected no
audible alarms will be
triggered. It is displayed with a
large warning notice in the bottom right part of the
charts.
When the vessel is approaching a new waypoint (WP)
on active sailing route, an alarm is triggered when
the wheelover line is crossed.
When ENC charts are available, Anti-grounding
System and Route Check will always verify ENC data.
By selecting this option it is possible to verify
unofficial chart data, if there is no ENC chart
Non-ENC dangers
coverage in the control area.
When this option is enabled, the Route Check will
trigger an alarm both from ENC and unofficial chart
data.
- 209 -
Chapter 7:System settings
7.8: The AIS menu
7.8.1: Display filter
Function Description
Range
Active
All AIS targets outside this specified
range is filtered from the chart view.
Filters which AIS targets are shown
as active, based on the distance to
own vessel. This makes it possible to
view all targets with course, COGvector and past track line.
In INT-1 presentation mode the
vessel name will also be shown. To
remove the distance limit and
display all AIS targets, select No
limit.
Track
Track specifies the length of the past
track lines for the AIS targets. It is
specified in minutes of travel.
Hide
class B
Removes the display of all class B
targets from the chart view.
Sets all AIS target COG vectors to be
Relative
relative to own vessel movement. If
course
not selected, targets use true course
vector
for the COG vectors.
7.8.2: Lost active targets
AIS targets within the range specified in the Area field is marked
with a black cross when the target data ends.
If Alarm when lost is enabled, this will also provide an alarm.
- 210 -
7.8.3: Danger CPA all Targets
AIS targets which are within the range specified in the Distance field from
own vessel future position and within a time frame specified in the Time
field, activate a Ship CPA alarm.
Raise CPA alarm is always selected, and cannot be changed by the
operator. Contact a certified service technician to make this setting
user changeable. If Raise CPA alarm is off, a warning message will
be displayed continuously in the lower right corner of the chart
view. This mode can be used when navigating confined waters
where the CPA alarm is triggered very often.
If Show danger CPA pos. is selected the there
are displayed continuously graphic symbols for
all dangerous AIS targets. Hazardous targets
are shown on the chart, regardless of AIS /
ARPA functions settings, and they appear in red
until the danger situation is cleared. When
Show Dangerous CPA pos. is selected, the CPA
is continuously displayed with a small green
circle on its course vector and with a little
green square on a crossing vessel's heading vector.
If TECDIS loses the signal from a vessel that have an active CPA alarm, a
new alarm will be activated: Lost CPA (a dangerous vessel has disappeared from the system). For further description of AIS and ARPA functionality see see ARPA and radar targets on page 122Asee AIS - operation on
page 124AIS.
- 211 -
Chapter 7:System settings
7.9: Monitor calibration
All information in an electronic chart system has to be clearly visible. To
ensure this the monitor has to be adjusted to display correct colours. This
especially important for night view mode, when the monitor luminance is
reduced.
Remember to test colours with dusk and night modes, not only day
mode!
ECDIS test images for monitor calibration is placed in the IHO presentation library. Open the library by pressing Control + Alt + Shift + T, and
navigate to the test images by pressing A, B, C, D, E or T keys on the
keyboard.
7.9.1: Controlling the monitor contrast
TECDIS monitors are not to be adjusted with the monitor keys when used
with an ECDIS system. All contrast and luminance settings are to be
performed from the TECDIS through the serial connection to the monitor.
Control the monitor contrast and luminance by
opening test image E, and verify that the grey box is
visible.
Background lumination is now controllable with a
sliding controller that appears below the
day/dusk/night dropdown field in the main toolbar.
This controller gives a green calibrated indicator at
different luminance levels for day/dusk/night. Outside
the calibrated values a red indicator is shown.
The monitor backlight setting can also be set with the
AC Rain controller on the Furuno RCU-018 (if connected).
- 212 -
7.9.2: Check the colours
Check the colours produced by the monitor by opening the T test image.
This is a colour test diagram. Check that all diagonal lines are clearly
separated from the background:
l
l
l
l
l
l
3 yellow diagonal lines
4 orange diagonal lines
3 magenta diagonal lines
4 green diagonal lines
3 blue diagonal lines
3 grey diagonal lines
Control the visibility of each color in the test diagrams A to E. If the
monitor fails this test, it no longer satisfies the color calibration requirements for the use of ECDIS and must be evaluated by qualified personnel
to be adjusted, repaired or possibly replaced.
NB. If the monitor settings have been changed manually in the
monitor's Setup Menu, or to make sure that the correct values are
used, recalibrate the screen. This can be done from the Setup menu,
by going to the Auxiliary dropdown menu and selecting Recalibrate
screen.
- 213 -
This blank page is automatically inserted where appropriate to ensure that
new Chapters begin on a recto page.
dix A:
TECDIS Setup
In this chapter we will look closer at the system settings that are only available in TECDIS Setup.
A.1TECDIS Setup at a glance
217
A.2Service mode
218
A.2.1Entering service mode during system startup
218
A.2.2Entering service mode when TECDIS is running.
218
A.3NMEA Data
219
A.3.1NMEA Input
219
A.3.2NMEA Output
224
A.3.3Supported NMEA sentences
225
A.4Vessel settings (Specification)
227
A.4.1More about restoring saved default values
230
A.4.2More about T-setup/TSZ files
231
A.5Chart installation/ Misc
A.5.1More about Monitor Calibration
A.6Licences
232
233
235
A.6.1System licenses (TELcahrt License)
235
A.6.2Jeppesen licenses (C-Map License)
236
A.7Track Control - Settings
239
A.7.1The autopilot field
239
A.7.2The Startin Requirements field
240
A.7.3The Default values new route field
240
A.7.4Other settings
240
- 216 -
Appendix A:TECDIS Setup
A.1 TECDIS Setup at a glance
TECDIS Setup contains the most important settings in TECDIS.
These settings are divided in to 4-5 tabs, depending on the system add-ons
you have purchased.
NMEA Data(see page 219)
Here you set all in and output sensor settings. These are sent as NMEA
sentences over either comports or an IP network.
Vessel settings (Specification)(see page 227)
Here you set the vessel size and sensor placement.
The only setting the user should set is Allow route activation entry
lane. All other settings are to be set by certified service technicians
only.
Chart installation/ Misc(see page 232)
From this tab you can maintain your chart database if you use charts from
Jeppesen.
Here you also check the monitor calibration status.
Licences(see page 235)
From this tab you can administrate your licenses, both for charts and
purchased add-ons.TECDIS
Note that only Jeppesen chart licenses are administrated from this
tab. Licenses for other chart providers are administered from the
S63 Chart Loader program.
Track Control - Settings(see page 239)
If the TECDIS unit is configured with Track Control, this tab is used to set
the autopilot specific settings.
- 217 -
A.2 Service mode
To gain access to TECDIS Setup a TECDIS Service Key has to be used. This
is a custom made USB dongle that comes with the TECDIS unit.
We recommend that the TECDIS Service Key is stored in a safe
place, as changes in TECDIS setup are only to be executed by
certified technicians. Each TECDIS unit comes with a Service Key,
and a backup Service Key CD. It is the captains responsibility that the
Service Key is used only when necessary.
A.2.1 Entering service mode during system
startup
1. Before you turn on the TECDIS unit, insert the TECDIS Service Key in
an available usb port.
2. Start the TECDIS unit
3. You will now be prompted to remove the Service Key to start the
TECDIS unit the regular way. Select cancel, which allows you to start
the unit without starting the TECDIS program.TECDIS
You now have access to Windows desktop, and the programs TECDIS
Setup, S63 Chart Loader, and NMEA Server.
A.2.2 Entering service mode when TECDIS is
running.
1. Enter a TECDIS Service Key in the TECDIS unit.
2. Wait until the text label Servicemode appears in the
lower right corner of the chart view.
3. Turn off TECDIS as normal, by pressing the STOP
button in the top left corner of the screen.
This exits the TECDIS program, without turning of the computer. You now
have access to Windows desktop, and the programs TECDIS Setup, S63
Chart Loader, and NMEA Server.
- 218 -
Appendix A:TECDIS Setup
A.3 NMEA Data
The NMEA Data tab in TECDIS Setup contains all controls and configurations for input and output in the TECDIS system.
The table on the left of the tab displays the current configuration, and is
immediately updated if alterations are made to the input and output tabs
in the upper right part of the NMEA Data tab.
The dropdown list for the input field will impact the display of available
alternatives in the other dropdown lists in the input tab, aiding you in
setting the configurations correctly.
Note: Descriptions in this chapter are presented as information only.
Only authorized service technicians can reconfigure the settings in
the NMEA Data tab.
A.3.1 NMEA Input
Note: All positions sent to TECDIS from external sensors have to be
in the WGS-84 format.
Use this tab in the NMEA Data tab to configure input signals.
Select the data-type you want to configure. This is done by selecting it in
the table to the left, or by selecting the data-type from the correct
dropdown list. When you have selected the data-type, the entry for that
- 219 -
data-type in the sensor table to the left is shown with a blue background
colour.
A.3.1.1: Info text
Then you enter a description in the info field, to identify the type of
sensor/data later. This can be used as the label for the sensor, as it will be
visible in any alarms in TECDIS related to the sensors functTECDISion.
A.3.1.2: NMEA sentence
In the dropdown list for NMEA sentence you select the NMEA sentence
your sensor is sending data in. Available NMEA sentences in the dropdown
list will change according to the selected data-type/sensor-type.
When a given sensor can send out more than one of the supported NMEA
sentences, the highest placed alternative in the list below should be used:
Position 1 og Position 2
1. $??GNS GNSS fix data
2. $??GGA GPS fix data
3. $??GLL Geografic position (Lat/Long)
4. $??RMC Recommended minimum specific GNSS Data
5. !AIVDO AIS own ship position. UAIS VHF Data link own-vessel report
COG/SOG 1 and COG/SOG 2
1. $??VTG Course and speed over ground
2. $??RMC Recommended minimum specific GNSS data
3. $??OSD Own ship data
4. !AIVDO AIS own ship position. UAIS VHF Data link own-vessel report
Heading 1 and Heading 2
1. $??THS True heading and status
2. $??HDT Heading true
3. $??OSD Own ship data
4. $??VHW Water Speed and Heading
5. !AIVDO AIS own ship position. UAIS VHF Data link own-vessel report
Radar ARPA 1 and Radar ARPA 2
1. $??TTM Tracked Target Message
Radar Cursor 1 and Radar Cursor 2
1. $??RSD Radar System Data
AIS
1. !AI??? AIS UAIS VHF Data Link
Depth
1. $??DPT Depth
2. $??DBT Depth below transducer
- 220 -
Appendix A:TECDIS Setup
A.3.1.3: Input port
In the dropdown menu Input port, the physical serial port/IP-port for the
chosen sensor is selected.
TECDIS has 6-12 COM-ports and 4 IP-ports.
When the desired input port is selected, the letter for the entry in the
sensor table for this sensor will become:
l
l
l
unaltered(white) if the sensordata received do not match the configuration in TECDIS Setup.
green if the sensordata match the specified sensor
red if the port is already selected for another sensor
An example:
To obtain positiondata from a GPS, the settings can be as follows:
1. Select Position 1 or Position 2 in the Select sensor column
2. Select the port(COM or IP) where you have connected the GPS, in
the port field.
3. Select the NMEA sentence type the GPS transmits
4. It could also be beneficial to describe the sensor as a GPS in the
Sensor description field. If the system loses connection to the sensor
during sailing, TECDIS will sound an alarm. The alarm will display
both data-type(eg position 1), port(eg COM 3) and the description
entered(eg GPS).
IP ports
For each IP port an IP address and an IP port number has to be given.
The test button enables a connection to the IP server with the chosen
address/port number and in the field Received data on selected port the
received data will be displayed.
A.3.1.4: The Baud/TPA field
In the Baud/TPA field the data transfer speed for the selected/active COM
port is shown. The speed is changed by selecting a different value in the
dropdown list.
The NMEA standard is 4800 (low speed), but note that som sensors
require different speeds. The following speeds are available in the TECDIS
system:
l
l
4800
9600
- 221 -
l
l
19200
38400
AIS generally use NMEA high speed, 38400 baud. (Marker AIS i
datafeltet, og sjekk at Baud/TPA-feltet angir 38400 baud).
A.3.1.5: Serial port activity
In the serial port activity field all data from the selected serial port is
displayed. A serial port receiving data will blink with green color. The
indicators are for COM ports 1-12 in increasing order from left to right.
A.3.1.6: Received data on selected port
In the “Received data on selected port”-field the data that are being
received from the COM port that is marked with blue in the sensor table.
If received data is valid NMEA sentences, the line will flash in green.
If IP ports are used, data for all sensors attached to that port are shown.
The sensors will then all flash green when valid.
When changing to another COM-port, the data displayed will change and
the data for that port will be shown.
A.3.1.7: Other COM port connections
All “Input”-ports settings that is not used should be set to “----“.
There are some predefined in/outputs on the different TECDIS models,
which vary The following COM-ports are predefined and can not be used
as NMEA I/O:
Model
ports
TECDIS 2138AA and
2138AD
COM 1 & 3 are RS-232
TECDIS 2424
COM 2 is set for the Furuno Keyboard
COM 1 is RS-422 (non-isolated, not valid for
NMEA)
COM 2 is RS-232
TECDIS 2140
COM 1, 2 & 3 are RS-232
- 222 -
Appendix A:TECDIS Setup
A.3.1.8: COM-port for Monitor ctrl
Select the COM-port for the serial cable from the monitor. This
connection will control the monitor background light and calibration
settings, as well as the alarm sounder in the screen unit (if used).
Ensure that the power supplied to the monitor is from the same
source (UPS, mains socket etc.) as for the TECDIS.
A.3.1.9: COM-port for Alarm ctrl
Select the COM port that should be used for the alarm central interface (if
used).
Er det ikke koblet til noen alarmsentralinterface, settes denne til “----”.
Velg COM-porten som skal brukes til alarmsentralen grensesnitt (hvis
tilgjengelig). In the “NMEA”-sentence pull-down menu there are two
choices; “Digi” and “ALR”.
l
l
“ALR” will set the port up to serial NMEA communication with the
alarm central.
“Digi” option should be used when connected to a proprietary alarm
interface TEA-01, which is an open/close relay contact.
A.3.1.10:COM-port for Furuno Keyboard (RCU-018)
Furuno Keyboard is only available for TECDIS 2138
Set “Input”-port to “COM 2” if the Furuno RCU-018 is connected to the
TECDIS.
Physically, the “COM 2”-port provides live 12VDC power to the Control
unit and thus this port cannot be used to any other equipment. Er det ikke
koblet til en Control enhet, settes input-porten til “----”.
A.3.1.11:COM-port for CAM control
Select the COM-port where you have connected a gyro-stabilized camera.
Er det ikke koblet til noen CAM control interface, settes denne til “----”.
- 223 -
A.3.2 NMEA Output
In the Output tab in the top right corner of the NMEA Data settings panel,
you will find the following NMEA sentences that TECDIS can transmit:
APB
l RMB
l RMC
l WPL+RTE
For each of the outputs, there are choices of which of the physical COMports the output should be directed trough.
l
A.3.2.1: Enabling IP server
By selecting "Activate conning IP server port 2000" opens a TCP / IP server
in TECDIS for data transfer to TECDIS Conning program.
This option should only be activated when TECDIS Conning displays
the data from TECDIS.
- 224 -
Appendix A:TECDIS Setup
A.3.3 Supported NMEA sentences
TECDIS supports communication with external equipment using the
following NMEA sentences, as specified by the NMEA standard and IEC
61162-1 (Ed. 3.0):
NMEA sentence
Description
Send /
Receive
ABK
(AIS) AIS addressed and binary broadcast
acknowledgment
Receive
ABM
(AIS) AIS Addressed Binary and Safety Related
Send
Message
ACK
Acknowledge Alarm
Send
ALR
Set Alarm State
Receive
APB
Heading/Track Controller (Autopilot) Sentence
Send
”B”
BBM
(AIS) AIS Broadcast binary message
Send
DBT
Depth Below Transducer
Receive
DPT
Depth
Receive
DTM
Datum reference
Receive
GGA
Global Positioning System (GPS) Fix Data
Receive
GLL
Geographic Position – Latitude / Longitude
Receive
GNS
GNSS fix data
Receive
HDT
Heading, True
Receive
MTW
Water temperature
Receive
MWV
Wind Speed and Angle
Receive
OSD
Own Ship Data
Receive
RMB
Recommended Minimum Navigation Information
Send
RMC
Recommended minimum specific GNSS Data
Send /
Receive
ROT
Rate of Turn
Receive
RSA
Rudder Sensor Angle
Receive
RSD
Radar System Data
Receive
RTE
Routes
Send /
Receive
THS
True heading and status
Receive
- 225 -
TTM
Tracked Target Message
Receive
VDM
(AIS) AIS VHF Data-link Message
Receive
VDO
(AIS) AIS VHF Data-link Own-vessel Report
Receive
VBW
Dual Ground/Water Speed
Receive
VHW
Water Speed and Heading
Receive
VSD
(AIS) AIS Voyage Static Data
Send
VTG
Course Over Ground and Ground Speed
Receive
VWR
Relative (Apparent) Wind Speed and Angle
Receive
WPL
Waypoint Location
Send /
Receive
ZDA
Time and date
Receive
NOTE: TECDIS also supports a number of proprietary protocols for
specific application areas. Contact your TECDIS supplier for details.
- 226 -
Appendix A:TECDIS Setup
A.4 Vessel settings
(Specification)
Note: Descriptions in this chapter are presented as information
only. Only authorized service technicians can reconfigure the
settings mentioned in this chapter.
The exception from this is Allow route activation entry lane, that
can be set by the navigator.
In this tab the dimensions of the vessel and sensor placement is specified.
In the table below some selected settings are listed, and what effect those
settings have on the TECDIS system.
- 227 -
Field name/image
Ship size
Description
Length, beam, draught and height of the vessel,
measured in meters.
For “Length”- and “Beam”-fields the ship’s largest
dimension value for length and beam should be used.
For “Draught” and “Height” the largest possible
height and draught taking load conditions into consideration should be entered.
For safe depth min, enter the wanted minimum safe
depth for the vessel. This value overrides the draught
min/max as basis of the safe depth settings in the
TECDIS Ship menu tab. Navigators cannot set a
shallower safe depth than this inside TECDIS.
Other TECDIS
unit(s) data
export
If your TECDIS installation consists of two or more
units, the name and IP-address for the connected units
are entered in this field.
The name you choose is used to identify the unit in the
Data menu tab in TECDIS. If text is entered in this field
when no unit is connected, an alarm will be turned on
when TECDIS is started.
This function allows automatic route transfer to
TECDIS no 2, and add the possibility to transfer data
(objects, past track lines, routes) to the other units.
Radar use true
EBL reference
When this checkbox is marked, it is assumed that
bearings lines received from the radar(s) are true
referenced. If this option is not marked, TECDIS will
perform the necessary adjustments.
Arpa is conning
referenced
When this checkbox is marked, it is assumed that
target information from Arpa radar is already
adjusted to the navigator position.
If it is not marked, TECDIS will perform the necessary
adjustments.
Monitor size,
main menu
Monitor inch diagonal is the monitor screen size in
inches, measured diagonally.
Backward (gyro-180º) this flips the heading values
given by the gyro 180 degrees.
- 228 -
Appendix A:TECDIS Setup
In the Main menu dropdown list you can select where
you want to place the main toolbar. There are two
options; horizontal along the top of the monitor
(default), and vertical along the left side of the
monitor.
Allow Standby Mode: In this mode no audible alarms
will sound. Activation of this mode is done in the Safe
menu tab. Allow standby mode will also allow deactivation of CPA alarms in TECDIS.
Alarm
Alarm if HDT1-HDT2>2,5º: When this box is checked,
an alarm will be given if the heading from the two
sensors Heading 1 and Heading 2 deviates with more
than 2.5 degrees.
NOTE: If TECDIS is configures with Track control,
this option will be available from that settings
tab in TECDIS Setup.
Remote silence only: Only available for systems
connected to an alarm central. If an alarm is acknowledged on the alarm central with this function
activated, only the alarm sound will be turned off. The
alarm will still remain in TECDIS.
Keyboard alarm is the built in alarm sounder in the
Furuno RCU-018 Keyboard.
With this selected, TECDIS will ask the navigator which
Allow route activwaypoint to connect a route leg to. This route leg will
ation entry lane
start in the own vessel position. This question will be
asked when a route is selected for activation and voyage.
Erase Secondary
If two positioning methods are in use, pressing this butpast track
ton will remove the past track line from the secondary
position sensor.
Name
Here you write the name of the vessel.
MMSI
Here you write the MMSI number of the vessel.
- 229 -
Restore saved
default values
Depth below
transducer
Here you can restore all settings in NMEA server, Conning, and TECDIS Setup to the settings that were
present the last time TECDIS Setup was closed. Read
More
Here the distance from the keel to the sensor can be
set in steps of 0,1 meter.
A.4.1 More about restoring saved default
values
When you restore settings from a backup file on the TECDIS Service Key,
you have to follow this procedure:
1. Press the restore saved default values button
2. A dialogue window called Restore to xxxxx: Locate setup-file to
restore from, and click OPEN is opened.
xxxxx is the eToken/system ID for your TECDIS. An example of and
eToken number is eT 55001.
3. Navigate the folders until you find TECDIS Service Key The file that
contains all settings, is called T-setup-xxxxx.tsz.
4. Select this file, and press the OK button
- 230 -
Appendix A:TECDIS Setup
A.4.2 More about T-setup/TSZ files
A T-setup xxxxx.tsz file is generated every time you start and stop TECDIS
Setup.
The file is saved by:
1.
2.
3.
4.
5.
6.
entering a TECDIS Service Key in the TECDIS unit.
stopping the TECDIS programme
starting the TECDIS Setup programme
stopping the TECDIS Setup programme
removing the TECDIS Service Key
repeat the procedure for TECDIS no 2
T-setup xxxxx.tsz files can be used by Telko in an analysis of the system
settings. This aids in most support cases.
- 231 -
A.5 Chart installation/ Misc
The procedure for installing charts in TECDIS Setup is explained in
6.1.1: Quick installation with Jeppesen SENC charts(see page 137).
The tab Chart installation/Misc contains the following:
Copy Chart
Gives access to updating, removing and reinstalling chart
Database to
databases
Harddisk
Enter Vessel Information
Here you have to state the vessel and owner information.
This information is necessary for chart licensing and warranty purposes.
Saves the information entered in Vessel Information on the
Send Regis- TECDIS unit harddrive. The file can now be transferred to
tration
another computer with internett access for sending to
Telko at [email protected].
Monitor Cal- This field reports on the current monitor calibration status,
ibration and and gives access to methods of updating the monitor calTest
ibration and monitor serial connection diagnostics.
Start C-Map Gives access to the C-Map chart databases, licensing and
Chart Man- diagnostics tool for the chart databases in a separate
ager
program made by Jeppesen.
- 232 -
Appendix A:TECDIS Setup
A.5.1 More about Monitor Calibration
The correct monitor calibration is necessary to ensure correct colour
rendition in the charts.
To recalibrate the monitor, first try automatic calibration by pressing
Identify Monitor and Load Automatic Calibration.
If this is unsuccessful, perform a manual calibration by pressing the
Manual Calibration: Load Calibration File... button and select the correct
calibration file for the connected monitor.
If you cannot find a calibration file on the hard drive, this can be acquired
by [email protected] or an authorized dealer.
The filed Monitor Calibration Status reports the current status for the
monitor calibration. The possible status reports are given in the table
below along with actions required if you experience issues.
Status
Action
No serial line to monConnect the monitor to a COM-port
itor!
Calibration not performed!
Perform automatic or manual calibration
Wrong manual calibration file loaded!
The loaded manual calibration file does not
match the connected monitor Acquire the
correct calibration file from [email protected]
and perform manual calibration again.
Monitor contains
Contact [email protected] or an authorized
wrong automatic caldealer.
ibration!
Automatic calibration loaded but
not verified
Manual calibration
loaded but not
verified
Automatic calibration loaded and
verified
Manual calibration
loaded and verified
Calibration was successful, but the monitor type
has to be manually verified.
Control that the calibration is correct by
comparing the model name on the monitor itself
and the name given in Calibration Name.
Calibration of the monitor was successful and
verified
- 233 -
Calibration Name reports the name of the manually or automatically
loaded calibration file.
Monitor Type is the name of the monitor model, as reportd by the
monitor itself.
Identify Monitor and Load Automatic Calibration start an automated
identification of the monitor type and then tries to automatically load the
correct calibration file from the monitor to the computer.
Manual Calibration: Load Calibration File... allows for manual loading of
monitor calibration files form the folde C:\Drivers\TECDIS.
Monitor Connection Tests... gives access to tests for verifying that the
monitor serial connection to the computer is correct (testing buzzer
sound, adjusting background lighting and performing a monitor identification test).
- 234 -
Appendix A:TECDIS Setup
A.6 Licences
In this tab you will find information about your system licenses and
Jeppesen C-MAP licenses.
TECDIS uses eToken codeplugs from Jeppesen as the system ID.
Without the correct eToken connected to your unit, TECDIS will not
start.
A.6.1 System licenses (TELcahrt License)
Information about your system licenses, such as what options are
activated for your TECDIS unit, can be found by pressing the Show / Edit
license button
This information includes licenses number and version information, and a
list of installed add-ons. The add-ons are displayed in blue writing in the
right field.
- 235 -
A.6.1.1: Activating add-ons
To activate add-on functions, do the following:
1. Contact your Furuno Norway dealer to get an updated license code.
The license in your system will be reprogrammed when adding a
feature, so you have to report which other features you already
have and want to keep.
2. The license code you receive is entered in the Password field.
3. Press the Program button to reprogram the license.
4. Press the OK button to exit the license tool.
5. Press the Show / Edit license button again, to check that the add-on
list is updated with the correct add-ons.
A.6.2 Jeppesen licenses (C-Map License)
All functionality described in this chapter is valid for chart databases
in the CM93/3 format distributed by Jeppesen(C-Map). For chart
databases in other formats (S63), see chapter6.1: Installing chart
databases(see page 137) for more information.
A.6.2.1: Add license manually
1. The Add license manually button opens a field to the right where
the license code issued by Jeppesen can be entered in the License
String field
2. In the dropdown menu labeled Databases you have to select the
chart database or the function the license code is valid for.
3. In the Data Set or Area Name field you select the chart area or the
functionality the license code is valid for.
4. Then you enter the received license code in the License String field.
The license code is received from either Jeppesen (charts) or [email protected] (function).
5. Finish and exit by pressing the Add License button.
- 236 -
Appendix A:TECDIS Setup
6. Repeat this process for each chart area and each license code in
each chart database.
A.6.2.2: Get Expired licenses
The Get expired licenses button gives you access to an overview of all
licenses that has expired within a selected date (month and year).
A.6.2.3: License list
The Licenses list button gives you access to a list of valid licenses, sorted
by chart database.
A.6.2.4: Add license from file
1. The Add License from file button opens a new field.
2. There you navigate in the file structure to the left of the field until
you find the password.usr file you have received.
3. Select the file, and confirm adding it by pressing the OK button.
- 237 -
All chart licenses for all chart databases and all areas included in
your purchased license, is now activated.
A.6.2.5: License orde
The License order button gives you access to a tool for easy generation of
a license order summary that you can send to Jeppesen.
- 238 -
Appendix A:TECDIS Setup
A.7 Track Control - Settings
In this tab all settings for connection between TECDIS and one of the
specified auto pilots are set.
The Track Control tab is available only when Track Control is added
to the TECDIS License.
For installation and configuration of autopilots, please see the installation manuals from the manufacturer.
Note: The autopilot and TECDIS has to be connected to and
configured with the same course and speed sensors.
A.7.1 The autopilot field
The options of the autopilot field reflect which autopilots can be
connected to TECDIS. The following autopilots are available:
l
l
Anschütz NP2025
EMRI SEM200/FAP-2000
- 239 -
A.7.2 The Startin Requirements field
The values of the Starting Requirements field denotes which conditions
has to be met before Track Control Mode can be activated.
max course deviation sets the maximum number of degrees the vessels
COG can deviate from the planned COG.
max lane deviation sets the maximum distance from the vessels position
to the active route leg, expressed as x times the width of the route leg.
(For eksempel; hvis ruteleggens bredde for den planlagte ruten er 100m,
og max lane deviation er satt til 2, kan fartøyets avstand fra ruteleggen
være inntil 200meter når Track Control blir aktivert.)
min. speed sets the vessels minimum speed in knots.
A.7.3 The Default values new route field
The values in this field is used as standard values when you plan new
routes.
Speed kn sets the standard value for speed in knots.
Lane x 0.01NM sets the lane width standard value, expressed in
hundredths of a nautical mile
(For eksempel vil en verdi i dette feltet på 10 representere en bredde på
0,1NM).
Turn radius x 0.1NM sets the standard value for the turn radius,
expressed in tenths of a nautical mile.
(For eksempel; hvis verdien spesifisert i dette feltet er 5, vil standard
svingradius være 0,5NM).
A.7.4 Other settings
min. allowed turn radius x 0.01 NM specifies the minimum allowed turn
radius, expressed in hundredths of a nautical mile. Denne verdien skal
framkomme under fartøyets sea trials.
max. allowed WOL distance x 0.01 NM specifies the maximum allowed
WOL distance the operator can set, expressed in hundredths of a nautical
mile.
max Remote Control ROT specifies the max ROT allowed in the autopilot
remote control tool in TECDIS, expressed in degrees per minute.
WP warning and alarm time specifies the distance from a waypoint the
vessel is when any set warnings or alarms will be generated.
- 240 -
Appendix A:TECDIS Setup
Alarm limit difference primary and secondary heading specifies how big
the deviation in degrees between primary and secondary heading sensor
has to be before an alarm is generated. Hvis de to headingsensorene
avviker mer enn denne verdien, genererer TECDIS en alarm.
Alarm limit difference primary and secondary position x 0.01 NM
specifies how big the difference in position between primary and
secondary position sensors has to be before an alarm is generated. The
value is expressed in hundredths of a nautical mile. Hvis avstanden
mellom posisjonene fra de to posisjonssensorene avviker mer enn denne
verdien, genererer TECDIS en alarm.
- 241 -
This blank page is automatically inserted where appropriate to ensure that
new Chapters begin on a recto page.
x B:
Optional add-ons
In this chapter we will look closer at the optional add-ons available for your TECDIS system. See
how you can improve navigational security and voyage financials through these powerful add-ons
for your TECDIS system:
B.1Weather overlay
246
B.1.1How to enable weather overlay
247
B.1.2How to download the Weather Service subscription
248
B.1.3Control of weather subscription licenses
251
B.1.4Downloading a new weather forecast
251
B.1.5Controlling the Weather overlay on the chart
253
B.1.6Custom Views
255
B.1.7Cursor info
256
B.1.8Explanations of weather data chart symbols
256
B.1.9Selection of units for wind speed, temperature, etc.
257
B.1.10Treatment of downloaded weather forecasts
258
B.1.11Alarm Settings
259
B.1.12Set the alarm settings
259
B.1.13About alarm conditions
260
B.1.14The timeline feature
261
B.2Radar overlay
264
B.2.1Radar overlay correction
264
B.2.2Radar display slider control
265
B.3Piracy Information
266
B.3.1Activation of Pirate option
266
B.3.2Turn on display
266
B.3.3Adjust the viewing of piracy data
267
B.4Autopilot (Track control)
269
B.4.1Autopilot mode
269
B.4.2Sensor surveillance and error tolerance
270
B.4.3TECDIS TCS operation
271
B.4.4Activating Heading Control mode
272
B.4.5Activating Track Control mode
272
B.4.6External (Remote) mode
273
B.5TECDIS keypad
274
B.5.1The layout
274
B.5.2Keys
275
B.5.3Alarm functionality
277
- 244 -
Appendix B:Optional add-ons
B.5.4Navigating your TECDIS with the keypad
277
B.5.5Numeric mode
278
B.5.6User defined keys
279
B.5.7Video switching
279
B.6Furuno RCU-018
Some add-ons require you to sign subscriptions, while some are one
time purchases. Contact your local Furuno Norway dealer, Furuno
Norway or Telko AS for more information and purchase.
- 245 -
281
B.1 Weather overlay
Weather overlay includes advanced functionality that uses high-quality
weather prognosis data, available as a subscription service from Jeppesen
Marine.
Weather overlay can be configured by the TECDIS operator and includes
both atmospheric data and detailed data on waves. Weather overlay
includes alarm functionality that is intuitive and allows an easy visualization of the weather window and dangerous weather conditions.
Weather overlay is also integrated with the route system, which provides
manual weather routing and custom voyage meteorograms.
Note that a three-month demonstration subscription to weather
overlays are available for all systems running TECDIS software
version 4.7.1.X or 4.7.2.X. To activate this subscription, please
contact Jeppesen Marine and enter the System ID / TELKO eT
number. A configuration code must also be obtained from TELKO AS
or Furuno Norway.
- 246 -
Appendix B:Optional add-ons
B.1.1 How to enable weather overlay
To activate weather overlays:
1. A License code TECDIS option must be added to the System ID / TELKO
eT - license key
2. A Weather Service subscription from Jeppesen Marine must be enabled
7.9.2.1: Activating the license
To find out if eToken license key has this option enabled, do the following:
Start TECDIS Setup.
Go to the Licensing tab.
Then press the Show / edit license button and wait until the fields are
updated.
The Codeplug # .... field shows the correct number and the eToken field to
the right of this has the options listed with the activated blue color.
If the field Weather display and routing is not shown in blue, take a screen
capture (print screen).
Save this picture with the filename eTxxxxx.png, where xxxxx represents
the System ID / TELKO eTnumber.
Send this file as an attachment to an email to an authorized TECDIS dealer
or [email protected].
When the system has approved the option, the weather overlay button will
be available on the main toolbar.
B.1.1.1: Activate Weather Service subscription
Your Weather Service subscription must be activated by Jeppesen Marine
on their own servers and this does not affect the local TECDIS unit.
When a TECDIS device with a Weather Forecast subscription enabled
requests weather data from Jeppesen Marine's servers, their servers
compare the eToken number to their eToken registry for subscription
confirmation.
- 247 -
B.1.2 How to download the Weather Service
subscription
Forecasts can be downloaded using either an Internet connection or via email. Before the forecast can be downloaded, subscription information
must be obtained from Jeppesen Marine.
Both of these actions are performed from the Weather window.
Note that if you want to use an Internet connection, the network
administrator for the vessel should be consulted for information
about the settings that apply to your vessel network. This information is needed in step 6 below.
B.1.2.1: Download procedure
1. Open the Weather window by pressing the Weather overlay button
on the main toolbar. A message that No current weather Forecasts
are available is displayed.
2. Ignore this message by pressing the OK button.
3.
Press the Data button, indicated by a red frame in the image below,
to extend the Weather window with a data area. This area is closed
by pressing the Data button again.
4. Press the Download New button in the lower right corner of the
Weather window.
- 248 -
Appendix B:Optional add-ons
5.
Before first time use, the connection has to be configured. Press the
Configure Connection button.
Internet
6.
Update
A. If TECDIS is set up with an internet connection in the form of a
network cable connected to the Internet LAN port on the rear
of the computer, select Internet in the Communication Type
field.
B. There are three connection options in the Connect to Server
box, and basically you should select the location that is closest
to own location. If this option seems poor, another option
should be selected.
C. The Connection Timeout field must be set to at least 90
seconds but 120 seconds is recommended. For slow Internet
connections a higher value is recommended, for example
between 180-240 seconds.
D. In the HTTP Proxy Server field you set the settings as required
by your local network to access the Internet. Your local network administrator can inform about the correct settings for
HTTP Proxy Server.
E. Click Save Config button to save the configuration and return
to the download window.
7.
E-mail updates
A. If TECDIS is not set up for an Internet connection, or weather
updates for other reasons will not happen directly, weather
updates can be obtained by generating a file, then sending it
as an attachment to an e-mail on another computer.
- 249 -
B. Click Save Config button to save the configuration and return
to the download window.
C. Select E-mail in Communication Type field.
D. Set Max Attachment Size to a value less than the limit for email attachments that apply to local mail server. Is the limit is
1 MB (Mega Byte), enter this as 1000 in Max Attachment Size
field, where the values are expressed in KB (Kilo Byte).
E. Click Save Request File button to initiate saving of the order
file.
F. Specify the location where the order file is to be saved and
press the Select button. It is a condition that the order file is
stored on a removable medium such as a TECDIS Service Key.
G. The order file is generated and a window opens showing the
progress. Send this file to [email protected] and wait
until all responses are received. Note that the subject line of
the response from Jeppesen Marine (C-Map) shows how
many answers are mailed to you in total.
H. Note that the download window can be hidden by pressing the
Data button, pending the response files. The Weather overlay
window can be closed completely, or TECDIS can be stopped
without resulting in problems with the download.
I. To enter answer files, reopen Weather overlay window and
press the Data button.
J. Save all received mail attachments that have extension. Dat
or. JWP on a USB memory stick. Insert the USB memory stick
containing the received files into an available USB port in the
TECDIS unit and press Load Reply Files.
K. Navigate to the received subscription info file(s) and press the
Select button. Subscription loading is now complete and
TECDIS is ready to download weather data.
8.
When the response files have been processed a report for the download is displayed. Later, when the weather is downloaded, an additional Load and Return button will be available for immediate
viewing of downloaded weather trend.
- 250 -
Appendix B:Optional add-ons
B.1.3 Control of weather subscription
licenses
When subscription download is complete, the subscription(s) are inspected
by doing the following:
1. Press the Download New button in the Data field.
2. Show Subscription button should now be selectable and by pressing
it you can view details about the weather models that are available
in your subscription.
3. Subscriptions applicable to the eToken in use now appears in the
right hand side of the window. With the slider to the right of the
field you can navigate down on the list if it is long.
B.1.4 Downloading a new weather forecast
When the subscription is loaded, the weather forecasts are available. The
weather forecasts are related to weather models.
B.1.4.1: About weather models
Both the Model field in the Download New window and subscription
information window (Show Subscription window) show a number of
weather models after the weather subscription is downloaded.
These refer to the various mathematical weather prediction models that
are available and are calculated up to several times daily. When
downloading a new forecast, part of the data are selected from the latest
weather prediction model.
Many of the models have a distance in kilometers in the model name
(example: Global - ECMWF 150 Km). This indicates the distance between
each data point being downloaded. Similarly to zooming into a map
image, the data for each point between these data points will be calculated.
As a general rule a lower kilometer value gives a higher level of detail on
the weather chart. The main reason for choosing a model with a higher
distance between data points is to reduce the download size.
- 251 -
Large downloads will not be stopped, even if the data files are 50100 MB in size. A large forecast data file takes a long time to
download and may cause delays in the TECDIS system during
operation.
B.1.4.2: Download Window
A. When a weather model is selected, the download window will
include a number of new options:
B. In the Select Parameters field, you can choose between providing a
list of weather variables that can be selected; pressure, temperature, wind, rainfall, swell and waves.
C. In the Period field you can select the forecast period in days.
D. In the Resolution field, choose the update frequency of the data
points. Again, the data for each time point between the data points
will be calculated. A smaller value results in more frequent updating of data points and will result in larger download size.
E. When the Include Cyclones option is checked, the data on cyclones
will also be downloaded together with other weather data. This eliminates the need for a separate download for cyclone data.
F. In the Area field both the size and location of the area selected to
download weather data is controlled and displayed. The size in
square degrees appear along with maximum size of a downloaded
area, as allowed by subscription.
1. By default, the area shown on the chart is used to specify limits for downloading weather data [Area (Screen)]. To adjust
the weather data area, zoom or pan the chart view to the preferred range is shown on the chart. If your subscription does
not allow downloading of data for the entire chart view, the
central part of the chart is prioritized.
2. By pressing Select on Map button, you can override the
default setting for selecting weather data area. The cursor
changes and the first corner of the rectangle is set out in the
map by pressing the left mouse button. Then you can set the
diametrically opposite corner with a new press with the left
- 252 -
Appendix B:Optional add-ons
mouse button. Press the Select Screen button to return to the
default display area.
The estimated download size appears at the top of the window and is
updated at any time according to the current selections. Adjust the model
selection, parameter selection, site selection, time period and resolution
to the desired compromise between detail and the download size.
Typically, a download size of 5-8 MB provides more than enough detail,
but normally requires a broadband connection. For other connection
types, carefully consider the costs associated with data download along
with the usefulness of the information weather data can provide.
When the settings are implemented, weather data is downloaded using
the same procedure as for the subscription download.
B.1.5 Controlling the Weather overlay on the
chart
The main window for
controlling the weather
overlay can be divided into
three main areas;
l
l
l
the upper section contains timing control for
the Weather overlay
the central area controls which weather parameters to display in
the Weather overlay
the lower area is where you gain access to the various detail windows for the weather overlay and its settings.
Note: Weather overlay is displayed on the chart only when the chart
scale is in the overview chart levels. For chart scales with a level of
detail less than 1:500 000, the weather overlay is hidden, but the
weather overlay window which controls the download and setup will
be available.
B.1.5.1: Time management field
The time management field includes several ways to verify the date and
time of presentation of weather overlays on the chart:
- 253 -
Displays the selected date. Select or enter a specific date.
Displays the selected time. Select or enter a specific time.
Go to today's date and current time
Moves three hours back or forward in time.
Moves one day back or forward in time.
Slider to look at weather data at a given time between the
start and end time of the forecast. While the sliding
controller is in focus (indicated by a dotted rectangle
around the slider), the keyboard's arrow keys are used to
move the time one hour forward or back.
The dates and times in the lower left and right corner of the sliding
controller are the start and end time for the forecast downloaded.
Note: If the cyclone data is also loaded, these often start earlier than
the weather forecast and some times the start of the sliding
controller only shows cyclone data.
B.1.5.2: Display Controllers
The buttons in the middle field of the window for weather
overlay, controls the data to be presented in the chart. The
buttons for the selected and visible weather data is displayed
as pressed down (here: Wind).
Pressing the selectable buttons, toggles the display of this
type of weather. If a button is gray (here:Clouds and
cyclones), it means that the selected weather model does not
contain this type of weather.
The system optimizes the way the selected weather appears,
while preventing that the Weather overlay display is too
complex.
If only one type of weather data is selected, it is displayed in several ways
simultaneously. For example, waves are shown using both colored areas,
region contours and direction arrows.
If several types of weather data are selected, TECDIS display the different
weather data with different display forms. For example, when Waves,
- 254 -
Appendix B:Optional add-ons
Pressure and Wind is selected simultaneously, Waves are shown with the
colored areas, Wind with arrows and Pressure with contours.
Alarms and Cyclones have unique display forms and display of these
weather datas does not affect the display of the other weather data.
There are some combinations of selected weather data that can not
be displayed simultaneously."Waves", "Temp.", "Clouds" and "Rain /
Snow" are all best displayed with the colored area, but only one of
these can be displayed at once. However, it is possible to show
"Clouds" and "Rain / Snow" at the same time if no other weather
data is displayed.
B.1.6 Custom Views
If a particular view is desirable and default views described above is not
sufficient, a custom view mode is selected by pressing the Customize
button in the lower left corner of the weather window.
This will replace the default display buttons of fields with flexible options
for what to display as range (color marked area), values (only values for
each data point), Lines 1 (contours) and lines 2 (contours).
Enabling alarms, display of cyclones and arrows for wind, waves and
swells can also be selected in selection boxes.
B.1.6.1: Ending a custom view
Pressing the same button again (now labeled Basic) changes the weather
window back to the default view.
- 255 -
B.1.7 Cursor info
In the Cursor Info field to the right of the Customize button at the bottom
of the weather window, you can specify which weather data to be
displayed as text next to the pointer when held over the area with
værdatapunkter.
Weather information displayed relates to the date selected in the upper
weather window.
l
l
l
l
None option disables the marker information.
When the Visible option is selected, only the values selected for display in the chart.
The All option displays all the data available in the data set. By
default this option is set for the "Cyclones" page
The Timeline option provides a much more responsive method for
displaying weather data in the chart overlay.
B.1.8 Explanations of weather data chart
symbols
By pressing the "?" Button at the bottom of the weather window, the
weather window expands to include the explanation of the different types
of presentations of weather data in the chart.
Pressing the button again closes the window.
Which weather data presented are selected in the Show Chart Legend for
dropdown menu.
- 256 -
Appendix B:Optional add-ons
B.1.9 Selection of units for wind speed,
temperature, etc.
Pressing the Unit Button for weather window you can specify the
preferred units of measurement for
Temperature
l Velocity of the current
l Cyclone Wind
l Wind Speed
l Pressure
l Heights (Meteorological tides)
l Rain Snow
l Detailed Wind Arrows (Knots)
Press Unit Button again to close the selection window units.
l
The graphical presentation for the display of wind data varies with the
unit of measure chosen.
For all other units of measurement than Knots, it is only the wind
arrow length that describes the wind speed. When Knots is selected
all the wind arrows are the same length, but they have indicators of
wind speed as well.
With the Detailed Wind Arrows (Knots) checkbox you can select to
display wind arrows associated with the Knots selection, even though
another measure is chosen.
- 257 -
B.1.10 Treatment of downloaded weather
forecasts
A list of downloaded weather forecasts can be retrieved by pressing the
Data button.
The list that appears contains information about
Forecast Model
Start Date
l Days (number of days the forecast is for)
Section closes again when you press the Data button again.
l
l
List of downloaded weather forecasts can be viewed with the following
background colors:
Blue
The selected weather forecast
Green More than half of the projection period is in the future.
Yellow Less than half of the projection period is in the future.
White All information in the weather files are in the past.
The selected weather forecast can be;
loaded by pressing the Load button
l deleted by pressing the Delete button
l inspected by pressing the Details button in the top right corner of
the window.
Chart area covered by the selected weather forecast is marked in red on
the chart, if a sufficiently large scale is chosen for the display of the chart.
l
In the lower right corner of the window, the following buttons are
available:
Current Details
Displays detailed information about the
selected weather forecast.
Delete Old Files
Deletes all weather forecasts that is more than
14 days old.
Import
Import a weather forecast received via other
methods than the one used by pressing the
- 258 -
Appendix B:Optional add-ons
Download New button. This method allows
import of files. in the GRB and XML format.
Note that this function only supports files that
are supplied by Jeppesen Marine
Download New
Opens window for downloading weather
forecasts.
B.1.11 Alarm Settings
Alarm settings in the Weather
overlay allows you to specify exactly
what kind of weather conditions you
are to be notified about.
When an alarm criterion is defined
TECDIS will provide clear warnings
with indication of when and how
these factors may be present.
Such indications are given on the chart together with the weather overlay,
on the timeline and as redlining on routes.
B.1.12 Set the alarm settings
Alarm settings
is started by pressing the Alarms button in the Weather window.
This will open a new field, where you can select the type of weather that
will give alarms:
1. Over the field the following buttons are displayed:
l Add
l Edit
l Delete
2. Selecting the Add button opens a new field to the right and a drop
down menu appears at the bottom.
3. Here you select the kind of weather that will give an alarm, and the
limit value for it is set in the field at the bottom right. Complete the
alarm setting by pressing the Add button again.
- 259 -
4. Selecting one of the options in the box that already has a defined
alarm value, followed by pressing the Edit button opens a new field
to the right. In this field, the alert criteria can be adjusted, added or
deleted. Areas that have weather data that exceeds the alarm conditions are marked as gray fields in red color.
5. In the timeline specified alarm conditions are shown as; a red line
along the bottom of the graph, purple when cyclones are near and
green for normal condition.
6. The parts of an activated route that runs through an area that will
be shaded in red, in a scenario in the future, when the vessel will
pass (estimated) are colored red while the Weather overlay is active.
7. All weather data displayed on the chart, relates to the time that is
controlled by controllers in the timer field in the upper left corner in
the Weather window. The calculated position of own ship is shown
with a symbol that moves along the active route on the chart, synchronously with the settings in the timer field and Weather overlay
symbols on the chart.
B.1.13 About alarm conditions
An alarm condition can be based on
certain types of weather data (for example: Wind speed above 20 m
/ s)
l a combination of several types of weather data (for example: "Wind
Speed of 20 m / s and Total Waves Height over 6 m").
When an alarm condition contains more than one type of weather, an
alarm condition will not be activated before all the weather data that has
alarm limit has been exceeded.
l
- 260 -
Appendix B:Optional add-ons
An unlimited number of alarm conditions can be added, and one or
more of these alarm conditions can be selected simultaneously.
When more than one alarm condition is selected at the same time, the
alarm condition will be triggered if one of the selected conditions are
met.
It is important to understand the difference between combining several
types of weather data in a single alarm condition and choosing separate
alarm conditions for certain types of weather.
Alarm condition Windspeed over 20 m / s AND Waves Total Height over 6
m will result in a very different alarm condition than choosing two
separate alarm conditions Windspeed over 20 m / s and Total Waves
Height over 6 m.
TECDIS assists the operator to indicate the options that are set by marking
any other alarm conditions with OR: as soon as an alarm condition is
selected in the Weather window.
B.1.14 The timeline feature
Timeline window provides a graphical representation of weather forecasts
variation over time. The function is opened by pressing the Timeline
button at the bottom of the Weather window.
1. To the left of the timeline window is the selection field, where you
can select:
l which weather data to be displayed
l label (shape and color)
l Weather data for current position of the cursor at the selected time
2. The date chosen for display in your chart is shown with a vertical yellow line in the timeline window.
3. By moving the cursor over the time window, the weather information that applies to the area that is directly under the cursor to the
right of the selection field is displayed. Black color is used when
weather data are from the graphs, and green is used when it's
weather data from the cursor position on the chart that is displayed.
- 261 -
4. By default, it is assumed that the vessel starts on a route at the next
full hour.Check this and adjust the departure time with the controllers Departure Rt.1 and Departure Rt.2 to correspond most to
actually scheduled departure. It is only when the departure date is
set as correct as possible, the weather routing provides a representative picture of what the vessel will experience of weather.
5. The settings made in the dropdown to how the timeline presented
is:
l Chart centre: a red cross with circle is set in the chart center
to mark the exact point that the timeline shows data from
l Ship pos: Timeline updated continuously as own ship position
is changing
l Cursor pos: Timeline updated continuously as the cursor is
moved in the chart. If one of the mouse buttons are pressed,
the timeline is locked to the cursor position and the dropdown
menu selection changes to Chart centre
l Route 1
l Route 2
Pressing Ctrl + S keys simultaneously while the timeline is shown
generates an image of the current graph that can be stored in the
desired location.
6. Choose weather data to be displayed in the timeline by selecting the
respective checkboxes in the selection field. In this field there are
the following choices:
l Pressure shows the graph of air pressure in the selected unit
(mm Hg or hPa)
l Temp shows the graph of temperature in the selected unit
(Celsius, Fahrenheit or Kelvin)
l Wind shows true wind speed in the selected unit (Knots, M/s
(meters per second), mph (miles per hour) or Beaufort
l Rain / Snow shows the graph of precipitation in the selected
unit (Millimeters or Inches)
l Swell Waves graph shows swell in the selected unit (Meters or
Feet)
l Total Waves graph shows the accumulated waves in the selected unit (Meters or Feet)
l Alarm Zone visualizes guard zones in activated route. This is
shown in color on the bottom of the x-axis:
l If alarm conditions are breached it is displayed in red
l If alarm conditions are kept it is displayed in green
l When data is not available, it is displayed in gray
- 262 -
Appendix B:Optional add-ons
(Rel.Dir): when selected, and the timeline is in Route mode,
the directional arrows in the timeline graph changes to show
the direction of the planned vessel course at the time. In the
selection field the numerical value of the relative wind direction with true value of wind speed is displayed.
l (Periods): when selected wave period is also displayed along
with wave graphs. Wave period is expressed in seconds(s).
7. By pressing the Arrow button in the upper left corner of the selection box, the graph will expand to fill the entire weather window.
Press the Arrow button again to go back to normal.
l
- 263 -
B.2 Radar overlay
TECDIS can be configured to show the RADAR overlay, elaborated by
Furuno FAR-2107/2807 RADAR series. When RADAR overlay is enabled, it
can be activated from the Main toolbar by clicking on this icon or the F7
key.
Access to the configuration and settings of RADAR overlay is provided in
the following way:
1.
2.
3.
4.
5.
Press the Menu button
Select the Setup menu tab
Open the dropdown menu Chart Utilities
Select Radar overlay setup
A new Radar overlay correction window
along with a sliding controller appear on the
screen.
B.2.1 Radar overlay correction
In this window you can configure the
radar overlay. You can set heading
and range separately for each
radar.
- 264 -
Appendix B:Optional add-ons
You can also select which of the connected radars is to be presented as
radar 1. To do this, select the button 1 in the middle of the window, and in
the radar selection box to the right of the window you select the desired
radar.
B.2.2 Radar display slider control
The display of the radar overlay is controlled by the slider in the
lower left corner of the screen.
Here you can use the top controller to set the overlay colour. In
S52 Chart Display Mode the color choices are light or dark green,
while the INT1 Chart Display Mode is an extension module with
multiple colors ranging from green (weak echo) to yellow
(medium strong echo) to red (strong echo).
The lower slider controls the level of radar echoes transparency
on a scale from 10 (relatively opaque) to 4 (relatively transparent).
- 265 -
B.3 Piracy Information
Valid only for TECDIS version 4.7.2.15 or later
TECDIS have the ability to download data about piracy activities directly to
your chart for planning and navigation. Pirate Data is an additional service
to the Jeppesen Professional + or Primar map.
When the subscription is established, pirate data will be included in chart
updates. You establish your subscription by contacting Jeppesen. You will
then receive an email with an attachment called password.usr.
This attachment must be stored on the TECDIS Service Key usb dongle so
that it can be added to the system in TECDIS Setup.
B.3.1 Activation of Pirate option
Activation is done as follows:
1. Follow the procedure for entering license for Jeppesen as described
in 6.5.2: Chart licenses - Jeppesen SENC(see page 172) Use Professional + or Primar as database when the procedure requires it.
Select Add License From File.
2. Perform a chart update of at least either the Jeppesen Professional
+ or the JeppesenPrimar database.
B.3.2 Turn on display
Now all available piracy data is available in TECDIS and ready for use.
Viewing pirate data in the chart is started by:
1. Open the TECDIS menus.
2. Select te Chart tab
- 266 -
Appendix B:Optional add-ons
3. Click the Layers button
4. Tick for Piracy information in Supplementary Data folder for the
desired chart database
5. Make the appropriate selections in the Piracy Information window
for proper display of current pirate data, as described in the next
section.
B.3.3 Adjust the viewing of piracy data
In the Piracy Information window, it is possible to set criteria for the type
of piracy data to show in the chart, and how the data is shown.
Time Period
The Time Period field contains three options for time-limiting the viewing
of piracy data.
l
l
l
The All choice is selected when all the data is to be displayed regardless of when the incident occurred.
The choice Latest 12 weeks shows all cases in the last 12 weeks, or
the number of weeks that is set with the up / down buttons to the
right.
The last option for the Time Period field allows to select all piratedata within a calendar month selected with the up / down buttons to
the right.
Incident types
The Incident Types field and the associated Select None button has options
for displaying these piracy data types:
l
l
l
l
Hijack and Kidnap, indicated with a red symbol
Armed robbery and Armed assault, indicated with an orange symbol
Attempted attack and Attempted boarding, indicated with a blue
symbol
Theft and Suspicious approach, indicated with a green symbol
- 267 -
l
All cases from last week are highlighted in black color, no matter
piracy data type
By Clicking on a pirate symbol, a red ring is inserted
around the piracy symbol and the Piracy Information
window is extended with additional information about
the selected symbol.
If several symbols are overlapping, the information
window will contain a tab per piracy symbol. When you select a tab in the
information window, the chart will switch focus to the piracy symbol
connected to that tab, and this is indicated with the red ring.
- 268 -
Appendix B:Optional add-ons
B.4 Autopilot (Track control)
TECDIS Track control has to be ordered as an optional feature,
please contact Furuno Norway for more information.
TECDIS has autopilot functionality, and can automatically hold the vessel
at a planned COG.
Track control will work under different circumstances and within the
limits to vessel manoeuvrability. The autopilot functionality is connected
to the vessels sources of position, course and speed information.
check with the autopilot manual for how to use and set up the auto
pilot. TECDIS is approved with the following autopilots:
l
l
Raytheon Anschütz AP2025 PLUS
Emri SEM200/Furuno FAP-2000
B.4.1 Autopilot mode
When TECDIS is connected to an approved autopilot
and Track Control is activated, the Track control
information window will appear directly above the
alarm field in the information panel.
The possible values in the window are:
Offline
No data is received from the autopilot
Manual
The autopilot is in manual control mode
Heading ctrl
The autopilot is in course steer mode
ROT control
The autopilot is in Rate Of Turn control mode
Track Control
The autopilot is in Track Control control mode
External
The autopilot is now in External/Remote control mode
and an autopilot remote control is displayed on the
screen
Override
Check with the autopilot user manual
- 269 -
B.4.2 Sensor surveillance and error tolerance
A TECDIS TCS (Track Control System) has to be connected to:
two independent position sensors
l one course sensor
l one speed sensor
The data from these sensors are continuously monitored by the system
and alarms will be triggered if data is lost or considered invalid. Positions
and course data is compared and triggers alarms if the difference in
course and position exceeds the limits specified in TECDIS Setup, see
Appendix A.
l
If the sensor surveillance detects an error, or any other error in the TCS is
detected, the TECDIS TCS will try to switch to heading control mode, with
the parameter setting that in the best possible way keeps the vessel on the
planned COG.
Values for Set Course and Set Rate Of Turn are sat to the values they were
at the time TECDIS TCS was interrupted.
NB! If both course sensors report errors, or if the autopilot loses
power, the rudder angle will not be affected. It will keep the same
angle as it had at the time the error occurred.
The following events and alerts are displayed when TECDIS TCS is stopped
by the autopilot:
Autopilot
TECDIS
The Track Control Mode indication light turns
off
An alarm is started indicating Track Control Mode
is off.
The Heading
Control Mode
indication light
is turned on
The information field for Track Control changes to
Heading ctrl or Offline if the autopilot communication is lost for more than 20 seconds.
The Track Control Stopped
Alarm is
triggered
The Alarm Autopilot is started and the information
field displays Offline.
- 270 -
Appendix B:Optional add-ons
B.4.3 TECDIS TCS operation
When TECDIS TCS is in Track Control mode, it will work together with the
autopilot to keep the vessel sailing on the planned route (relating to COG).
Before each WP the following sequence is performed:
1.
2a.
Warning
Description
When
Change Course
early warning
This warning is enabled in TECDIS,
1 - 5 minutes before the course
1-5 min
change (WOP), as configured in
before WOL
TECDIS Setup
Change Course
LAST warning
If "Change Course early warning"
(1) was confirmed by the operator, this warning is enabled in
30-60 sek.
TECDIS 30-60 seconds before the before WOL
course change (WOP), as configured in TECDIS Setup
2b. New WP
If "Change Course early warning"
(1) was not confirmed by the
operator, this alarm is activated 30-60 sek.
in TECDIS 30-60 seconds before
before WOL
the course change (WOP), as
configured in TECDIS Setup
3. New WP
If "Change Course LAST warning"
(2a) was not confirmed by the
operator, this alarm is activated
in the TECDIS at the weelover
point(WOP)
4. The Turn (course changing) is performed
Back-up Navigator Alarm
5. from the separate alarm system
At WOL
At WOL
If "Change Course LAST warning"
(2a) or "New WP" (3) was not con30 sec after
firmed by the operator, a back-up
WOL
Navigator Alarm will be activated
on the separate alarm system.
As long as the Track Control is active, the system will, at all times,
continue to keep the vessel on the planned course over ground (COG),
regardless of the alarms and warnings that have been acknowledge by
operator.
- 271 -
B.4.4 Activating Heading Control mode
The Heading button will set the autopilot in
Heading Control Mode
B.4.5 Activating Track Control mode
The Track button will initiate the Track Control
mode, if the following conditions are met:
A route must be selected and activated. The Track button is inactive
if no route is selected and activated.
l •The distance from the vessel's position to the activated route leg
must be within the distance limitations, specified by the ‘Max lane
deviation’ parameter in TECDIS Setup.
l The difference between the vessel's course over ground and
planned course must be less than the limit specified in TECDIS Setup
for "Max course deviation"
l The vessel's speed must be greater than the one set in TECDIS Setup
for "Min speed"
If any of these conditions are not met, the cause will be communicated to
the operator.
l
If the distance from the position of the vessel to the route leg is
greater than this limit, when the route is activated, TECDIS TCS will
ask the operator to specify the first WP for route monitoring. When
a WP is selected, TECDIS TCS will set up a temporary route leg from
the vessel position to the starting point. This can be edited if needed.
- 272 -
Appendix B:Optional add-ons
B.4.6 External (Remote) mode
When the autopilot is set to External (remote) mode, a
dialog box is displayed in TECDIS, showing the current
"Heading", "Set Course" and "Set RoT".
The current "Set Course" can be adjusted in three ways:
by either turning, with the left mouse button, the
wheel situated under "Set Course" displayed
value
l or clicking the red or green arrow under the
wheel
l or by using the mouse scroll wheel.
"Set RoT" can be adjusted by sliding the controller just
below the display for "Set RoT", with the left mouse
button pressed.
l
- 273 -
B.5 TECDIS keypad
This chapter explains the design, setup and usage of TECDIS Keypad.
It features system controlled indicator lights, and auto-dimmable backlit
keys. The unit is protected at IP22 level, and has an expected lifetime of
200.000 operations per key.
B.5.1 The layout
- 274 -
Appendix B:Optional add-ons
B.5.2 Keys
Set the chart presentation to S52 presentation
Move chart view to own vessel position
In numeric mode it is the number 8
Chart panning – up
In menus it has scroll functionality
In numeric mode it is the number 5
Chart panning – down
In menus it has scroll functionality
In numeric mode it is the number 0
Chart panning – left
In numeric mode it is the number 7
Chart panning – right
In numeric mode it is the number 9
Chart panning – up-left
In numeric mode it is the number 4
Chart panning – up-right
In numeric mode it is the number 6
Chart panning – down-left
When an alarm sounds it switches to alarm acknowledge
function
Chart panning – down-right
In numeric mode it is enter
Zoom in
In numeric mode it is the number 1
- 275 -
Zoom out
In numeric mode it is the number 3
Set a Man Overboard symbol in the chart where the vessel is
positioned. The system makes a bearing from the vessel to
the MOB symbol. To turn off the bearing, click the MOB key
again.
Activates Numeric Lock (NUM lock)
Single-click to toggle display of
AIS targets(1st click)
ARPA 1 targets(2nd click)
l ARPA 2 targets(3rd click)
Double-click to view AIS list
l
l
In numeric mode it is a tabulator key (TAB)
Single-click to open the route selection tool
Double-click to switch between activated route 1 and route 2
Single-click to open the Query cursor tool
Double-click to open the position box tool
In numeric mode it is backspace
Opens the bearing tool
In numeric mode it is the number 2
User definable button
User definable button
- 276 -
Appendix B:Optional add-ons
B.5.3 Alarm functionality
When an alarm in TECDIS is activated, the LED light for the alarm acknowledge key will blink continuously until the alarm is viewed and approved,
either with the trackball or with the alarm acknowledge key.
When you have acknowledged the alarms, but the alarm source is still
active, the light will continuously shine.
B.5.4 Navigating your TECDIS with the
keypad
These are the navigation key on the keypad, and they allow you to pan the
chart in all directions (arrow keys), zoom in and out (zoom keys), and
switch presentation to a different position (double click Query Cursor key)
or to own vessel position (center key). Du kan panorere, zoome inn og ut,
samt sentrere kartet på eget skip.
Dobbeltklikker du objektinspektør-knappen så vil posisjonsverktøyet åpnes,
og du kan taste inn en ny posisjon ved å aktivere de numeriske tastene på
tastaturet.
- 277 -
B.5.5 Numeric mode
When you enter a tool or menu in TECDIS which requires insertion of
numbers, you can change to numeric mode using the NUM key.
The LED lights for the numeric keys are ON as long as numeric mode is
active. Pressing the NUM key again will deactivate numeric mode.
In numeric mode you also have backspace, TAB and enter keys available.
B.5.5.1: Alternative numerical functions
In TECDIS numeric keys have generic functions, which are available when
you are not in a tool or menu that requires insertion of numbers.
These functions are as follows:
1. Toggle between the day-, dusk- and night monitor color modes
2. Toggle between display orientations (North, Radar, Head)
3. STD S52 AUTO presentation
4. USER presentation
5. Conning display
6. Weather display (option)
7. Radaroverlay (option)
8. EBL/VRM functions
9. ARPA
10. AIS
Enter: functions as left trackball button in the pointer’s position
- 278 -
Appendix B:Optional add-ons
B.5.6 User defined keys
TECDIS Keypad has two user defined keys. These can be configured as
shortcuts to often used functions, such as video-switching.
The keys are defined in the Setup menu tab, see chapter 7.2: (see page
186).
B.5.7 Video switching
With TECDIS Keypad you can control video switching in TECDIS.
This allows you to temporarily change the monitor input of your TECDIS
monitor, to the video signal you want. For example can ferries use the
TECDIS monitor to display cameras used for docking, which is a situation
where a camera feed is more important to safe sailing than the display of
TECDIS and charts.
TECDIS will still be running, and give audible alarms when needed.
You can easily switch back to displaying the TECDIS system by pressing any
key on the TECDIS Keypad, or a keyboard/trackball connected to the
TECDIS system. The video feed is only connected to the monitor, and
requires no additional software.
Video switching is configured in TECDIS Setup, see appendix A.4 (see page
227).
- 279 -
Video switching can also be turned on from the main toolbar. If Radar
Overlay is configured, video switching is available on right click.
If Radar Overlay is not configured, a VID button is shown instead.
- 280 -
Appendix B:Optional add-ons
B.6 Furuno RCU-018
If a Furuno RCU-018 control unit is connected to the TECDIS system then it
can be used to control the chart system. The trackball can be used to
move the cursor and general system navigation.
NB! Double clicking and drag-and-drop is not supported. The scroll wheel
can be used to modify fields with up/down control, for example the fields
for speed, corridor, radius and stop-time in the route planner. It can also
be used to zoom in and out in the charts. Information on enabling scroll
zoom can be found in the settings chapter.
RCU-018 has the following keys:
Key
Description
Power
Turns the chart system
on/off. This button will not
affect the monitor, which has
to be shut of separately.
VRM
rotary
encoder
Adjust the active VRM.
VRM ON
Activates and displays VRM1
if not shown or if VRM2 is
active. Activates and displays
VRM2 if VRM1 is active.
VRM OFF
Deactivates and removes
VRM1 if both VRM's are
- 281 -
Func.
displayed.
Deactivates and removes
VRM2 if VRM1 is active.
EBL rotary
Adjust the active EBL.
encoder
EBL ON
Activates and displays EBL1 if
not shown or if EBL2 is
active. Activates and displays
EBL2 if EBL1 is active.
EBL OFF
Deactivates and removes
EBL1 if both EBL's are
displayed. Deactivates and
removes EBL2 if EBL1 is
active.
F1
Activated the userdefined function. F1 and F2 is defined in
the setup menu tab, in the auxilary dropdown list.
F2
Activated the userdefined function. F1 and F2 is defined in
the setup menu tab, in the auxilary dropdown list.
ALARM
ACK
Acknowledges alarms generated by TECDIS.
SYSTEM
FAILURE
A red background light in button is visible, and an alarm
sound is audible, when there is a system failure. Press
ALARM ACK to silence the alarm sound. The button will
appear in red until the cause of the problem is found and
corrected.
RADAR
Displays radar overlay and settings panel for radar overlay
adjustment, colour and transparency.
STD DSP
Standard display presentation
(S52) for TECDIS.
1/MARK
Brings up the symbols, lines
and areas menu (mariner
objects).
2/ABC/ P
BRILL
Toggles between day, dusk
and night modes of display.
3/DEF/
MODE
Select presentation mode;
north, course, heading, radar
1 and radar 2.
4/GHI/ OFF Center the chart view on the latest selected VRM/EBL. If no
CNT
VRM/EBL are present, center the chart view on own ship.
- 282 -
Appendix B:Optional add-ons
5/JKL/
SCROLL
Show on-screen keypad for chart
panning. If the button is pressed
while the on-screen keypad for
chart panning is active, the system
activates Auto mode.
6/MNO/
RECORD
Saves a time marker on the
past track record.
7/PQRS/
PLAN
Opens the route planning
tool.
F9 key
8/TUV/
Show/hide conning screen.
MONITOR
9/WXYZ/
NEXT
Same functionality as the Enter key on the supplied
keyboard. Also emulates left mouse button for the cursor
position.
CANCEL/
SENSOR
Opens the NMEA data status window. Closes any open
window.
0/space
CU/TU R
Recentre the chart view to own vessel position and activate
Auto mode.
SHIFT/
HELP
SHIFT: toggles between upper-case and lower-case letters.
HELP: Shows object information about the object in the
cursor position.
MENU
Opens the settings menu.
+RANGE-
Adjust the chart scale.
MOB
Places a MOB marker in the
current position own vessel is
in.
and F10
EVENT
Saves an event marker in
own vessel position.
and F12
TARGET
DATA
Show information for selected ARPA or AIS target.
GAIN
Adjust transparency of readar overlay.
A/C RAIN
A/C SEA
- 283 -
± keys
This blank page is automatically inserted where appropriate to ensure that
new Chapters begin on a recto page.
x C:
Frequently asked
questions
In this section you will find procedures and answers to common questions. If there is a procedure
you want us to add, please contact us at [email protected].
C.1Why isn't my route activated?
287
C.2The quickest way to make a route - quick route
288
C.3How do I keep my TECDIS units up to date
289
C.4How do I turn on T&P and AIO
290
C.4.1ENC-integrated T&P notices
290
C.4.2Jeppesen T&P
290
C.4.3Admiralty Information Overlay - AIO
291
C.4.4Manual chart corrections
292
C.5How do I activate Tides
293
C.6How to transfer system configuration
295
- 286 -
Appendix C:Frequently asked questions
C.1 Why isn't my route
activated?
The most common cause that a route is not activated, is that the TECDIS
has been updated to a version that does not have the same options for
route activation as the version you updated from.
You can activate you selected route in several ways, both automatically
and manually. The activation method you choose should be affected by
whether or not you can change the waypoint list or not.
This table provides an overview:
Automatic activation when
inside the route corridor
For this to be possible the auto route
activation has to be selected in the Safe
menu tab
Manual activation when inside Is done by pressing the activate route butthe route corridor
ton on the route planner toolbar.
Automatic activation, with
placing of additional waypoint
creating a route leg from the
vessel position to the first
waypoint
For this to be possible the auto route
activation has to be selected in the Safe
menu tab, and Allow route activation
entry lane has to be selected in TECDIS
Setup.
For this to be possible Allow roTECDISute
Manual actiation, with placing activation entry lane has to be selected
of additional waypoint creating in Setup.
a route leg from the vessel posIs done by pressing the activate route
ition to the first waypoint
button on the route planner toolbar.
- 287 -
C.2 The quickest way to
make a route - quick
route
In TECDIS you can create and activate a route for sailing in only three
steps
1. Start the Bearing tool from the main menu
2. Move the cursor to the point in the chart where you want to place
the second waypoint, and left click the mouse.
3. Move the cursor to the point in the chart where you want to place
the third (and last) waypoint, and right click the mouse.
4. Press OK in the message box that appears.
The quick route is now drawn, starting with waypoint 1 at the current
position of own vessel. The route is activated, and route monitoring
appears.
The quick route is a useful tool when you for example have to deviate
from the planned voyage, but still want the route to be checked and you
want route monitoring.
- 288 -
Appendix C:Frequently asked questions
C.3 How do I keep my
TECDIS units up to date
Regular chart updates is normally a set task for most navigators. What is
often forgotten, is to also keep the TECDIS software updated.
TECDIS software comes in a new version roughly 3-4 times a year. By
always keeping updated to the latest version, you are getting access to the
latest features and bug fixes.
TECDIS is updated by downloading TECDISupdate.exe from
http://telko.no/site/support. On the website we state when the update was
released, and you will also find information about which changes have
been made to the program, through:
1. TECDIS Feature Guide, released together with each new edition of
the TECDIS program. Here the most important new and changed features are explained.
2. The changelog for TECDIS, which is updated with all changes made
to the TECDIS program.
It is also posiible to download previous Feature Guides, if you are updating
from an even earlier version.
- 289 -
C.4 How do I turn on T&P
and AIO
T&P (temporary and preliminary notices) are an essential part of the work
needed to keep charts updated for safe sailing. TECDIS has four methods
for handling T&P notices:
1.
2.
3.
4.
ENC integrated notices
Jeppesen T&P
Admiralty Information Overlay - AIO
Manual chart corrections
C.4.1 ENC-integrated T&P notices
ENCintegrated T&P notices is offered by more and more hydrographic
offices. This option integrates the T&P notices to the ENC charts, and
every time you upgrade your charts the T&P notices are updates as well.
The status of implementation for different flag states can be seen at
https://www.primar.org/web/10180/60.
Even with ENCintegrated T&P notices, it is often wanted by inspectors that
the navigator has a conscious relationship with Notices to Mariners and
T&P in the charts. This is not possible with ENC-integrated T&P, as these
are automatically controlled by the chart core of the system.
To display consciousness with regards to T&P, inspectors often require/expect navigators to use another method for handling chart corrections
from Notice to Navigators.
C.4.2 Jeppesen T&P
Jeppesen T&P is an optional service in TECDIS. To acquire Jeppesen
T&P, contact Jeppesen Marine at [email protected].
Jeppesen T&P requires Jeppesen Professional+, Jeppesen ENC or
JeppesenPrimar.
Jeppesen T&P display T&P notices in a separate datalayer in TECDIS. This
datalayer can be switched on and off whenever wanted by the navigator.
This is done in the following way:
- 290 -
Appendix C:Frequently asked questions
1
Press the Menu button to
open the menu tabs
2
Select the Chart menu
3
Make sure text(other) and
INT1 is activated
4
Press the Layers button A
new window appears.
5
In the dropdown list, select
the chart database you want
to switch on T&P for
6
Check the box next to Temporary and preliminary
notices to activate T&P. To
deactivate, uncheck the box.
C.4.3 Admiralty Information Overlay - AIO
AIO is an optional service in TECDIS To acquire AIO, contact your
AVCS dealer
- 291 -
AIO requires AVCS charts, and TECDIS AIO Update has to be
installed.
AIO display T&P notices in a separate datalayer in TECDIS. This datalayer
can be switched on and off whenever wanted by the navigator. This is
done in the following way:
1
Press the Menu button to
open the menu tabs
2
Select the Chart menu
4
Press the Layers button A
new window appears.
5
In the dropdown list, select
the chart database labeled
S63-GB.
6
Check the box next to Admiralty Information Overlay to
activate AIO. Deactivate by
unchecking the box.
C.4.4 Manual chart corrections
For more information about manual chart corrections, see 6.3.3: Manual
chart corrections(see page 163).
- 292 -
Appendix C:Frequently asked questions
C.5 How do I activate Tides
1. The Jeppesen Tides service requires that either JeppesenPRIMAR or
Jeppesen Professional+ is nstalled and activated on your TECDIS
unit. Check this by opening the Setup menu and making sure that at
least one of the chart databses is activated.
2. Tidal stations are placed in a separate information layer superimposed over the chart. This layer is activated in the Chart menu, by
pressing the Layers button. Trykk på den.
- 293 -
3. Now the Layers window appear. Here you select the activated chart
databasem and mark the box besides C_MAP Tides.
4. Jeppesen Tides is now activated and ready for use By pressing the
Tide button on the information panel, now the tidal window will
open and show the tidal information for the closest tidal station.
Tidal stations are displayed in the chart as follows:
- 294 -
Appendix C:Frequently asked questions
C.6 How to transfer system
configuration
When you exchange or upgrade to a new TECDIS unit, you can transfer all
system configurations and settings from the old unit to the new.
This is done in the following way:
1. Before the old unit is disassembled, insert the TECDIS Service Key in
an available usb port.
2. Then start and stop the TECDIS Setup program once. When you do
that, the system automatically generates a T-setup-xxxxx.tsz file containg your configuration. The file is automatically placed on the
TECDIS Service Key.
3. Remove the TECDIS Service Key from the old unit.
4. Disassemble the old TECDIS unit, and assemble the new TECDIS unit.
5. Insert the same TECDIS Service Key in the new unit.
6. Open TECDIS Setup, and go to the Specifications tab.
7. Press the restore saved default values button.
Your configuration has now been transferred to the new unit.
This minimizes the risk for errors, and makes changing computer unit an
easy task.
Note: This will not transfer your routes/tracks and symbols to the
new unit. That is done with the procedure described in chapter 7.5:
(see page 199), and using the function Copy out to file.
- 295 -
This blank page is automatically inserted where appropriate to ensure that
new Chapters begin on a recto page.
Troubleshooting
In this chapter you will find error codes and system warnings you may encounter in TECDIS. You
will also find plausible causes and one or more solutions.
D.1Trobleshooting - general
299
D.2Troubleshooting - connection issues
301
D.2.1General tests
301
D.2.2Connection tests for internet
301
D.2.3Connection tests for email
302
D.3Troubleshooting - S63 Chart Loader
303
D.4Troubleshooting - Weather overlay
308
D.4.1Connection errors
308
D.4.2Error messages
308
- 298 -
Appendix D:Troubleshooting
D.1 Trobleshooting - general
In this section you will find possible solutions for general issues in TECDIS.
Experienced issue
Cause
Solution
I can't activate the
route
Route activation
For more information, see chapter 4.1.7 on
alternatives are not
page 75.
set up correctly.
The TECDIS certificate (MED-B) only has to be valid until the unit is
My TECDIS cerinstalled. If new hardware is installed (example: monitor), an updated
tificate has expired.
certificate has to be downloaded from http://telko.no/site/support.
I can't access the
Tides function.
Tides in TECDIS is a
service by Jeppesen.
Install and activate viewing of the following
chart databases:
l
l
Professional+
JeppesenPrimar
Routes are not transferred correctly
from one TECDIS to
Your route database
the other.
might be corrupted. Contact us at [email protected] for further
I get an error mesinstructions.
sage when I try to
save the route
I can't save my past Your track database
track
might be corrupted.
If you have any doubts about the chart information you are viewing in INT1 mode, switch to
I get the message
INT1 is not approved
S52 mode for confirmation. S52 is the only
"not official display" as the sole mode of
presentation method approved as standalone.
when I use INT1
presentation of
You can still use other presentation modes as
chart view.
charts.
long as you have the option of switching back to
S52 when you desire.
The AIS button on
the main toolbar is
a) contact your Furuno Norway dealer for
greyed out/does not This requires that an
purchase
work
add-on is:
b) Check that your TECDIS license has the addThe Radar button(s)
a. purchased
on(s) activated. See appendix A.6 Licences(see
on the main toolbar
b. activated
page 235)
is greyed out/does
not work
- 299 -
The Weather Overlay button on the
main toolbar is
greyed out/does not
work
AIS targets are displayed with MMSI
number and not
their names.
TECDIS has not
received the name
of the vessel yet
I cannot place a
MOB symbol in the
chart
To place MOB symbols the vessel has to travel at a speed lower than
0.5 knots.
I don't have access
to the Replay functionality
The replay functionality requires that the vessel is not moving. The
vessel speed has to be lower than 0.5 knots.
Wait until the AIS transmitter on the targeted
vessel has sent the vessel name. This will not
take long.
- 300 -
Appendix D:Troubleshooting
D.2Troubleshooting - connection
issues
D.2.1General tests
A
Check your subscription
Make sure your subscription hasn't expired.
Try another connection method
B
If you are using internet through the Furuno Network, try downloading by email. If you
are already using email, try another email service. If you now get access, you have
verified that the issue is with the network connection, and not the TECDIS system or
the service you are using.
Try to update the TECDIS software
C
Telko AS provide you with free software updates for your TECDIS. These contain both
new functionality and big fixes. The issue you are experiencing might have been
corrected in an update. Software updates are available at http://telko.no/site/support.
D.2.2Connection tests for internet
Make sure the internet connection is activated
D
Approved TECDIS installations configured with direct internet access must have on/of
switch for internet.
Verify that you have access to the servers
http://distribution.c-map.no
l http://datacenter.c-map.no
l http://datacenter.jeppesen.com
These are all opened in Internet Explorer.
l
E
Connection OK = The error is in your DNS settings
If E failed, you can connect to the servers with their IP addresses
F
http://80.239.21.75
http://80.239.21.103
Connection OK = The error is in your DNS settings
G
Of F failed, check that the firewall does not block you connection
- 301 -
D.2.3Connection tests for email
H
Check that the answer mail has not been placed in the spam folder
I
Try a lower max size for attachments (in the different function menus)
J
Make sure you are not trying to send/load old files
K
Only update one unit at a time If both are updated at the same time it is easy to mix
the files.
- 302 -
Appendix D:Troubleshooting
D.3Troubleshooting - S63 Chart
Loader
Each time the S63 Chart Loader is unable to load charts, an error message is displayed. The
table below explains the different error messages.
Error message
Cause
Action
Format error
The saved Cell Permit
loading installed files are not readable
cell permits
by the system.
Failure to access The saved Cell Permit
cell permit
files are not readable
storage
by the system.
No eToken
detected
SSE 11 - Cell
Permit file not
found. Load the
permit file
provided by the
data supplier.
No TELKO eT (code
plug) is connected to
TECDIS or is defective.
Check that TELKO eT (code plug) is connected
to the system and that a small red light is
showing on it. Take it out of the usb port, and
set it back in again. If this did not help, try
another usb port. If this still does not help,
contact a TECDIS servicepartner.
During loading: Check that the file exists and is
readable by copying it to a temporary location.
During loading: The
required Cell Permit
file was not found or
could not be loaded.
Under erasure: Stop and restart Chart S63
Loader and check the Cell Permit list under the
Licenses tab. If the Cell Permit which was
Under erasure: The
deleted is still visible in the Cell Permit list,
required Cell Permit
delete this file: "C: \ Program Files \ TECIDS \
file was not found or is
S63SYS \ PMT.DAT" and download all the Cell
already deleted.
Permits again.
SSE 11 - Cell
Permit file
contains no
The specified Cell
permits. Contact
Permit file contains no
your data
Cell Permit
supplier and
obtain a new
permit file.
SSE 12 - Cell
Stop Chart S63 Loader, delete the file "C: \
Program Files \ TECIDS \ S63SYS \ PMT.DAT"
and load all Cell Permits again.
Contact the Cell Permit supplier and ask for a
new Cell Permit file. Load the new Cell Permit
when the file is received.
During S63 startup: The
During S63 startup: Stop Chart S63 Loader,
saved Cell Permit has
- 303 -
Permit format is
incorrect.
During loading: The Cell
Contact your
data supplier and Permit have errors or is
incorrectly formatted.
obtain a new
permit file.
SSE 13 - Cell
Permit is invalid
(checksum is
incorrect).
Contact your
data supplier and
obtain a new
permit file.
During S63 startup: Stop Chart S63 Loader,
During S63 startup: The delete the file "C: \ Program Files \ TECIDS \
saved Cell Permit has S63SYS \ PMT.DAT" and load all the Cell Permit
become unreadable.
again.
During loading: The Cell During loading: Check that the file is actually a
Permit have errors or is Cell Permit file. If this is confirmed, contact the
incorrectly formatted. Cell Permit supplier and ask for a new Cell
Permit file.
SSE 14 - Incorrect
system date,
check that the
computer clock The system date has
(if accessible) is been reset.
set correctly or
contact your
system supplier.
SSE 21 Decryption failed
no valid cell
permit found.
Permits may be
for another
system or new
permits may be
required, please
contact your
supplier to obtain
a new licence.
SSE 19 - Permits
are not valid for
this system.
Contact your
data supplier to
obtain the
correct permits.
During loading: Check that the file is actually a
Cell Permit file. If this is confirmed, contact the
Cell Permit supplier and ask for a new Cell
Permit file.
Set the correct system date. If the problem
persists, contact an authorized TECDIS service
partner.
A S63 encrypted chart
cell file is corrupted or
incorrect and / or an
outdated Cell Permit is
in use.
Obtain a valid Cell Permit from the chart
supplier and enter them in the S63 Chart
Loader. Try loading the charts again. If it is still
not functional, contact your chart provider.
Cell Permit for one or
more S63 chart cells do
not contain the correct
decryption keys.
- 304 -
Appendix D:Troubleshooting
SSE 15 - One or
more ENC
subscriptions in
this cell permit
file have expired. One or more of the Cell
Please contact
Permits have expired.
your data
supplier to renew
the subscription
licence.
SSE 15 - All ENC
subscriptions for
this ENC media
have expired.
Please contact
your data
supplier to renew
the subscription
licence.
SSE 15 Subscription for
this ENC has
expired. Please
contact your data
supplier to renew
the subscription
licence.
All Cell Permits for ENC
cells which are available on chart media
(CD-ROM, USB memory
stick, etc.) are expired. Obtain a valid Cell Permit from the chart
supplier and enter them in the S63 Chart
Loader.
Cell Permit for the
specified chart cell is
expired and ENC cell
has not been loaded.
WARNING: SSE
15 - One or more
ENC subscriptions
have expired.
Contact your
data supplier for
a subscription
renewal.
During S63 startup: One
or more of the installed
Cell Permits are
expired.
WARNING: SSE
20 - One or more
ENC subscriptions
will expire in less
than 30 days.
Contact your
During S63 startup: One
or more of the installed Obtain a valid Cell Permit from the chart
Cell Permits will expire supplier and enter them in the S63 Chart
in less than 30 days.
Loader.
During loading: One or
During loading: One or
more of the Cell
Permits have expired.
- 305 -
more Cell Permits for
ENC cells which are
data supplier for available on chart
a subscription
media (CD-ROM, USB
renewal.
memory stick, etc.) will
expire in less than 30
days.
SSE 20 Subscription for
this ENC will
expire in less
than 30 days.
Please contact
your data
supplier to renew
the subscription
licence.
Cell Permit for the
specified chart cell
expires in less than 30
days.
SSE 26 - This ENC
is not authenticated by the
IHO acting as the
Scheme Administrator.
The chart cell is signed
by the chart supplier,
but not by the IHO, as
the S-63 standard
requires.
Specified path
The specified location
does not contain does not contain valid
valid S63 data
S-63 data.
Although the S-63 standard specifies that the
chart cells should be signed by the IHO, in the
current practice, this signature is done by the
chart suppliers themselves. This message
informs the user about this and should not be
considered a failure.
Verify that the specified location contains an S63 data source.
The S63 Chart Loader
supports S63 data
This system does
format version 1.0 and Contact the chart supplier to obtain S-63 chart
not support the
2.0 of the S63 standard. media according to version 1.0 or 2.0 of the SS63 version of
The specified S63 data 63 standard.
specified data
source uses a different
version.
The S63 Chart Loader
supports S63 data
This system does
format version 1.0 and Contact the chart supplier to obtain S-63 Cell
not support this
2.0 of the S63 standard. Permit according to version 1.0 or 2.0 of the Scell permit
The specified Cell
63 standard.
version
Permit file uses a
different version.
- 306 -
Appendix D:Troubleshooting
The IHO certificate is
SA digital certiloaded, but is not
ficate has not yet
verified for authenbeen trusted
ticity.
Certificate has
not yet been
trusted
A certificate is loaded,
but is not verified for
authenticity.
Inspect the certificate and confirm the authenticity accordi6.5.3: Certificate for chart providers
(see page 173)Map Update (ENC Update CD).
- 307 -
D.4Troubleshooting - Weather
overlay
This chapter provides some guidelines for troubleshooting connection errors for the weather
overlay, and contains a list of error messages and descriptions of their cause and/or solution.
D.4.1Connection errors
For any problems occurring during the download of weather data, regardless of the connection
type used, TECDIS service partner and / or Jeppesen Marine will be able to provide very useful
assistance in tracking down the cause of weather download problems.
Jeppesen Marine's servers have logs that show whether the weather download attempts actually
achieved contact with Jeppesen Marine's servers or if the weather download procedure was
successful. They will also be able to confirm whether the subscription is intact.
In order to provide help and assistance, regarding TECDIS system or chart - weather databases,
Jeppesen Marine or your chart supplier, will need your System ID / TELKO eT number.
Make sure your subscription is valid. The expiration date can be viewed in the weather window
by pressing: Data, New Download, and Show Subscription buttons.
D.4.2Error messages
The following list displays some of the error messages that can be experienced in the weather
overlay functionality.
Error message
Description
Current weather data lacks
parameters set in active alarm
conditions. Review alarm
settings.
This is not an error. It is simply an indication that the currently
loaded Weather data file does not contain all of the weather
parameters you have specified in your selected alarm conditions.
No current weather forecasts
are available.
This is not an error. It is simply an indication that you have no
current Weather data files on the system.
No cyclones in effect at last
download.
This is not an error. It is a message to inform you that the
Cyclone presentation is not available because there are no
cyclones at this time.
Communication Error
There was a problem during the Weather data download.
You must be in show checkbox This message is due to a known error. Update TECDIS software
mode to set this date
to the latest version
ERROR: Weather components
There is a problem with C-Map System files in the installation.
- 308 -
Appendix D:Troubleshooting
are not initialized
Contact TECDIS service support for assistance.
Weather Data Error: The
internal component processing There is a problem with C-Map System files in the installation.
the weather data cannot be
Contact TECDIS service support for assistance.
created.
Cyclone Data Error: The
internal component processing There is a problem with C-Map System files in the installation.
the weather data cannot be
Contact TECDIS service support for assistance.
created.
Weather Data Error: License
interface cannot be obtained.
There is a problem with C-Map System files in the installation
or with the license in the "System ID / TELKO eT"( codeplug).
Contact TECDIS support for assistance.
Cyclone Data Error: License
interface cannot be obtained.
There is a problem with C-Map System files in the installation
or with the license in the "System ID / TELKO eT"( codeplug).
Contact TECDIS support for assistance.
Weather Data Error: File is not
The Weather data file is missing from the system.
found.
Weather Data Error:
Corrupted or wrong format
file.
The Weather data file has become corrupted or is not provided
by Jeppesen Marine.
Weather Data Error: The file
data cannot be accessed.
The system cannot access the Weather data file.
Weather Data Error: Problems The Weather data file does not appear to be licensed to this
with weather data licensing.
system.
Cyclone Data Error: File is not
found.
The Cyclone data file is missing from the system.
Weather Data Error:
Corrupted or wrong format
file.
The Cyclone data file has become corrupted or is not provided
by Jeppesen Marine.
Cyclone Data Error: Wrong
format of cyclones data.
The Cyclone data file has become corrupted or is not provided
by Jeppesen Marine.
Cyclone Data Error: Wrong
point values in cyclones.
The Cyclone data file has become corrupted or is not provided
by Jeppesen Marine.
Cyclone Data Error: The file
data cannot be accessed.
The system can not access the Cyclone data file.
Cyclone Data Error: Problems
with weather data licensing.
The Cyclone data file does not appear to be licensed to this
system.
The specified file did not have
a .grb or .xml extension.
The Import feature can only load files with a *.grb or *.xml file
extension. Import of a file with another extension was
- 309 -
attempted.
- 310 -
Furuno Norway
Furuno Norway is the worldwide distributor of TECDIS.
Head Office,
Aalesund
Branch Office, Deep
Sea
Furuno Norge AS
Furuno Norge AS
Visitor address/ shipment
address:
Visitor address/ shipment
address:
Sjømannsveien 19
Øvre Fyllingsvei 81
N-6008 Aalesund
N-5162 Laksevåg
Postal address:
Postal address:
Servicebox 11
Øvre Fyllingsvei 81
N-6025 Aalesund
N-5162 Laksevåg
Telephone: +47 70 10 29 50
Telephone: +47 55 94 41 41
Telefax: +47 70 10 29 51
Telefax: +47 55 94 41 51
E-mail: [email protected]
Website: www.furuno.no
Service Phone: +47 99216950
Our service telephone is served when offices are closed