1
INSPIRE ®
ImageStreamX ® System Software
User's Manual
Version Mark II, January 2013
For updates log in at www.amnis.com
Patents and Trademarks
Amnis technologies and products are protected under one or more of the following U.S. patents: 6211955; 6249341; 6256096; 6473176; 6507391; 6532061;
6563583; 6580504; 6583865; 6608680; 6608682; 6618140; 6671044; 6707551;
6763149; 6778263; 6875973; 6906792; 6934408; 6947128; 6947136; 6975400;
7006710; 7009651; 7057732; 7079708; 7087877; 7190832; 7221457; 7286719;
7315357; 7450229; 7522758, 7567695, 7610942, 7634125, 7634126, 7719598,
7889263, 7925069,8005314, 8009189, 8103080, 8131053.
Additional U.S. and corresponding foreign patent applications are pending.
Amnis, the Amnis logo, ImageStream, INSPIRE, IDEAS, SpeedBead, FISHIS are
registered or pending U.S. trademarks of EMD Millipore.
All other trademarks are acknowledged.
Disclaimers
The screen shots presented in this manual may vary in appearance from those on
your computer, depending on your display settings.
The Amnis® ImageStream® cell analysis system is for research use only and not
for use in diagnostic procedures.
Technical Assistance
Amnis Part of EMD Millipore
645 Elliott Avenue W Suite 100
Seattle, WA 98119
Phone: 206-374-7000
Toll free: 800-730-7147
www.amnis.com
Contents
Patents and Trademarks
ii
Disclaimers
ii
Technical Assistance
ii
Contents
iii
General Information and Safety
2
Declaration of Conformity
4
Explanation of Symbols
5
Electrical Safety
6
Sécurité Electronique
6
Laser Safety
7
Sécurité Laser
8
Biological Safety
9
Sécurité BiologiqueBiorisques:
9
Spare Parts List
9
Technology Overview
12
Fluidics
14
Sterilizer, Cleanser, and Debubbler
14
Waste Fluid
14
Sheath Fluid
14
INSPIRE User Interface
15
The Image Gallery
16
Image Gallery Tools
16
Image Display Tools
16
Setting the Image Display Properties
17
The Analysis Area
18
Analysis Area Tools
18
The Instrument Control Panel
19
Menu Bar
24
Daily Operations
28
Turning on the ImageStreamX:
28
Preparing to run and calibrating the ImageStreamX
28
Data Acquisition
30
Sample order:
30
Loading and running the sample:
30
Collecting and saving the data files
32
Optional settings
35
Squelching Debris
35
Setting ImageStreamX Speed and Sensitivity
35
Daily Shutdown Procedure
36
Optional upgrades
37
Using EDF
To collect a data file using the EDF element
37
37
Using MultiMag
38
Using the Autosampler
38
To begin
39
ASSIST Tab
45
ASSIST Calibrations
47
Camera Synchronization Calibration
47
Spatial Offsets Calibration
48
Dark Current Calibration
49
Brightfield Crosstalk Coefficient Calibration
50
Core Stage Position Calibration
51
Horizontal Laser Calibrations
52
Side Scatter Calibration
53
Retro Calibration
54
Autosampler Nest Calibration
55
ASSIST Tests
56
Excitation Laser Power Tests
56
BF Intensity Selection Test
57
BF Uniformity Test
58
Camera Noise Test
59
Flow Core Axial Stability Test
60
Flow Core Lateral Stability Test
61
Flow Core Position Test
62
Focus Offset Beads Test
63
Focus Percentage Test
64
Focus Uniformity Test
65
Image Quality Ensquared Energy Test
66
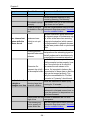
System
69
Software
69
Image
69
Intensity
69
Chapter 1
Information and Safety
This section covers safety information for operating the Amnis
ImageStreamX® multispectral imaging flow cytometer. Anyone who
operates the ImageStreamX should be familiar with this safety
information. Keep this information readily available for all users.
The safety information consists of the following areas:
•
“General Information and Safety”
•
“Explanation of Symbols”
•
“Electrical Safety”
•
“Laser Safety”
•
“Biological Safety”
-1-
Chapter 1
General Information and Safety
The ImageStreamX imaging flow cytometer is manufactured by Amnis Corporation
and has a rated voltage of 100–240 VAC, a rated frequency of 50/60 Hz, and a rated
current of 3 A. The years of construction were 2004–2012, and the product contains
CE Marking.
Environmental conditions:This instrument was designed for indoor use at an
altitude of less than 2000 m; at a temperature from 5oC through 40oC; and at a
maximum relative humidity of 80% for temperatures up to 31oC, with the maximum
relative humidity decreasing linearly to 50% at 40oC. The main’s supply may not
fluctuate more than +/– 10% and must meet transient over voltage category (II). The
instrument is evaluated to Pollution Degree 2.
Noise level: The noise level of the ImageStreamX is less than 70 dB(A).
Weight: 160 kg.
Ventilation: Provide at least 3 inches of clearance behind the instrument to maintain
proper ventilation.
Disconnection: To disconnect the instrument from the power supply, remove the
plug from the socket outlet—which must be located in the vicinity of the machine and
in view of the operator. Do not position the instrument so that disconnecting the
power cord is difficult. To immediately turn the machine off (should the need arise),
remove the plug from the socket outlet.
Transportation: The ImageStreamX relies on many delicate alignments for proper
operation. The machine may be moved only by an Amnis representative.
Cleaning: Clean spills on the instrument with a mild detergent. Using gloves clean
the sample portal and sample elevator with a 10% bleach solution. Dispose of waste
using proper precautions and in accordance with local regulations.
Preventative maintenance: The ImageStreamX contains no serviceable parts.
Only Amnis-trained technicians are allowed to align the laser beams or otherwise
repair or maintain the instrument. The instrument fluidic system is automatically
sterilized after each day’s use. This reduces the occurrence of clogging. Tubing and
valves are replaced by Amnis service personnel as part of a routine preventive
maintenance schedule.
Access to moving parts: The movement of mechanical parts within the instrument
can cause injury to fingers and hands. Access to moving parts under the hood of the
ImageStreamX is intended only for Amnis service personnel.
Protection impairment: Using controls or making adjustments other than those
specified in this manual can result in hazardous exposure to laser radiation, in
exposure to biohazards, or in injury from the mechanical or electrical components.
FCC compliance: This equipment has been tested and found to comply with the
limits for a Class A digital device, pursuant to part 15 of the FCC rules. These limits
-2-
General Information and Safety
were designed to provide reasonable protection against harmful interference when
the equipment is used in a commercial environment. This equipment generates,
uses, and can radiate radio-frequency energy and, if not installed and used in
accordance with the instruction manual, can cause harmful interference to radio
communications. The operation of this equipment in a residential area is likely to
cause harmful interference—in which case the user will be required to correct the
interference at the user’s own expense.
-3-
Chapter 1
Declaration of Conformity
-4-
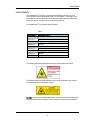
Explanation of Symbols
Explanation of Symbols
Table 1:
Label
Location
Hazard
Waste tank
Risk of exposure to transmissible biological disease.
Power supply cover
Risk of injury by electric
shock.
Power supply
Protective earth ground.
Inside surface of hood
Risk of exposure to hazardous laser radiation.
Interior, side panels near
Risk of exposure to hazrelease mechanisms and
ardous laser radiation.
next to hood latch release
No laser radiation is accesOn the back of the instrusible to the user during norment
mal instrument operation.
-5-
Chapter 1
Electrical Safety
Equipment ratings: The ImageStreamX is rated to the following specifications: 100–
240 VAC, 50/60 Hz, and 3A.
Electrical hazards are present in the system, particularly in the main power supply.
To protect against electrical shock, you must connect the instrument to a properly
grounded receptacle in accordance with the electrical code that is in force in your
region.
Sécurité Electronique
Alimentation: 100–240 V altenatif, 50/60 Hz, 3A.
Les hazards électrique se trouvent dans l’appareil, surtout prés de la source
d’alimentation. Pour éviter les choks électriques, introduire la lame le plus large de la
fiche dans la borne correspondante de la prise et pousser à fond.
-6-
Laser Safety
Laser Safety
The ImageStreamX is a Class 1 laser device and complies with the U.S. FDA
Center for Devices and Radiological Health 21 CFR Chapter 1, Subchapter J. No
laser radiation is accessible to the user during normal instrument operation. When
the hood is opened, interlocks on the hood turn the lasers off.
The ImageStreamX may have the following lasers:
Table 1:
Wavelength
Maximum Power
370-380 nm
30 or 85 mW
400-413 nm
150 mW
483-493 nm
200 mW or 400 mW (high power option)
558-562 nm
200 mW
592-593 nm
300 mW
635-647 nm
720-740 nm
150 mW
50 mW
775-800 nm
100 mW
815-840 nm
180 mW
The following laser warning label appears on the inside surface of the hood:
The following laser warning label appears on the interior side panels near release
mechanisms and next to hood latch release.
Caution: Using controls, making adjustments, or performing procedures other than
those specified in this manual may result in hazardous exposure to laser radiation.
-7-
Chapter 1
Sécurité Laser
L'ImageStreamX c'est une appareil au laser, Classe I, qui se conforme à U.S. FDA
Center for Devices and Radiological Health 21 CFR Chapitre 1, subchapitre J.
Aucune radiations laser sont accessible a l'utilsateur pendant le fonctionnement
normal. Quand le capot est ouvert, les enclenchements eteindents les lasers.
ImageStreamX peut avoir les lasers suivants:
Longueurd’opnde
La Puissance Maximale
370-380 nm
30 or 85 mW
400-413 nm
150 mW
483-493 nm
200 mW or 400 mW (high power option)
558-562 nm
200 mW
592-593 nm
300 mW
635-647 nm
150 mW
720-740 nm
50 mW
775-800 nm
100 mW
815-840 nm
180 mW
Les etiquettes d’avertissement suivantes sont placeés dans l’interior du capot:
Les etiquettes d’avertissement suivantes sont placeés dans L'Intérieur, de
panneaux latéraux près de mécanismes de libération et à côté du loquet de
fermeture de capot.
Avertissement: L’utilisation des commandes ou les rendement des procedures
autres que celle preciseés aux presentes peuvent provoquer une radioexposition
dangereuse.
-8-
Biological Safety
Biological Safety
Biohazards: The Image Stream is rated at BSL1. Do not load or flush samples
containing infectious agents without first exposing the sample to inactivating
conditions. It is recommended that samples be fixed in 2% paraformaldehyde for at
least 10 minutes before running the samples on the ImageStreamX.
The use, containment and disposal of biologically hazardous materials are required
to be in accordance with Personnel Protective Equipment Directive 93/95/E and are
the responsibility of the end user. Follow all local, state, and federal biohazardhandling regulations for disposal of the contents of the waste reservoir.
Prevent waste-reservoir overflow by emptying the container when the waste
indicator indicates that it is full.
Run the instruments sterilize routine after each day’s use. Note that this procedure
has not been proven to result in microbial sterility.
Sécurité BiologiqueBiorisques:
L'image Stream est évalué à un niveau de sécurité biologique L1. Ne pas acquérir ou
vider des échantillons contenant des agents infectieux sans les avoir inactivés. Il
est recommandé que les échantillons soient fixés dans du paraformaldéhyde 2%
pendant au moins 10 minutes avant d'acquérir des échantillons avec
l’ImageStreamX.
L'utilisation, le confinement et l'élimination des matériels biologiques dangereux sont
tenus d'être en conformité avec les normes de sécurité relatives au laboratoire et de
la directive 93/95/E et restent sous la responsabilité de l'utilisateur. Respectez la
réglementation en vigueur pour le traitement et l'élimination des déchets dans des
réservoirs prévus à cet effet.
Prévenir l'accumulation des déchets en vidant le réservoir lorsque l'indicateur
indique qu'il est plein. Stériliser les instruments de routine après chaque journée
d'utilisation. Notez que cette procédure ne garantit pas la stérilité vis à vis des
microbes.
Spare Parts List
The instrument contains no serviceable parts. Only Amnis-trained technicians are
allowed to repair, maintain, and set up the alignment of the laser beams.
-9-
Chapter 2
Introduction to the ImageStreamX®
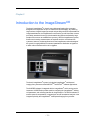
The Amnis ImageStreamX is a bench top multispectral imaging flow cytometer
designed for the acquisition of up to 12 channels of cellular imagery. By collecting
large numbers of digital images per sample and providing numerical representation of
image-based features, the ImageStreamX combines the per cell information content
provided by standard microscopy with the statistical significance afforded by large
sample sizes common to standard flow cytometry. With the ImageStreamX system,
fluorescence intensity measurements are acquired as with a conventional flow
cytometer; however, the best applications for the ImageStreamX take advantage of
the system’s imaging abilities to locate and quantitate the distribution of signals on
or within cells or between cells in cell conjugates.
The Amnis ImageStreamX system includes the ImageStreamX multispectral
imaging flow cytometer and the INSPIRETM and IDEASTM software applications.
The INSPIRE software is integrated with the ImageStreamX and is used to run the
instrument. INSPIRE also provides tools for configuring the ImageStreamX defining
cell parameters, and collecting data files for image analysis. The IDEAS software is
used for spectral compensation, image analysis as well as statistical analysis of the
images acquired by the ImageStreamX multispectral imaging flow cytometer.
- 11 -
Chapter 2
Technology Overview The ImageStreamX acquires up to twelve images simultaneously of each cell or
object including brightfield, scatter, and multiple fluorescent images at rates of up to
5000 objects per second. The time-delay-integration (TDI) detection technology
used by the ImageStreamX CCD camera allows up to 1000 times more signal to be
acquired from cells in flow than from conventional frame imaging approaches.
Velocity detection and autofocus systems maintain proper camera synchronization
and focus during the process of image acquisition. The following diagram illustrates
how the ImageStreamX works.
Hydrodynamically focused cells are trans-illuminated by a brightfield light source
and orthogonally by laser(s). A high numerical aperture (NA) objective lens collects
fluorescence emissions, scattered and transmitted light from the cells. The collected
light in optical space intersects with the spectral decomposition element. Light of
different spectral bands leaves the decomposition element at different angles such
that each band is focused onto 6 different physical locations of one of the two CCD
cameras with 256 rows of pixels. As a result, each cell image is decomposed into
six separate sub-images on each CCD chip based on a range of spectral
wavelengths. Up to 12 images are collected per object with a two camera system.
The CCD camera operates in TDI (time delay integration) mode that electronically
tracks moving objects by moving pixel content from row to row down the 256 rows of
pixels in synchrony with the velocity of the object (cell) in flow as measured by the
velocity detection system. Pixel content is collected off the last row of pixels.
Imaging in this mode allows for the collection of cell images without streaking and
with a high degree of fluorescence sensitivity. TDI imaging combined with spectral
decomposition allows the simultaneous acquisition of up to 12 spectral images of
each cell in flow.
- 12 -
Chapter 3
Operating the ImageStreamX® Using
INSPIRETM
This chapter describes the operation of the ImageStreamX system
using the INSPIRE software. Daily operation involves an initial
calibration and testing of the system using SpeedBeads and
ASSIST, followed by sample runs and data acquisition, and finally
sterilization of the system to prepare for use the following day.
Optimizing instrument setup for sample runs is also described here
in detail.
•
“Fluidics”
•
“INSPIRE User Interface”
•
“Daily Operations”
•
“Data Acquisition”
•
“Daily Shutdown Procedure”
•
“Optional upgrades”
- 13 -
Chapter 3
Fluidics
Sterilizer, Cleanser, and Debubbler
These recommended reagents have been formulated to optimize the performance of
the ImageStreamX seals, valves, syringes, and lines. The use of the recommended
reagents is required for proper operation of the instrument. The Sterilizer, Cleanser,
and Debubbler reagents are used in the Sterilize and Debubble scripts.
Reagent
Name
Cleanser
Coulter Clenz®
Debubbler
70% Isopropanol
Sterilizer
Sheath
Rinse
*
0.4-0.7% Hypochlorite
PBS
deionized water
Source*
Beckman
Coulter
Catalog #
VWR
42101
VWR
JT9416-1
Invitrogen
14190
8546929
provided for information only, other sources of the same reagent may be used.
Waste Fluid
The waste bottle holds all of the fluids that have been run through the
ImageStreamX, and can hold up to 1600 ml. Add 160 ml of bleach to the empty
waste tank. It is recommended that the waste bottle contain 10% bleach when full.
Sheath Fluid
Two bottles are provided: one labeled Sheath to be filled with phosphate buffered
saline (PBS with no surfactants) for running samples and one labeled Rinse to be
filled with de-ionized (DI) water for rinsing the instrument during shutdown. Fluid is
drawn from these bottles into the sheath and flush syringe pumps. The sheath pump
controls the speed of the core stream and the size of the core stream diameter. The
flush pump is used to clean and flush the system and alternating with the sheath
pump also controls the core.
- 14 -
Fluidics
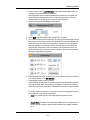
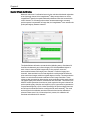
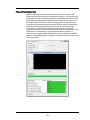
INSPIRE User Interface
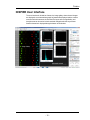
The user interface is divided into 3 areas, the image gallery where channel images
are displayed, a work area where graphs of features are displayed and the controls
section where the instrument is controlled.The layout of the Image Gallery and
Analysis area can be vertical or horizontal and changed under the Layout menu.
Status information is displayed along the bottom of the window.
- 15 -
Chapter 3
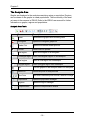
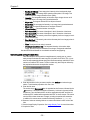
The Image Gallery
Images are displayed in the image gallery during setup and acquisition.
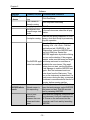
Image Gallery Tools
Icon
Name
Description
All
Select the population to view
Pause
Pause/Resume the display
Up/Down Move up or down in the image gallery while paused
Zoom in
Enlarges the imagery
Zoom out Resets the zoom
wrench
Tools to measure pixel intensity of displayed images
Mask
Displays the segmentation mask on the images
Image Display Tools
•
Ptr, Line, Rgn: Buttons that allow interrogation of pixel information of a single
point (Ptr), a line, or a region (Rgn) of the imagery.
•
Pixel Information box: Displays the selected Pixel (x,y) coordinates and its
Intensity value.
•
Region of Interest box: Displays the Minimum, Maximum and Mean pixel
intensity values, their standard deviation (Std. Dev.), and the Area of the
drawn region.
•
Intensity Profile: Plot of horizontal pixel number vs. Mean pixel intensity for
the drawn region.
- 16 -
Fluidics
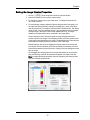
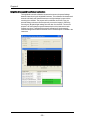
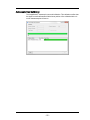
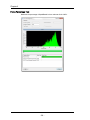
Setting the Image Display Properties
1 Click on
in the acquisition section to open the window.
2 Select the channel by clicking on the channel name.
3 To change the channel name, type a new name. To change the channel color
click on the color box.
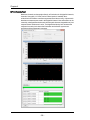
4 To set the display mapping adjust the right and left green bars in the graph. You
will adjust the Display Intensity settings on the graph (the Y Axis), to the Pixel
Intensity (the X axis). The range of pixel intensities is 0-4095 counts. The display
range is 0–255. The pixel intensities shown in gray are gathered from the images
coming through in the specific channel and updates with every 10 images.
Updates to the adjustments can be visualized in the image gallery.
At each intensity on the X Axis of the graph, the gray histogram shows the
number of pixels in the image. This histogram provides you with a general sense
of the range of pixel intensities in the image. The dotted green line maps the pixel
intensities to the display intensities, which are in the 0–255 range.
Manual setting is done by Click-dragging the vertical green line on the left side
(crossing the X Axis at 0) allows you to set the display pixel intensity to 0 for all
intensities that appear to the left of that line. Doing so removes background noise
from the image.
Click-dragging the vertical green line on the right side allows you to set the display pixel intensity to 255 for all intensities that appear to the right of that line.
Note: Changing the display properties does not change the pixel intensity data.
They are for display purposes only.
- 17 -
Chapter 3
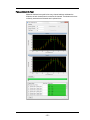
The Analysis Area
Graphs are displayed in the analysis area during setup or acquisition. Regions
can be drawn on the graphs to create populations. The functionality of the analysis area is the same as in IDEAS. Refer to the IDEAS user manual for further
information on graphs, regions and populations.
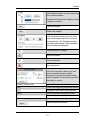
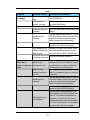
Analysis Area Tools
Icon
Name
Description
Reset
Refreshes the graphs with incoming data
Histogram
Opens the histogram graph tool
Scatter Plot
Opens the bivariate scatter plot tool
Pointer
Reset cursor to pointer
Line region
Draw a line region on a histogram
Rectangle region Draw a rectangular region on a scatterplot
Oval region
Draw an oval region on a scatterplot
Polygon region
Draw a polygon region on a scatterplot
Tile
Tiles the graphs in the analysis area to fill the space
Select All
Selects all plots in analysis area
Size Plots
Sets size of selected plots to small, medium or large
Populations
Opens the population manager
Regions
Opens the region manager
Compensation
Opens the compensation wizard
- 18 -
Fluidics
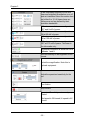
The Instrument Control Panel
The instrument control panel provides tools to control instrument operation, data
acquisition and status.
- 19 -
Chapter 3
- 20 -
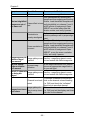
Fluidics
In the Sample section you can load a sample or return a sample.
Sample time remaining is displayed when
a sample is running.
Loads the sample
Returns the sample
In the Acquisition section you can run in
setup mode, begin acquisition, pause or
stop acquisition. The Filename and the
population and the rate of the population
being collected is displayed.
Run/Setup Mode- Imaging
Begin Acquisition
Pause acquisition
Stop acquisition
In the File Acquisition section you can
type in a custom filename, set the
sequence #, choose the data file folder,
type the number of events and choose the
population to collect.
Custom Filename Text
Seq#
Type the filename
Choose the beginning sequence number
Navigate to the folder to save the data
Collect
of
Enter the number of events to collect
Choose the population to collect
Add a second population to collect
Enable channels collected
- 21 -
Chapter 3
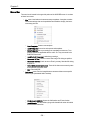
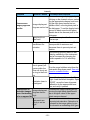
In the Illumination section you can turn
laser and brightfield illumination on or off
and set intensities.Select the scatter channel, either 6 or 12. All lasers have variable power and are defined by their
excitation bandwidth.
405nm laser excitation - currently set to
OFF and 0 mW of power.
488nm laser excitation- currently set to
ON at 60 mW of power.
642nm laser excitation- currently set to
ON at 150 mW of power.
785nm laser excitation- currently set to
OFF at 5.72 mW of power. This laser is
for side scatter only.
Brightfield illumination is shown as ON in
channels 1 and 9.
Sets the Intensity of the brightfield to 800
counts.
Select the magnification. Note: this is
optional equipment.
Adjust the speed and sensitivity for the
run.
Run fluidics.
Stop fluidics.
Speed and Sensitivity are inversely
related.
Med speed is 2X binned, Hi speed is 4X
binned
- 22 -
Fluidics
Focus and Centering can be adjusted
using the right and left arrows.
Runs the startup script.
Runs the shutdown script and sterilizes
the system.
Bottom task bar:
Status buttons are displayed at the bottom of the INSPIRE window.
Describes the current script
Click this button to abort a script
Level indicator for pumps
Green indicates compensation is being
applied to the Intensity feature. Note
that imagery and other features are not
compensated.
Yellow- calibrations and tests not run
Red- one or more calibrations or tests
failed
Green- all calibrations and tests have
passed
- 23 -
Chapter 3
Menu Bar
The menu bar is located in the upper-left portion of the INSPIRE screen. It consists
of these four menus:
•
File menu: Load and save instrument setup templates. A template contains
instrument settings that can be predefined and loaded to simplify the instrument setup process.
— New Template: Create a new template.
— Load Template: Browse for and open saved templates.
— Save Template: Save your settings as a template for future use. Template file names are appended with the suffix .ist. They are saved in the
INSPIRE Data folder.
— Load Default Template: Loads factory settings.
— Generate RIF file: Check to save a Raw Image File during acquisition.
— Generate FCS file: Check to save a Flow Cytometry Standard file during
acquisition.
— Exit and Shutdown Instrument: Turns off the instrument control system
exits INSPIRE and shuts down.
— Exit: Exits INSPIRE.
•
Instrument menu: Run the ImageStreamX camera and instrument-specific
fluidic scripts (automated fluidic routines).
— Calibrate with ASSIST: Opens the Calibrations and Tests window.
— Load Sheath: Fills the sheath syringe with sheath fluid and an air bubble
that facilitates stable flow.
- 24 -
Fluidics
— Flush Load Beads: Flushes the bead syringe and reloads beads from the
bead tube.
— Load Flush Syringe: Fills the flush syringe with sheath fluid.
— Prime: Pushes sample and beads into the flow cell.
— Purge Bubbles: Removes air bubbles from the flow cell by filling the flow
cell with air then filling the sheath line and pump with debubbler and rinsing
the flow cell. The sheath syringe is then refilled with sheath and the bubble
trap, lines and flow cell are filled with sheath.
— Purge Sample Load Line: Flushes the sample load line with debubbler to
remove bubbles formed during sample loading.
— View Tank Levels: Opens the fluid level window.
— Service Scripts: For field service personnel only.
— Options:
•
Autosampler menu: Access autosampler controls.
— Eject Tray: Opens the door of the autosampler and extends the tray for the
96 well plate.
— Load Tray: Retracts the plate tray back into the instrument and closes the
door.
— Define Plate: Opens the plate definition dialog.
— Run Plate: Starts the autosampler run as defined by the plate definition.
— Load From Well: Allows a single sample load from a well plate.
- 25 -
Chapter 3
—
•
Analysis menu: Access the Feature, Population and Region Managers. Functionality is the same as for IDEAS. Refer to the IDEAS user manual for more
information.
—
Features: Opens the Feature Manager. Features can be renamed or new
combined features can be created.
— Populations: Opens the Populations Manager. View,edit or delete populations.
— Regions: Opens the Regions Manager. View, edit or delete regions.
Note: See IDEAS User manual for more information.
•
Compensation menu: View, edit or create a new compensation matrix.
— Create Matrix: Opens the compensation wizard.
— Load Matrix: Applies compensation to the Intensity features.
— View Matrix: Opens the compensation matrix values table.
— Clear Matrix: Stops applying compensation of Intensity features.
•
Layout menu:
—
Vertical: View the image gallery and analysis area side by side.
— Horizontal: View the image gallery and analysis area top and bottom.
— Auto-resize Analysis Area: When selected automaticaly adjusts the separator between the image gallery and analysis area when images are
added or removed from the view.
•
Advanced:menu: For field service personnel only.
- 26 -
Fluidics
— About ImageStreamX: Access the current INSPIRE version number with
the About ImageStreamXoption.
—
- 27 -
Chapter 3
Daily Operations
Turning on the ImageStreamX:
This section describes how to prepare the ImageStreamX for use. The
ImageStreamX is usually left on with INSPIRE launched, but the following
instructions also describe how to turn the ImageStreamX on if the power is off.
Note: If the ImageStreamX power is on and INSPIRE is already launched, go
directly to step 4.
1 Press the green power button inside the front door of the ImageStreamX to turn on
the instrument and start the computer.
2 Log on with the user name (Amnis) and password (is100).
3 Launch the INSPIRE software and by double-clicking the INSPIRE icon on the
desktop.
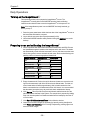
Preparing to run and calibrating the ImageStreamX
4 Fill the rinse bottle with deionized water and the sheath bottle with PBS. Ensure
the SpeedBead reagent is loaded on the bead port and is well mixed. The beads
are automatically mixed while the instrument is in use. If the instrument has been
idle for a long period, remove the bead vial and vortex. Refer to the following compatibility chart to choose the appropriate Sheath fluid.
Sample Solution
Sheath Fluid
Acceptable
PBS
PBS
Yes
PBS
Water
Yes*
PBS/Surfactant
PBS
Yes
PBS/Surfactant
Water
No
Water
PBS
Yes
Water
Water
Yes
Water/Surfactant
PBS
No
Water/Surfactant
Water
Yes
* Cells in PBS run with water sheath will swell.
5 Empty the waste tank. Push on the quick-disconnect buttons to remove the tubing from the waste tank. Add 160 ml of bleach to the Waste bottle. The final volume of waste when full will be approximately 1600 ml and therefore the final
bleach concentration for a full waste tank will be 10% bleach. It is recommended
that the waste be emptied every day and fresh bleach added before Startup.
6 Click Startup This script fills the system with sheath and flushes out all of the
old sheath or rinse that was in the system. The sample line is prepared by loading
50 µl of air into the uptake line. Beads are loaded into the bead pump from the 15
ml conical tube.
7 Click Start All Calibrations and Tests in the calibration window.
8 Center the core stream images (if necessary) by laterally moving the objective
under Focus and Centering. Core Tracking is adjusted by pressing right or left
arrows to center images.
- 28 -
Daily Operations
9 The event rate should be 800-1000 events per second. (If not, see “Troubleshooting” )
Note: Instrument calibrations may also be run individually by selecting a particular
procedure under Calibrations or Tests. Next to each calibration or test button is a
green or red rectangle. If the procedure fails, it turns red. If a procedure fails, repeat
it. If it fails twice, see Chapter 5:See "System" on page 69 or call your Amnis Field
Service Representative. For more information on the individual calibrations and
tests, refer to theFigure , “ASSIST Calibrations,” on page 47 in chapter 4.
10 When the calibrations and tests have passed the ASSIST status light will change
to green. Close the Calibrations window.
- 29 -
Chapter 3
Data Acquisition
After the ImageStreamX system is calibrated, you are ready to acquire experiment
data files. The sample is loaded into the sample pump. Beads and sample are
injected into the flow cell to form a single core stream that is hydrodynamically
focused in front of the imaging objective. The beads are used by the system to keep
the autofocus and camera synchronized during the sample run, while the objects
from the sample are saved to the data file. To use the Autosampler for unattended
operation see “Using the Autosampler” .
Refer to the ImageStream Sample Preparation Guide for experimental set-up
recommendations. Use compatible sample solutions from the table below.
Sample Solution
Sheath Fluid
Acceptable
PBS
PBS
Yes
PBS
Water
Yes*
PBS/Surfactant
PBS
Yes
PBS/Surfactant
Water
No
Water
PBS
Yes
Water
Water
Yes
Water/Surfactant
PBS
No
Water/Surfactant
Water
Yes
Sample order:
Samples from an experiment are typically run in the following order:
•
Experimental sample with the brightest stains to set the sensitivity for the run
•
Single color DNA dye control NO BF or SSC to ensure correct dye concentration
•
10% bleach to wash out DNA dye followed by PBS
•
Single color fluorescence controls (no DNA dye) NO BF or SSC
•
The rest of the experimental samples with DNA dye
Note: compensation controls may be collected after experimental files if desired.
Loading and running the sample:
1 Press Load, and load an aliquot of the brightest sample in the experiment, that
fluoresces with each fluorochrome used. It is critical that you run this sample first
to establish the instrument settings. (DO NOT change laser settings for the experiment once established on this sample if you are using dyes that are excited by
more than one laser.)
When prompted place sample vial with 20-200 ul into the sample loader.
- 30 -
Data Acquisition
2 In the file menu, choose Load Template if an experimental template exists, or
manually set up the instrument to create one.
Note: Application-specific instrument settings can be saved in a template and
used to facilitate instrument setup, but it is recommended that you verify the
appropriateness of the settings for the specific experimental run.
3 Choose the objective under Magnification (option)
4 Select EDF collection if desired. See “Using EDF” for details.
5 Turn on each laser used in the experiment by clicking on the wavelength. Set the
laser powers so each fluorochrome has Raw Max Pixel Intensities between 100
and 4000 counts, as measured in scatterplots or histograms of the appropriate
channels and there is no saturation. Select the channels to be collected in the
Image Display Properties by clicking Channels in the Acquisition section.The
default saturation color can also be set in this window. See the section below for
Setting the Image Display Properties.
6 Select Brightfield channels. Default is Ch1 for a 6 channel system; Ch1 and 9 for
a 12 channel system. Click Set Intensity.
7 Create graphs to gate on cells of interest.
Recommended: Scatterplot of Area versus Aspect Ratio of Brightfield to gate on
cells and eliminate debris. Scatterplots or Histograms of Intensity for channels
used in the experiment. Scatterplots of Raw Max Pixel to observe any saturation.
To identify objects for inclusion in or exclusion from the acquiring data file the following features in any channel are available:
•
Area: The number of pixels in an image reported in square microns.
•
Aspect Ratio: The Minor Axis divided by the Major Axis is a measure of how
round or oblong an object is See below for the definitions for Major and Minor
Axis.
- 31 -
Chapter 3
•
Background Mean: The average pixel intensity of the background pixels.
•
Gradient RMS: The average slope spanning three pixels in an image. This
feature measures image contrast or focus quality.
•
Intensity: The integrated intensity of the entire object image; the sum of all
pixel intensities in an image, background subtracted.
•
Major Axis:The longest dimension of an ellipse of best fit.
•
Mean Pixel:The average pixel intensity in an image, background subtracted.
•
Minor Axis:The shortest dimension of an ellipse of best fit.
•
Object Number:The serial number of an object.
•
Raw Centroid X:The center of the object in the X dimension of the frame.
•
Raw Centroid Y:The center of the object in the Y dimension of the frame.
•
Raw Max Pixel:The intensity value of the brightest pixel in an image (no background subtraction).
•
Raw Min Pixel: The intensity value of the dimmest pixel in an image (no background subtraction).
•
Time: The object's time value in seconds.
•
Uncompensated Intensity: The integrated intensity of the entire object
image; the sum of all pixel intensities in an image, background subtracted.
See the IDEAS User Manual for more details on features and graphing.
Collecting and saving the data files
Once the sample is running and the ImageStreamX is properly set up, you are
ready to acquire the data as a raw image file (.rif) and/or an FCS file. The .rif contains uncompensated pixel data along with instrument settings and ASSIST information in a modified TIFF format. The file includes only those objects defined by
the population selected in the acquisition section.
8 Enter the number of cells you want to acquire after Collect and select the population. To add another population click the + box.
9 Enter the file name.
The number in the Sequence # box is appended to the file name, followed by the
.rif extension. The sequence number increases by 1 with each successive data
acquisition. Files collected with BF off will be appended with noBF and files collected with EDF enabled will be appended with EDF in the file names. File names
must be 256 or fewer characters in length, including the path and file extension.
In addition, file names cannot contain the following characters: \,/,:,*,<,>, or |.
10 Browse to select an existing folder or to create a new folder in which to save the
files.
11 Set the Image Display Properties. See Image Display Tools for more information.
12 Acquire the data:
- 32 -
Data Acquisition
a. Imaging should be running, if not Click
to start imaging.
b. Click
to collect a data file.
13 The data file(s) are automatically saved in the selected folder once the desired
number of objects are collected.
To prematurely stop acquisition click
. The system prompts you to either discard the acquired data or to save the collected data in a file. The acquisition can
be paused and resumed by clicking
.
14 Once acquisition finishes, either load the next sample or return the remaining
sample.
Note: If the next sample has no nuclear dye and follows a DNA intercalating dyestained sample, Load a solution of 10% bleach and then Load PBS to ensure
that residual dye does not stain the subsequent samples.
15 Change the file name for the next sample and continue collecting samples..
16 Repeat for each sample.
17 When finished running the experiment samples or after setting the template, run
single color compensation controls with the same laser settings as the experimental samples with the exception of the scatter laser 785 which turns off in
compensation mode.
18 Click
in the analysis tools to begin compensation mode.
This turns brightfield and scatter (785 nm laser) OFF and enables every
channel to be collected. Keep all laser powers the same as for the experimental samples.
Follow the prompts in the wizard to collect all compensation control files:
•
Click Load or if a compensation control sample is already running, click Next.
•
Place the tube on the uptake port and Click OK.
•
Click Next when sample is running.
•
Verify the channel for compensation.
•
Collect the All population if all are positive or draw a region on the Uncompensated Intensity scatter plot to define the positive population. View the population in the Image Gallery and choose this population to collect.
•
Name the file and choose the path to save the data.
•
Click Collect File. The compensation coefficients are calculated. The compensation coefficients and an Intensity scatter plot using the coefficients are
displayed.
•
Click OK on the Acquisition Complete popup window.
•
Click Load to continue with the next single color control sample or click
Return (optional).
- 33 -
Chapter 3
•
Repeat the previous steps for each compensation sample. For each sample
reset the Image gallery population to view All and then create an appropriate
population for each sample. Note, the R1 gate can be moved for each sample.
•
Click Exit when done and Save the coefficients to a compensation matrix file.
The template is restored and the saved matrix is used to compensate the Intensity feature. Note that imagery and other features are not compensated. The compensation can be cleared if desired from the compensation menu. Scatter plots
can be made with the feature Uncompensated Intensity to compare with and without compensation.
19 Continue to collect experimental files.
20 Click Shutdown when done. See Daily Shutdown Procedure
- 34 -
Data Acquisition
Optional settings
Squelching Debris
Some samples have an abundance of small particulate debris. These can be
eliminated from collection by gating or by using Squelch to reduce the sensitivity of
object detection. As opposed to gating debris away from cells, squelching debris can
prevent INSPIRE crashes related to overburdening the computer processor with an
abnormally high event rate. Squelch should only be used if the rate of total objects
per second reaches 4000. Squelch values range from 0 to 100; increasing the value
decreases object detection sensitivity.
1 Choose All in the image gallery.
2 Observe the relative proportion of cell to debris images appearing in the imaging
area and the event rate (Total/Sec under Acquisition Status).
3 On the Advanced Setup -Acquisition tab, increase the Squelch value until the
observed proportion of cells to debris increases in the imaging area.
4 Observe the Total/Sec event rate on the Setup tab under Acquisition Status. If
it is still greater than 500, repeat step 2.
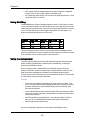
Setting ImageStreamX Speed and Sensitivity
The optimal operating speed is set at the factory for each instrument and is
approximately 60 mm/sec. This speed corresponds to the highest resolution setting
(shown below) with a pixel size of 0.5 µm at 40 X magnification. In order to collect
images at higher speed, the rows on the camera can be binned. The center of the
control corresponds to 2x binning and the right setting corresponds to 4x binning.
The same amount of total intensity is collected. Image collection speed is inversely
related to image resolution (sensitivity).
- 35 -
Chapter 3
Daily Shutdown Procedure
This procedure sterilizes the system and leaves it with pumps empty and water in
the fluidic lines. The instrument is left on with INSPIRE running.
1 Fill the Rinse, Cleanser, Sterilizer, and Debubbler bottles if necessary.
2 Empty the Waste bottle.
3 Remove any tubes from the uptake ports.
4 Click Shutdown
Note: This procedure automatically turns off all illumination sources and rinses
the entire fluidic system with water, sterilizer, cleanser, de-bubbler, and then
water again. The sterilizer is held in the system for ten minutes to ensure de-contamination. It takes about 45 minutes of unattended (walk-away) operation to
complete.
- 36 -
Optional upgrades
Optional upgrades
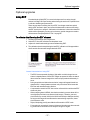
Using EDF
Extended depth of field (EDF) is a novel technique used in a variety of applications including FISH spot counting where having the entire cell in optimal focus
is critical to obtaining accurate results.
There are two steps to utilizing the 16 µm EDF; first images must be acquired
with the EDF element in place, and second the data must be deconvolved using
the EDF kernel prior to analysis. Calibration of the element is done when installed
and should be repeated by Amnis service when any optical changes are made to
the instrument. See {Blue}“ASSIST Tab ” on page 45.
To collect a data file using the EDF element
1 Set instrument settings for the experiment.
2 Select EDF1 from the collection filter dropdown menu.
3 Adjust cell classification settings to accomodate using EDF.
4 The calibration kernels saved during the last EDF calibration will be appended to
the file and the file name will be appended with -EDF.
General characteristics of using EDF
•
The EDF element spreads all points of light within a cellular image into consistent L-shaped patterns. When EDF images are opened in ideas, the data is
deconvolved to create an image of the entire cell projected simultaneously in
focus.
•
During acquisition and before deconvolution, images will appear blurred into
characteristic L-shaped patterns and raw max pixel values will be lower with
EDF than with standard mode collection.
•
Compensation controls for EDF data can be collected with or without the EDF
element in place.
•
When analyzing data in IDEAS, after the deconvolution process there will be
more light per pixel than in non-deconvolved imagery. Therefore, raw max
pixel values may exceed 1023 (for the IS100 instrument) or 4095 (for the ISX).
As long as the images did not saturate the camera during acquisition, these
pixel values are valid.
•
Object, Morphology and System Masks will be smaller in EDF mode.
•
Focus gating is not required. However if there are blurred events due to streaking, these can be removed from the analysis using a focus gate.
- 37 -
Chapter 3
•
EDF images exhibit increased texture due to higher resolution. • Brightfield
imagery is not as crisp in EDF mode as in standard mode.
•
An in-depth discussion of EDF can be found in the following reference: Cytometry Part A (2007) 71A:215-231
Using MultiMag
The MultiMag option includes 2 additional objective lenses. The 20X lense is useful
for very large objects that do not fit into the field of view of the 40X objective such as
cardiomyocytes or epithelial cells. The pixel size using the 20X objective is 1 square
micron. The 60X objective provides a higher magnification for small objects. The
pixel size using the 60X objective is 0.33 microns.
Objective
40X
20X
60X
Field of view
60 um
120 um
40 um
Pixel size
0.5 um
1 um
0.33 um
Depth of field
4 um
8 um
2.5 um
NA
0.75
0.5
0.9
The optional objective can be chosen by selecting the button under Magnification.
When using the 60X obective the core velocity will be reduced to 40 mm/sec instead
of the normal 60 mm/sec used during 40X or 20X acquisition.
Using the Autosampler
To enable high throughput experiments and unattended operation the autosampler
option includes upgraded fluidics, software and an imbedded tray for loading of
samples in a 96 well plate format.
Prior to running the plate, a plate definition is created that assigns instrument
settings to the wells, names to the output files, and parameters to include in a well
plate report that is generated once the plate has completed. While the plate is
running, the user may be notified of any errors encountered via email. The instrument
can also sterilize at the completion of the plate.
Workflow:
•
Create Instrument Setting Template(s) (.ist) to be used for your plate. To do
this, run an experimental sample manually with all of the fluorescence dyes to
be used in the experiment (see INSPIRE Setup Quick Start Guide). Save
each relevant template.
•
Create a Well Plate Definition (.def) that assigns instrument settings to wells,
names to the sample output files, and parameters to include in the plate report
(see procedure below).
•
Add 75 ul samples to the 96 well plate, cover with Sigma-Aldrich X-Pierce
Film (XP-100, Cat # 2722502) and load the plate into the autosampler.
•
Run the plate (see procedure below).
Access to AutoSampler operations is found under the AutoSampler menu.
- 38 -
Optional upgrades
From this menu you may:
•
Extend or retract the tray
•
Create a plate definition
•
Run a plate
•
Run a single well from a plate
To begin
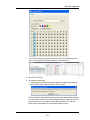
1 Choose ‘Define Plate’ from the Autosampler menu to open the Well Plate Definition window.
2 Begin to create a new definition or you may browse for a previously saved definition (to edit) by clicking on the folder icon.
3 Name the plate definition.
4 At a minimum, each well requires an Output File Path, Max Acquisition Time, and
Template File in order to be considered ‘defined’. Other parameters can optionally
be added to the definition in the next step
5 Choose the parameters you would like to use.
•
Click Add/Remove Well Parameters to choose the parameters you want to
report for the wells.
- 39 -
Chapter 3
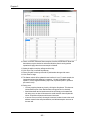
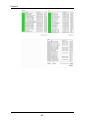
There are several categories of parameters that may be chosen as a group or
individually. See the list of parameters abover. Check or uncheck the desired
parameters. The user can also define custom parameters. Expand the category
to see the individual parameters. To delete a custom parameter, select it and use
the delete key. Click OK when done
•
To include a parameter in the file name, click in the box below the column
heading (make sure it says ‘yes’).
•
Columns can be re-ordered by click/drag.
•
Click OK when finished adding or removing parameters.
6 Define the wells. Select wells to define by clicking a) individually (orCtrl click /
shift click for multi-select), b) rows or columns, c) color, d) the ‘Select Defined’
button or e) All. In this example column 1 is selected.
- 40 -
Optional upgrades
7 You can edit values for some of the Custom and many of the Standard parameters. You can do this for all selected wells or for individual wells.
8 When done click Save.
9 Click Start to run the plate.
•
A warning may be displayed if there are undefined or partially defined wells.
Select Yes to return to plate definition or No to continue.
The Auto Sampler Unattended Operation window opens with the Plate Definition
you just saved. If you wish to choose a different Definition, browse for it by clicking on the folder icon. If you want to edit the Plate Definition, click ‘Edit This
Plate’ and you will be taken to the Well Plate Definition window.
- 41 -
Chapter 3
10 Check or uncheck the boxes Return samples, Sterilize, and Shutdown. Note that
these boxes may be checked or unchecked while the plate is running and the
operation will apply after the current sample is finished.
11 Select the wells to run (they will appear in the list).
12 Click ‘Eject Tray’ to extend the plate tray.
13 Place your plate on the tray with well A1 positioned at the upper left corner.
14 Click ‘Start’ to begin.
15 The Status column will be updated for each well as it is run. For each sample, the
instrument performs the following in sequence : 1) Load, 2) Validation ( flow
speed CV, focus, brightfield intensity object rate, 3) Data Acquisition, 4) Result
(success or error).
16 During a run:
•
You may stop the plate at any time by clicking the Stop button. This does not
initiate sterilize (even if the ‘Sterilize after running plate’ box is checked).
•
Should the sheath tank or beads reservoir become empty or the waste tank
full during a run, an alert will be sent to the email entered in the well plate definition. Acquisition will pause until the user intervenes.
•
If an error occurs on a well, the sample is returned, an alert is sent to the email
address entered in the well plate definition, and the autosampler moves on to
the next well.
- 42 -
Optional upgrades
•
If the same error occurs on three consecutive wells, the autosampler aborts
the plate and sterilizes the instrument (if the ‘Sterilize after running plate’ box
is checked)
17 A well plate report .txt file will be saved (to the folder designated in the Output File
Path of the plate definition) at the end of the run either when it was stopped manually or completed the entire plate.
18 If Batching was included in the well plate definition the data files will be processed using the IDEAS compensation matrix and templates designated. All of
the .cif , .daf and statistics report .txt files will be saved to the designated output
file path.
- 43 -
Chapter 4
Instrument Calibrations and Tests
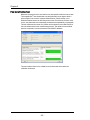
ASSIST Tab
ASSIST (Automated Suite of Systemwide ImageStreamXTests) is a suite of
calibrations and tests for critical subsystems operating within the ImageStreamX.
ASSIST performs specific calibrations and tests, measuring, evaluating and storing
thousands of values to ensure all subsystems are operating within normal limits.
ASSIST permanently logs results for all tests and flags any parameters that are
beyond specified limits. It is run daily using SpeedBeads to ensure optimal
performance of the ImageStreamX.
A calibration is a sequence of operations designed to measure and set internal
parameters that are used to operate a subsystem. Calibrations are used to optimize
performance of a subsystem or place it in predefined state. After a calibration is
performed, it is tested to determine whether the calibration values are within a
prescribed range. A test is a sequence of operations designed to measure the
performance of a specific subsystem. The calibration and test values and
acceptable ranges are listed on the ASSIST display tab. A failed calibration or test is
flagged with a red box. The history of any calibration or test can be viewed by
clicking on the box to the right of the specific item.
Utilities are calibrations used by service technicians.
Run ASSIST daily to optimize the performance of the ImageStreamX.
To run ASSIST calibrations and tests:
1 Click Start All Calibrations and Tests to run all standard calibrations and tests.
2 Optional: Click Run Beads to begin running beads without starting calibrations
or tests.
3 To run one calibration or test, click on an individual calibration or test and click
Run.
4 To stop a calibration or test click Stop or Stop All if Start All was chosen.
A calibration or test will be flagged red if it fails.
If a calibration or test fails, run that calibration or test individually and if it fails
again call or email Amnis service.
Note: Calibrations and tests do not run in order. 40X Calibrations are completed
before changing magnifications to run 20X and 60X calibrations.
- 45 -
Chapter 4
- 46 -
ASSIST Calibrations
The calibrations in the current suite are described in detail below.
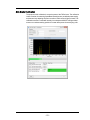
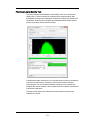
Camera Synchronization Calibration
Measures and stores a magnification calibration (camera synch) factor relating the
Flow Speed Detection frequency and the camera clock rate. This factor is used to
maintain synchronization between the moving imagery projected onto the camera
surface and the electronic charge resulting from that imagery. Proper
synchronization helps ensure crisp image collection.
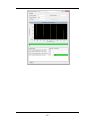
As shown in the figure above, the camera synch calibration measures SpeedBead
ellipticity at numerous discrete camera synch settings and plots the camera synch
setting (horizontal axis) versus the ellipticity (vertical axis). It then generates the
best fit curve for a 4th order polynomial through the data and determines the
horizontal location (camera synch) of the peak of the curve. The peak occurs where
the SpeedBeads appear round. This setting is then stored and used for all
subsequent image acquisitions. The result and the limits for the calibration are
shown below the list when the calibration is selected. Please note that Camera
Synchronization Calibrations will be done for each magnification present in the
system.
- 47 -
Chapter 4
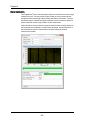
Spatial Offsets Calibration
Measures and stores 12 calibration factors for the vertical and horizontal registration
of each spectral channel of the ImageStreamX. Many assays that are run on the
ImageStreamXquantify the spatial relationships between molecules located within
cells of interest. To accurately perform these measurements and to accurately
perform spectral compensation of image data, the ImageStreamXmust maintain subpixel spatial registry between channels.
The SpatialOffsets calibration commands the brightfield system to illuminate all 6
channels simultaneously and collects imagery from 1000 SpeedBead objects in
each of the six channels (6000 images total). It then performs a two-axis
autocorrelation between the imagery from channels 1-5 with the imagery from
channel 6. Autocorrelation is an accurate algorithmic technique that identifies the
point at which two images exhibit the highest degree of overlap. The autocorrelation
results in a vertical and horizontal coordinate for each image correlation. These
values are then processed to determine the mean coordinates to bring each channel
into spatial registry with channel 6, and therefore with each other. The values on the
ASSIST tab are reported as the number of pixels required to bring each channel into
perfect spatial registry when the raw image file (.rif) file is processed to generate the
compensated image file (.cif) file. Values exceeding 0.95 pixel are flagged as errors
and will require manual intervention to realign the filter stack assembly. The result
and the limits for the calibration are shown below the list when the calibration is
selected. Please note, if the 12 channel option is present, this calibration will
illuminate and calibrate all 12 channels.
- 48 -
Dark Current Calibration
Measures and stores 3072 offset values corresponding to pixel columns in the TDI
camera. Every pixel in a CCD detector is an individual sensor with its own
sensitivity characteristics. In the absence of any light, each pixel emits a signal,
known as dark current. Although the statistical variation of any given pixel over time
is less than one count, the mean dark current signal generated by any pixel may vary
as much as several counts from a different pixel in the array. When the
ImageStreamX is measuring very dim signals, even one count difference between
pixels can be critical. Therefore, a Dark Current calibration factor is stored for each
pixel column. This factor is added to or subtracted from each pixel in the .rif file
during .cif creation to normalize detector variation. In the .cif, each pixel is calibrated
so that in the absence of light, its signal is 30 counts.
The Dark Current calibration commands the system to turn off the excitation laser
and brightfield illumination. The system then measures the mean signal value of
each camera column from 1000 rows of data per column. The difference between
this value and 30 counts is stored for subsequent correction. When the camera is
operated at different stage settings (32, 64, 128, 256 stages) the dark current
characteristics of a column of pixels can change. Therefore, values for all stage
settings are stored (total of 3072 values). INSPIRE automatically appends the
calibration values appropriate for the stage settings used during acquisition to the .rif
file. The values reported on the ASSIST tab indicate the maximum variation
detected from all test conditions. The result and the limits for the calibration are
shown below the list when the calibration is selected. If the 12 channel options is
installed the Dark Current calibration will be simultaneously performed for both
cameras.
- 49 -
Chapter 4
Brightfield Crosstalk Coefficient Calibration
The brightfield cross talk calibration measures the amount of spectral leakage
between channels using the brightfield illuminator. This calibration illuminates each
channel individually and characterizes how much light leakage is present in the
remaining five channels. The purpose of this calibration is two fold. First, the
spectral leakage values are used to spectrally correct the imagery in IDEAS by
removing any Brightfield light leakage from the other five channels. The second
purpose is to ensure that the spectral characteristics of the instrument remain
constant over time. The Brightfield cross talk calibration will simultaneously
calibrate leakage from all eleven channels if the 12 channel option is installed in the
instrument.
- 50 -
Core Stage Position Calibration
The alignment of the stage in the X direction is controlled so that the position of the
core is centered in the field. This calibration finds the core position using the X
centroid position of the SpeedBeads and calculates an offset from the factory setting
and sets the position of the stage in the X dimension.
- 51 -
Chapter 4
Horizontal Laser Calibrations
The alignment of each laser in the ImageStreamX is automatically controlled to
ensure optimal performance via the Horizontal Laser Calibration. The calibration
routine sweeps the horizontal position of the laser across the flow stream. At each of
15 predefined intervals during the sweep, 1000 SpeedBead images are collected and
analyzed to determine the intensity of each bead. The median intensity for each
position is then plotted and fit to a fourth order polynomial. The peak height of the
polynomial is then determined. This position is the point where the peak intensity of
the Gaussian laser beam intersects the center of the flow core. This position
provides both the highest intensity for illuminating the core stream and the point with
the lowest coefficient of variation. This position is stored for each laser and used as
the default position during subsequent assays.
The result for the calibration are shown below the list when the calibration is
selected.
- 52 -
Side Scatter Calibration
The purpose of this calibration is to set the power of the 785nm laser. The calibration
routine consists of measuring SpeedBead intensities at a predefined power setting
and then actively adjusting the power to achieve 7200 counts of light per bead. This
calibration ensures a consistent intensity for subsequent ASSIST testing and also
ensures a consistent starting position for scatter laser power when analyzing cells.
- 53 -
Chapter 4
Retro Calibration
The ImageStreamX uses a retro illumination scheme to maximize the amount of light
incident on the cell. The vast majority of light incident on the core stream passes
through the stream and through cells and other particulates in the stream. The retro
illumination system captures this light and redirects it back on to the core stream to
double to the total amount of light incident on cells in the stream.
In this calibration, the retro reflective system is panned in manner nearly identical to
the Horizontal Laser Calibration. Using the same technique, the optimal position of
the retroreflection system is determined to maximize intensity and reduce
measurement variation.
- 54 -
Autosampler Nest Calibration
The ImageStreamX autosampler runs a self calibration. This calibration verifies that
the sipper can self-calibrate and find the home position. If the calibration fails or is
not run the autosampler will not run.
- 55 -
Chapter 4
ASSIST Tests
A test is a sequence of operations designed to measure the performance of a
specific subsystem. When a test is performed one or more test parameters are
generated and evaluated against predefined limits. The test results and acceptable
limits are listed on the ASSIST display tab. Values outside of accepted limits are
highlighted with a light red background. ASSIST allows complete automated
operation of all tests as well as the ability to invoke a single test by clicking a button.
The four tests in the current suite are described in detail below.
Excitation Laser Power Tests
The power of each excitation laser present in the system is measured and tested
against limits by quantifying the amount of light scattered from SpeedBeads. The
instrument is configured specifically to test each laser by adjusting classifiers,
setting stage selections and inserting the proper neutral density filters into the
collection path. The test compares the mean signal strength acquired from each
laser and compares it to radiometric ally calibrated signal strengths collected during
the manufacturing process. The intensity of each laser is stored in the database.
The results and limits of the test are shown below the list when the test is selected.
- 56 -
BF Intensity Selection Test
Verifies the BF intensity calibration for each BF mode. The image intensity must
reach 200 within 20 iterations. If this test fails, the user should run the BF Intensity
Selection Calibration individually and then re-run the test.
The results and limits of the test are shown below of the list when the test is
selected.
- 57 -
Chapter 4
BF Uniformity Test
Measures the static and temporal uniformity of illumination in all brightfield channels,
channels 1 through 6 (1-12 if the Twelve Channel option is installed). Nonuniformities in illumination can affect segmentation and the accuracy of photometric
absorbance measurements made in the brightfield channel. Non-uniformities can be
caused by misaligned illumination and collection path elements, degradation of pixel
responsiveness and electronic noise. The brightfield uniformity test measures the
response from each pixel column the illumination and collection systems are
providing a uniform photometric response.
- 58 -
Camera Noise Test
The electronic noise is measured with no illumination to the CCD in two successive
frames. The fluctuation is measured on a pixel by pixel basis.
- 59 -
Chapter 4
Flow Core Axial Stability Test
Measures the stability of the core stream velocity over time. Measures the variation
in the speed of the core stream as a percentage of the mean sample speed. The
ImageStreamX is designed to automatically sterilize, cleanse and purge air from its
fluidics systems after every day of operation. Improper sterilization, contaminants,
partially clogged fluidic lines, air bubbles or non-homogenous sheath solution can
lead to excessive sample speed variation. Although the ImageStreamX very
accurately measures the sample speed to synchronize camera line rate with cell
movement on the detector, excessive speed variation can lead to small amounts of
desynchronization. The flow core axial stability test verifies that the fluidic system is
operating within normal limits, thereby providing the collection system with
hydrodynamically focused objects traveling at a consistent speed for proper image
synchronization.
The flow core axial stability test plots 100 flow speed sample intervals, each of
which consists of an average velocity measurement of approximately 50
SpeedBeads thereby measuring the speed of approximately 5000 SpeedBeads. The
test computes a running average of all measurements which is listed under results
on the pop up window and ensures that no more than 5% of all measurements
exceed a 0.15% speed variation. This ensures that synchronization is maintained
between the imagery and the camera to better than a fraction of a pixel. Test results
are stored in the ASSIST database. The results and limits of the test are shown
below the list when the test is selected.
- 60 -
Flow Core Lateral Stability Test
Provides a statistical characterization of the stability of the core in the direction
lateral to flow. The test computes the centroid position of approximately 3000
SpeedBeads. During the test a histogram of bead centroid position is plotted in the
test window. When the test is complete, the standard deviation of bead centroid
position (in pixels) is printed in the test window.
Contaminated sheath, obstructions, air or improper pump function may broaden the
core which can reduce focus consistency and increase variation in intensity
measurements. This flow core lateral stability ensures the core is operating as
designed with minimal variation. Failure to pass this test is indicative of at least one
of the issues listed above.
The result and the limits for the calibration are shown below the list when the
calibration is selected.
- 61 -
Chapter 4
Flow Core Position Test
Measures the position of the core relative to its ideal position within the flow cuvette.
The ImageStreamX uses sheath flow to hydrodynamically focus objects within a
precise region in the cuvette. Improper sheath solution, protein buildup, microbubbles and other factors can alter the position of the core within the cuvette. If this
occurs, the photometric and morphological measurement repeatability may degrade.
This test measures the current core position and compares it to the ideal location of
the core as determined in the manufacturing process. The deviation from the ideal
position is reported in microns and stored in the ASSIST database.
The result and the limits for the calibration are shown below the list when the
calibration is selected.
- 62 -
Focus Offset Beads Test
Measures the offset between the focus determined by the AFFS system and
location of the peak response of the Image Collection system. This test performs a
pan through focus while simultaneously collecting SpeedBead focus data from the
AFFS system and SpeedBead image data from the image collection system. The
AFFS data are processed to find the zero crossing (point of no defocus) and the
image data are processed to determine the peak response (point of highest spatial
resolution). Both sets of data are plotted as a function of Z position along the
horizontal axis. The AFFS zero crossing and image collection system peak
response are indicated vertical lines and numerical results are reported to the Focus
Offset test tab. The difference (in microns) between these two positions is
determined and compared against predetermined limits and stored in the ASSIST
database. If the MultiMag option is installed, a focus offset test will be performed for
each magnification.
- 63 -
Chapter 4
Focus Percentage Test
Measures the percentage of SpeedBeads in focus and sets a limit of 90%.
- 64 -
Focus Uniformity Test
Measures the best focus position for every channel and then calculates the
difference of each channel from the mean for all channels. The tolerance for focus
uniformity ensures that all channels are in optimal focus.
- 65 -
Chapter 4
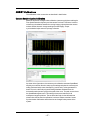
Image Quality Ensquared Energy Test
Measures the ability of the optical system to resolve fine details in the image using
ensquared energy ratio. The optics term ensquared energy refers to a measure of
concentration of energy in an optical image when quantifying image sharpness for
digital imaging cameras using pixels. The ensquared energy ratio is one of several
parameters often used in the design of high resolution optical systems to
characterize their performance. In this ASSIST test, the ensquared energy ratio of a
3x3 pixel array centered within an 11x11 pixel array is determined and compared
against predetermined limits. The test is designed to measure the optical quality of
the image independent of focus, lateral core stability, and axial core stability. During
the test approximately 5000 SpeedBead images are collected over a range of focus
positions. The imagery is analyzed during collection by computing the ensquared
energy ratio in each image. The ensquared energy for each image at each focus
location is shown in a plot. The mean ensquared energy for each focus position is
noted as a dark blue data point for each focus position. The ensquared energy for the
top 2% of all imagery is computed and indicated as a dark blue data point on the plot.
This result is tested against predetermined limits and reported on the Collection
Image Quality test tab and in the popup window. This value is stored in the ASSIST
database.
A highly magnified composite image of the top 2% of all images is also generated
and displayed on the popup window. Each small square of light is an individual pixel
approximately 0.5 microns on a side (in object space). This image generally shows a
small amount of “flair” on the right hand side. This is due to light scatter from the far
side of the SpeedBead which is approximately 1um in diameter.
- 66 -
- 67 -
Chapter 4
The test also reports regional scores which are not tested against limits. The scores
include the energy ratios for line profiles in the horizontal and vertical axes, displayed
at the bottom of the regional score grid, and summed energy values for the
horizontal, vertical and diagonal directions radiating outward from the center of the
image. The summed energy values are displayed in a 3 x 3 array. The value in the
center of the array is the ensquared energy ratio for the single pixel in the center of
the image. If the MultiMag option is installed, and ImageQuality Ensquared energy
test will be performed for each magnification.
- 68 -
Chapter 5
Troubleshooting
This section is designed to help you troubleshoot the operation of the ImageStreamX-Mark II. If additional assistance is required, contact the Amnis service
department.
System
•
Unstable fluidics (Air or clog in system)
•
Fluidics respond sluggishly
•
Event rate slows over time
•
Event rate is slower than expected
•
Cross-contamination from previous samples
•
Erroneous fluid level indicator
•
Instrument will not pass ASSIST
•
Compensation wizard fails to complete
•
INSPIRE appears to freeze
•
INSPIRE Fails to launch
•
Plots fail to update, or update slowly
•
Data file fails to collect
•
No images
•
Imaging and acquisition rate is erratic, or appears frozen
•
Objects appear streaked
•
Objects are not centered in the channel
•
Objects are rotating in the core stream
•
Objects are out of focus or distorted
•
Objects are cropped
•
The two brightfield images are not of the same cell
•
Images appear pixelated or larger than normal
•
Objects appear larger or smaller than normal
•
Not all 12 channels are being displayed
•
Images have incorrect colors
•
Fluorescence imagery appears too dim
•
Fluorescence is too bright, images have a contrasting color or appear flat
Software
Image
Intensity
- 69 -
Chapter 5
•
One channel saturates while the others do not
•
Scatter is too dim or bright or changes over time
•
Large variation in brightfield intensity levels
•
Brightfield intensity level sets incorrectly
- 70 -
Symptom
System
Possible Causes Recommended Solutions
Unstable fluidics
Air bubbles in the
(Air or clog in
sample
system)
Air bubbles in fluid
lines
Clog in fluid lines
Sample is too concentrated
Inappropriate
sheath solution
Fluid lines are leaking
SpeedBeads fail to
run
Make sure a sufficient sample volume is
used. To clear the air bubble: Run the
purge bubbles script.
Detergents and foaming agents (such as
FBS) can cause bubbles to form in the
lines. If these buffers are causing air in
the system remove them from the sample
and resuspend in dPBS. Run the purge
bubbles script.
Run the sterilize script, followed by the
startup script. Load calibration beads and
verify the system runs normally.
Filter the sample with a 70um nylon cell
strainer. Run the sterilize script, followed
by the startup script. Load calibration
beads and verify the system runs normally.
Clumpy and viscous samples cause cavitation in the fluidic lines and create bubbles. Dilute the sample to 1x10^7
cells/ml and strain the cells through a
70um nylon mesh. Run the purge bubbles script.
Verify the sheath is dPBS. De-gas the
sheath as appropriate. Third party sheath
buffers cannot be used.
With the system powered down look for
leaking sheath. Verify the fluid lines
mount snuggly into position. Call Amnis
service.
Verify the beads will run by returning any
sample, going to fluidics section and
press stop, then run. Next go to the
advanced drop down, select flow speed,
and check that the red and black histograms have tight CVs at the appropriate core velocity. To view bead
images select the All population and
check include beads.
- 71 -
Chapter 5
Symptom
Possible Causes
Recommended Solutions
The sheath syringe should contain 2-4 ml
of air to buffer the movement of the
pump’s microstepper motor. If too little air
is present run the “start-up” script.
With the system powered down look for
Fluid lines are leak- leaking sheath. Verify the fluid lines
ing
mount snuggly into position. Call Amnis
service.
Cells settle in the lines after 45-60 minutes of running, resulting in a drop in cell
event rate. Stop and save the acquisition.
Event rate slows Cells have settled
Return the remaining sample, restore the
over time
in the lines
sample volume to 30ul and re-load the
sample to continue acquisition. Data can
then be appended together in IDEAS.
There is a clog or Run the purge bubbles script from the
air bubble in the sys-instrument drop-down menu. See solutem
tions for unstable fluidics.
Sample syringe is
Load a fresh sample
empty
Sheath syringe is Load sheath, then go to the instrument
empty
drop down and run prime.
With the system powered down look for
Fluid lines are leak- leaking sheath. Verify the fluid lines
ing
mount snuggly into position. Call Amnis
service.
Make sure the sample concentration is
Event rate is
Sample conbetween 107 and 108 cells/ml. Lower conslower than
centration is low
centrations can be used but this will
expected
decrease the cells/second.
Cropped images will be eliminated from
data acquisition and if enough of the
images are cropped the event rate can
appear lower than normal. Normally this
Core is off center
is due to air in the system. Run the purge
bubbles script from the instrument dropdown menu. See solutions for unstable
fluidics.
Turn the appropriate lasers on. Set the
Insufficient illu785 SSC laser to 40mw. Set the laser
mination
Fluidics
respond sluggishly
Air buffer in the
sheath syringe is
not correct
- 72 -
Symptom
Possible Causes
Recommended Solutions
powers to maximum and decrease them
to prevent pixel saturation.
For large diameter cells go to the
Cells are not disadvanced drop down, select acquisition
played due to over
and check the box labeled keep clipped
clipping.
objects.
DNA dyes must be thoroughly flushed
from the sample lines, to prevent residual
Cross-conDNA dye from predye from labeling subsequent samples.
tamination from vious sample is
Load a sample of 10% bleach followed
previous sam- labeling current
by a PBS wash, to remove all traces of
ples
sample
the DNA dye in the instrument, or run the
sterilize script (~30min).
Cells from the pre- This suggests a minor clog. Load a samvious sample are
ple of 10% bleach followed by a PBS
appearing in current wash to remove most contaminating
sample
cells, or run the sterilize script (~30min).
Tank has moved
Open the buffer compartment and move
Erroneous fluid
away from the sen- the tank closer to the sensor until the fluid
level indicator
sor
level indicator is correct.
Power down and power up the instruSensor is broken
ment, if this does not fix the problem, call
Amnis service.
Instrument will
Incorrect template Go to the file drop down and select “load
not pass
loaded
default template”. Re-run ASSIST.
ASSIST
Verify the beads will run by returning any
sample, going to fluidics section and
press stop, then run. Next go to the
advanced drop down, select flow speed,
SpeedBeads fail to
and check that the red and black hisrun
tograms have tight CVs at the appropriate core velocity. To view bead
images select the All population and
check include beads.
The particles must be running >1000
events per second, and without sigSpeedBeads are
not running properly nificant clumping. If the beads are diluted
or clumped, try running a fresh tube of
beads. If the problem persists there may
- 73 -
Chapter 5
Symptom
Possible Causes
Calibration and/or
test failure
Recommended Solutions
be a fluidics issue, see the Flow rate
stops or slows over time section.
Tests may fail if the system is reloading
sheath, or failed to set up properly. Rerun the test by clicking in the box next to
the test, and pressing the start button in
the popup window. If the test fails three
times in a row, call Amnis service.
Focus adjustor calVerify brightfield is working properly.
ibration failure
Frame Offset calVerify brightfield is working properly.
ibration failure
Spatial Offsets calVerify brightfield is working properly.
ibration failure
Make sure the excitation lasers are off
Dark Current caland brightfield is blocked. Completely
ibration failure
power down the instrument and power
back up to re-run the test.
Brightfield XTalk cal-Verify brightfield is working properly, and
ibration failure
that spatial offsets passed.
Verify the laser turns on and can set
Horizontal Laser
power properly. Completely power down
Calibration failure the instrument and power back up to rerun the test. Verify spatial offsets passed.
Verify the laser turns on and can set
Retro Calibration
power properly. Verify spatial offsets and
failure
frame offsets passed.
Verify the 785 SSC laser turns on and
can set power properly. Completely
Side Scatter Calpower down the instrument and power
ibration failure
back up to re-run the test. Verify spatial
offsets passed.
Verify the laser turns on and can set
power properly. Completely power down
Laser Power test
the instrument and power back up to refailure
run the test. Verify spatial offsets and
frame offsets passed.
Brightfield alignVerify brightfield is working properly.
ment test failure
- 74 -
Symptom
Possible Causes
Recommended Solutions
Brightfield uniformity test failure
Verify brightfield is working properly.
Verify camera can image properly. Completely power down the instrument and
power back up to re-run the test.
Verify the reagent buffers are full. Run
Flow Core Axial Sta-the sterilize script followed by the startup
bility test failure
script, and re-run the test. See solutions
for unstable fluidics.
Flow Core Lateral See solution above (Flow core Axial staStability test failure bility test).
Flow Core Position See solution above (Flow core Axial statest failure
bility test).
Focus Percentage See solution above (Flow core Axial statest failure
bility test).
Focus Uniformity
See solution above (Flow core Axial statest failure
bility test).
Image Quality test See solution above (Flow core Axial stafailure
bility test).
The region to col- In the wizard verify that 1,000 of “All”
lect was set incor- cells (or of a region drawn on the approrectly
priate population) are being collected.
Too many objects
Set the events to acquire less than 1,000.
are being collected
Make sure that the compensation control
sample has more than 10% positive
Cells are not fluevents, and are as bright as possible. IgG
orescent
capture beads or a cell line stained with
a single fluorochrome may be used for
comp controls.
Compensation controls must be a samCells are stained
ple with a single fluorochrome label in a
with more than one
single tube. Each fluorochrome must be
fluorochrome
run separately.
Camera noise test
failure
Compensation
wizard fails to
complete
- 75 -
Chapter 5
Symptom
Software
Possible Causes Recommended Solutions
INSPIRE appears Camera is not runto freeze
ning
If the camera is
already running
Imaging is paused
No objects in the
current image view
mode
INSPIRE fails to
launch
Click Run/Setup.
Click Stop then Run/Setup
Click Resume.
In the cell view area, select the all population.
Wait until the script completes, or if necA script is running essary, click Abort Script to prematurely
stop the operation.
Open the Windows Task Manager by
pressing <Ctrl + Alt + Del>. Click the
Applications tab. If INSPIRE is ‘Not
Responding’, select the INSPIRE task
and click End Now. Restart the
INSPIRE application by double clicking
the icon on the desktop. If the program
restarts, make sure the lasers and brightThe INSPIRE appli- field lamp are turned on and then recation has crashed establish the core stream. If the application does not start, use the Windows
Task Manager to end the INSPIRE task
again. Shut the instrument and computer down from the Start menu. Then
turn on the instrument as described. If a
crash occurs during the day, a complete
shutdown is recommended at the end of
the day, before running sterilize.
On the keyboard press Ctrl-Alt- Delete,
Splash screen is
open the task manager, select INSPIRE
not responding
and press end task. Wait 60 seconds
and try restarting INSPIRE.
Loss of comShut down the computer, and power off
munication
the instrument. Verify all computers are
between the com- off. Power on the instrument and the
puters and instru- computer, wait 5 min and try launching
ment.
INSPIRE.
- 76 -
Symptom
Possible Causes Recommended Solutions
Plots fail to
Computer
update, or update resources are
slowly
being over used
Too many plots in
the template
Parent population
has no qualifying
events
Plots are scaled
incorrectly
Data file fails to
collect
No events qualify
for the region
Computer hard
drive is full
Data file collected
rapidly
File directory was
lost
No .rif or .fcs file
was created
Close all third party software.
For optimal plot update rates limit the
number of plots to 15.
Right click on the plot, select graph properties, and change the selected population to “all” or a population that has
qualifying events.
In the plot tool bar, press the – magnifying glass and rescale the plot.
Make sure there are events going into
the collection region by viewing that
region in the image gallery and updating the acquisition collection population
appropriately.
Verify the cell concentration is appropriate. 1x10^7 cells/ml is ideal.
Verify the computer hard drive has sufficient room to save the data file. To do
this go to Start / Computer / right click on
properties and a pie chart showing how
much disk space is available is displayed. Backup and delete data to free
up disk space.
Some samples have high concentrations and acquire faster than the
display rate. Check the destination
folder and see if the raw data was collected.
Collecting data over a downed network
or changing the name of the destination
folder will cause the instrument to lose
the data directory. Verify the data destination folder is accessible using the
browse button in the Acquisition Settings section.
Go to the file drop down menu and
check Generate .rif and or .fcs file.
- 77 -
Chapter 5
- 78 -
Symptom
No Images
Image
Possible Causes Recommended Solutions
Camera is not running
If the camera is
already running
Imaging is paused
Displayed region is
incorrect
Click Run/Setup.
Click Stop to stop the camera, and
then click Run/Setup.
Click Resume.
In the cell view area, select the all population.
Turn the appropriate lasers on. Set the
Insufficient illu785 SSC laser to 40mw. Set the laser
mination
powers to maximum and decrease
them to prevent pixel saturation.
Make sure the brightfield lamp is
turned on and click Set Intensity.
Core stream is out- Manually find the core stream. In the
side the objective’s focus and centering section, move
field of view
core track left or right to find the core.
Computer resources
Close all third party software.
are being over used
Imaging and acquiMake sure the sample concentration is
sition rate is
Sample conbetween 107 and 108 cells/ml. Lower
erratic, or appears centration is low
concentrations can be used but this
frozen
will decrease the cells/second.
Region being
In the cell view area, select the all popviewed has few or ulation, or readjust regions to include
no cells
more cells.
Turn the appropriate lasers on. Set the
Insufficient illu785 SSC laser to 40mw. Set the laser
mination
powers to maximum and decrease
them to prevent pixel saturation.
Make sure the brightfield lamp is
turned on and click Set Intensity.
The process of object detection can
safely handle up to 4000 objects per
second. The maximum sample conThe sample is too
centration is 4-5x10^8 cells per ml,
concentrated
with the recommended concentration
1-10 x10^7 cells per ml. To decrease
the event rate, dilute the sample.
- 79 -
Chapter 5
Symptom
Objects appear
streaked
Objects are not
centered in the
channel
Possible Causes
Recommended Solutions
The sample has an Use a region to eliminate the debris
excessive amount from the data file, or prepare a fresh
of debris
sample.
Computer resources
Exit all third party programs.
are being overused
Verify brightfield is working normally
Camera is not trackand rerun ASSIST using calibration
ing the cell velocity
beads. See solutions for unstable fluidaccurately
ics.
Verify the beads will run by returning
any sample, going to fluidics section
and press stop, then run. Next go to
the advanced drop down, select flow
SpeedBeads fail to
speed, and check that the red and
run
black histograms have tight CVs at the
appropriate core velocity. To view
bead images select the All population
and check include beads.
Verify that there are two brightfield
There is only one
channels. Check in the image display
channel of brightproperties that 1 and 9 are active, verfield
ify that brightfield is emitting in channels 1 and 9.
Lateral deviation of
Run the purge bubbles script from the
the core stream due
instrument drop-down menu. See soluto air or clog in the
tions for unstable fluidics.
system
In the Focus and Centering section,
Autofocus and cenadjust focus and centering left or right,
tering is not tracking
until the images are centered and in
properly
optimal focus.
- 80 -
Symptom
Possible Causes
Recommended Solutions
The core tracking and focus tracking
should not change significantly from
Core stream posi- day to day. If either value changes radtion is grossly offically, objects may rotate due to interObjects are rotatcenter within the
actions with the sheath. An off-center
ing in the core
flow cell due to air core stream is caused by air or clogs
stream
or clog in the fluid- in the fluidic system. Run the purge
ics
bubbles script from the instrument
drop-down menu. See solutions for
unstable fluidics.
Re-run the focus adjuster and frame
Objects are out of Camera line rate is
offset calibration in ASSIST, and verify
focus
incorrect
it passes.
Excessive core
Run the purge bubbles script from the
stream variation due
instrument drop-down menu. See soluto air or clog in the
tions for unstable fluidics.
fluidics
Core stream is mov- Allow the system to settle for 60 secing too fast for the onds after loading a sample. Collect
camera
data once imagery looks good.
In the Focus and Centering section,
Autofocus is not
adjust focus and centering, left or right,
tracking properly
until the images are centered and in
optimal focus.
Turn off bin mode by selecting fluidics,
and set the slider bar to low speed
Data is binned
high sensitivity. Verify this change in
the advanced drop down by selecting
camera and verifying a 1x bin mode.
In the magnification and EDF section
EDF is on
uncheck the EDF checkbox.
Lateral deviation of
Run the purge bubbles script from the
Objects are
the core stream due
instrument drop-down menu. See solucropped
to air or clog in the
tions for unstable fluidics.
system
In the Focus and Centering section,
Autofocus and cenadjust focus and centering left or right,
tering is not tracking
until the images are centered and in
properly
optimal focus.
Incorrect MagIn the magnification and EDF section
- 81 -
Chapter 5
Symptom
Possible Causes
Recommended Solutions
nification
choose a lower magnification.
Run SpeedBeads by returning any
sample and then sopping and running
The two brightfield
fluidics. Load the default template and
Frame offset is incorimages are not of
verify brightfield is in channel 1 and 9
rect
the same cell
at 800 counts of background. Open
ASSIST re-run the frame offset calibration routine, and verify it passes.
Call service, and verify that the illuIllumination is
mination pathways are in proper aligngrossly misaligned
ment.
Run SpeedBeads by returning any
sample and then sopping and running
fluidics. Load the default template and
Cross correlation is
verify brightfield is in channel 1 and 9
incorrect
at 800 counts of background. Open
ASSIST, re-run the cross correlation
utility, and verify it passes.
Images appear pixImage gallery zoom Use the – magnifying glass to zoom
elated or larger
is active
out and restore the native image size.
than normal
Objects appear
In the magnification and EDF section
Incorrect maglarger or smaller
choose an appropriate magnification
nification
then normal
for your cell type.
Not all 12 channels
Image gallery zoom Use the – magnifying glass to zoom
are being disis active
out and restore the native image size.
played
To activate a channel for acquisition,
Channel is not acti- click on the channel column heading
vated
(i.e. Ch2) and check the “collected”
check box to save that channel.
Image gallery dis- Click on the channel column heading
Images have incorplay is set up incor- (i.e. Ch2) and set the display and chanrect colors
rectly
nel color for the channel.
- 82 -
Symptom
Intensity
Possible Causes Recommended Solutions
Increase the image display gain by
clicking on the channel column, selecting the appropriate channel, and movFluorescence
ing the right green handle bar to a
Image display setimagery appears
smaller value, or the brightest pixel in
tings are set too low
too dim
the histogram. To set the display background to black move the left green
handle bar to the dimmest pixel in the
histogram.
Sample did not
Look at the sample with a fluorescent
label well
microscope.
Turn the appropriate lasers on. Set the
Insufficient illulaser powers to maximum and
mination
decrease them to prevent pixel saturation.
If the probing protocol results in dim
staining, sensitivity of the instrument
can be increased by changing the
fluidics speed to Lo / Hi sensitivity
mode.
Core stream position is grossly offRun the purge bubbles script from the
center within the
instrument drop-down menu. See soluflow cell due to air
tions for unstable fluidics.
or clog in the fluidics
Run calibration particles on the Flow
Sight. Load the default template. Open
Excitation laser is
ASSIST, re-run the laser alignment
misaligned
calibration for the appropriate laser
line, and verify it passes.
Fluorescence is
Decrease the image display gain by
Image display settoo bright, images
moving the right hand green handle
tings are set too
have a contrasting
bar to a higher value for the approhigh
color or appear flat
priate camera channel.
Decrease the excitation laser power to
Instrument senprevent pixel saturation. Saturation is
sitivity is set too
indicated in the image gallery by pixhigh
els colored in a contrasting color (gen-
- 83 -
Chapter 5
Symptom
Possible Causes
Recommended Solutions
erally red or white).
Set the brightfield intensity to 800
counts by pressing “Set Intensity”.
The sheath syringe Load sheath, then go to the instrument
is empty
drop down and run prime.
There is a clog or Run the Purge Bubbles script from the
air bubble in the sys-instrument drop-down menu. See solutem
tions for unstable fluidics.
The best instrument setup maximizes
the dynamic range of fluorescence sigOne channel sat- Instrument sennal, while at the same time avoiding
urates while the
sitivity is not optiimage pixel saturation (which cannot
others do not
mized
be compensated). In general decreasing the laser powers until no pixels saturate.
Reduce the concentration of the stain
Probing protocol
that produces the saturating signal so
requires better stain
that all probes can be simultaneously
balance
imaged without excessive saturation.
Some DNA dyes are required to run
with the sample to stain properly, however if too much dye is in solution it
Excessive flucan cause the core stream to fluorescent dye is left oresce. It’s important to balance the
in the sample buffer. concentration of these dyes so that the
cells can be imaged properly. Typically the concentrations in “Current
Protocols in Cytometry” should work.
Scatter is too dim Instrument is expeAllow the instrument to warm up by
or bright or
riencing large temrunning for 15 minutes.
changes over time perature variation
Direct a fan toward the back of the
instrument to dissipate excess heat, or
move the system to a temperature controlled environment.
Laser power set too Increase or decrease the 785 SSC
high or low
laser power.
Core stream posi- Run the purge bubbles script from the
tion is grossly off- instrument drop-down menu. See solucenter within the
tions for unstable fluidics.
- 84 -
Symptom
Possible Causes
Recommended Solutions
flow cell due to air
or clog in the fluidics
Large variation in
Large flow speed
brightfield intensity
variation due to air
levels
Light source delivering variable output
Brightfield intensity Intensity set before
level sets incordesired flow speed
rectly
has been achieved
Run the purge bubbles script from the
instrument drop-down menu. See solutions for unstable fluidics.
Power down and power up the instrument, if this does not fix the problem,
call Amnis service.
Allow the system to stabilize after
loading a sample, and then click Set
Intensity.
Power down and power up the instruMovable optics are
ment, if this does not fix the problem,
out of position
call Amnis service.
- 85 -
Index
A
Acquisition
button 21
stop 21
Acquisition button 21
Analysis Area 18
tools 18
ASSIST 45
ASSIST Calibrations 47
Autosampler Nest 55
Brightfield crosstalk coefficient 50
camera synchronization 47
Core Stage Position 51
Dark Current 49
Horizontal laser 52
retro 54
side scatter 53
spatial offsets 48
ASSIST Tests 56
BF Intensity Selection 57
BF uniformity 58
Camera Noise 59
Excitation laser power 56
- 87 -
Chapter 6
flow core axial stability 60
flow core lateral stability 61
flow core position 62
focus offset 63
focus percentage 64
focus uniformity 65
image quality ensquared energy test 66
Autosampler 38
B
Brightfield
adjustments 22, 31
C
Calibration 28, 45
Autosampler Nest 55
Brightfield Crosstalk Coefficient 50
Camera Synchronization 47
Core Stage Position 51
Dark Current 49
Horizontal Laser 52
Retro 54
Side Scatter 53
Spatial Offsets 48
Calibrations and Tests
Start All 45
camera 12
- 88 -
Centering
adjustment 23
Cleanser 14
Compensation
button 18
mode 33
Core Tracking 28
D
data files 32
Debris
Squelching 35
Debubbler 14
DNA dye
cleaning 33
E
EDF
characteristics 37
turing on 31
using 37
F
Features
Area 31
Aspect Ratio 31
Background Mean 32
Gradient RMS 32
- 89 -
Chapter 6
Intensity 32
Major Axis 32
Mean Pixel 32
Minor Axis 32
Object Number 32
Raw Centroid X 32
Raw Centroid Y 32
Raw Max Pixel 32
Raw Min Pixel 32
Time 32
Uncompensated Intensity 32
fluorochrome balancing 30
Focus
adjustment 23
G
Graphs
features 31
histogram 18
refresh 18
scatterplot 18
I
Image Display properties 17
Image Display tools 16
Image Gallery 16
pause button 21
tools 16
- 90 -
ImageStream
shutting down 36
starting 28
INSPIRE
User Interface 15
Instrument Control Panel 19
L
laser 12
Laser
adjustments 22, 31
M
Magnification
changing 22, 31
Mask
display 16
Menus
Advanced 26
Analysis 26
Compensation 26
File 24
Instrument 24
Layout 26
MultiMag 38
O
optimizing settings 13
- 91 -
Chapter 6
Optional settings 35
Options 37
MultiMag 38
P
password 28
Physical requirements 2
R
reagents 14
Run beads 45
Run/Setup mode 21
S
Safety 2
Biological Safety 9
Electrical Safety 6
Laser Safety 7
Sample
buffer compatability 30
load 21
order 30
Saturation
color 17
sheath bottle 14
sheath fluid 14
Shutdown 36
button 23
- 92 -
SpeadBeads
run 45
Speed
control 22, 35
SpeedBeads
loading 28
Startup 28
button 23
Sterilizer 14
T
Task bar information 23
Templates 31
Test
BF Intensity Selection 57
BF Uniformity 58
Camera Noise 59
Excitation Laser Power 56
Flow Core Axial Stability 60
Flow Core Lateral Stability 61
Flow Core Position 62
Focus Offset 63
Focus Percentage 64
Focus Uniformity 65
Image Quality 66
Tests 56
Troubleshooting 69
- 93 -
Chapter 6
U
user name 28
W
waste 5, 9
bottle 14
fluid 14
Weight 2
- 94 -