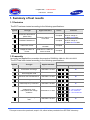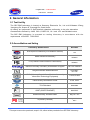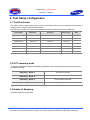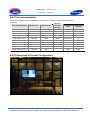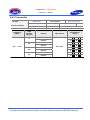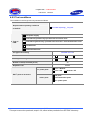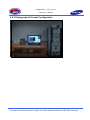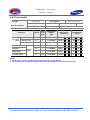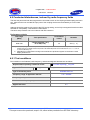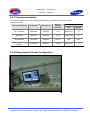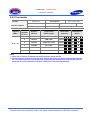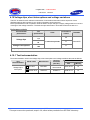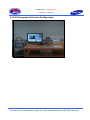
1
EMC TEST REPORT
Project No.
LBE081805
Revision No.
NONE
Name of organization Samsung Electronics Co., Ltd.
Applicant
Address
Date of application
2008.05.30
Kind of product
LCD Monitor
Model No.
EUT
Equipment
Under Test
416 Maetan 3-Dong,Yeongtong-Gu,Suwon-Si,
Gyeonggi-Do, 443-742 Korea
MG32PS
Variant Model No.
NONE
New / Alternative /
Permissive change * New
information
Manufacturer
Applied Standards
Samsung Electronics Co., Ltd.
416 Maetan 3-Dong,Yeongtong-Gu,Suwon-Si,
Gyeonggi-Do, 443-742 Korea
EN55022:1998+A1:2000+A2:2003
EN55024:1998+A1:2001+A2:2003
EN61000-3-2:2000+A2:2005
EN61000-3-3:1995+A1:2001+A2:2005
Issue date
2008.07.31
Test result : Complied
The equipment under test has found to be compliant with the applied standards.
(Refer to the attached test result for more detail.)
Tested by : Hyun Jeong Jang
Reviewed by : No Cheon Park
This report is the test result about the sphere accredited by KOLAS which signed the Mutual Recognition
Arrangement of International Laboratory Accreditation Cooperation.
The test results in this report only apply to the tested sample. This report must not be reproduced, except in full,
without written permission from SEC EMC Laboratory.
416 Maetan 3-Dong, Yeongtong-Gu, Suwon-Si, Gyeonggi-Do, 443-742 Korea
Tel: 82 31 277 7752, Fax: 82 31 277 7753
-1/65-
Project No. : LBE081805
LCD Monitor
MG32PS
Table of contents
1. Summary of test results
1.1 Emission
1.2 Immunity
2. General Information
2.1 Test facility
2.2 Accreditation and listing
2.3 EUT Description
3. Test configuration
3.1 Test Peripherals
3.2 EUT operating mode
3.3 Details of Sampling
3.4 Used cable description
3.5 EUT Description
3.6 Description of the EUT exercising method
3.7 Performance Criteria
3.8 Measurement uncertainty
3.9 Measurement uncertainty
4. Result of individual tests
4.1 Conducted disturbance
4.2 Radiated disturbance
4.3 Harmonics current
4.4 Voltage fluctuation & Flicker
4.5 Electrostatic discharge
4.6 Radiated, radio-frequency, electromagnetic field
4.7 Electrical fast transient/burst
4.8 Surge
4.9 Conducted disturbances, induced by radio-frequency fields
4.10 Voltage dips, short interruptions and voltage variations
Appendix – EUT photography
-2/65This report must not be reproduced, except in full, without written permission from SEC EMC Laboratory.
Project No. : LBE081805
LCD Monitor
MG32PS
1. Summary of test results
1.1 Emission
The EUT has been tested according to the following specifications:
Applied
Test type
Applied standard
Conducted Disturbance
(Mains Port)
Result
Remarks
Meets Class B Limit
Minimum margin is
3.4 dB at 0.539 MHz
Meets Class B Limit
Minimum margin is
6.0 dB at 633.412 MHz
Complied
EN55022:1998+A1:200
0+A2:2003
Radiated Disturbance
Complied
Harmonics current
EN61000-3-2:2000
+A2:2005
Complied
Voltage fluctuation &
Flicker
EN61000-3-3:1995+A1:
2001+A2:2005
Complied
1.2 Immunity
Immunity test applied the normative documents of EN55024:1998+A1:2001+A2:2003.
The EUT has been tested according to the following specifications:
Applied
Performance Criterion
Test type
Applied standard
Electrostatic discharge
EN61000-4-2:1995
A
B
C
B
Radiated, radio-frequency,
electromagnetic field
EN61000-4-3:1995
A
B
C
A
Electrical fast transient/burst
EN61000-4-4:1995
A
B
C
B
Surge
EN61000-4-5:1995
A
B
C
B
Radio-frequency conducted
EN61000-4-6:1996
A
B
C
A
A
B
C
A
B
C
A
B
C
A
B
C
Voltage dips, short
interruptions and voltage
variations
Power-frequency magnetic
field
EN61000-4-11:1994
EN61000-4-8:1993
Result
Specification
B : > 95 % 0.5 Reduction
C : 30 % 25 Reduction
C : > 95 % 250 Reduction
A
-3/65This report must not be reproduced, except in full, without written permission from SEC EMC Laboratory.
Project No. : LBE081805
LCD Monitor
MG32PS
2. General Information
2.1 Test facility
The SEC EMC Laboratory is located on Samsung Electronics Co., Ltd. at 416 Maetan 3-Dong,
Yeongtong-Gu, Suwon-Si, Gyeonggi-Do, South Korea.
All testing are performed in Semi-anechoic chambers conforming to the site attenuation
Characteristics defined by ANSI C63.4, CISPR 22, 16-1 and 16-2. and Shielded rooms.
The SEC EMC Laboratory is operated as testing laboratory in accordance with the
requirements of ISO/IEC 17025:2005.
2.2 Accreditation and listing
Laboratory Qualifications
Remarks
KOLAS(Korea Laboratory Accreditation Scheme)
Accredited :
124
Radio Research Laboratory
Accredited :
KR0004
FCC(Federal Communications Commission)
Accredited :
KR0004
National Voluntary Laboratory Accreditation Program
Lab Code: 200623-0
Norges Elektriske Materiellkontroll
Accredited :
ELA 195
VCCI (Voluntary Control Council for Interference by
Information Technology Equipment)
C-2421,R-2224
China Quality Certification Center
5-053, 5-054
TUV Rhineland
H9354285
GOST(GOSTSTANDART)
ROSTEST
Elektrotechnicky Zkusebni Ustav
Reg. No.: 001
IC(Industry Canada)
Assigned Code:
5871
-4/65This report must not be reproduced, except in full, without written permission from SEC EMC Laboratory.
Project No. : LBE081805
LCD Monitor
MG32PS
3. Test Setup configuration
3.1 Test Peripherals
The cables used for these peripherals are either permanently attached by the peripheral manufacturer or
coupled with an assigned cable as defined below.
The following is a listing of the EUT and peripherals utilized during the performance of EMC test:
Description
Model No.
Serial No.
Manufacturer
Note
LCD Monitor
MG32PS
-
Samsung
EUT
PC
DM-V65
156X96BP600169L
Samsung
-
USB Keyboard
SEM-DT35
40037574
Samsung
-
USB Mouse
M-SBF69
HCA53112273
Samsung
-
USB Mouse
MS201U
69G0536
Samsung
-
USB Mouse
MS201U
69G0513
Samsung
-
USB Mouse
MS201U
69G1500
Samsung
-
3.2 EUT operating mode
To achieve compliance applied standard specification, the following mode(s) were made during
compliance testing:
Operating Mode 1
PC Video In(Analog)
Operating Mode 2
DVI Input(Digital)
Operating Mode 3
DVI to HDMI Connected
Operating Mode 4
Magic Network
3.3 Details of Sampling
Customer selected, single unit.
-5/65This report must not be reproduced, except in full, without written permission from SEC EMC Laboratory.
Project No. : LBE081805
LCD Monitor
MG32PS
3.4 Used cable description
The EUT is configured, installed, arranged and operated in a manner consistent with typical
applications. Interface cables/loads/devices are connected to at least one of each type of interface
port of the EUT, and where practical, each cable shall be terminated in a device typical of actual
usage. The type(s) of interconnecting cables to be used and the interface port (of the EUT) to
which these were connected;
No
Connect Cable
Length [m]
Ferrite core [Y/N]
Remark
1
Power
1.8
N
For EUT
2
Power
1.8
N
For PC
3
Power
1.8
N
For Printer
4
PC Video In(Analog)
1.5
N
-
5
DVI Input(Digital)
1.5
N
-
6
DVI to HDMI
1.5
Y
-
7
USB Keyboard
1.5
N
-
8
USB Mouse
1.5
N
-
9
USB Mouse
1.0
Y
-
10
USB Mouse
1.0
Y
-
11
USB Mouse
1.0
Y
-
12
PC Audio In
1.5
Y
-
13
LAN
2.0
Y
-
14
A/V Out
1.0
N
-
15
Audio In
1.0
N
-
16
RS232C IN
1.5
Y
-
17
RS232C OUT
1.5
Y
-
18
USB Printer
1.0
N
3.5 EUT Description
The following features describe EUT represented by this report:
Items
Description
Optimum Resoultion
1 360 x 768 @ 60Hz
Maximum Resolution
1 360 x 768 @ 60Hz
Horizontal Frequency(kHz)
30 ~ 70KHz
Vertical Frequency(Hz)
50 ~ 85Hz
-6/65This report must not be reproduced, except in full, without written permission from SEC EMC Laboratory.
Project No. : LBE081805
LCD Monitor
MG32PS
3.6 Description of the EUT exercising method
The EUT exercise program used during EMI and Immunity (EMS) testing was the SEC EMC
Laboratory standardized test program for MS Windows. The program repetitively sends a screen of
H - Character to the display.
Connect video output of computer on EUT's PC IN(D-sub)port and scrolled H – character
continuously on EUT's screen.
Also, when EUT has loudspeaker, it was regenerative through EUT’s audio input reproducing
“digital white noise” by MS Windows Media player in computer.
3.7 Performance Criteria
Performance criterion A
The equipment shall continue to operate as intended without operator intervention. No degradation
of performance or loss of function is allowed below a performance level specified by the
manufacturer when the equipment is used as intended. The performance level may be replaced by
a permissible loss of performance. If the minimum performance level or the permissible
performance loss is not specified by the manufacturer, then either of these may be derived from the
product description and documentation, and by what the user may reasonably expect from the
equipment if used as intended.
Performance criterion B
After the test, the equipment shall continue to operate as intended without operator intervention.
No degradation of performance or loss of function is allowed, after the application of the
phenomena below a performance level specified by the manufacturer, when the equipment is used
as intended. The performance level may be replaced by a permissible loss of performance.
During the test, degradation of performance is allowed. However, no change of operating state or
stored data is allowed to persist after the test.
If the minimum performance level (or the permissible performance loss) is not specified by the
manufacturer, then either of these may be derived from the product description and documentation,
and by what the user may reasonably expect from the equipment if used as intended.
Performance criterion C
Loss of function is allowed, provided the function is self-recoverable, or can be restored by the
operation of the controls by the user in accordance with the manufacturer’s instructions.
Functions, and/or information stored in non-volatile memory, or protected by a battery backup, shall
not be lost.
-7/65This report must not be reproduced, except in full, without written permission from SEC EMC Laboratory.
Project No. : LBE081805
LCD Monitor
MG32PS
3.8 Measurement uncertainty
Where relevant, the following measurement uncertainty levels have been estimated for tests
performed on the apparatus: (According to CISPR 16-4 and UKAS Lab 34.)
3.8.1 Emission
Measurement uncertainty
(C.L. 95 %, k = 2)
Test type
Conducted disturbance
Radiated Disturbance
± 2.8 dB
Horizontal
± 4.82 dB
Vertical
± 5.42 dB
-8/65This report must not be reproduced, except in full, without written permission from SEC EMC Laboratory.
Project No. : LBE081805
LCD Monitor
MG32PS
4. Results of individual test
4.1 Conducted disturbance
Both conducted lines are measured in Quasi-Peak and Average mode, including the worst-case data points
for each tested configuration. The EUT measured in accordance with the methods described in Clause 9.
Limits for conducted disturbance at the mains ports of class A ITE
NOTE
Limits dB(μV)
Frequency range Limits
MHz
Quasi-peak
Average
0,15 to 0,50
79
66
0,50 to 30
73
60
The lower limit shall apply at the transition frequency
Limits for conducted disturbance at the mains ports of class B ITE
Limits dB(μV)
Frequency range Limits
MHz
Quasi-peak
Average
0,15 to 0,50
66 to 56
56 to 46
0,50 to 5
56
46
5 to 30
60
50
NOTE 1 The lower limit shall apply at the transition frequency
NOTE 2 The limit decreases linearly with the logarithm of the frequency in the range
0,15 MHz to 0,50 MHz.
4.1.1 Test instrumentation
Test instrumentation used in the Conducted disturbance test was as follows:
Test instrumentation
Model name
Manufacturer
Serial or
Firmware
(No./Ver.)
Calibration
Interval
Date
(Month)
Test Software
EMC 32
R&S
Ver. 4.40.0
N/A
N/A
Measuring receiver
ESCI
R&S
100368
2008-06-11
12
Artificial mains network
ENV216
R&S
100116
2007-09-13
12
-9/65This report must not be reproduced, except in full, without written permission from SEC EMC Laboratory.
Project No. : LBE081805
LCD Monitor
MG32PS
4.1.2 Photograph of the test Configuration
(Front)
(Rear)
-10/65This report must not be reproduced, except in full, without written permission from SEC EMC Laboratory.
Project No. : LBE081805
LCD Monitor
MG32PS
4.1.3 Test results
PC Video In(Analog)_Ping test
Operating condition
2008-07-31
Test date
Ambient
temperature
Climate condition
Hyun Jeong Jang
Test engineer
24.1 ℃
Relative
humidity
40 %
Atmospheric
pressure
100.7 kPa
Shielded Room #1
Test place
* QP : Quasi-peak, AV: Average
* Result = Level(QP or AV) + Corr.
(LISN Insertion loss + Cable loss – Amplifier Gain)
* Margin = Limit - Level
Note
Hardware Setup: Voltage with ENV 2-Line-LISN - [EMI conducted]
Subrange 1
Frequency Range:
Receiver:
Transducer:
150kHz - 30MHz
ESCI 3
ENV216 / Receiver-2-Line-LISN ENV216
Scan Setup: EN55022_B_ENV 2-Line-LISN fin [EMI conducted]
Hardware Setup:
Level Unit:
Voltage with ENV 2-Line-LISN
dBμV
Subrange
150kHz - 30MHz
EN55022_B
Detectors
QuasiPeak; Average
IF Bandwidth
9kHz
Meas. Time
15s
Receiver
ESCI 3
with ENV 2-Line-LISN
80
70
EN 55022_B Voltage on Mains QP
60
EN 55022_B Voltage on Mains AV
Level in dBμV
50
40
30
20
10
0
150k
300
400 500
800 1M
2M
3M
4M 5M 6
8
10M
20M
30M
Frequency in Hz
-11/65This report must not be reproduced, except in full, without written permission from SEC EMC Laboratory.
Project No. : LBE081805
LCD Monitor
MG32PS
Final Measurement Detector 1
Frequency
(MHz)
0.191 500
0.213 500
0.304 500
0.361 500
0.427 500
0.510 500
0.541 500
0.611 500
0.818 500
0.941 500
Quasi Peak
(dBμV)
45.9
42.4
46.2
43.3
44.7
50.3
52.1
42.9
35.9
34.9
Line
Corr.
(dB)
L1
N
N
N
N
N
N
L1
L1
L1
9.6
9.6
9.6
9.6
9.6
9.6
9.6
9.6
9.7
9.7
Margin
(dB)
18.1
20.7
13.9
15.4
12.6
5.7
3.9
13.1
20.1
21.1
Limit
(dBμV)
64.0
63.1
60.1
58.7
57.3
56.0
56.0
56.0
56.0
56.0
9.6
9.6
9.6
9.6
9.7
9.7
9.7
9.7
9.7
9.8
Margin
(dB)
19.1
19.9
4.8
4.4
19.1
19.3
20.3
20.8
21.0
22.9
Limit
(dBμV)
49.7
47.3
46.0
46.0
46.0
46.0
46.0
46.0
46.0
46.0
Final Measurement Detector 2
Frequency
(MHz)
0.320 500
0.429 500
0.510 500
0.576 500
0.822 500
1.174 500
1.409 500
1.645 500
2.116 500
3.179 500
Average
(dBμV)
30.5
27.3
41.2
41.6
26.9
26.7
25.7
25.2
25.0
23.1
Line
Corr.
(dB)
N
N
N
N
L1
L1
L1
N
L1
L1
-12/65This report must not be reproduced, except in full, without written permission from SEC EMC Laboratory.
Project No. : LBE081805
LCD Monitor
MG32PS
DVI Input(Digital)_Ping test
Operating condition
2008-07-31
Test date
Ambient
temperature
Climate condition
Hyun Jeong Jang
Test engineer
24.1 ℃
Relative
humidity
40 %
Atmospheric
pressure
100.7 kPa
Shielded Room #1
Test place
* QP : Quasi-peak, AV: Average
* Result = Level(QP or AV) + Corr.
(LISN Insertion loss + Cable loss – Amplifier Gain)
* Margin = Limit - Level
Note
Hardware Setup: Voltage with ENV 2-Line-LISN - [EMI conducted]
Subrange 1
Frequency Range:
Receiver:
Transducer:
150kHz - 30MHz
ESCI 3
ENV216 / Receiver-2-Line-LISN ENV216
Scan Setup: EN55022_B_ENV 2-Line-LISN fin [EMI conducted]
Hardware Setup:
Level Unit:
Voltage with ENV 2-Line-LISN
dBμV
Subrange
150kHz - 30MHz
EN55022_B
Detectors
QuasiPeak; Average
IF Bandwidth
9kHz
Meas. Time
15s
Receiver
ESCI 3
with ENV 2-Line-LISN
80
70
EN 55022_B Voltage on Mains QP
60
EN 55022_B Voltage on Mains AV
Level in dBμV
50
40
30
20
10
0
150k
300
400 500
800 1M
2M
3M
4M 5M 6
8
10M
20M
30M
Frequency in Hz
-13/65This report must not be reproduced, except in full, without written permission from SEC EMC Laboratory.
Project No. : LBE081805
LCD Monitor
MG32PS
Final Measurement Detector 1
Frequency
(MHz)
0.172 500
0.199 500
0.303 500
0.368 500
0.419 500
0.509 500
0.537 500
0.616 500
0.812 500
0.966 500
Quasi Peak
(dBμV)
45.9
43.6
43.9
43.2
45.2
51.4
51.7
42.9
37.0
33.9
Line
Corr.
(dB)
L1
N
N
N
N
N
N
L1
L1
L1
9.6
9.6
9.6
9.6
9.6
9.6
9.6
9.6
9.7
9.7
Margin
(dB)
18.9
20.0
16.3
15.3
12.3
4.6
4.3
13.1
19.0
22.1
Limit
(dBμV)
64.8
63.6
60.1
58.5
57.5
56.0
56.0
56.0
56.0
56.0
9.6
9.6
9.6
9.6
9.7
9.7
9.7
9.7
9.7
10.1
Margin
(dB)
18.5
19.7
4.3
5.6
24.3
22.3
22.2
23.9
25.2
22.1
Limit
(dBμV)
49.7
47.3
46.0
46.0
46.0
46.0
46.0
46.0
46.0
50.0
Final Measurement Detector 2
Frequency
(MHz)
0.321 500
0.429 500
0.508 500
0.579 500
0.642 500
0.814 500
1.158 500
1.389 500
1.623 500
17.080 500
Average
(dBμV)
31.1
27.5
41.7
40.4
21.7
23.7
23.8
22.1
20.8
27.9
Line
Corr.
(dB)
N
N
L1
N
L1
L1
L1
L1
L1
N
-14/65This report must not be reproduced, except in full, without written permission from SEC EMC Laboratory.
Project No. : LBE081805
LCD Monitor
MG32PS
HDMI to DVI connected _ Ping test
Operating condition
2008-07-31
Test date
Ambient
temperature
Climate condition
Hyun Jeong Jang
Test engineer
24.1 ℃
Relative
humidity
40 %
Atmospheric
pressure
100.7 kPa
Shielded Room #1
Test place
* QP : Quasi-peak, AV: Average
* Result = Level(QP or AV) + Corr.
(LISN Insertion loss + Cable loss – Amplifier Gain)
* Margin = Limit - Level
Note
Hardware Setup: Voltage with ENV 2-Line-LISN - [EMI conducted]
Subrange 1
Frequency Range:
Receiver:
Transducer:
150kHz - 30MHz
ESCI 3
ENV216 / Receiver-2-Line-LISN ENV216
Scan Setup: EN55022_B_ENV 2-Line-LISN fin [EMI conducted]
Hardware Setup:
Level Unit:
Voltage with ENV 2-Line-LISN
dBμV
Subrange
150kHz - 30MHz
EN55022_B
Detectors
QuasiPeak; Average
IF Bandwidth
9kHz
Meas. Time
15s
Receiver
ESCI 3
with ENV 2-Line-LISN
80
70
EN 55022_B Voltage on Mains QP
60
EN 55022_B Voltage on Mains AV
Level in dBμV
50
40
30
20
10
0
150k
300
400 500
800 1M
2M
3M
4M 5M 6
8
10M
20M
30M
Frequency in Hz
-15/65This report must not be reproduced, except in full, without written permission from SEC EMC Laboratory.
Project No. : LBE081805
LCD Monitor
MG32PS
Final Measurement Detector 1
Frequency
(MHz)
0.191 500
0.306 500
0.352 500
0.433 500
0.512 500
0.549 500
0.617 500
0.752 500
0.943 500
1.176 500
Quasi Peak
(dBμV)
45.8
45.6
43.3
44.5
50.1
52.7
41.1
36.3
34.9
35.3
Line
Corr.
(dB)
L1
N
N
N
N
N
L1
L1
L1
L1
9.6
9.6
9.6
9.6
9.6
9.6
9.6
9.7
9.7
9.7
Margin
(dB)
18.1
14.4
15.6
12.7
5.9
3.3
14.9
19.7
21.1
20.7
Limit
(dBμV)
64.0
60.1
58.9
57.2
56.0
56.0
56.0
56.0
56.0
56.0
9.6
9.6
9.6
9.6
9.7
9.7
9.7
9.7
9.7
9.7
Margin
(dB)
18.8
19.6
4.9
4.1
18.6
19.2
19.6
19.5
20.4
20.6
Limit
(dBμV)
49.7
47.2
46.0
46.0
46.0
46.0
46.0
46.0
46.0
46.0
Final Measurement Detector 2
Frequency
(MHz)
0.320 500
0.431 500
0.510 500
0.576 500
0.824 500
1.178 500
1.414 500
1.649 500
2.119 500
2.120 500
Average
(dBμV)
30.9
27.6
41.1
41.9
27.4
26.8
26.4
26.5
25.6
25.4
Line
Corr.
(dB)
N
N
N
N
L1
L1
L1
L1
L1
N
-16/65This report must not be reproduced, except in full, without written permission from SEC EMC Laboratory.
Project No. : LBE081805
LCD Monitor
MG32PS
Magic Network _ Ping test
Operating condition
2008-07-31
Test date
Ambient
temperature
Climate condition
Hyun Jeong Jang
Test engineer
24.1 ℃
Relative
humidity
40 %
Atmospheric
pressure
100.7 kPa
Shielded Room #1
Test place
* QP : Quasi-peak, AV: Average
* Result = Level(QP or AV) + Corr.
(LISN Insertion loss + Cable loss – Amplifier Gain)
* Margin = Limit - Level
Note
Hardware Setup: Voltage with ENV 2-Line-LISN - [EMI conducted]
Subrange 1
Frequency Range:
Receiver:
Transducer:
150kHz - 30MHz
ESCI 3
ENV216 / Receiver-2-Line-LISN ENV216
Scan Setup: EN55022_B_ENV 2-Line-LISN fin [EMI conducted]
Hardware Setup:
Level Unit:
Voltage with ENV 2-Line-LISN
dBμV
Subrange
150kHz - 30MHz
EN55022_B
Detectors
QuasiPeak; Average
IF Bandwidth
9kHz
Meas. Time
15s
Receiver
ESCI 3
with ENV 2-Line-LISN
80
70
EN 55022_B Voltage on Mains QP
60
EN 55022_B Voltage on Mains AV
Level in dBμV
50
40
30
20
10
0
150k
300
400 500
800 1M
2M
3M
4M 5M 6
8
10M
20M
30M
Frequency in Hz
-17/65This report must not be reproduced, except in full, without written permission from SEC EMC Laboratory.
Project No. : LBE081805
LCD Monitor
MG32PS
Final Measurement Detector 1
Frequency
(MHz)
0.350 500
0.434 500
0.511 500
0.539 500
0.614 500
2.739 500
3.412 500
4.182 500
Quasi Peak
(dBμV)
43.0
45.6
50.3
52.6
41.2
34.5
39.1
43.3
Line
Corr.
(dB)
N
N
N
N
L1
L1
L1
L1
9.6
9.6
9.6
9.6
9.6
9.7
9.8
9.8
Margin
(dB)
16.0
11.6
5.7
3.4
14.8
21.5
16.9
12.7
Limit
(dBμV)
59.0
57.2
56.0
56.0
56.0
56.0
56.0
56.0
9.6
9.6
9.6
9.7
9.7
9.8
9.8
9.8
Margin
(dB)
18.8
4.9
4.7
16.0
13.8
12.3
16.7
17.4
Limit
(dBμV)
49.7
46.0
46.0
46.0
46.0
46.0
46.0
50.0
Final Measurement Detector 2
Frequency
(MHz)
0.320 500
0.509 500
0.577 500
2.951 500
3.188 500
4.183 500
4.304 500
5.311 500
Average
(dBμV)
30.9
41.1
41.3
30.0
32.2
33.7
29.3
32.6
Line
Corr.
(dB)
N
N
N
N
N
N
N
L1
-18/65This report must not be reproduced, except in full, without written permission from SEC EMC Laboratory.
Project No. : LBE081805
LCD Monitor
MG32PS
LAN TEST _ 100M Full Duplex
Operating condition
2008-07-31
Test date
Climate condition
Ambient
temperature
Hyun Jeong Jang
Test engineer
24.1 ℃
Relative
humidity
40 %
Atmospheric
pressure
100.7 kPa
Shielded Room #1
Test place
* QP : Quasi-peak, AV: Average
* Result = Level(QP or AV) + Corr.
(LISN Insertion loss + Cable loss – Amplifier Gain)
* Margin = Limit - Level
Note
Hardware Setup: ISN T400A Cat5 - [EMI conducted]
Subrange 1
Frequency Range:
Receiver:
Transducer:
150kHz - 30MHz
ESCI 3
ISN T400A Cat5 / Receiver-2-Line-LISN ENV216
Scan Setup: EN55022_B_T400A Cat5 ISN fin [EMI conducted]
Hardware Setup:
Level Unit:
Subrange
150kHz - 30MHz
ISN T400A Cat5
dBμV
Detectors
QuasiPeak; Average
IF Bandwidth
9kHz
Meas. Time
5s
Receiver
ESCI 3
EN55022_B with T400A Cat5(100M) ISN
100
90
80
Class B_QP
70
Level in dBμV
Class B_AV
60
50
40
30
20
10
0
150k
300 400 500
800 1M
2M
3M
4M 5M 6
8 10M
20M
30M
Frequency in Hz
-19/65This report must not be reproduced, except in full, without written permission from SEC EMC Laboratory.
Project No. : LBE081805
LCD Monitor
MG32PS
Final Measurement Detector 1
Frequency
(MHz)
13.359 500
13.419 500
13.480 500
16.167 500
16.228 500
18.244 500
23.129 500
29.236 500
Quasi Peak
(dBμV)
60.6
60.8
59.9
60.1
61.3
59.1
61.4
59.9
Corr.
(dB)
9.5
9.5
9.5
9.6
9.6
9.6
9.6
9.7
Margin
(dB)
13.4
13.2
14.1
13.9
12.7
14.9
12.6
14.1
Limit
(dBμV)
74.0
74.0
74.0
74.0
74.0
74.0
74.0
74.0
Margin
(dB)
Limit
(dBμV)
64.0
64.0
64.0
64.0
64.0
64.0
64.0
64.0
Final Measurement Detector 2
Frequency
(MHz)
13.358 500
13.420 500
13.480 500
16.229 500
23.067 500
23.129 500
28.686 500
29.236 500
Average
(dBμV)
56.9
56.9
56.3
57.3
55.3
59.3
56.1
56.1
Corr.
(dB)
9.5
9.5
9.5
9.6
9.6
9.6
9.7
9.7
7.1
7.1
7.7
6.7
8.7
4.7
7.9
7.9
-20/65This report must not be reproduced, except in full, without written permission from SEC EMC Laboratory.
Project No. : LBE081805
LCD Monitor
MG32PS
4.2 Radiated disturbance
Of those disturbances above (L - 20dB), where L is the limit level in logarithmic units, record at least
the disturbance levels and the frequencies of the six highest disturbances.
The following data lists the significant emission frequencies, measured levels, correction factors (for antenna
and cables), orientation of table, polarization and height of antenna, the corrected reading, the limit, and the
amount of margin. All measurements were taken utilizing quasi-peak detection unless stated otherwise.
Measurements were performed at an antenna to EUT distance of 10 meters and elevated between 1 and 4
meters. Both vertical and horizontal antenna polarizations were measured.
Limits for radiated disturbance of ITE at a measuring distance of 10 m
Quasi-peak Limits dB dB(μV/m)
Frequency range Limits
MHz
Class A
Class B
30 to 230
40
30
230 to 1000
47
37
NOTE 1 The lower limit shall apply at the transition frequency
NOTE 2 Additional provisions may be required for cases where interference occurs.
4.2.1 Test instrumentation
Test instrumentation used in the Radiated disturbance was as follows:
Model name
Manufacturer
Serial or
Firmware
(No./Ver.)
Date
Interval
(Month)
EMI Test Receiver
ESIB-26
R&S
832692/002
2008-03-18
12
EMI Test Receiver
ESIB-26
R&S
100290
2008-03-27
12
Ant. Mast
MA4000
inn-co
-
N/A
N/A
Ant. Mast
MA4000
inn-co
-
N/A
N/A
Mast Controller
CO2000
inn-co
-
N/A
N/A
Amplifier
310N
SONOMA
251674
2008-03-13
12
Amplifier
310N
SONOMA
186465
2008-04-09
12
RF selector
NS4900
inn-co
-
N/A
N/A
RF selector
NS4900
inn-co
-
N/A
N/A
Bi-log Antenna
CBL6112D
SCHAFFNER
22248
2007-10-18
24
Bi-log Antenna
CBL6112D
SCHAFFNER
22603
2007-04-02
24
Test instrumentation
Calibration
-21/65This report must not be reproduced, except in full, without written permission from SEC EMC Laboratory.
Project No. : LBE081805
LCD Monitor
MG32PS
4.2.2 Photograph of the test Configuration
(Front)
(Rear)
-22/65This report must not be reproduced, except in full, without written permission from SEC EMC Laboratory.
Project No. : LBE081805
LCD Monitor
MG32PS
4.2.3 Test results
PC Video In(Analog) _ Ping test
Operating condition
2008-07-30
Test date
Climate condition
Hyun Jeong Jang
Test engineer
Ambient temperature
23.4 ℃
Atmospheric pressure
101.0 kPa
Relative humidity
42%
10m Semi-Anechoic Chamber #2
Test place
* Receiving antenna mode : Horizontal, Vertical
* Test distance : 10 m (RF Semi Anechoic Chamber)
* Result = Reading + c.f (Antenna factor + Cable loss- Amp Gain)
* Margin = Limit – Result
Note
SAMSUNG
R4 10m Chamber #2
<<Radiated Emission>>
Model
:
Serial
:
Operator
:
AC Power
:
Temp,Humidity:
Standard
Remark1
Remark2
Remark3
Remark4
24 July,2008 10:03
analog.dat
: CISPR Pub.22 Class B 10m
:
:
:
:
[dB(uV/m)]
60
<10m_CISPRB>
Limit
<analog>
Spectrum(H,PK)
Spectrum(V,PK)
Suspected Item(H)
Suspected Item(V)
Final Item(H,QP)
Final Item(V,QP)
50
Level
40
30
20
10
0
30
50
100
500
1000
[MHz]
Frequency
Final Result
--- Horizontal Polarization (QP)--No. Frequency Reading
c.f
Result
[MHz]
[dB(uV)] [dB(1/m)] [dB(uV/m)]
1
159.597
35.3
-19.3
16.0
2
250.012
43.8
-15.9
27.9
3
500.033
37.1
-9.0
28.1
4
633.370
37.4
-7.1
30.3
Limit
[dB(uV/m)]
30.0
37.0
37.0
37.0
Margin
[dB]
14.0
9.1
8.9
6.7
Remark
--- Vertical Polarization (QP)--No. Frequency Reading
c.f
Result
[MHz]
[dB(uV)] [dB(1/m)] [dB(uV/m)]
1
104.688
31.7
-17.3
14.4
2
169.001
38.4
-19.1
19.3
3
500.019
34.9
-8.7
26.2
4
829.566
23.3
-3.6
19.7
Limit
[dB(uV/m)]
30.0
30.0
37.0
37.0
Margin
[dB]
15.6
10.7
10.8
17.3
Remark
-23/65This report must not be reproduced, except in full, without written permission from SEC EMC Laboratory.
Project No. : LBE081805
LCD Monitor
MG32PS
DVI Input(Digital) _ Ping test
Operating condition
2008-07-30
Test date
Climate condition
Hyun Jeong Jang
Test engineer
Ambient temperature
23.4 ℃
Atmospheric pressure
101.0 kPa
Relative humidity
42%
10m Semi-Anechoic Chamber #2
Test place
* Receiving antenna mode : Horizontal, Vertical
* Test distance : 10 m (RF Semi Anechoic Chamber)
* Result = Reading + c.f (Antenna factor + Cable loss- Amp Gain)
* Margin = Limit – Result
Note
SAMSUNG
R4 10m Chamber #2
<<Radiated Emission>>
Model
:
Serial
:
Operator
:
AC Power
:
Temp,Humidity:
Standard
Remark1
Remark2
Remark3
Remark4
: CISPR Pub.22 Class B 10m
:
:
:
:
[dB(uV/m)]
60
<10m_CISPRB>
Limit
<DVI>
Spectrum(H,PK)
Spectrum(V,PK)
Suspected Item(H)
Suspected Item(V)
Final Item(H,QP)
Final Item(V,QP)
50
40
Level
24 July,2008 09:13
DVI.dat
30
20
10
0
30
50
100
500
Frequency
1000
[MHz]
Final Result
--- Horizontal Polarization (QP)--No. Frequency
Reading
c.f
Result
Limit
[MHz]
[dB(uV)] [dB(1/m)] [dB(uV/m)] [dB(uV/m)]
1
160.025
35.4
-19.3
16.1
30.0
2
500.019
37.9
-9.0
28.9
37.0
3
513.079
39.9
-9.0
30.9
37.0
4
633.356
37.3
-7.1
30.2
37.0
Margin Remark
[dB]
13.9
8.1
6.1
6.8
--- Vertical Polarization (QP)--No. Frequency
Reading
c.f
Result
Limit
[MHz]
[dB(uV)] [dB(1/m)] [dB(uV/m)] [dB(uV/m)]
1
54.470
40.2
-23.4
16.8
30.0
2
169.515
37.4
-19.1
18.3
30.0
3
198.912
34.5
-18.9
15.6
30.0
4
256.548
41.2
-15.0
26.2
37.0
Margin Remark
[dB]
13.2
11.7
14.4
10.8
-24/65This report must not be reproduced, except in full, without written permission from SEC EMC Laboratory.
Project No. : LBE081805
LCD Monitor
MG32PS
HDMI to DVI connected _ Ping test
Operating condition
2008-07-30
Test date
Climate condition
Hyun Jeong Jang
Test engineer
Ambient temperature
23.4 ℃
Atmospheric pressure
101.0 kPa
Relative humidity
42%
10m Semi-Anechoic Chamber #2
Test place
* Receiving antenna mode : Horizontal, Vertical
* Test distance : 10 m (RF Semi Anechoic Chamber)
* Result = Reading + c.f (Antenna factor + Cable loss- Amp Gain)
* Margin = Limit – Result
Note
SAMSUNG
R4 10m Chamber #2
<<Radiated Emission>>
Model
:
Serial
:
Operator
:
AC Power
:
Temp,Humidity:
Standard
Remark1
Remark2
Remark3
Remark4
: CISPR Pub.22 Class B 10m
:
:
:
:
[dB(uV/m)]
60
<10m_CISPRB>
Limit
<HDMI>
Spectrum(H,PK)
Spectrum(V,PK)
Suspected Item(H)
Suspected Item(V)
Final Item(H,QP)
Final Item(V,QP)
50
40
Level
24 July,2008 10:53
HDMI.dat
30
20
10
0
30
50
100
500
Frequency
1000
[MHz]
Final Result
--- Horizontal Polarization (QP)--No. Frequency
Reading
c.f
Result
Limit
[MHz]
[dB(uV)] [dB(1/m)] [dB(uV/m)] [dB(uV/m)]
1
250.007
45.0
-15.9
29.1
37.0
2
427.536
38.4
-10.3
28.1
37.0
3
500.033
35.2
-9.0
26.2
37.0
4
633.384
35.7
-7.1
28.6
37.0
Margin Remark
[dB]
7.9
8.9
10.8
8.4
--- Vertical Polarization (QP)--No. Frequency
Reading
c.f
Result
Limit
[MHz]
[dB(uV)] [dB(1/m)] [dB(uV/m)] [dB(uV/m)]
1
83.846
35.4
-21.6
13.8
30.0
2
170.917
36.6
-19.2
17.4
30.0
3
500.033
37.2
-8.7
28.5
37.0
4
930.961
27.2
-1.8
25.4
37.0
Margin Remark
[dB]
16.2
12.6
8.5
11.6
-25/65This report must not be reproduced, except in full, without written permission from SEC EMC Laboratory.
Project No. : LBE081805
LCD Monitor
Magic Network _ Ping test
Operating condition
2008-07-30
Test date
Climate condition
Hyun Jeong Jang
Test engineer
Ambient temperature
23.4 ℃
Atmospheric pressure
101.0 kPa
Relative humidity
42%
10m Semi-Anechoic Chamber #2
Test place
* Receiving antenna mode : Horizontal, Vertical
* Test distance : 10 m (RF Semi Anechoic Chamber)
* Result = Reading + c.f (Antenna factor + Cable loss- Amp Gain)
* Margin = Limit – Result
Note
SAMSUNG
R4 10m Chamber #2
<<Radiated Emission>>
Model
:
Serial
:
Operator
:
AC Power
:
Temp,Humidity:
Standard
Remark1
Remark2
Remark3
Remark4
24 July,2008 14:05
magicn.dat
: CISPR Pub.22 Class B 10m
:
:
:
:
[dB(uV/m)]
60
<10m_CISPRB>
Limit
<magicn>
Spectrum(H,PK)
Spectrum(V,PK)
Suspected Item(H)
Suspected Item(V)
Final Item(H,QP)
Final Item(V,QP)
50
40
Level
MG32PS
30
20
10
0
30
50
100
500
1000
[MHz]
Frequency
Final Result
--- Horizontal Polarization (QP)--No. Frequency
Reading
c.f
Result
[MHz]
[dB(uV)] [dB(1/m)] [dB(uV/m)]
1
95.998
41.2
-19.9
21.3
2
159.743
36.5
-19.3
17.2
3
250.023
46.0
-15.9
30.1
4
633.412
38.1
-7.1
31.0
5
672.017
33.7
-7.1
26.6
Limit
[dB(uV/m)]
30.0
30.0
37.0
37.0
37.0
Margin
[dB]
8.7
12.8
6.9
6.0
10.4
Remark
--- Vertical Polarization (QP)--No. Frequency
Reading
c.f
Result
[MHz]
[dB(uV)] [dB(1/m)] [dB(uV/m)]
1
169.797
38.1
-19.1
19.0
2
500.033
35.2
-8.7
26.5
3
940.682
27.8
-1.7
26.1
Limit
[dB(uV/m)]
30.0
37.0
37.0
Margin
[dB]
11.0
10.5
10.9
Remark
-26/65This report must not be reproduced, except in full, without written permission from SEC EMC Laboratory.
Project No. : LBE081805
LCD Monitor
MG32PS
4.3 Harmonics current
The EUT operated to produce the maximum harmonic components under normal operating conditions for
each successive harmonic component in turn.
The power consumption, steady state harmonic currents were measured in the tested operating mode(s).
The EUT measured in accordance with the test conditions described in Annex C (C.10).
Limits for Class D equipment
Harmonic order
Maximum permissible
harmonic current
per watt
mA/W
n
Maximum permissible
harmonic current
A
3
3.4
2.30
5
1.9
1.14
7
1.0
0.77
9
0.5
0.40
11
0.35
0.33
13 ≤ n ≤ 39
3.85/n
See Table 1
(odd harmonics only)
4.3.1 Test instrumentation
Test instrumentation used in the Harmonics current test was as follows:
Test instrumentation
Model name
Manufacturer
Serial or
Firmware
(No./Ver.)
Power Analyzer
PM6000
Voltech
100006700167
2007-10-12
12
IEC Network
555
ZIMMER
IB10/9466
N/A
N/A
Test Software
IEC1000-3
Voltech
Ver 3.13.08
N/A
N/A
Calibration
Interval
Date
(Month)
-27/65This report must not be reproduced, except in full, without written permission from SEC EMC Laboratory.
Project No. : LBE081805
LCD Monitor
MG32PS
4.3.2 Photograph of the test Configuration
-28/65This report must not be reproduced, except in full, without written permission from SEC EMC Laboratory.
Project No. : LBE081805
LCD Monitor
MG32PS
4.3.3 Test results
PC Video In(Analog) _ Ping test
Operating condition
Test date
Climate condition
Test place
2008-08-04
Hyun Jeong Jang
Test engineer
Ambient temperature
24.2 ℃
Atmospheric pressure
100.5 kPa
Relative humidity
40 %
Shielded Room #3
-29/65This report must not be reproduced, except in full, without written permission from SEC EMC Laboratory.
Project No. : LBE081805
LCD Monitor
MG32PS
-30/65This report must not be reproduced, except in full, without written permission from SEC EMC Laboratory.
Project No. : LBE081805
LCD Monitor
DVI Input (Digital)
Operating condition
Test date
Climate condition
Test place
MG32PS
2008-08-04
Hyun Jeong Jang
Test engineer
Ambient temperature
24.2 ℃
Atmospheric pressure
100.5 kPa
Relative humidity
40 %
Shielded Room #3
-31/65This report must not be reproduced, except in full, without written permission from SEC EMC Laboratory.
Project No. : LBE081805
LCD Monitor
MG32PS
-32/65This report must not be reproduced, except in full, without written permission from SEC EMC Laboratory.
Project No. : LBE081805
LCD Monitor
HDMI to DVI connected
Operating condition
Test date
Climate condition
Test place
MG32PS
2008-08-04
Hyun Jeong Jang
Test engineer
Ambient temperature
24.2 ℃
Atmospheric pressure
100.5 kPa
Relative humidity
40 %
Shielded Room #3
-33/65This report must not be reproduced, except in full, without written permission from SEC EMC Laboratory.
Project No. : LBE081805
LCD Monitor
MG32PS
-34/65This report must not be reproduced, except in full, without written permission from SEC EMC Laboratory.
Project No. : LBE081805
LCD Monitor
Magic Network _ Ping test
Operating condition
Test date
Climate condition
Test place
MG32PS
2008-08-04
Hyun Jeong Jang
Test engineer
Ambient temperature
24.2 ℃
Atmospheric pressure
100.5 kPa
Relative humidity
40 %
Shielded Room #3
-35/65This report must not be reproduced, except in full, without written permission from SEC EMC Laboratory.
Project No. : LBE081805
LCD Monitor
MG32PS
-36/65This report must not be reproduced, except in full, without written permission from SEC EMC Laboratory.
Project No. : LBE081805
LCD Monitor
MG32PS
4.4 Voltage fluctuation & Flicker
The EUT operated to produce the most unfavorable sequence of voltage changes under normal operating
conditions.
During the flicker measurement, the measure time shall include that part of whole operation cycle
in which the EUT produce the most unfavorable sequence of voltage changes.
Limits of voltage fluctuations and flicker at the supply terminals
the relative
the value of d(t) during a
short-term flicker
steady-state voltage
voltage change, d(t)
indicator, Pst
change, dc
>3.3 %
1.0
3.3 %
the maximum
relative voltage
change, dmax
500 ms
4%
4.4.1 Test instrumentation
Test instrumentation used in the Voltage fluctuation & Flicker test was as follows:
Test instrumentation
Model name
Manufacturer
Serial or
Firmware
(No./Ver.)
Date
Interval
(Month)
Power Analyzer
PM6000
Voltech
100006700167
2007-10-12
12
IEC Network
555
ZIMMER
IB10/9466
N/A
N/A
Test Software
IEC1000-3
Voltech
Ver 3.13.08
N/A
N/A
Calibration
4.4.2 Photograph of the test Configuration
Is Same the Harmonic current test photograph.
-37/65This report must not be reproduced, except in full, without written permission from SEC EMC Laboratory.
Project No. : LBE081805
LCD Monitor
MG32PS
4.4.3 Test results
PC Video In(Analog) _ Ping test
Operating condition
Test date
Climate condition
Test place
2008-08-04
Hyun Jeong Jang
Test engineer
Ambient temperature
24.2 ℃
Atmospheric pressure
100.5 kPa
Relative humidity
40 %
Shielded Room #3
-38/65This report must not be reproduced, except in full, without written permission from SEC EMC Laboratory.
Project No. : LBE081805
LCD Monitor
DVI Input (Digital) _ Ping test
Operating condition
Test date
Climate condition
Test place
MG32PS
2008-08-04
Hyun Jeong Jang
Test engineer
Ambient temperature
24.2 ℃
Atmospheric pressure
100.5 kPa
Relative humidity
40 %
Shielded Room #3
-39/65This report must not be reproduced, except in full, without written permission from SEC EMC Laboratory.
Project No. : LBE081805
LCD Monitor
HDMI to DVI connected _ Ping test
Operating condition
Test date
Climate condition
Test place
MG32PS
2008-08-04
Hyun Jeong Jang
Test engineer
Ambient temperature
24.2 ℃
Atmospheric pressure
100.5 kPa
Relative humidity
40 %
Shielded Room #3
-40/65This report must not be reproduced, except in full, without written permission from SEC EMC Laboratory.
Project No. : LBE081805
LCD Monitor
Magic Network _ Ping test
Operating condition
Test date
Climate condition
Test place
MG32PS
2008-08-04
Hyun Jeong Jang
Test engineer
Ambient temperature
24.2 ℃
Atmospheric pressure
100.5 kPa
Relative humidity
40 %
Shielded Room #3
-41/65This report must not be reproduced, except in full, without written permission from SEC EMC Laboratory.
Project No. : LBE081805
LCD Monitor
Manual Switching
Operating condition
Test date
Climate condition
Test place
MG32PS
2008-08-04
Hyun Jeong Jang
Test engineer
Ambient temperature
24.2 ℃
Atmospheric pressure
100.5 kPa
Relative humidity
40 %
Shielded Room #3
-42/65This report must not be reproduced, except in full, without written permission from SEC EMC Laboratory.
Project No. : LBE081805
LCD Monitor
MG32PS
4.5 Electrostatic discharge
Contact discharges to the conductive surfaces and coupling planes:
The EUT shall be exposed to at least 200 discharges, 100 each at negative and positive polarity, at a
minimum of four test points. One of the test points are subjected to at least 50 indirect discharges to the
center of the front edge of the horizontal coupling plane.
The remaining three test points are each receive at least 50 direct contact discharges.
If no direct contact test points are available, then at least 200 indirect discharges be applied in the indirect
mode. Test is performed at a maximum repetition rate of one discharge per second.
Air discharges at slots and apertures and insulating surfaces:
On those parts of the EUT where it is not possible to perform contact discharge testing, the equipment
should be investigated to identify user accessible points where breakdown may occur.
Such points are tested using the air discharge method. This investigation should be restricted to those area
normally handled by the user.
A minimum of 10 single air discharges shall be applied to the selected test point for each such area. The
EUT was tested with all I/O ports exercised. Test results are listed below.
The basic test procedure was in accordance with IEC 61000-4-2.
Performance criteria
Application of discharge
Test specification
(kV)
Performance criteria
Contact discharge
4
B
Air Discharge
8
B
4.5.1 Test instrumentation
Test instrumentation used in the Electrostatic discharge test was as follows:
Test instrumentation
ESD Gun
Vertical Plane
Model name
Manufacturer
Serial or
Firmware
(No./Ver.)
Date
Interval
(Month)
NSG435
SCHAFFNER
001506
2008-03-27
12
VCP-1
Thermo Keytek
-
-
-
Calibration
-43/65This report must not be reproduced, except in full, without written permission from SEC EMC Laboratory.
Project No. : LBE081805
LCD Monitor
MG32PS
4.5.2 Photograph of the test Configuration
-44/65This report must not be reproduced, except in full, without written permission from SEC EMC Laboratory.
Project No. : LBE081805
LCD Monitor
MG32PS
4.5.3 Test results
PC Video In(Analog)
Operating condition
2008-08-04
Test date
Climate condition
Ambient temperature
24.0 ℃
Atmospheric pressure
100.5 kPa
56 %
Relative humidity
Shielded Room #3
Test place
Test
Method
No
Indirect
-
Direct
Hyun Jeong, Jang
Test engineer
Applied Point
Discharge
Method
Test Level(KV)
Observation
[Note No.]
Performance
Result
HCP
Contact
±2
±4
±8
Note 1
2
A
B
C
VCP
Contact
±2
±4
±8
Note 1
2
A
B
C
1
LCD Panel
Air
±2
±4
±8
Note 1
2
A
B
C
2
Switch
Air
±2
±4
±8
Note 1
2
A
B
C
3
AC In
Air
±2
±4
±8
Note 1
2
A
B
C
4
RS232C In/Out
Contact
±2
±4
±8
Note 1
2
A
B
C
5
PC Audio In
Contact
±2
±4
±8
Note 1
2
A
B
C
6
HDMI
Contact
±2
±4
±8
Note 1
2
A
B
C
7
PC Video In
Contact
±2
±4
±8
Note 1
2
A
B
C
8
DVI Input
Contact
±2
±4
±8
Note 1
2
A
B
C
9
A/V Out
Contact
±2
±4
±8
Note 1
2
A
B
C
10
Audio In
Contact
±2
±4
±8
Note 1
2
A
B
C
11
LAN
Contact
±2
±4
±8
Note 1
2
A
B
C
12
USB Port
Contact
±2
±4
±8
Note 1
2
A
B
C
NOTE
1. There was no change compared with initial operation during the test.
2. While the electrostatic discharge tests, malfunction appeared in normal operate,
but self-recoverable after the test.
-45/65This report must not be reproduced, except in full, without written permission from SEC EMC Laboratory.
Project No. : LBE081805
LCD Monitor
MG32PS
4.5.4 Tested points
■ Air discharge points
■ Contact discharge points
■ Air/Contact discharge points
■ Front
1
■ Rear 1
5
4
2
3
6
-46/65This report must not be reproduced, except in full, without written permission from SEC EMC Laboratory.
Project No. : LBE081805
LCD Monitor
MG32PS
■ Rear 2
9
10
12
7
11
8
-47/65This report must not be reproduced, except in full, without written permission from SEC EMC Laboratory.
Project No. : LBE081805
LCD Monitor
MG32PS
4.6 Radiated, radio-frequency, electromagnetic field
The test was performed with the EUT exposed to both vertically and horizontally polarized fields. on each
of the four sides.
The dwell time at each frequency shall be not less than the time necessary for the EUT to be able
to respond. The basic test procedure was in accordance with IEC 61000-4-3.
Performance criteria
Test range
[MHz]
Test specification
Performance
criteria
Remarks
80 ~ 1000
3 V/m(unmodulated, r.m.s)
80 % AM(1 kHz)
A
The test level specified is
prior to modulation See *)
*) The frequency range is scanned as specified. However, when specified in Annex A, EN55024, an additional comprehensive functional test
shall be carried out at a limited number of frequencies.
The selected frequencies are: 80, 120, 160, 230, 434, 460, 600, 863 and 900 MHz (±1 %).
4.6.1 Test conditions
Test condition in the Radiated, radio-frequency, and electromagnetic field test was as follows:
1. Representative operating conditions
of EUT
Table-top
2. Type of the EUT
Floor-standing
3. Type of test facility
4. Position of the radiating antennas
5. Type of antennas
6. Frequency sweep rate
7. Dwell time and frequency steps
8. Applied test level
PC Video In(Analog) _ Ping test
a combination of the two
a height above the ground plane;
0.1 m
0.8 m
3m Fully anechoic chamber
a distance of 3 meters from the EUT
Log-periodic
1.5 x 10⁻³ decades/s
Dwell time : 3 s, Step size : 1 %
3 V/m
-48/65This report must not be reproduced, except in full, without written permission from SEC EMC Laboratory.
Project No. : LBE081805
LCD Monitor
MG32PS
4.6.2 Test instrumentation
Test instrumentation used in the Radiated, radio-frequency, and electromagnetic field test was
as follows:
Serial or
Calibration
Test instrumentation
Model name
Manufacturer
Firmware
date
Interval
(No./Ver.)
Mast Controller
CO2000
INNCO
N/A
Sinal Generator
SML03
R&S
102191
2007-09-07
12
Milivolt Meter
URV5
R&S
100243
2008-04-07
12
10V Insertion Unit
URV5-Z2
R&S
100240
2008-04-07
12
10V Insertion Unit
URV5-Z2
R&S
100241
2008-04-07
12
Amplifier
250W1000A
AR
312241
N/A
N/A
Amplifier
60SIG3
AR
311853
N/A
N/A
Antenna
AT1080
AR
310700
N/A
N/A
Antenna Mast
TP1000A
AR
311200
N/A
N/A
Relay Switching Unit
TS-RSP
AR
-
N/A
N/A
4.6.2 Photograph of the test Configuration
-49/65This report must not be reproduced, except in full, without written permission from SEC EMC Laboratory.
Project No. : LBE081805
LCD Monitor
MG32PS
4.6.3 Test results
2008-08-05
Test date
Climate condition
Frequency
[MHz]
Ambient temperature
21.0 ℃
Atmospheric pressure
100.5 kPa
Table
Azimuth
[degree]
0
90
80 ~ 1 000
180
270
Hyun Jeong Jang
Test engineer
Polarity
42 %
Relative humidity
Observation
Performance
Result
Horizontal
A
B
Vertical
A
B
Horizontal
A
B
A
B
A
B
Vertical
A
B
Horizontal
A
B
Vertical
A
B
Vertical
Horizontal
See Note
NOTE: There was no change compared with initial operation during the test.
-50/65This report must not be reproduced, except in full, without written permission from SEC EMC Laboratory.
Project No. : LBE081805
LCD Monitor
MG32PS
4.7 Electrical fast transient/burst
■ Test on power supply ports and on protective earth terminals
Stationary, floor-mounted equipment
The test voltage applied between a reference ground plane and each of the power supply terminals, a.c.
or d.c., and on the terminal for the protective or function earth on the cabinet of the EUT.
The EFT/B-generator shall be located on the reference plane.
The length of the “hot wire” from the coaxial output of the EFT/B-generator to the terminals on the EUT is
not exceeding 1 m. This connection was unshielded but well insulated.
All other connections of the EUT are in accordance with its functional requirements.
Non-stationary mounted EUT, connected to the mains supply by flexible cord and plugs
The test voltage is applied between each of the power supply conductors and the protective earth at the
power supply outlet to which the EUT is to be connected.
■ Test on I/O and communication ports
As far as possible, the capacitive coupling clamp is used for coupling the test voltage into the lines.
However, if the clamp cannot be used due to mechanical problems (size, cable routing) in the cabling, it
may be replaced by a tape or a conductive foil enveloping the lines under test. The capacitance of this
coupling arrangement with foil or tape is equivalent to that of the standard coupling clamp.
In other cases, it is useful to couple the EFT/B-generator to the terminals of the lines via discrete 100 pF
capacitors instead of the distributed capacitance of the clamp or of the foil or tape arrangement.
All tests carried out in shielded room.
The EUT was tested with all I/O ports exercised. Test results are listed below.
Performance criteria
Applied conditions
Test specification
Performance criteria
Open-circuit output test voltage
a.c. power ports
1 kV(Peak)
signal and telecommunication ports
0.5 kV(Peak)
d.c. power ports
0.5 kV(Peak)
Wave shape of the pulse
Repetition Frequency
B
5/50 Tr/Th ns
5 kHz
-51/65This report must not be reproduced, except in full, without written permission from SEC EMC Laboratory.
Project No. : LBE081805
LCD Monitor
MG32PS
4.7.1 Test conditions
Test condition in the Electrical fast transient/burst immunity test was as follows:
1. Representative operating conditions
PC Video In(Analog) _ Ping test
of the EUT
Stationary, floor-mounted equipment
2. the Type of the EUT
Non-stationary mounted EUT
Shielded Room #2
3. the type of test facility
4. Test level
0.5 kV
1 kV
5. Polarity of the test voltage
Positive
Negative
18 min
6. Duration of the test
Live
a.c. power ports
Neutral
Live + Neutral
Live + PE
Neutral + PE
Live + Neutral + PE
7. EUT’s ports to be tested
I/O ports
Others ports
Communication ports
d.c. power ports
4.7.2 Test instrumentation
Test instrumentation used in the Electrical fast transient/burst test was as follows:
Serial or
Test instrumentation
Model name
Manufacturer
Firmware
(No./Ver.)
Calibration
Interval
Date
(Month)
EFT/Burst Generator
NSG 2025
SCHAFFNER
19873
2007-09-06
CDN
CDN 8015
SCHAFFNER
19073
N/A
12
N/A
-52/65This report must not be reproduced, except in full, without written permission from SEC EMC Laboratory.
Project No. : LBE081805
LCD Monitor
MG32PS
4.7.3 Photograph of the test Configuration
-53/65This report must not be reproduced, except in full, without written permission from SEC EMC Laboratory.
Project No. : LBE081805
LCD Monitor
MG32PS
4.7.4 Test results
2008-08-04
Test date
Climate condition
Ambient temperature
25.0 ℃
Atmospheric pressure
100.7 kPa
Relative humidity
48 %
Polarity
Test
Level
(kV)
Tr/Th [ns]
Live
+/-
1
5/50ns, 5kHz
Note 1
2
A
B
Neutral
+/-
1
5/50ns, 5kHz
Note 1
2
A
B
PE (Ground)
+/-
1
5/50ns, 5kHz
Note 1
2
A
B
Live + PE
+/-
1
5/50ns, 5kHz
Note 1
2
A
B
Neutral + PE
+/-
1
5/50ns, 5kHz
Note 1
2
A
B
Live + Neutral
+/-
1
5/50ns, 5kHz
Note 1
2
A
B
Live + Neutral +
PE
+/-
1
5/50ns, 5kHz
Note 1
2
A
B
+/-
0.5
5/50ns, 5kHz
Note 1
2
A
B
Test Point
a.c.
power
ports
Hyun Jeong Jang
Test engineer
LAN Ports
Observation
[Note No.]
Performance
Result
NOTE
1. There was no change compared with initial operation during the test.
2. The transmission of data was stopped during the test, but self-recoverable after the test.
-54/65This report must not be reproduced, except in full, without written permission from SEC EMC Laboratory.
Project No. : LBE081805
LCD Monitor
MG32PS
4.8 Surge
The basic test procedure was in accordance with IEC 61000-4-5.
Performance criteria
Applied conditions
Performance
criteria
Test specification
Combination wave
a.c. power ports
Line to Line 1 kV(Peak)
1
○
1
Line to earth 2 kV(Peak) ○
signal and telecommunication ports
d.c. power ports
B
2
Line to ground 1 kV(Peak) ○
3
0.5 kV(Peak) ○
Waveform parameter
Open-circuit voltage
1.2/50 Tr/Th μs
Short-circuit current
8/20 Tr/Th μs
1 Applicable only to ports which according to the manufacturer’s specification may connect directly to
○
outdoor cables. Where normal functioning cannot be achieved because of the impact of the CDN on
the EUT, no test shall be required.
2 When the manufacturer specifies protection measures and it is impractical to simulate these
○
measures during the tests, then the applied test levels shall be reduced to 0,5 kV and 1 kV.
3 Applicable only to ports which according to the manufacturer’s specification may connect directly to
○
outdoor cables.
4.8.1 Test instrumentation
Test instrumentation used in the Surge test was as follows:
Test instrumentation
Model name
Manufacturer
Serial or
Firmware
(No./Ver.)
Calibration
Interval
Date
(Month)
Surge Tester
PSURGE
8000
HAEFELY
152602
2008-01-30
12
Surge Impulse Module
PIM 100
HAEFELY
152288
2008-01-23
12
Coupling Decoupling
Network
PCD 120
HAEFELY
148918
2008-01-23
12
Coupling Decoupling
Network
FP-SURGE
100M
HAEFELY
152636
2008-01-23
12
Impulse Module
PIM 120
HAEFELY
150663
2008-01-30
12
-55/65This report must not be reproduced, except in full, without written permission from SEC EMC Laboratory.
Project No. : LBE081805
LCD Monitor
MG32PS
4.8.2 Test conditions
Test condition in the Surge immunity test was as follows:
1. Representative operating conditions
PC Video In(Analog) _ Ping test
of the EUT
EUT power supply
unshielded asymmetrically operated interconnection lines
2. Type of
LINE
unshielded symmetrically operated interconnection / telecommunication lines
shielded lines
potential differences
Shielded Room #3
3. the type of test facility
4. Test level
0.5 kV
1 kV
5. Polarity of the surge
Positive
Negative
2 kV
40
6. Number of test(at selected points)
60 sec
7. Repetition rate
a.c. power ports
8. EUT’s ports to be tested
Live + Neutral
Live + PE
Neutral + PE
I/O ports
others ports
Communication ports
d.c. power ports
-56/65This report must not be reproduced, except in full, without written permission from SEC EMC Laboratory.
Project No. : LBE081805
LCD Monitor
MG32PS
4.8.3 Photograph of the test Configuration
-57/65This report must not be reproduced, except in full, without written permission from SEC EMC Laboratory.
Project No. : LBE081805
LCD Monitor
MG32PS
4.8.4 Test results
2008-08-02
Test date
Climate condition
Ambient temperature
24.0 ℃
Atmospheric pressure
100.1 kPa
Relative humidity
56 %
Polarity
Test
Level
(kV)
Phase wave
Shape
[μs]
Live + PE
+/-
2
1.2/50(8/20)
Note 1
2
A
B
Neutral + PE
+/-
2
1.2/50(8/20)
Note 1
2
A
B
Live + Neutral
+/-
1
1.2/50(8/20)
Note 1
2
A
B
+/-
1
1.2/50(8/20)
Note 1
2
A
B
+/-
1
1.2/50(8/20)
Note 1
2
A
B
+/-
1
1.2/50(8/20)
Note 1
2
A
B
+/-
0.5
1.2/50(8/20)
Note 1
2
A
B
Test Point
a.c. power
ports
Hyun Jeong Jang
Test engineer
I/O Ports
LAN Ports
Modem Ports
d.c. power ports
Line to
Earth
Observation
[Note No.]
Performance
Result
NOTE
1. There was no change compared with initial operation during the test.
2. The transmission of data was stopped during the test, but self-recoverable after the test.
-58/65This report must not be reproduced, except in full, without written permission from SEC EMC Laboratory.
Project No. : LBE081805
LCD Monitor
MG32PS
4.9 Conducted disturbances, induced by radio-frequency fields
The test was performed with the test generator connected to each of the coupling and decoupling devices in
turn, while the other non-excited RF input ports of the coupling devices are terminated by a 50-ohm load
resistor.
Attempts should be made to fully exercise the EUT during testing, and to fully interrogate all exercise modes
selected for susceptibility. Test results are listed below.
The basic test procedure was in accordance with IEC 61000-4-6.
Performance criteria
Test range
[MHz]
Test specification
Performance
criteria
Remarks
0.15 ~ 80
3 V(unmodulated, r.m.s)
80 % AM(1 kHz)
A
See 1), 2)
1)
The frequency range is scanned as specified. However, when specified in Annex A, an additional comprehensive functional test
shall be carried out at a limited number of frequencies. The selected frequencies for conducted tests are: 0,2; 1; 7,1; 13,56; 21;
27,12 and 40,68 MHz (±1 %).
2) Applicable only to cables which according to the manufacturer’s specification supports communication on cable
lengths greater than 3m.
4.9.1 Test conditions
Test condition in the Radiated, radio-frequency, and electromagnetic field test was as follows:
1. Representative operating conditions of EUT
2. Type of EUT’ unit
Single
3. Type of test facility used
4. Frequency range of application the test
5. Frequency sweep rate
6. Dwell time and frequency steps
7. Applied test level
PC Video In(Analog) _ Ping test
Multiple
Shielded Room #2
0.15 ~ 80 MHz
1.5 x 10⁻³ decades/s
Dwell time : 3 s, Step size : 1 %
3V
-59/65This report must not be reproduced, except in full, without written permission from SEC EMC Laboratory.
Project No. : LBE081805
LCD Monitor
MG32PS
4.9.2 Test instrumentation
Test instrumentation used in the Conducted disturbances, induced by radio-frequency fields
test was as follows:
Serial or
Calibration
Test instrumentation
Model name
Manufacturer
Firmware
Interval
date
(No./Ver.)
(Month)
RF - Generator
NSG2070
Schaffner
1118
2008-06-16
12
Attenuator
INA2070-1
Schaffner
2118
2008-03-06
12
Test Software
Win 2070
Schaffner
V01.05
N/A
N/A
Coupling Decoupling
Network
CDN M016
Schaffner
21246
2008-04-21
12
4.9.4 Photograph of the test Configuration
-60/65This report must not be reproduced, except in full, without written permission from SEC EMC Laboratory.
Project No. : LBE081805
LCD Monitor
MG32PS
4.9.5 Test results
2008-08-02
Test date
Climate condition
Frequency
(MHz)
0.15 ~ 80
Hyun Jeong Jang
Test engineer
Ambient temperature
23.7 ℃
Atmospheric pressure
100.3 kPa
Relative humidity
51 %
Field
Strength
(Vr.m.s.)
Injection
Method
Inject Points
(Cable length)
3
CDN-M3
AC power line(1.8m)
Note 1
2
A
B
3
CDN-T4
LAN (10m)
Note 1
2
A
B
3
CDN-T2
Telephone (10m)
Note 1
2
A
B
3
CLAMP
DC (1.8m)
Note 1
2
A
B
3
CLAMP
Printer (2m)
Note 1
2
A
B
3
CLAMP
VGA (1.8m)
Note 1
2
A
B
Observation
[Note No.]
Performance
Result
NOTE
1. There was no change compared with initial operation during the test.
2. The transmission of data from modem port stopped during the test, but self-recoverable after the
test. This permissive loss of performance is specified by the manufacturer, and this phenomenon
will be put as a clear statement in the User’s Manual to avoid misunderstanding.
-61/65This report must not be reproduced, except in full, without written permission from SEC EMC Laboratory.
Project No. : LBE081805
LCD Monitor
MG32PS
4.10 Voltage dips, short interruptions and voltage variations
The EUT is tested for each selected combination of test levels and duration with a sequence of tree
dips/interruptions with intervals of 10 s minimum (between each test event).
Each representative mode of operation shall be tested. Abrupt changes in supply voltage shall occur at zero
crossings of the voltage waveform. The basic test procedure was in accordance with IEC 61000-4-11.
Performance criteria
Environmental
phenomenon
Voltage dips
Voltage interruptions
Test
specification
Units
>95
0,5
30
25
Performance
criteria
Remarks
B
% reduction periods
>95
250
C
See NOTE
C
[NOTE] Changes to occur at 0 degree crossover point of the voltage waveform.
4.10.1 Test instrumentation
Test instrumentation used in the Voltage dips, short interruptions and voltage variations test was as follows:
Serial or
Calibration
Test
Model name
Manufacturer
Firmware
Interval
instrumentation
date
(No./Ver.)
(Month)
PFS503/63A
PFS 503
EM TEST
2007-06-16
12
-0513100236
Voltage Dip &
Interruption
PLINE 1610
HAEFELY
083690-21
2008-05-13
12
-62/65This report must not be reproduced, except in full, without written permission from SEC EMC Laboratory.
Project No. : LBE081805
LCD Monitor
MG32PS
4.10.2 Photograph of the test Configuration
-63/65This report must not be reproduced, except in full, without written permission from SEC EMC Laboratory.
Project No. : LBE081805
LCD Monitor
MG32PS
4.10.3 Test results
PC Video In(Analog) _ Ping test
Operating condition
2008-08-02
Test date
Climate condition
Hyun Jeong Jang
Test engineer
Ambient temperature
25.0℃
Atmospheric pressure
100.7kPa
48%
Relative humidity
Test Voltage
Period
Number
of
Applications
Angle
[Degrees]
>95 % UT
0.5
10
0, 180
Note 1
2
A
B
C
30 % UT
25
10
0
Note 1
2
A
B
C
>95 % UT
250
10
0
Note 1
2
A
B
C
Observation
[Note No.]
Performance
Result
NOTE
1. There was no change compared with initial operation during the test.
2. While The Voltage Dip & Interruption tests, malfunction appeared in normal operate, but
self-recoverable after the test.
-64/65This report must not be reproduced, except in full, without written permission from SEC EMC Laboratory.
Project No. : LBE081805
LCD Monitor
MG32PS
Appendix – EUT photography
Front View
Rear View
-65/65This report must not be reproduced, except in full, without written permission from SEC EMC Laboratory.