1
User’s Manual
CubeSuite Ver.1.40
Integrated Development Environment
User’s Manual: Analysis
Target Device
78K0 Microcontroller
78K0R Microcontroller
V850 Microcontroller
All information contained in these materials, including products and product specifications,
represents information on the product at the time of publication and is subject to change by
Renesas Electronics Corp. without notice. Please review the latest information published by
Renesas Electronics Corp. through various means, including the Renesas Electronics Corp.
website (http://www.renesas.com).
www.renesas.com
Rev.1.00
Sep 2010
Notice
1.
2.
3.
4.
5.
6.
7.
All information included in this document is current as of the date this document is issued. Such information, however, is
subject to change without any prior notice. Before purchasing or using any Renesas Electronics products listed herein, please
confirm the latest product information with a Renesas Electronics sales office. Also, please pay regular and careful attention to
additional and different information to be disclosed by Renesas Electronics such as that disclosed through our website.
Renesas Electronics does not assume any liability for infringement of patents, copyrights, or other intellectual property rights
of third parties by or arising from the use of Renesas Electronics products or technical information described in this document.
No license, express, implied or otherwise, is granted hereby under any patents, copyrights or other intellectual property rights
of Renesas Electronics or others.
You should not alter, modify, copy, or otherwise misappropriate any Renesas Electronics product, whether in whole or in part.
Descriptions of circuits, software and other related information in this document are provided only to illustrate the operation of
semiconductor products and application examples. You are fully responsible for the incorporation of these circuits, software,
and information in the design of your equipment. Renesas Electronics assumes no responsibility for any losses incurred by
you or third parties arising from the use of these circuits, software, or information.
When exporting the products or technology described in this document, you should comply with the applicable export control
laws and regulations and follow the procedures required by such laws and regulations. You should not use Renesas
Electronics products or the technology described in this document for any purpose relating to military applications or use by
the military, including but not limited to the development of weapons of mass destruction. Renesas Electronics products and
technology may not be used for or incorporated into any products or systems whose manufacture, use, or sale is prohibited
under any applicable domestic or foreign laws or regulations.
Renesas Electronics has used reasonable care in preparing the information included in this document, but Renesas Electronics
does not warrant that such information is error free. Renesas Electronics assumes no liability whatsoever for any damages
incurred by you resulting from errors in or omissions from the information included herein.
Renesas Electronics products are classified according to the following three quality grades: “Standard”, “High Quality”, and
“Specific”. The recommended applications for each Renesas Electronics product depends on the product’s quality grade, as
indicated below. You must check the quality grade of each Renesas Electronics product before using it in a particular
application. You may not use any Renesas Electronics product for any application categorized as “Specific” without the prior
written consent of Renesas Electronics. Further, you may not use any Renesas Electronics product for any application for
which it is not intended without the prior written consent of Renesas Electronics. Renesas Electronics shall not be in any way
liable for any damages or losses incurred by you or third parties arising from the use of any Renesas Electronics product for an
application categorized as “Specific” or for which the product is not intended where you have failed to obtain the prior written
consent of Renesas Electronics. The quality grade of each Renesas Electronics product is “Standard” unless otherwise
expressly specified in a Renesas Electronics data sheets or data books, etc.
“Standard”:
8.
9.
10.
11.
12.
Computers; office equipment; communications equipment; test and measurement equipment; audio and visual
equipment; home electronic appliances; machine tools; personal electronic equipment; and industrial robots.
“High Quality”: Transportation equipment (automobiles, trains, ships, etc.); traffic control systems; anti-disaster systems; anticrime systems; safety equipment; and medical equipment not specifically designed for life support.
“Specific”:
Aircraft; aerospace equipment; submersible repeaters; nuclear reactor control systems; medical equipment or
systems for life support (e.g. artificial life support devices or systems), surgical implantations, or healthcare
intervention (e.g. excision, etc.), and any other applications or purposes that pose a direct threat to human life.
You should use the Renesas Electronics products described in this document within the range specified by Renesas Electronics,
especially with respect to the maximum rating, operating supply voltage range, movement power voltage range, heat radiation
characteristics, installation and other product characteristics. Renesas Electronics shall have no liability for malfunctions or
damages arising out of the use of Renesas Electronics products beyond such specified ranges.
Although Renesas Electronics endeavors to improve the quality and reliability of its products, semiconductor products have
specific characteristics such as the occurrence of failure at a certain rate and malfunctions under certain use conditions. Further,
Renesas Electronics products are not subject to radiation resistance design. Please be sure to implement safety measures to
guard them against the possibility of physical injury, and injury or damage caused by fire in the event of the failure of a
Renesas Electronics product, such as safety design for hardware and software including but not limited to redundancy, fire
control and malfunction prevention, appropriate treatment for aging degradation or any other appropriate measures. Because
the evaluation of microcomputer software alone is very difficult, please evaluate the safety of the final products or system
manufactured by you.
Please contact a Renesas Electronics sales office for details as to environmental matters such as the environmental
compatibility of each Renesas Electronics product. Please use Renesas Electronics products in compliance with all applicable
laws and regulations that regulate the inclusion or use of controlled substances, including without limitation, the EU RoHS
Directive. Renesas Electronics assumes no liability for damages or losses occurring as a result of your noncompliance with
applicable laws and regulations.
This document may not be reproduced or duplicated, in any form, in whole or in part, without prior written consent of Renesas
Electronics.
Please contact a Renesas Electronics sales office if you have any questions regarding the information contained in this
document or Renesas Electronics products, or if you have any other inquiries.
(Note 1) “Renesas Electronics” as used in this document means Renesas Electronics Corporation and also includes its majorityowned subsidiaries.
(Note 2) “Renesas Electronics product(s)” means any product developed or manufactured by or for Renesas Electronics.
How to Use This Manual
This manual describes the role of the CubeSuite integrated development environment for developing applications
and systems for 78K0 microcontrollers, 78K0R microcontrollers and V850 microcontrollers, and provides an outline
of its features.
CubeSuite is an integrated development environment (IDE) for 78K0 microcontrollers, 78K0R microcontrollers and
V850 microcontrollers, integrating the necessary tools for the development phase of software (e.g. design,
implementation, and debugging) into a single platform.
By providing an integrated environment, it is possible to perform all development using just this product, without
the need to use many different tools separately.
Readers
This manual is intended for users who wish to understand the functions of the
CubeSuite and design software and hardware application systems.
Purpose
This manual is intended to give users an understanding of the functions of the
Cubesuite to use for reference in developing the hardware or software of systems using
these devices.
Organization
This manual can be broadly divided into the following units.
CHAPTER 1 GENERAL
CHAPTER 2 FUNCTIONS
APPENDIX A WINDOW REFERENCE
APPENDIX B INDEX
How to Read This Manual It is assumed that the readers of this manual have general knowledge of electricity, logic
circuits, and microcontrollers.
Conventions
Data significance:
Higher digits on the left and lower digits on the right
–––
Active low representation: XXX (overscore over pin or signal name)
Note:
Footnote for item marked with Note in the text
Caution:
Information requiring particular attention
Remark:
Supplementary information
Numeric representation:
Decimal … XXXX
Hexadecimal … 0xXXXX
Related Documents
The related documents indicated in this publication may include preliminary versions.
However, preliminary versions are not marked as such.
Document Name
Document No.
CubeSuite
Start
Integrated Development Environment
Analysis
This manual
User's Manual
Programming
R20UT0266E
Caution
R20UT0256E
Message
R20UT0267E
Coding for CX compiler
R20UT0259E
Build for CX compiler
R20UT0261E
78K0 Coding
R20UT0004E
78K0 Build
R20UT0005E
78K0 Debug
R20UT0262E
78K0 Design
R20UT0006E
78K0R Coding
U19382E
78K0R Build
U19385E
78K0R Debug
R20UT0263E
78K0R Design
R20UT0007E
V850 Coding
U19383E
V850 Build
U19386E
V850 Debug
R20UT0264E
V850 Design
R20UT0257E
The related documents listed above are subject to change without
notice. Be sure to use the latest edition of each document when
designing.
All trademarks or registered trademarks in this document are the property of their respective
owners.
[MEMO]
[MEMO]
[MEMO]
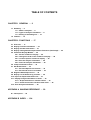
TABLE OF CONTENTS
CHAPTER 1 GENERAL ... 9
1.1 Summary ... 9
1.1.1 What is analyzed ... 9
1.1.2 Types of analysis information ... 9
1.1.3 Setting of the debug tool ... 10
1.2 Features ... 14
CHAPTER 2 FUNCTIONS ... 17
2.1
2.2
2.3
2.4
2.5
Overview ... 17
Display Function Information ... 20
Display Variable Information ... 21
Display Calling Relationships between Functions (Call Graph) ... 22
Customize Display Method ... 26
2.5.1 Set the columns to display ... 26
2.5.2 Change the order of the columns to display ... 28
2.5.3 Lock the specific column to display ... 29
2.5.4 Sort the analysis information ... 29
2.5.5 Filter the analysis information ... 29
2.6 Jump to Defined Location ... 33
2.7 Set Break Events ... 33
2.7.1 Set a breakpoint to a function ... 33
2.7.2 Set a break event to a variable ... 34
2.8 Register Watch-Expressions ... 35
2.9 Display List of Referencing Location ... 36
2.10 Import or Export Information File ... 37
2.11 Display Analysis Information in Chart ... 40
2.11.1 Graph transitions in variable values ... 40
2.11.2 Chart the function execution time ratios ... 46
2.12 Save Analysis Information ... 48
APPENDIX A WINDOW REFERENCE ... 50
A.1 Description ... 50
APPENDIX B INDEX ... 124
CubeSuite Ver.1.40
CHAPTER 1 GENERAL
CHAPTER 1 GENERAL
This chapter gives an overview of the analyze tool (Program Analyzer).
1.1
Summary
The analyze tool is a component provided by CubeSuite. It supports the analysis of the behavior of programs developed for the 78K0 microcontroller, 78K0R microcontroller and V850 microcontroller.
1.1.1
What is analyzed
The analyze tool only analyzes C source files (including header files) in a project being set to the active project in the
Project Tree panel.
Consequently, assembler source files are not analyzed. Note, however, that symbols defined in assembler source files
that are referenced from C source files are analyzed.
Cautions 1.
2.
The analyze tool cannot be used in the debug-dedicated project (see "CubeSuite Start").
[CA850]
Files in K&R format are not analyzed.
Remark
It is possible to forcibly display the function/variable information for C source files and header files in a
project other than the active project by importing information files (Function list file (*.csfl)/Variable list file
(*.csvl)) (see "2.10 Import or Export Information File" for details).
1.1.2
Types of analysis information
The analyze tool acquires, analyzes, and displays the following two types of information.
(1) Static analysis information
This is the function information/variable information that can be displayed when a build has completed without any
compiler or assembler errors.
This is the result of acquiring and analyzing the load module and cross reference information generated by the
build tool.
Caution
[CX]
When "-Xno_cube_suite_inf" option is specified, the cross reference information is not generated. Accordingly, no analysis information is displayed on the panels provided by this tool
(exclude the [Variable Value Changing Chart] tab of the Analysis Chart panel).
Remark
[CA78K0][CA78K0R][CA850]
In order to acquire static analysis information, you must configure your build tool to generate cross reference information when performing the build.
The analyze tool does, however, provide a property to force the build tool to generate cross reference
information (the [Compulsorily output cross reference file] property in the [General] category on the
[Settings] tab of the Property panel).
This property is enabled by default ([Yes]), so as long as you do not change this setting, it is possible to
generate cross reference information regardless of the build tool's configuration (note that if this property is changed to [No], the setting in the build tool will take precedence).
R20UT0265EJ0100 Rev.1.00
Sep 01, 2010
Page 9 of 129
CubeSuite Ver.1.40
CHAPTER 1 GENERAL
(2) Dynamic analysis information
This is the function information/variable information that can be displayed when program execution is stopped.
This is the result of acquiring and analyzing the trace, coverage results, or real-time RAM monitoring acquired from
the debug tool via program execution.
Consequently, the debug tool's trace functions, coverage functions, or RRM functions must be enabled (see "1.1.3
Setting of the debug tool") in order to acquire dynamic analysis information.
Note that the debug tool’s function required in order to acquire the information differs depending on an item of
dynamic analysis information. Furthermore, items of dynamic analysis information that can be acquired differ
depending on the debug tool used because functions supported differ depending on the debug tool. See the section explaining the corresponding panel for details on the relationship between the item and the debug tool’s function required.
Caution
When the analysis tool for "RX series" (i.e. "AZ series (AZ78K0R/AZ850/AZ850V4)", etc.) is used,
the dynamic analysis information cannot be acquired.
1.1.3
Setting of the debug tool
The debug tool settings necessary for the analyze tool to acquire Dynamic analysis information are as follows.
You can make the setting on the [Debug Tool Settings] tab of the debug tool to use.
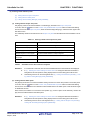
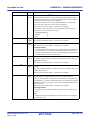
(1) Trace function
(2) Coverage function
(3) RRM function
(1) Trace function
Debug Tool
IECUBE
78K0
Setting of [Debug tool] Tab in Property Panel of Debug Tool
None (always enabled)Note 1
78K0R
V850E1
[Function information] (Function List panel/Call Graph panel)
V850ES
The following setting is only necessary if [Trace] is specified for the [Use for trace data]
property in the [Trace] categoryNote 2.
[Trace] category
[Select trace data] property >> Specify one of the following
- [Branch PC]
- [All PC]
- [Branch PC + Access Data]
- [All PC + Access Data]
- [Branch PC + Access PC + Access Data]
[Variable information] (Variable List panel/Analysis Chart panel (Trace data analysis))
[Trace] category
[Use for trace data] property >> [Trace]
[Select trace data] property >> Specify one of the following
- [Access Data]
- [Branch PC + Access Data]
- [All PC + Access Data]
- [Access PC + Access Data]
- [Branch PC + Access PC + Access Data]
R20UT0265EJ0100 Rev.1.00
Sep 01, 2010
Page 10 of 129
CubeSuite Ver.1.40
CHAPTER 1 GENERAL
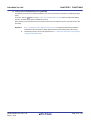
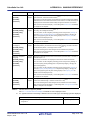
Debug Tool
IECUBE2
Setting of [Debug tool] Tab in Property Panel of Debug Tool
V850E2M
[Function information] (Function List panel/Call Graph panel)
Single-core
The following setting is only necessary if [Trace] is specified for the [Use for trace data]
property in the [Trace] categoryNote 3.
[Trace] category
[Select trace data] property >> Specify one of the following
- [Branch PC]
- [Branch PC + Access Data]
- [Branch PC + Access PC + Access Data]
[Variable information] (Variable List panel/Analysis Chart panel (Trace data analysis))
[Trace] category
[Use for trace data] property >> [Trace]
[Select trace data] property >> Specify one of the following
- [Branch PC + Access Data]
- [Branch PC + Access PC + Access Data]
V850E2M
Not supported
Multi-core
MINICUBE
Not supported
MINICUBE2
Not supported
E1
Not supported
Simulator
78K0
[Trace] category
78K0R
[Use trace function] property >> [Yes]
V850
Notes 1.
[IECUBE [78K0]]
Execution time of functions and graphs via the Trace data analysis cannot be displayed because the
trace time tag function is not supported.
2.
[IECUBE [V850]]
Some of the trace functions, RRM functions and coverage functions are mutually exclusive. For this
reason, it is necessary to specify the function to take precedence in the [Use for trace data] property of
the [Trace] category. When doing so, if this property is set to other than [Trace] ([RRM] or [Coverage]),
the trace functions necessary to acquire dynamic analysis information will still be enabled.
3.
[IECUBE2]
Some of the trace functions, timer functions and coverage functions are mutually exclusive. For this
reason, it is necessary to specify the function to take precedence in the [Use for trace data] property of
the [Trace] category. When doing so, if this property is set to other than [Trace] ([Timer] or [Coverage]),
the trace functions necessary to acquire dynamic analysis information will still be enabled.
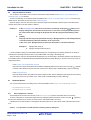
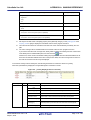
(2) Coverage function
Debug Tool
IECUBE
78K0
Setting of [Debug tool] Tab in Property Panel of Debug Tool
None (always enabled)
78K0R
V850E1
V850ES
[Trace] category
[Use for trace data] property >> [Coverage]
Note that only the code coverage (Function List panel) is supported. The coverage function
cannot be enabled when the coverage board is not mounted on IECUBE used.
R20UT0265EJ0100 Rev.1.00
Sep 01, 2010
Page 11 of 129
CubeSuite Ver.1.40
CHAPTER 1 GENERAL
Debug Tool
IECUBE2
V850E2M
Single-core
Setting of [Debug tool] Tab in Property Panel of Debug Tool
[Trace] category
[Use for trace data] property >> [Coverage]
Note that only the code coverage (Function List panel) is supported.
V850E2M
Not supported
Multi-core
MINICUBE
Not supported
MINICUBE2
Not supported
E1
Not supported
Simulator
78K0
78K0R
[Coverage] category
[Use coverage function] property >> [Yes]
V850
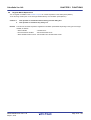
(3) RRM function
Debug Tool
IECUBE
78K0
78K0R
Setting of [Debug tool] Tab in Property Panel of Debug Tool
[Access Memory While Running] category
[Access by stopping execution] property >> [Yes]
[Update display during the execution] property >> [Yes]
[Display update interval[ms]] property >> Valid number
V850E1
V850ES
[Trace] category
[Use for trace data] property >> [RRM]
[Access Memory While Running] category
[Access by stopping execution] property >> [Yes]
[Update display during the execution] property >> [Yes]
[Display update interval[ms]] property >> Valid number
[Set update display during the execution automatically] property >> [Yes]
IECUBE2
V850E2M
Single-core
[Access Memory While Running] category
[Access by stopping execution] property >> [Yes]
[Update display during the execution] property >> [Yes]
[Display update interval[ms]] property >> Valid number
V850E2M
Not supported
Multi-core
MINICUBE
V850
[Access Memory While Running] category
[Access by stopping execution] property >> [Yes]
[Update display during the execution] property >> [Yes]
[Display update interval[ms]] property >> Valid number
MINICUBE2
78K0
[Access Memory While Running] category
[Access by stopping execution] property >> [Yes]
[Update display during the execution] property >> [Yes]
[Display update interval[ms]] property >> Valid number
[Set update display during the execution automatically] property >> [Yes]
78K0R
V850
[Access Memory While Running] category
[Access by stopping execution] property >> [Yes]
[Update display during the execution] property >> [Yes]
[Display update interval[ms]] property >> Valid number
R20UT0265EJ0100 Rev.1.00
Sep 01, 2010
Page 12 of 129
CubeSuite Ver.1.40
Debug Tool
E1
CHAPTER 1 GENERAL
Setting of [Debug tool] Tab in Property Panel of Debug Tool
[Access Memory While Running] category
[Access by stopping execution] property >> [Yes]
[Update display during the execution] property >> [Yes]
[Display update interval[ms]] property >> Valid number
Simulator
78K0
[Access Memory While Running] category
78K0R
[Update display during the execution] property >> [Yes]
V850
[Display update interval[ms]] property >> Valid number
R20UT0265EJ0100 Rev.1.00
Sep 01, 2010
Page 13 of 129
CubeSuite Ver.1.40
1.2
CHAPTER 1 GENERAL
Features
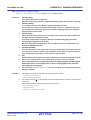
The features of the analyze tool are shown below.
- Displaying function information
The following information about functions is displayed:
Static analysis information (e.g. function name, file name, attribute, return type, etc.) and Dynamic analysis information (e.g. reference count, execution count, execution time, code coverage, etc.).
- Displaying variable information
The following information about variables is displayed:
Static analysis information (e.g. variable name, file name, attribute, type, etc.) and Dynamic analysis information
(e.g. read count, write count, data coverage, etc.).
R20UT0265EJ0100 Rev.1.00
Sep 01, 2010
Page 14 of 129
CubeSuite Ver.1.40
CHAPTER 1 GENERAL
- Displaying the call graph
A tree-structured chart (call graph) indicating calling relationships between functions in the program is displayed.
- Linked operation with debug tool
The following operations can be performed on the debug tool from the various panels of the analyze tool (Function
List panel/Variable List panel).
- Jump to the location in the source text where the specified function or variable is defined
- Set a break event at the specified function or variable
- Register a watch expression for the specified variable
- View list of locations referencing function/variable
You can find and display a list of locations referencing a function/variable.
R20UT0265EJ0100 Rev.1.00
Sep 01, 2010
Page 15 of 129
CubeSuite Ver.1.40
CHAPTER 1 GENERAL
- Graph analysis information
- A line chart indicating changes in variable values is displayed.
- A pie chart indicating function execution time ratios is displayed.
R20UT0265EJ0100 Rev.1.00
Sep 01, 2010
Page 16 of 129
CubeSuite Ver.1.40
CHAPTER 2 FUNCTIONS
CHAPTER 2 FUNCTIONS
This chapter describes the main features and operating procedures of the analyze tool.
2.1
Overview
The analysis information acquired by the analyze tool is displayed on the following panels:
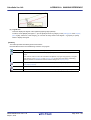
Table 2-1. Panels Displaying Analysis Information
Panel
Description
Function List panel
Displays the function information.
Variable List panel
Displays the variable information.
Call Graph panel
Displays calling relationships between functions (call graph).
Analysis Chart panel
Displays charts of the function information and the variable information.
[Variable Value Changing Chart] tab
Displays changes in variable values (line chart).
[Execution Time(Percentage) Chart] tab
Displays function execution time ratios (pie chart)
By validating this analysis information, it is possible to search for unused functions and variables, and processing that
is creating bottlenecks, allocate memory effectively to reduce code size, and the like.
The basic operation sequence of the analyze tool is as follows:
(1) Start CubeSuite
Launch CubeSuite from the [Start] menu of Windows®.
Remark
For details on "Start CubeSuite", see "CubeSuite Start".
(2) Set a project
Create a new project, or load an existing one.
Remark
For details on "Set a project", see "CubeSuite Start".
(3) Create a load module
Create a load module by running a build after setting of the active project and the build tool to be used.
Remarks 1.
2.
For details on "Create a load module", see "CubeSuite Build" of the compiler to use.
If the build completes without compiler or assembler errors, then at this point the Static analysis
information can be displayed in the Function List panel/Variable List panel/Call Graph panel.
(4) Execute downloading
Download the load module created in steps (3) to the debug tool after configuring the operational environment of
the debug tool.
Remark
For details on "Execute downloading", see "CubeSuite Debug" of the microcontroller to use.
R20UT0265EJ0100 Rev.1.00
Sep 01, 2010
Page 17 of 129
CubeSuite Ver.1.40
CHAPTER 2 FUNCTIONS
(5) Execute programs
Execute the program on the debug tool.
Remarks 1.
2.
For details on "Execute programs", see "CubeSuite Debug" of the microcontroller to use.
When program execution is stopped, Dynamic analysis information can be displayed on the various panels. Note that it is necessary to enable the various functions of the debug tool (see "1.1.3
Setting of the debug tool") in order to acquire the Dynamic analysis information.
(6) Display Function Information
Display the Function List panel in order to validate the acquired function information.
The Function List panel can be operated as follows, in accordance with the purpose.
Note that if the program is modified during debugging, the operation is repeated via (3), above.
(a) Customize Display Method
Change the display method (e.g. set which columns to display and the sorting order) on the panels.
(b) Jump to Defined Location
Jump to the location of source text where the function on the panel has been defined.
(c) Set a breakpoint to a function
Set a breakpoint to the function on the panel.
(d) Display List of Referencing Location
Find and display a list of locations referencing the function on the panel.
Remark
It is also possible to display the function information defined in other than the active project.
For detailed instructions on displaying function information, see "2.10 Import or Export Information
File".
(7) Display Variable Information
Display the Variable List panel in order to validate the acquired variable information.
The Variable List panel can be operated as follows, in accordance with the purpose.
Note that if the program is modified during debugging, the operation is repeated via (3), above.
(a) Customize Display Method
Change the display method (e.g. set which columns to display and the sorting order) on the panels.
(b) Jump to Defined Location
Jump to the location of source text where the function on the panel has been defined.
(c) Set a break event to a variable
Set a break event with access condition to the variable on the panel.
(d) Register Watch-Expressions
Register variables to the Watch panel (Watvh1) as watch-expressions.
(e) Display List of Referencing Location
Find and display a list of locations referencing the variable on the panel.
R20UT0265EJ0100 Rev.1.00
Sep 01, 2010
Page 18 of 129
CubeSuite Ver.1.40
Remark
CHAPTER 2 FUNCTIONS
It is also possible to display the function information defined in other than the active project.
For detailed instructions on displaying function information, see "2.10 Import or Export Information
File".
(8) Display Calling Relationships between Functions (Call Graph)
Display the Call Graph panel in order to validate the relationship between functions.
The Call Graph panel can be operated as follows, in accordance with the purpose.
(a) Jump to Defined Location
Jump to the location of source text where the function on the call graph has been defined.
(b) Search for a function
Search for an arbitrary function existing in the call graph.
(9) Display Analysis Information in Chart
Display acquired function information/variable information in a chart.
Note that if the program is modified during debugging, the operation is repeated via (3), above.
(a) Graph transitions in variable values
Display the relationship of variable/register values to time in a line chart.
(b) Chart the function execution time ratios
Display a pie chart of the function execution time ratios.
(10) Save Analysis Information
Save the acquired analysis information to a file.
(11) Save the project file
Save the setting information of the project to the project file.
Remark
For details on "Save the project file", see "CubeSuite Start".
R20UT0265EJ0100 Rev.1.00
Sep 01, 2010
Page 19 of 129
CubeSuite Ver.1.40
2.2
CHAPTER 2 FUNCTIONS
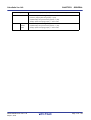
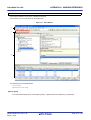
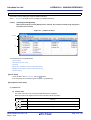
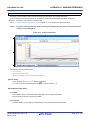
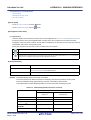
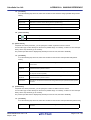
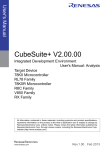
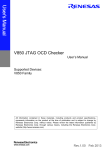
Display Function Information
Display the function information (function name, file name, attribute, reference count, execution count, etc.) in the program.
The function information is displayed on the following Function List panel, which is opened by clicking the
button
on the Main window’s toolbar.
Click the
button on this panel's toolbar to display the latest information that can currently be displayed (see "1.1.2
Types of analysis information").
See the Function List panel for details on each of the function information items displayed.
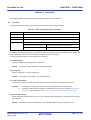
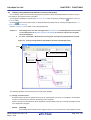
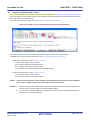
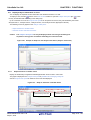
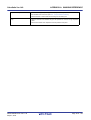
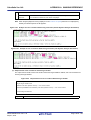
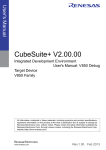
Figure 2-1. Display the Function Information (Function List Panel)
Toolbar
Current row mark
Remarks 1.
The display contents are updated each time program execution is stopped.
Note, however, that if the [Refresh at program stop] property in the [General] category on the [Settings]
tab of the Property panel is set to other than [Yes] (default), the information will be updated in
accordance with the setting on the Property panel.
2.
The value of the information that has been changed because of the execution of a program is shown
highlighted (the color depends on the configuration in the [General - Font and Color] category of the
Option dialog box). To reset the highlighting, click the
3.
The current row mark (
button on the toolbar.
) indicates the current row.
The following operations can be performed on the function with the current row mark.
- Jump to Defined Location
- Set Break Events
- Display List of Referencing Location
4.
Information for functions defined outside the active project, and which are never referenced from the
active project, is ordinary not displayed in the Function List panel.
For detailed instructions on displaying function information in this case, see "2.10 Import or Export
Information File".
R20UT0265EJ0100 Rev.1.00
Sep 01, 2010
Page 20 of 129
CubeSuite Ver.1.40
2.3
CHAPTER 2 FUNCTIONS
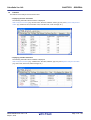
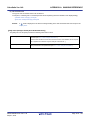
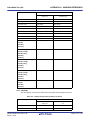
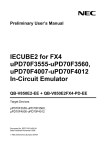
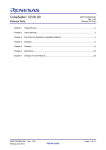
Display Variable Information
Display the variable information (variable name, file name, attribute, type, read count, write count, data coverage, etc.)
in the program.
The variable information is displayed on the following Variable List panel, which is opened by clicking the
button
on the Main window’s toolbar.
Click the
button on this panel's toolbar to display the latest information that can currently be displayed (see "1.1.2
Types of analysis information").
See the Variable List panel for details on each of the variable information items displayed.
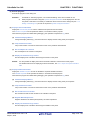
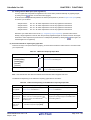
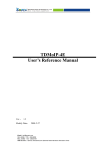
Figure 2-2. Display the Variable Information (Variable List Panel)
Toolbar
Current row mark
Remarks 1.
The display contents are updated each time program execution is stopped.
Note, however, that if the [Refresh at program stop] property in the [General] category on the [Settings]
tab of the Property panel is set to other than [Yes] (default), the information will be updated in
accordance with the setting on the Property panel.
2.
The value of the information that has been changed because of the execution of a program is shown
highlighted (the color depends on the configuration in the [General - Font and Color] category of the
Option dialog box). To reset the highlighting, click the
3.
The current row mark (
button on the toolbar.
) indicates the current row.
The following operations can be performed on the function with the current row mark.
- Jump to Defined Location
- Set Break Events
- Display List of Referencing Location
4.
Information for functions defined outside the active project, and which are never referenced from the
active project, is ordinary not displayed in the Variable List panel.
For detailed instructions on displaying function information in this case, see "2.10 Import or Export
Information File".
R20UT0265EJ0100 Rev.1.00
Sep 01, 2010
Page 21 of 129
CubeSuite Ver.1.40
2.4
CHAPTER 2 FUNCTIONS
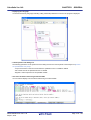
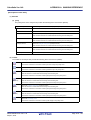
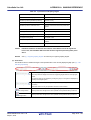
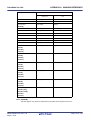
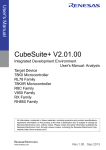
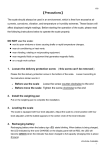
Display Calling Relationships between Functions (Call Graph)
You can display a tree-structured chart (call graph) that represents calling relationships between functions in the program based on the acquired function information.
The call graph is displayed on the following Call Graph panel, which is opened by clicking the
button on the Main
window’s toolbar.
Click the
button on this panel's toolbar to display the latest information that can currently be displayed (see "1.1.2
Types of analysis information").
See the Call Graph panel for details on the call graph displayed.
Cautions 1.
If the debug tool to use does not support the Trace function, or if the debug tool's trace function
is not enabled, then the Dynamic analysis information (an execution count) in the call graph
cannot be displayed.
2.
If a clean is executed in the build tool, the call graph currently being displayed will be erased.
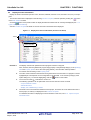
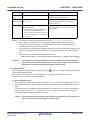
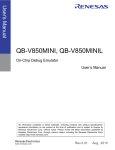
Figure 2-3. Display Calling Relations hips between Functions (Call Graph Panel)
Toolbar
[Parent Function Name] combo box
Function boxes
The following operations can be performed on the call graph displayed.
(1) Change a parent function
By default, the first function to appear named "main" or containing the word "main" is considered to be the parent
function, and that function is placed on the left edge of the call graph.
Select a function from the drop-down list of the [Parent Function Name] combo box to change the parent function
to be displayed in call graph.
Remark
[V850E2M]
If the selected microcontroller version supports multi-core, you can select "PEn" in the [Parent Function
R20UT0265EJ0100 Rev.1.00
Sep 01, 2010
Page 22 of 129
CubeSuite Ver.1.40
CHAPTER 2 FUNCTIONS
Name] combo box. In this case, the call graph will only be displayed for the functions executed in the
selected PEn.
(2) Jump to defined location
By double-clicking on a function box in the call graph, you can jump to the location of the source text where the
function is defined (see "2.6 Jump to Defined Location").
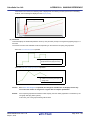
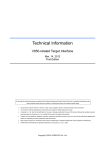
(3) Pop-up display of the function information
When the mouse cursor is hovered over a function box in the call graph, information about that function appears in
a pop-up (see "(c) Pop-up display" for details on the display format).
Caution
This function cannot be used when scrolling of the call graph is being allowed by using the
button on the display setting area in the Call Graph panel.
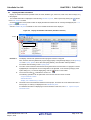
Figure 2-4. Pop-up Display of Function Information
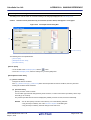
(4) Search for a function
You can search for an arbitrary function existing in the call graph.
To do this, click the
button on the Call Graph panel's toolbar to open the Call Graph Search dialog box.
In this dialog box, follow the steps below.
Figure 2-5. Search for Functions (Call Graph Dialog Box)
R20UT0265EJ0100 Rev.1.00
Sep 01, 2010
Page 23 of 129
CubeSuite Ver.1.40
CHAPTER 2 FUNCTIONS
(a) Specify [Function Name]
Specify a function name to search.
You can either type character strings directly into the text box, or select one from the input history via the dropdown list (up to 10 items).
Next, to specify conditions for the specified character strings, select the desired conditions in the [Condition]
combo box ([contains] is selected by default).
Searches are case-insensitive if the [Case-sensitive] check box is selected.
Remark
You can also specify the function name with any one of the following methods.
- Drag and drop an arbitrary function row of the Function List panel to this dialog box.
- Drag and drop an arbitrary character strings to this combo box.
(b) Specify [Parent Count]
If required as a search parameter, you can specify the number of parent functions to search.
You can either type a value directly into the text box (settable range: 0 to 65535), or select one from the input
history via the drop-down list (up to 10 items).
Next, to specify conditions for the specified value, select the desired conditions in the [Condition] combo box
([equals] is selected by default).
(c) Specify [Child Count]
If required as a search parameter, you can specify the number of child functions to search.
You can either type a value directly into the text box (settable range: 0 to 65535), or select one from the input
history via the drop-down list (up to 10 items).
Next, to specify conditions for the specified value, select the desired conditions in the [Condition] combo box
([equals] is selected by default).
(d) Click the [Search Backward]/[Search Forward] button
When the [Search Backward] button is clicked, the search uses the specified conditions, starting from the function name at the bottom of the call graph, and proceeding upward. The corresponding function box is highlighted.
When the [Search Forward] button is clicked, the search uses the specified conditions, starting from the function name at the top of the call graph, and proceeding downward. The corresponding function box is highlighted.
If a function has been specified in the [Target Function Name] combo box on the Call Graph panel, then the
search starts from the corresponding function, moving upward/downward.
Figure 2-6. Location Where a Function Has been Found
Mark indicating found location
Remarks 1.
The display contents are updated each time program execution is stopped.
Note, however, that if the [Refresh at program stop] property in the [General] category on the [Settings]
R20UT0265EJ0100 Rev.1.00
Sep 01, 2010
Page 24 of 129
CubeSuite Ver.1.40
CHAPTER 2 FUNCTIONS
tab of the Property panel is set to other than [Yes] (default), the information will be updated in accordance with the setting on the Property panel.
2.
A function whose source file does not exist in the project can be displayed in the call graph if the
[Display the function without definition at Call Graph panel] property in the [General] category on the
[Settings] tab of the Property panel is set to [Yes].
R20UT0265EJ0100 Rev.1.00
Sep 01, 2010
Page 25 of 129
CubeSuite Ver.1.40
2.5
CHAPTER 2 FUNCTIONS
Customize Display Method
The following operations will enable you to customize the displaying of items (columns) and the analysis information on
the Function List panel/Variable List panel.
All operations refer to the header area of each panel (the area where the column labels are displayed).
- Set the columns to display
- Change the order of the columns to display
- Lock the specific column to display
- Sort the analysis information
- Filter the analysis information
Remark
In the Column Chooser dialog box, click the [Default] button to return all the customizations you have performed via the operations above to the default values.
2.5.1
Set the columns to display
You can show or hide any of the items (columns) displayed on the Function List panel/Variable List panel.
(1) Restricting the columns displayed
(2) Adding columns to display
(1) Restricting the columns displayed
There are two ways to perform this operation, as shown below.
(a) Performing the operation from the panel
Use the mouse to drag and drop the items to hide off of the panel.
Figure 2-7. Restricting the Columns Displayed (Operation from the Panel)
Use mouse to drag and drop items
to hide off panel
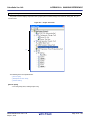
(b) Performing the operation from the Column Chooser dialog box
On the left edge of the panel's header area, click the
button to open the Column Chooser dialog box, and
then clear the check boxes of the names of the items to hide.
R20UT0265EJ0100 Rev.1.00
Sep 01, 2010
Page 26 of 129
CubeSuite Ver.1.40
CHAPTER 2 FUNCTIONS
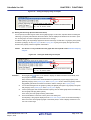
Figure 2-8. Restricting the Columns Displayed (Operation from the Column Chooser Dialog Box)
Click this button to open the Column
Chooser dialog box.
Clear the check boxes
of the items to hide
(2) Adding columns to display
On the left edge of the panel's header area, click the
button to open the Column Chooser dialog box, and then
select the check boxes of the names of the columns to display, or drag and drop them directly from the dialog box
to the information display area on the panel using the mouse.
Figure 2-9. Adding Columns to Display (Clearing Check Boxes in the Column Chooser Dialog Box)
Click this button to open the Column
Chooser dialog box.
Select the check boxes of
the items to display
Figure 2-10. Adding Columns to Display (Dragging and Dropping from the Column Chooser Dialog Box)
Click this button to open the Column
Chooser dialog box.
Drag and drop using the mouse
R20UT0265EJ0100 Rev.1.00
Sep 01, 2010
Page 27 of 129
CubeSuite Ver.1.40
2.5.2
CHAPTER 2 FUNCTIONS
Change the order of the columns to display
You can change the display order of the items (columns) displayed on the Function List panel/Variable List panel. There
are two ways to perform this operation, as shown below.
There are two ways to perform this operation, as shown below.
(1) Performing the operation from the panel
(2) Performing the operation from the Column Chooser dialog box
(1) Performing the operation from the panel
Use the mouse to drag and drop the column name to move directly to an arbitrary column (header area).
Figure 2-11. Change the Order of the Displayed Items (Operation from the Panel)
Drag the column name to move using the mouse
Drop on the destination column
This mark indicates the
position after movement
(2) Performing the operation from the Column Chooser dialog box
On the left edge of the panel's header area, click the
button to open the Column Chooser dialog box, and then
drag and drop the column names to move directly to the desired column (header area) on the panel using the
mouse.
Figure 2-12. Change the Order of the Displayed Items (Operation from the Column Chooser Dialog Box)
Click this button to open the Column
Chooser dialog box.
Drag and drop using the mouse
This mark indicates the
position after movement
R20UT0265EJ0100 Rev.1.00
Sep 01, 2010
Page 28 of 129
CubeSuite Ver.1.40
2.5.3
CHAPTER 2 FUNCTIONS
Lock the specific column to display
You can set specified items (columns) to always be displayed on the Function List panel/Variable List panel, even if the
screen display is scrolled.
To do this, use the mouse to click the lock display icons (
/
) of the desired column name (clicking repeatedly tog-
gles the item display between locked and unlocked).
Columns configured for locked display are locked at the leftmost column, so they will not be scrolled even if the user
scrolls horizontally.
The meanings of the lock display icons are as follows:
Table 2-2. Lock Display Icons
Icon
Description
Indicates that the display is not locked (default).
Indicates that the display is locked.
Remarks 1.
You can also lock the display of a column by dragging and dropping it between two items with locked
displays, or to the rightmost column.
2.
You can also unlock the display of a locked item by dragging and dropping it between two items with
unlocked displays.
2.5.4
Sort the analysis information
You can sort the information values on the Function List panel/Variable List panel by column, and in ascending or
descending order.
To do this, use the mouse to click the desired column name (clicking repeatedly toggles the sort order between ascending and descending).
If the items to sort are numbers (decimal or hexadecimal), then the information is sorted by numerical value. For other
types of data (e.g. strings), the information is sorted by character code.
The following mark appears by the column name of the column that the information is sorted on:
Table 2-3. Marks that Indicate Sorted Display
Mark
Description
Indicates that the information is being sorted in ascending order.
Click again with the mouse to sort in descending order.
Indicates that the information is being sorted in descending order.
Click again with the mouse to sort in ascending order.
Remark
2.5.5
Click while holding down the [Shift] key to sort on multiple columns.
Filter the analysis information
You can set filters for displaying information on the Function List panel/Variable List panel.
The following types of filters are available.
(1) Filtering via custom settings for each column
(2) Filtering results linked to panel
Caution
The Filtering via custom settings for each column and the Filtering results linked to panel are mutually exclusive functions. For this reason, the two filtering functions described here cannot be
R20UT0265EJ0100 Rev.1.00
Sep 01, 2010
Page 29 of 129
CubeSuite Ver.1.40
CHAPTER 2 FUNCTIONS
enabled simultaneously (when one of the filters is active, setting the other filter will disable the first
one).
(1) Filtering via custom settings for each column
Configure a custom filter for each column, and display the acquired information.
To do this, click on the filter icon (
/
) of the target column name, then select the following menu item.
Table 2-4. Filter Display Settings
Item
Description
(All)
Does not set filter (resets filter display).
Displays all information.
(Custom)
Opens the Filter Settings dialog box to set detailed filtering conditions.
Only information matching the conditions specified in this dialog will be displayed.
(Blanks)
Displays empty ("-") fields.
(NonBlanks)
Does not display empty ("-") fields.
Information list
All acquired information is displayed in a list as strings.
Only values matching the string selected from the list are displayed.
Select [(Custom)] to open the Filter Settings dialog box. Use this dialog box to set up to two condition groups. Both
conditions can be linked into a single filtering condition via the logical operator buttons ([AND] / [OR]).
Use the top condition-specification area if you only wish to specify one filtering condition.
Figure 2-13. Filtering via Custom Settings for Each Column (Filter Settings Dialog Box)
Condition 1
Condition 2
Enter comparison values
Select the condition for the comparison
(numbers/strings) directly
value from the drop-down list
The meanings of the filter icons are as follows:
Table 2-5. Filter Icons
Icon
Description
Indicates that no filtering is taking place (default).
Indicates that the information is being filtered.
Remark
If "(2) Filtering results linked to panel" is configured while the information is being filtered via this operation, all custom filter displays that have been taking place will be reset.
R20UT0265EJ0100 Rev.1.00
Sep 01, 2010
Page 30 of 129
CubeSuite Ver.1.40
CHAPTER 2 FUNCTIONS
(2) Filtering results linked to panel
(a) Linking with the Project Tree panel
(b) Linking with the Editor panel
(c) Linking with the Debug Manager panel [V850E2M]
(a) Linking with the Project Tree panel
Only display values for functions/variables in a file/category selected in the Project Tree panel.
To do this, click the
button on the Function List panel/Variable List panel toolbar to enable this filtering
function, then from the Project Tree panel, select the desired file(s)/category(s). Click this button again to disable this function.
The relationship between the selections in the Project Tree panel and the filtered functions/variables is as follows:
Table 2-6. Filtering Linked to the Project Tree panel
Selection
Display
Single file in active project
Functions/variables defined in single file
Multiple files in active project
Functions/variables defined in multiple files
Single category in active project
Functions/variables defined in single category
Multiple categories in active project
Functions/variables defined in multiple categories
Combination of files and categories in
Functions/variables defined in the selected files and categories
active project
Other than the above
Caution
All functions/variables defined in files included in the active project
Assembler source files cannot be analyzed.
Remarks 1.
2.
If a header file is selected, then functions/variables defined in that header file are displayed.
If "(1) Filtering via custom settings for each column" is configured while the information is
being filtered via this operation, linking displays that have been taking place will be reset.
3.
This filtering function can be used together with "(b) Linking with the Editor panel"/"(c) Linking with the Debug Manager panel [V850E2M]".
(b) Linking with the Editor panel
Only display information for functions/variables starting with the word at the caret position in the Editor panel.
To do this, click the
button on the Function List panel/Variable List panel toolbar to enable this filtering
function, then move the caret to the desired function/variable name in the Editor panel. Click this button again
to disable this function.
Note, however, that if there is no word at the caret position (e.g. if it is at a space or tab character), then the display will not be filtered linked to the Editor panel.
Remarks 1.
If "(1) Filtering via custom settings for each column" is configured while the information is
being filtered via this operation, linking displays that have been taking place will be reset.
2.
This filtering function can be used together with "(a) Linking with the Project Tree panel"/"(c)
Linking with the Debug Manager panel [V850E2M]".
R20UT0265EJ0100 Rev.1.00
Sep 01, 2010
Page 31 of 129
CubeSuite Ver.1.40
CHAPTER 2 FUNCTIONS
(c) Linking with the Debug Manager panel [V850E2M]
Only display information for functions/variables in the Common area and PE selected in the Debug Manager
panel.
To do this, click the
button on the Function List panel/Variable List panel toolbar to enable this filtering
function. Click this button again to disable this function.
Note, however, that if the selected microcontroller version does not support multi-core, then this function will
be invalid.
Remarks 1.
If "(1) Filtering via custom settings for each column" is configured while the information is
being filtered via this operation, linking displays that have been taking place will be reset.
2.
This filtering function can be used together with "(a) Linking with the Project Tree panel"/"(b)
Linking with the Editor panel".
R20UT0265EJ0100 Rev.1.00
Sep 01, 2010
Page 32 of 129
CubeSuite Ver.1.40
2.6
CHAPTER 2 FUNCTIONS
Jump to Defined Location
You can jump to the location of the source text where the function/variable on the Function List panel/Variable List
panel/Call Graph panel is defined.
To do this, double-click on the desired function/variable in the Function List panel/Variable List panel, in the same way,
double-click on the desired function box in the Call Graph panel.
When the jump is executed, the source file in which the target function/variable is defined opens in the Editor panel,
and the caret moves to the line where it is defined.
Cautions 1.
In the Call Graph panel, when the scroll function is allowed by clicking the
button on the
display setting area, this function cannot be used. In this case, select [Jump to Source] from
the context menu after selecting the target function with the [Target Function Name] combo
box.
2.
[CA850]
This jump function may not be performed correctly if "#pragma directive" (like examples below)
is described following "#include statement" in the source text.
In this case, move "#pragma directive" before the description of "#include statement".
Examples 1.
2.
#pragma task TASK_A
#pragma interrupt INTP0 functionA
It is also possible to jump to the disassembly data/memory list corresponding to the starting address of the function/
variable by the following method (but this is only possible while connecting to the debug tool).
When the jump is executed, the disassembly data/memory list corresponding to the starting address of the target function/variable opens in the Disassemble panel (Disassemble1)/Memory panel (Memory1), and the caret moves to the corresponding location.
- In the Function List panel/Variable List panel
Select the row in which the target function/variable is displayed (make sure that the current row mark (
) appears
to the left of the selected row), then from the context menu, select [Jump to Disassemble] or [Jump to Memory].
- In the Call Graph panel
Select the target function box (make sure that the target function name is displayed in the [Target Function Name]
combo box), then from the context menu, select [Jump to Disassemble] or [Jump to Memory].
2.7
Set Break Events
You can set a break event in the debug tool at a function/variable on the Function List panel/Variable List panel.
- Set a breakpoint to a function
- Set a break event to a variable
2.7.1
Set a breakpoint to a function
Set a breakpoint at the start of the function on the Function List panel (the first executable line in the function).
To do this, select the row in which the target function is displayed (make sure that the current row mark (
) appears to
the left of the selected row), then from the context menu, select [Set Break to Function].
A breakpoint set via this operation is managed in the Events panel as an event whose name is "Break at start of function".
Caution
This operation is invalid while disconnecting from the debug tool.
R20UT0265EJ0100 Rev.1.00
Sep 01, 2010
Page 33 of 129
CubeSuite Ver.1.40
Remark
2.7.2
CHAPTER 2 FUNCTIONS
If there is already a breakpoint set at the corresponding location, the behavior is as follows:
- If a breakpoint in a valid state is set:
No effect
- If a breakpoint in an invalid state is set:
Sets the breakpoint to a valid state
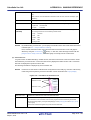
Set a break event to a variable
Set a break event with access condition to a variable on the Variable List panel.
To do this, select the row in which the target variable is displayed (make sure that the current row mark (
) appears to
the left of the selected row), then from the context menu, select one of the following and then press the [Enter] key.
- [Access Break] >> [Set Variable Read Break to]: Sets a break event with read access condition.
- [Access Break] >> [Set Variable Write Break to]: Sets a break event with write access condition.
- [Access Break] >> [Set Variable R/W Break to]:
Sets a break event with read/write access condition.
Note that at this time, you can specify the value in the text box in the context menu.
In this case, execution will only break if it is accessed with the specified value. If you press [Enter] key without entering
a value in the text box, then execution will break when the target variable is accessed, regardless of the value.
A break event set via this operation is managed in the Events panel as an event whose name is "Access break to variable".
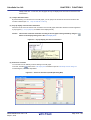
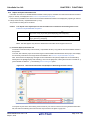
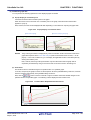
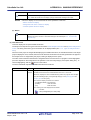
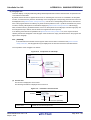
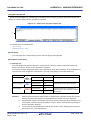
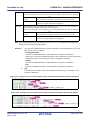
Figure 2-14. Example of Setting a Break Event on Variable
After setting the variable "global_b" to the current row enter a
value in [Access Break] >> [Set Variable Write Break to] from the
context menu, then press the [Enter] key.
Here, the program will break when the value "0xb" is written to the
variable "global_b".
Caution
This operation is invalid while disconnecting from the debug tool.
Remark
If there is already a breakpoint set at the corresponding location, the behavior is as follows:
- If a break event in a valid state is set:
No effect
- If a break event in an invalid state is set:
Sets the break event to a valid state
R20UT0265EJ0100 Rev.1.00
Sep 01, 2010
Page 34 of 129
CubeSuite Ver.1.40
2.8
CHAPTER 2 FUNCTIONS
Register Watch-Expressions
You can register a variable on the Variable List panel as a watch-expression in the Watch panel (Watch1).
To do this, drag and drop the row of the target variable directly onto the Watch panel (Watch1).
Cautions 1.
2.
Remark
This operation is invalid while disconnecting from the debug tool.
This operation is invalid for the [*Total*] row.
The name of the watch-expression registered in the Watch panel differs depending on the type of the target
variable, as follows:
- Global variable:
"variable name"
- File-internal static variable:
"file name#variable name"
- Static variable inside functions: "file name#function name#variable name"
R20UT0265EJ0100 Rev.1.00
Sep 01, 2010
Page 35 of 129
CubeSuite Ver.1.40
2.9
CHAPTER 2 FUNCTIONS
Display List of Referencing Location
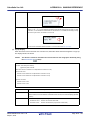
You can find and display a list of locations referencing a function/variable on the Function List panel/Variable List panel.
To do this, select the row in which the target function/variable is displayed (multiple selections possible), then from the
context menu, select [Find All references].
The results of the search are output to the next Output panel's [Find References] tab.
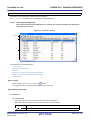
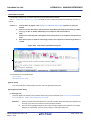
Figure 2-15. Sample List of Locations Referencing a Function (Output Panel)
The following information about the referencing locations is output to the list as the search results.
For details on the output format, see the section of the Output panel’s [Find References] tab.
- Performing the operation from the Function List panel
- Location where target function is defined
- List of locations referencing the target function
- List of functions called within the target function
- List of variables referenced (read/write) inside the target function
- Performing the operation from the Variable List panel
- Location where target variable is defined
- List of locations referencing the target variable
Caution
Code in C source files that is referenced but is eliminated by the preprocessor during compilation
(e.g. via "#if" or "#ifdef" statements) is not output as referenced locations.
Remarks 1.
When the function name/variable name on this panel is double-clicked, the Editor panel appears and
the caret moves to the line where the function/variable is defined.
2.
You can save the contents displayed on this panel to a text file (*.txt) by selecting [Save Output-Find
References As...] from the [File] menu.
R20UT0265EJ0100 Rev.1.00
Sep 01, 2010
Page 36 of 129
CubeSuite Ver.1.40
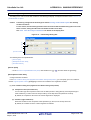
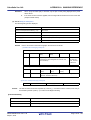
2.10
CHAPTER 2 FUNCTIONS
Import or Export Information File
Information for functions or variables defined outside the active project, and which are never referenced from the active
project, is ordinary not displayed in the Function List panel/Variable List panel.
In this case, it is possible to force this function information/variable information to be displayed by importing an information file (Function list file (*.csfl)/Variable list file (*.csvl)).
The procedure for doing this is as follows:
Caution
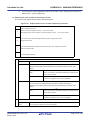
The objects of the import/export via the information file are limited to the following items on the
Function List panel/Variable List panel.
Function List panel
[Function Name], [File Name], [File Path], [PE Information]Note, [Attribute], [Return Type],
[Arguments Count], [Arguments], [Code Size[Bytes]], [Stack Size[Bytes]]
Variable List panel
[Variable Name], [File Name], [Function Name], [File Path], [PE Information]Note, [Attribute],
[Type], [Members], [Size[Bytes]]
Note This item appears only when the selected microcontroller version supports multi-core.
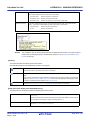
(1) Generate (Export) information file
Generate an information file (Function list file (*.csfl)/Variable list file (*.csvl)) with the functions/variables needed to
be imported.
To do this, first make the project in which the target functions/variables are defined the active project, then display
the necessary information of the target functions/variables in the Function List panel/Variable List panel.
Next, select all the rows displaying the target functions/variables in this panel (multiple rows can be selected by
holding down the [Shift]/[Ctrl] key while selecting), then from the [File] menu, select [Save Function List Data As...]/
[Save Variable List Data As...]. The following Save As dialog box opens.
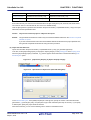
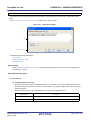
Figure 2-16. Generate the Information File (Example of Generating Function List File)
In the [Save in] area of the above dialog, select a folder of your choice in which to save the generated information
file, then select the following file format from the drop-down list in the [Files of type] area.
R20UT0265EJ0100 Rev.1.00
Sep 01, 2010
Page 37 of 129
CubeSuite Ver.1.40
CHAPTER 2 FUNCTIONS
Caller Panel
File of Type
Description
Function List panel
CubeSuite Function List File (*.csfl)
Generates a function list file (*.csfl).
Variable List panel
CubeSuite Variable List File (*.csvl)
Generates a variable list file (*.csvl).
Enter a file name of your choice for the information file in the [File name] area (note, however, that the file extension must be "csfl" for a Function list file, and "csvl" for a Variable list file).
Click the [Save] button to generate the information file (Function list file (*.csfl)/Variable list file (*.csvl)) in the specified folder, with the specified file name.
Caution
Only the current active project is subject to this export.
Remark
The generated information file contains only the functions/variables selected on the Function List panel/
Variable List panel.
If you also need information about functions/variables defined outside the active project specified here,
then generate a separate information file using the same procedure.
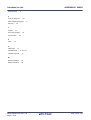
(2) Import the information file
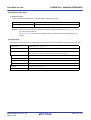
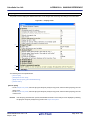
Import the information file (Function list file (*.csfl)/Variable list file (*.csvl)) you generated (exported).
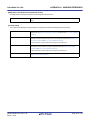
To do this, set the [Import files] property in the [Import / Export] category on the [Settings] tab of the Property panel.
When the [Import files] property is selected, a [...] button appears. When this button is clicked the following Path
Edit dialog box opens.
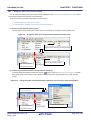
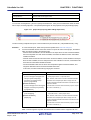
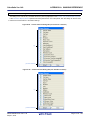
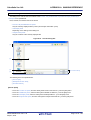
Figure 2-17. [Import files] Property in [Import / Export] Category
Figure 2-18. Specification of Import Files (Path Edit Dialog Box)
In the Path Edit dialog box, in the [Path(One path per one line)] area, specify the names of the information files
generated in (1) (including the path), one path per line (up to 259 characters per line/up to 64 lines). If you specify
a relative path, specify the project folder as the base.
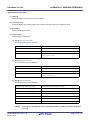
Note that at this time, you can use the following macro names for embedded macros.
R20UT0265EJ0100 Rev.1.00
Sep 01, 2010
Page 38 of 129
CubeSuite Ver.1.40
CHAPTER 2 FUNCTIONS
Macro Name
Function
%ProjectName%
Replaces itself with the project name.
%CubeSuitePath%
Replaces itself with the absolute path of the CubeSuite install folder.
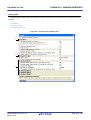
You can also use the [Browse...] button to specify information files. After you have entered the names of all the
files to import, click the [OK] button. The specified paths appear as sub-properties of the [Import files] property.
Figure 2-19. [Import files] Property (After Adding Import Files)
The above setting completes the import of the information file (Function list file (*.csfl)/Variable list file (*.csvl)).
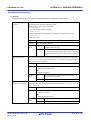
Remarks 1.
2.
To cancel the file import, delete the import files specified in the Path Edit dialog box.
If a function/variable with the same name exists in a import file and an active project, the determination is made according to the following rules.
- If the file names are different, and the attribute in the import file is for static functions/variables,
then it is interpreted as a static function/variable, and loaded as different function information/
variable information.
- If the file names are the same and the function names are different, and the attribute in the import
file is for static variables, then it is interpreted as a static variable in a function, and loaded as different function information/variable information.
- Functions/variables other than the above are interpreted as global functions/variables, and
merged as identical function information/variable information.
In this case, the rules for determining merging are as follows:
Items
[Function information]
[Function Name]/[File Pass]/[PE Infor-
Rules
The precedence is as follows:
"active project value" > "import file value"
mation]Note/[Stack Size[Bytes]]/
Note, however, that if there is function information/variable
[Arguments Count]/[Arguments]/
information from multiple import files to merge, then the
[Return Type]/[Attribute]
function information/variable information of the last file to be
[Variable information]
imported is loaded.
[Function Name]/[Function Name]/[File
If a value does not exist in either the active project or import
Path]/[PE Information]Note/[Attribute]/
file, then it is left blank ("-").
[Type]/[Members]
[Function information]
[Code Size[Bytes]]
[Variable information]
[Size[Bytes]]
The precedence is as follows:
"import file value" > "active project value"
Note, however, that if there is function information/variable
information from multiple import files to merge, then the
function information/variable information of the last file to be
imported is loaded.
If a value does not exist in either the active project or import
file, then it is left blank ("-").
Note This item appears only when the selected microcontroller version supports multi-core.
R20UT0265EJ0100 Rev.1.00
Sep 01, 2010
Page 39 of 129
CubeSuite Ver.1.40
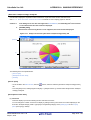
2.11
CHAPTER 2 FUNCTIONS
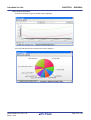
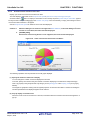
Display Analysis Information in Chart
You can display the acquired function information and variable information in a chart.
To display a chart, click the
button on the Main window's toolbar to open the Analysis Chart panel (the
button
can only be selected while connecting to the debug tool).
Up to a maximum of four of the Analysis Chart panels can be opened at one time; they are identified by the names
"Analysis Chart1", "Analysis Chart2", "Analysis Chart3", and "Analysis Chart4" (displayed in title bar).
The following content is graphed in the Analysis Chart panel.
- Graph transitions in variable values
- Chart the function execution time ratios
Caution
The Analysis Chart panel can only be displayed while connecting to the debug tool.
All panels of this type are closed when the debug tool is disconnected.
Figure 2-20. Example of Graphs for the Analysis Information (Analysis Chart Panel)
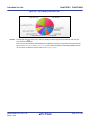
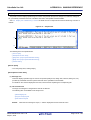
2.11.1
Graph transitions in variable values
Display the relationship of registered variable/register/other values to time in a line chart.
The graph is displayed in the Analysis Chart panell’s [Variable Value Changing Chart] tab.
See the Analysis Chart panel for details on each of the area displayed.
Figure 2-21. Graph of Transition in Variable Values
[Variable Name] combo box
R20UT0265EJ0100 Rev.1.00
Sep 01, 2010
[Variable Value] combo box
Page 40 of 129
CubeSuite Ver.1.40
CHAPTER 2 FUNCTIONS
The procedure for displaying the chart is as follows:
(1) Register graphing targets
Register the item to graph.
The following types of items can be registered.
- Global variable
- File-internal static variable
- Static variable inside functions
- CPU register
- SFR [78K0][78K0R]
- IOR [V850]
- Address
There are two ways to register graphing targets, shown below.
(a) Registering targets separately
(b) Linking with the Watch panel (Auto registration)
Caution
The registered graphing target cannot be changed during program execution.
(a) Registering targets separately
From the following panel, drag and drop the target directly onto this tab.
- Variable List panelNote
- Editor panel
- CPU register panel
- SFR panel [78K0][78K0R]
- IOR panel [V850]
- Watch panel
Note The name of the graphing target registered differs depending on the type of the variable, as follows:
- Global variable:
"variable name"
- File-internal static variable:
"file name#variable name
- Static variable inside functions: "file name#function name#variable name"
This Analysis Chart panel is identified by the names "Analysis Chart1-4". From this tab on the panel, you can
register targets individually for each tab on the various panels.
You can also register up to four targets per tab. Note, however, that there may be restrictions on the number
and size of targets that can be graphed, depending on the debug tool used and the method by which the graph
data was acquired (see "(2) Select the method for acquiring the graph data").
Remarks 1.
Graphing targets can be registered in this tab's [Variable Name] combo box, by entering the
target name directly via the keyboard, and then clicking the
button.
See "Table A-2. Input Format of Graphing Targets" for the input format for registering target
names in this way.
2.
To delete a graphing target after it has been registered, select the target name to delete from
the [Variable Name] combo box drop-down list, then click the
3.
button.
Once you have finished registering graphing targets, this information will not be lost if you
close this panel.
R20UT0265EJ0100 Rev.1.00
Sep 01, 2010
Page 41 of 129
CubeSuite Ver.1.40
CHAPTER 2 FUNCTIONS
(b) Linking with the Watch panel (Auto registration)
You can register watch-expressions registered in the current Watch panel automatically as graphing targets,
by setting it via the
button on this tab's toolbar (toggle).
At this time, the linking relationship between the Watch panel (Watch1-4) and the Analysis Chart panel (Analysis Chart1-4) is as follows:
- Analysis Chart1:
The 1st - 4th watch-expressions from the top registered in the Watch1
- Analysis Chart2:
The 1st - 4th watch-expressions from the top registered in the Watch2
- Analysis Chart3:
The 1st - 4th watch-expressions from the top registered in the Watch3
- Analysis Chart4:
The 1st - 4th watch-expressions from the top registered in the Watch4
Note that if you enable this function via the "(a) Registering targets separately" operation when there is
already a target registered on the tab, then the previously registered targets are cleared, and then the targets
are linked to watch-expressions (if this function is subsequently disabled by clicking the
button again, the
cleared targets are re-registered).
(2) Select the method for acquiring the graph data
There are two ways to acquire the data for graphing, as shown below. Select the toolbar button in accordance with
your requirements.
Table 2-7. Method for Acquiring Graph Data
Method for Acquiring Graph Data
Button
Description
Display a graph based on the trace data acquired via the
Trace data analysis
[IECUBE[78K0R]]
Trace function of the debug tool.
[IECUBE[V850]]
[IECUBE2]Note
[Simulator]
Real-time sampling analysis
Display a graph based on the data acquired via the RRM
function of the debug tool (default).
Note This excludes the case when the selected microcontroller version supports multi-core.
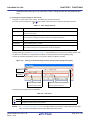
The differences depending on the method for acquiring graph data are as follows:
Table 2-8. Differences Depending on the Method for Acquiring Graph Data
Differences
Trace Data Analysis [IECUBE][Simulator]
Real-time Sampling Analysis
Data that can
Can only be displayed if the debug tool's
Can only be displayed if the debug tool's RRM
be graphed
Trace function is enabledNote 1.
function is enabledNote 1.
Graph format
Step-plot line chart
Normal line chart
Number of tar-
If trace data is acquired via Point Trace
[IECUBE [V850]] [MINICUBE2 [78K0]]
gets that can
events, then the number depends on the
Depends on the target range for the RRM function
be graphed
maximum number of enabled eventsNote 2 in
of the debug toolNote 3.
the debug tool.
Size of targets
- Less than or equal to 2 bytes [78K0][78K0R]
that can be
- Less than or equal to 4 bytes [V850]
Less than or equal to 4 bytes
graphed
R20UT0265EJ0100 Rev.1.00
Sep 01, 2010
Page 42 of 129
CubeSuite Ver.1.40
Differences
Time display
CHAPTER 2 FUNCTIONS
Trace Data Analysis [IECUBE][Simulator]
Time registered as trace data
range
Real-time Sampling Analysis
The execution time, from the start to the end of
program execution (Run-Break time)
Transition
Matches actual timing (can be checked from
Not possible to identify accurate time/change
points of value
Pop-up display)
points, because they depend on the specified
sampling intervalNote 4.
Note
It is not possible to analyze changes in values
It may not be possible to identify the sampling
in the following case:
interval, depending on the number of graphing tar-
- In regions where the variable is assigned to
gets registered.
a register via compiler optimizations
- When a 2-byte region is written in units of 1
byte, or a 4-byte region is written in units of
1 or 2 bytes
Notes 1.
For details on the settings to enable each function, see "1.1.3 Setting of the debug tool".
2.
The number of events that can be set to "valid state" simultaneously differs according to the
microcontroller and the debug tool. For details on "Maximum number of enabled events", see
"CubeSuite Debug" of the microcontroller to use.
3.
The target range for the RRM function differs according to the microcontroller and the debug tool. For
details on "The target range for the RRM function", see "CubeSuite Debug" of the microcontroller to
use.
4.
The following setting in the Property panel for the debug tool:
- [Debug Tool Settings] tab >> [Access Memory While Running] category >> [Display update interval[ms]
Cautions 1.
2.
The method for acquiring the graph data cannot be changed during program execution.
If graph data has already been acquired, then changing this setting will cause the stored
graph data to be deleted (the graph being displayed will be erased).
(3) Display the graphs
After you have executed and stopped the program, click the
button on the toolbar to display the latest chart
for the registered graphing target.
Note, however, that the graph will not be displayed if the corresponding data could not be acquired.
The display of this graph can be configured as follows.
(a) Setting the display range
You can specify the value range to display on the graph's Y axis. In this case, the display range is fixed, so
acquired data that falls outside the specified range will not be displayed in the corresponding section of the
graph.
To make the setting, set the [Settings upper/lower bound of the range of view 1-4] property in the [Analysis
Chart1-4] category on the [Settings] tab of the Property panel to [Yes], then specify the upper and lower
bounds in the property value that appears underneath it.
Caution
If the value of the difference between the maximum and minimum values is extremely low,
then it may not be possible to display the specified range.
R20UT0265EJ0100 Rev.1.00
Sep 01, 2010
Page 43 of 129
CubeSuite Ver.1.40
CHAPTER 2 FUNCTIONS
Figure 2-22. Setting the Display Range for Graphs
Enter the upper/lower value in decimal number or hex decimal number.
Ex.) 100, -32, 0xFFFF, -0x800
(b) Setting the valid range (Discard abnormal values)
You can specify the valid range of values for the graphing target. In this case, acquired values exceeding the
valid range you specify are treated as abnormal values, and not displayed as transitions of the value in question. On the graph, the value is displayed as if there was no change.
To make the setting, set the [Settings upper/lower bound of the range of valid value 1-4] property in the [Analysis Chart1-4] category on the [Settings] tab of the Property panel to [Yes], then specify the upper and lower
bounds in the property value that appears underneath it.
Caution
This function is only available when the graph data was acquired via the Real-time sampling
analysis.
Figure 2-23. Setting the Valid Range for Graphs
Enter the upper/lower value in decimal number or hex decimal number.
Ex.) 100, -32, 0xFFFF, -0x800
Remarks 1.
Click (toggle) the
button on the toolbar to display the latest information automatically each
time program execution is stopped.
Note, however, that this button will be disabled if the [Refresh at program stop] property in the
[General] category on the [Settings] tab of the Property panel is set to other than [Specify Individually] (default) (this button is locked in accordance with the setting on the Property panel).
2.
You can hide the legend for the graphs by setting the [Display the legend 1-4] property in the [Gen-
3.
If the acquired graph data exceeds the buffer capacity, then the oldest graph data is overwritten by
eral] category on the [Settings] tab of the Property panel to [No].
the new graph data (ring buffer system).
In this case, part of the graph rendering will be blank.
4.
There are limitations to the trace memory area of the debug tool.
Consequently, if the graph is displayed via the Trace data analysis, then we recommend setting a
Point Trace event for the graphing target in the Watch panel, in order to display transitions of values over a wider range.
R20UT0265EJ0100 Rev.1.00
Sep 01, 2010
Page 44 of 129
CubeSuite Ver.1.40
CHAPTER 2 FUNCTIONS
(4) Validate the graph data
You can perform the following operations on the displayed graph as needed.
(a) Pop-up display at a transition point
Check the information about transition points in the graph.
When the mouse cursor is hovered over a transition point on the graph, information about that location
appears in a pop-up.
Note, however, that the content displayed will differ depending on the method for acquiring the graph data.
Figure 2-24. Pop-up Display at a Transition Point
[Trace data analysis]
Remark
[Real-time sampling analysis]
The [Location] information is displayed only when the transition location information exists in the
graph data acquired via the Trace data analysis (when the information does not exist, "-" is displayed). In this case, furthermore, you can display the applicable location in the Editor panel by
clicking the transition point.
Note, however, that the [Location] information may be invalid value when the graph data is
acquired by simultaneously using a Trace event and a Point Trace event in the debug tool.
(b) Find values
Find locations where a variable changed to a specified value on a specified graph.
To do this, first specify the graph to search via the drop-down list in the [Variable Name] combo box, and then
enter the transition value directly in the [Variable Value] combo box.
Next, click the
/
button to search to the left or right for locations where the variable changed to the
specified value in the specified graph. The following mark is displayed at the location found.
Figure 2-25. Location Where Graph Data Has Been Found
Mark indicating found location
R20UT0265EJ0100 Rev.1.00
Sep 01, 2010
Page 45 of 129
CubeSuite Ver.1.40
2.11.2
CHAPTER 2 FUNCTIONS
Chart the function execution time ratios
Display a pie chart of the function execution time ratios.
The chart display is performed via the Analysis Chart panel’s [Execution Time(Percentage) Chart] tab.
Click the toolbar's
button to display a chart based on the currently acquired Dynamic analysis information (equiva-
lent to [Execution Time(Percentage)[%]] in the Function List panel). If the trace memory is empty, the message "There is
no execution time information." will appear.
See the Analysis Chart panel for details on each of the area displayed.
Cautions 1.
When the debug tool to use does not support the Trace function, or when the debug tool’s trace
function is not enabled, this chart cannot be displayed.
2.
[IECUBE [78K0]]
Because the trace time tag function is not supported, this chart cannot be displayed.
Figure 2-26. Chart of the Function Execution Time Ratios
The following operations can be performed on the call graph displayed.
(1) Specify the number of functions to display
You can change the number of functions displayed in the chart.
To do this, specify the number in the [The number of functions displaying in the Execution Time(Percentage)
Chart1-4] property in the [Analysis Chart1-4] category on the [Settings] tab of the Property panel (set to [10] by
default).
The targets are graphed in ranking order of highest proportion of execution time taken. Functions exceeding the
number specified here are displayed together under "Others".
(2) Pop-up display of execution time
When the mouse cursor is hovered over a function, information about that function's execution time appears in a
pop-up.
R20UT0265EJ0100 Rev.1.00
Sep 01, 2010
Page 46 of 129
CubeSuite Ver.1.40
CHAPTER 2 FUNCTIONS
Figure 2-27. Pop-up Display of Execution Time
Remark
Click (toggle) the
button on the toolbar to display the latest information automatically each time pro-
gram execution is stopped.
Note, however, that this button will be disabled if the [Refresh at program stop] property in the [General] category on the [Settings] tab of the Property panel is set to other than [Specify Individually] (default) (this button is locked in accordance with the setting on the Property panel).
R20UT0265EJ0100 Rev.1.00
Sep 01, 2010
Page 47 of 129
CubeSuite Ver.1.40
2.12
CHAPTER 2 FUNCTIONS
Save Analysis Information
You can save the contents of the Function List panel, Variable List panel, Call Graph paneland Analysis Chart panelto a
file.
(1) Save function information
To do this, with the focus on the Function List panel, select [Save Function List Data As...] from the [File] menu.
The Save As dialog box opens; perform the operation from this dialog.
The following file formats can be specified when saving the information.
Text Files (*.txt)
Text format
CSV(Comma-Separated Variables) (*.csv)
CSV format
Microsoft Office Excel Workbook (*.xls)
Microsoft Excel 97 - Excel 2003, and 5.0/95 book format
CubeSuite Function List file (*.csfl)
File format to import the function information (see "2.10 Import or Export
Information File".)
Caution
Only the items/analysis information currently displayed in the panel can be saved.
(2) Save variable information
To do this, with the focus on the Variable List panel, select [Save Variable List Data As...] from the [File] menu. The
Save As dialog box opens; perform the operation from this dialog.
The following file formats can be specified when saving the information.
Text Files (*.txt)
Text format
CSV(Comma-Separated Variables) (*.csv)
CSV format
Microsoft Office Excel Workbook (*.xls)
Microsoft Excel 97 - Excel 2003, and 5.0/95 book format
CubeSuite Variable List file (*.csvl)
File format to import the variable information (see "2.10 Import or Export
Information File".)
Caution
Only the items/analysis information currently displayed in the panel can be saved.
(3) Save call graph information
To do this, with the focus on the Call Graph panel, select [Save Call Graph Data As...] from the [File] menu. The
Save As dialog box opens; perform the operation from this dialog.
The following file formats can be specified when saving the information.
Note that when "(Only the visible part)" is selected, only the part currently being displayed in the panel will be
saved.
Bitmap(Only the visible part) (*.bmp)
Bitmap format (32-bit) (Graphic file format)
JPEG(Only the visible part) (*.jpg)
JPEG format (Graphic file format)
PNG(Only the visible part) (*.png)
PNG format (Graphic file format)
Bitmap (*.bmp)
Bitmap format (32-bit) (Graphic file format)
JPEG (*.jpg)
JPEG format (Graphic file format)
PNG (*.png)
PNG format (Graphic file format)
EMF (*.emf)
EMF format (Graphic file format)
R20UT0265EJ0100 Rev.1.00
Sep 01, 2010
Page 48 of 129
CubeSuite Ver.1.40
Caution
CHAPTER 2 FUNCTIONS
All part of the call graph may not successfully be saved as a graphic file format if the project is
too big.
Remark
If the zoom function has been applied, then the image will be saved at the current zoom ratio (except for
EMF format).
(4) Save graph information
To do this, with the focus on the Analysis Chart panel, select [Save Analysis Chart Data As...] from the [File] menu.
The Save As dialog box opens; perform the operation from this dialog.
The following file formats can be specified when saving the information.
Text Files (*.txt)
Text format
CSV(Comma-Separated Variables) (*.csv)
CSV format
Microsoft Office Excel Workbook (*.xls)
Microsoft Excel 97 - Excel 2003, and 5.0/95 book format
Bitmap (*.bmp)
Bitmap format (32-bit) (Graphic file format)
JPEG (*.jpg)
JPEG format (Graphic file format)
PNG (*.png)
PNG format (Graphic file format)
Caution
Only the contents of the currently displayed tab can be saved.
R20UT0265EJ0100 Rev.1.00
Sep 01, 2010
Page 49 of 129
CubeSuite Ver.1.40
APPENDIX A WINDOW REFERENCE
APPENDIX A WINDOW REFERENCE
Appendix A provides detailed explanations of windows/panels/dialog boxes used by the analyze tool.
A.1
Description
The analyze tool has the following windows, panels and dialog boxes.
Table A-1. Window/Panel/Dialog Box List
Window/Panel/Dialog Box Name
Description
Main window
This is the first window to open when CubeSuite is launched.
Project Tree panel
Displays the components of the project in a tree structure.
Property panel
Displays detailed information on the analyze tool and changes the settings of the information.
Function List panel
Displays the acquired function information.
Variable List panel
Displays the acquired variable information.
Call Graph panel
Displays calling relationships between functions (call graph).
Analysis Chart panel
Displays charts of the acquired function information and variable information.
Output panel
Displays operation logs for various components provided by CubeSuite and the reference
list for functions/variables.
Path Edit dialog box
Specifies the information file (Function list file (*.csfl)/Variable list file (*.csvl)) to import.
Column Chooser dialog box
Changes the order of the display items and the setting of display/non-display for the Function List panel/Variable List panel.
Call Graph Search dialog box
Filter Settings dialog box
Searches for a function that exists in the call graph displayed in the Call Graph panel.
Specifies the filter conditions to display the information on the Function List panel/Variable
List panel.
Save As dialog box
Saves the contents of the Function List panel/Variable List panel/Call Graph panel/Analysis Chart panel to a file with a name.
Generates the information file (Function list file (*.csfl)/Variable list file (*.csvl)).
R20UT0265EJ0100 Rev.1.00
Sep 01, 2010
Page 50 of 129
CubeSuite Ver.1.40
APPENDIX A WINDOW REFERENCE
Main window
This is the first window to open when CubeSuite is launched.
In this window. you can open panels for the analyze tool.
Figure A-1. Main Window
(1)
(2)
(3)
The following items are explained here.
- [How to open]
- [Description of each area]
[How to open]
- From the Windows [start] menu, select [All Programs] >> [NEC Electronics CubeSuite] >> [CubeSuite].
R20UT0265EJ0100 Rev.1.00
Sep 01, 2010
Page 51 of 129
CubeSuite Ver.1.40
APPENDIX A WINDOW REFERENCE
[Description of each area]
(1) Menubar
(a) [View]
The [View] menu for the analyze tool provides the following items and functions (default).
Program Analyzer
The following cascade menus are displayed to open panels for the analyze tool.
Function List
Opens the Function List panel.
Variable List
Opens the Variable List panel.
Analysis Chart1
Opens the Analysis Chart panel (Analysis Chart1).
Note that this menu item is invalid while disconnecting from the debug tool.
Analysis Chart2
Opens the Analysis Chart panel (Analysis Chart2).
Note that this menu item is invalid while disconnecting from the debug tool.
Analysis Chart3
Opens the Analysis Chart panel (Analysis Chart3).
Note that this menu item is invalid while disconnecting from the debug tool.
Analysis Chart4
Opens the Analysis Chart panel (Analysis Chart4).
Note that this menu item is invalid while disconnecting from the debug tool.
Call Graph
Opens the Call Graph panel.
(2) Toolbar
The toolbar for the analyze tool provides the following items and functions (default).
Opens the Function List panel.
The function of this item is the same as that of [Function List] in the [View] menu.
Opens the Variable List panel.
The function of this item is the same as that of [Variable List] in the [View] menu.
Opens the Analysis Chart panel (Analysis Chart1).
(First)
Note that this item is invalid while disconnecting from the debug tool.
The function of this item is the same as that of [Analysis Chart1] in the [View] menu.
Opens the Analysis Chart panel (Analysis Chart2).
(Second)
Note that this item is invalid while disconnecting from the debug tool.
The function of this item is the same as that of [Analysis Chart2] in the [View] menu.
Opens the Analysis Chart panel (Analysis Chart3).
(Third)
Note that this item is invalid while disconnecting from the debug tool.
The function of this item is the same as that of [Analysis Chart3] in the [View] menu.
Opens the Analysis Chart panel (Analysis Chart4).
(Fourth)
Note that this item is invalid while disconnecting from the debug tool.
The function of this item is the same as that of [Analysis Chart4] in the [View] menu.
Opens the Call Graph panel.
The function of this item is the same as that of [Call Graph] in the [View] menu.
R20UT0265EJ0100 Rev.1.00
Sep 01, 2010
Page 52 of 129
CubeSuite Ver.1.40
APPENDIX A WINDOW REFERENCE
(3) Panel display area
This area consists of multiple panels, each dedicated to a different purpose.
See the following sections for details on a panel used by the analyze tool.
- Project Tree panel
- Property panel
- Function List panel
- Variable List panel
- Call Graph panel
- Analysis Chart panel
- Output panel
R20UT0265EJ0100 Rev.1.00
Sep 01, 2010
Page 53 of 129
CubeSuite Ver.1.40
APPENDIX A WINDOW REFERENCE
Project Tree panel
This panel is used to display components of the project (microcontroller, design tool, build tool, debug tool, etc.) in a
tree structure.
Figure A-2. Project Tree Panel
(1)
The following items are explained here.
- [How to open]
- [Description of each area]
- [Context menu]
[How to open]
- From the [View] menu, select [Project Tree].
R20UT0265EJ0100 Rev.1.00
Sep 01, 2010
Page 54 of 129
CubeSuite Ver.1.40
APPENDIX A WINDOW REFERENCE
[Description of each area]
(1) Project tree area
Project components are displayed in tree view with the following given node.
Node
Description
Program Analyzer (Analyze Tool)
Remark
This is the analyze tool to use.
When the node is selected, the detailed information (property) is displayed in the Property panel, and
you can change the settings.
The Property panel can be opened by double-clicking on the node when the Property panel is not
opened.
[Context menu]
The following context menu items are displayed by right clicking the mouse on [Program Analyzer (Analyze Tool)] node.
Function List
Opens the Function List panel.
Variable List
Opens the Variable List panel.
Analysis Chart
The following cascade menus are displayed to open the Analysis Chart panel.
Note that this menu item is invalid while disconnecting from the debug tool.
Analysis Chart1
Opens the Analysis Chart1.
Analysis Chart2
Opens the Analysis Chart2.
Analysis Chart3
Opens the Analysis Chart3.
Analysis Chart4
Opens the Analysis Chart4.
Call Graph
Opens the Call Graph panel.
Property
Opens the Property panel containing the information for the analyze tool.
R20UT0265EJ0100 Rev.1.00
Sep 01, 2010
Page 55 of 129
CubeSuite Ver.1.40
APPENDIX A WINDOW REFERENCE
Property panel
This panel is used to display the detailed information on the analyze tool and change the settings of the information.
Figure A-3. Property Panel
(1)
(2)
(3)
The following items are explained here.
- [How to open]
- [Description of each area]
- [[Edit] menu (Property panel-dedicated items)]
- [Context menu]
[How to open]
- On the Project Tree panel, select the [Program Analyzer (Analyze Tool)] node, and then select [Property] from the
[View] menu.
- On the Project Tree panel, select the [Program Analyzer (Analyze Tool)] node, and then select [Property] from the
context menu.
Remark
If the Property panel has been opened, the detailed information on the analyze tool is displayed by selecting
the [Program Analyzer (Analyze Tool)] node on the Project Tree panel.
R20UT0265EJ0100 Rev.1.00
Sep 01, 2010
Page 56 of 129
CubeSuite Ver.1.40
APPENDIX A WINDOW REFERENCE
[Description of each area]
(1) Detailed information display/change area
In this area, the detailed information on the analyze tool is displayed by category in the list. Also, you can directly
change its settings.
The
mark is indicates all the items in the category are expanded. The
mark indicates all the items are
shrink. You can expand/shrink the items by clicking these marks or double-clicking the category name.
For details on the information/how to setup in the category and property items contained in it, see the section
explaining the corresponding tab.
(2) Property description area
In this area, brief description of the categories and properties selected in the detailed information display/change
area is displayed.
(3) Tab selection area
Categories for the display of the detailed information are changed when each tab is selected.
In this panel, a following tab is contained (see the section explaining the tab for details on the display/setting).
- [Settings] tab
[[Edit] menu (Property panel-dedicated items)]
The [Edit] menu for this panel provides the following items and functions.
Undo
Undoes the latest property value editing being done.
Cut
Deletes the selected character string(s) and copies them to the clipboard while editing
the property value.
Copy
Paste
Copies the contents of the selected range to the clipboard as character string(s).
Pastes the contents of the clipboard to the property value while editing the property
value.
Delete
Deletes the selected character string(s) while editing the property value.
Select All
Selects all the character strings in the selected property while editing the property value.
[Context menu]
The context menu displayed by right-clicking on this panel provides the following items and functions.
(1) While not editing the property value
Reset to Default
Restores the selected setting of the property item to default value.
Reset All to Default
Restores all the selected settings of the property items on the tab to default value.
(2) While editing the property value
Undo
Undoes the latest property value editing being done.
Cut
Deletes the selected character string(s) and copies them to the clipboard while editing
the property value.
Copy
R20UT0265EJ0100 Rev.1.00
Sep 01, 2010
Copies the contents of the selected range to the clipboard as character string(s).
Page 57 of 129
CubeSuite Ver.1.40
Paste
APPENDIX A WINDOW REFERENCE
Pastes the contents of the clipboard to the property value while editing the property
value.
Delete
Select All
Deletes the selected character string(s) while editing the property value.
Selects all the character strings in the selected property while editing the property
value.
R20UT0265EJ0100 Rev.1.00
Sep 01, 2010
Page 58 of 129
CubeSuite Ver.1.40
APPENDIX A WINDOW REFERENCE
[Settings] tab
The [Setting] tab is used to display the detailed information categorized by the following and the configuration can be
changed.
(1) [General]
(2) [Import / Export]
(3) [Analysis Chart1 - 4]
Figure A-4. Property Panel: [Settings] Tab
(1)
(2)
(3)
R20UT0265EJ0100 Rev.1.00
Sep 01, 2010
Page 59 of 129
CubeSuite Ver.1.40
APPENDIX A WINDOW REFERENCE
[Description of Each Category]
(1) [General]
The general information on the analyze tool is displayed and its configuration can be changed.
Accumulate result of
Specify whether to display the cumulative value for each program execution for the execution
analysis
count and execution time as the analysis information.
The target items for this property are as follows:
- Function List panel
[Execution Count]/[Execution Time[unit]]
- Variable List panel
[Read Count]/[Write Count]/[Read/Write Count]/[Minimum Value]/[Maximum Value]
- Call Graph panel
[Execution Count]
Default
No
Modifying
Select from the drop-down list.
Available
Yes
values
Displays the sum of the measurements from the last program
execution and from this one.
No
Displays the measurements for each program execution.
If the value is changed from [Yes] to [No], then the current analysis results will be cleared, and the measured values displayed.
Compulsorily output
Specify whether the analyze tool should force output of cross reference information when per-
cross reference file
forming a build in order to obtain the cross-reference information necessary to acquire Static
analysis information, ignoring the property settingNote 1 on the build tool specifying whether to
output cross reference information.
Default
Yes
Modifying
[CA78K0][CA78K0R][CA850]
Select from the drop-down list.
[CX]
Changes not allowed
Available
Yes
values
Ignores the build tool's property settings, and forces the output
of cross reference information.
No
Gives priority to the build tool's property settings.
Include the prototype
Specify whether to target the prototype declaration as the information of the function refer-
declaration as references
ences when displaying a list of locations referencing a function (see "2.9 Display List of Referencing Location").
Default
Yes
Modifying
[CA78K0][CA78K0R][CA850]
Changes not allowed
[CX]
Select from the drop-down list.
Available
values
R20UT0265EJ0100 Rev.1.00
Sep 01, 2010
Yes
Displays the prototype declaration.
No
Does not display the prototype declaration.
Page 60 of 129
CubeSuite Ver.1.40
Refresh at program stop
APPENDIX A WINDOW REFERENCE
Specify whether to update the contents of the Function List panel/Variable List panel/Call
Graph panel/Analysis Chart panel/ when the program stops executing.
Default
Yes
Modifying
Select from the drop-down list.
Available
Yes
values
Updates the contents of the panel after the program execution is
stopped.
No
Does not update the contents of the panel even if the program
execution is stopped.
Unit of time
Specify
Enables the
individually
the panel by clicking this button).
button on each panel (updates the contents of
Specify the time unit for the analyze tool.
Default
ns
Modifying
Select from the drop-down list.
Available
ns
values
Displays the time in nanosecond units.
The value is rounded to integer number.
μs
Displays the time in microsecond units.
The value is rounded to three decimal places.
ms
Displays the time in millisecond units.
The value is rounded to three decimal places.
s
Displays the time in second units.
The value is rounded to three decimal places.
h:min:s
Delimits arguments by
new line
Specify whether to display the [Arguments] items in the Function List panel with newlines.
Default
No
Modifying
Select from the drop-down list.
Available
Yes
Displays in multiple lines, one value per line.
No
Displays without newlines, comma (",") separated.
values
Display the SFR/IOR
Displays the time as "hours, minutes (0 - 59), seconds (0 - 59)".
Specify whether to display the SFR/IOR on the Variable List panel by treating it as a variable.
Default
No
Modifying
Select from the drop-down list.
Available
Yes
Displays the SFR/IOR.
No
Does not display the SFR/IOR.
values
Display the function with-
Specify whether to display the function without definition (i.e. a function whose source file
out definition at Call
does not exist) in the Call Graph panel.
Graph panel
Default
No
Modifying
Select from the drop-down list.
Available
Yes
Displays the function without definition.
No
Does not display the function without definition.
values
R20UT0265EJ0100 Rev.1.00
Sep 01, 2010
Page 61 of 129
CubeSuite Ver.1.40
APPENDIX A WINDOW REFERENCE
Output function informa-
Specify whether to output the information file for STFNote 2 to the folder specified with "[Com-
tion at program stop
mon Options] tab >> [Output File Type and Path] category >> [Intermediate file output folder]
property" on the property panel of the build tool to use.
Default
No
Modifying
Select from the drop-down list.
Available
Yes
values
When [Yes] is selected, the contents of the Function List panel
currently being displayed is output to a file (if the Function List
panel is not displayed, the information acquired from the last
trace data is output).
Thereafter, the information acquired from the last trace data is
output to the file each time program execution is stopped.
Note that the file is always overwritten.
No
Notes 1.
Does not output the information file for STF.
The settings on the following property of your build tool's Property panel.
- [CA78K0][CA78K0R]
[Compile Options] tab >> [List File] category >> [Output cross reference list file] property
- [CA850]
[Cross Reference Options] tab >> [Cross Reference Tool] category >> [Use cross reference tool]
property
2.
The same information as the content on the Function List panel is output to the STF information file
(FuncInfo.csv) (including information for items that are currently hidden).
(2) [Import / Export]
The detailed information on import/export functions is displayed and its configuration can be changed.
For details on the import/export function, see "2.10 Import or Export Information File".
Import files
Specify the file to import.
The names of files to be imported are listed in the lower area.
Default
Import files [0]
Modifying
Specify with the Path Edit dialog box.
The Path Edit dialog box is opened when clicking the [...] button appears at
right by selecting this property (you cannot specify the file to download on this
panel).
Export the functions and
Specify whether to generate the information files (Function list file (*.csfl) and Variable list file
variables
(*.csvl)) with the contents of the Function List panel/Variable List panel when a build or
rebuild is performed.
Default
No
Modifying
Select from the drop-down list.
Available
Yes
Generates the information files.
No
Does not Generate the information files.
values
R20UT0265EJ0100 Rev.1.00
Sep 01, 2010
Page 62 of 129
CubeSuite Ver.1.40
APPENDIX A WINDOW REFERENCE
Export file name for func-
This property appears only when the [Export the functions and variables] property is set to
tions
[Yes].
Specify the name of the information file (Function list file (*.csfl)) generated.
Default
%ProjectName%.csfl
Modifying
Directly enter from the keyboard.
Note that the extension cannot be changed.
"%ProjectName%" indicates a macro name that replaces itself with the
project name.
Export file name for vari-
This property appears only when the [Export the functions and variables] property is set to
ables
[Yes].
Specify the name of the information file (Variable list file (*.csvl)) generated.
Default
%ProjectName%.csvl
Modifying
Directly enter from the keyboard.
Note that the extension cannot be changed.
"%ProjectName%" indicates a macro name that replaces itself with the
project name.
(3) [Analysis Chart1 - 4]
The detailed information on analysis graphs is displayed and its configuration can be changed.
For details on the analysis graph, see "2.11 Display Analysis Information in Chart".
Caution
The contents of the Analysis Chart panel is updated automatically if you change the setting of
the property in this category.
Settings upper/lower
Specify whether to set upper bounds and lower bounds for graphs on the [Variable Value
bound of the range of
Changing Chart] tab of the Analysis Chart panel.
view 1 - 4
Default
No
Modifying
Select from the drop-down list.
Available
Yes
Sets upper bounds and lower bounds.
No
Does not set upper bounds and lower bounds.
values
Upper bound of the range
This property appears only when the [Settings upper/lower bound of the range of view 1 - 4]
of view 1 - 4
property is set to [Yes].
Specify the value of the upper bound of the Y-axis.
Default
2147483647
Modifying
Directly enter from the keyboard.
Available
values
- In decimal number
-2147483648 to 4294967295
- In hexadecimal number (the value needs to start with "0x"),
0x80000000 to 0xFFFFFFFF
R20UT0265EJ0100 Rev.1.00
Sep 01, 2010
Page 63 of 129
CubeSuite Ver.1.40
APPENDIX A WINDOW REFERENCE
Lower bound of the range
This property appears only when the [Settings upper/lower bound of the range of view 1 - 4]
of view 1 - 4
property is set to [Yes].
Specify the value of the lower bound of the Y-axis.
Default
-2147483648
Modifying
Directly enter from the keyboard.
Available
values
- In decimal number
-2147483648 to 4294967295
- In hexadecimal number (the value needs to start with "0x"),
0x80000000 to 0xFFFFFFFF
Settings upper/lower
Specify whether to set the effective range of values for graphs on the [Variable Value Chang-
bound of the range of
ing Chart] tab of the Analysis Chart panelNote.
valid value 1 - 4
Default
No
Modifying
Select from the drop-down list.
Available
Yes
Sets the effective range of values.
No
Does not set the effective range of values.
values
Upper bound of the range
This property appears only when the [Settings upper/lower bound of the range of valid value 1
of valid value 1 - 4
- 4] property is set to [Yes].
Specify the value of the upper bound of the effective range of values.
A transition to a larger value than the value specified here is not displayed on the graph.
Default
2147483647
Modifying
Directly enter from the keyboard.
Available
values
- In decimal number
-2147483648 to 4294967295
- In hexadecimal number (the value needs to start with "0x"),
0x80000000 to 0xFFFFFFFF
Lower bound of the range
This property appears only when the [Settings upper/lower bound of the range of valid value 1
of valid value 1 - 4
- 4] property is set to [Yes].
Specify the value of the lower bound of the effective range of values.
A transition to a smaller value than the value specified here is not displayed on the graph.
Default
-2147483648
Modifying
Directly enter from the keyboard.
Available
values
- In decimal number
-2147483648 to 4294967295
- In hexadecimal number (the value needs to start with "0x"),
0x80000000 to 0xFFFFFFFF
Display the legend 1 - 4
Specify whether to display a legend for graphs on the [Variable Value Changing Chart] tab of
the Analysis Chart panel.
Default
Yes
Modifying
Select from the drop-down list.
Available
Yes
Displays a legend.
No
Does not display a legend.
values
R20UT0265EJ0100 Rev.1.00
Sep 01, 2010
Page 64 of 129
CubeSuite Ver.1.40
APPENDIX A WINDOW REFERENCE
Location of the legend 1 -
This property appears only when the [Display the legend 1 - 4] property is set to [Yes].
4
Specify the location where the explanatory notes are displayed.
Default
Leftside
Modifying
Select from the drop-down list.
Available
Upside
Displays on the upper part of graphs.
Downside
Displays on the lower part of graphs.
Leftside
Displays on the left part of graphs.
Rightside
Displays on the right part of graphs.
values
The number of functions
Specify the number of the functions displayed on the [Execution Time(Percentage) Chart] tab
displaying in the Execu-
of the Analysis Chart panel.
tion Time(Percentage)
The function with a large ratio of the execution time is displayed in the graph by priority, and
Chart 1 - 4
the remainder is collectively displayed as "Others".
Default
10
Modifying
Directly enter from the keyboard.
Available
Integer number between 1 and 100
values
Note The valid range setting only applies to the panel displaying the chart of graph data acquired via Real-time
sampling analysis.
R20UT0265EJ0100 Rev.1.00
Sep 01, 2010
Page 65 of 129
CubeSuite Ver.1.40
APPENDIX A WINDOW REFERENCE
Function List panel
This panel is used to display the acquired function information.
See "2.1 Overview" for details on how to display the function information.
Caution
[CA78K0][CA78K0R][CA850]
When [Clean Project] from the [Build] menu is selected, the contents currently being displayed in
this panel will be cleared.
Figure A-5. Function List Panel
[Toolbar]
(1)
(2)
The following items are explained here.
- [How to open]
- [Description of each area]
- [Toolbar]
- [[File] menu (Function List panel-dedicated items)]
- [[Edit] menu (Function List panel-dedicated items)]
- [Context menu]
[How to open]
- On the toolbar in the Main window, click the
button.
- From the [View] menu, select [Program Analyzer] >> [Function List].
[Description of each area]
(1) Header area
(a) Column name
The name of the item of the acquired function information is displayed.
Marks (icons) that are displayed at the name of the item indicate as follows:
Mark (Icon)
/
Meaning
Indicates whether display is locked (see "2.5.3 Lock the specific column to display").
R20UT0265EJ0100 Rev.1.00
Sep 01, 2010
Page 66 of 129
CubeSuite Ver.1.40
APPENDIX A WINDOW REFERENCE
Mark (Icon)
Meaning
/
Indicates whether there is a sort order setting (see "2.5.4 Sort the analysis information").
/
Indicates whether there is a filter display setting (see "2.5.5 Filter the analysis information").
Indicates that a message relating to information about this item has been output to the Output
panel. Hover the mouse over it to display a pop-up with the last message to be output.
Remark
Columns to display can be customized via mouse operations in this area.
- Set the columns to display
- Change the order of the columns to display
- Lock the specific column to display
(b) Button
Opens the Column Chooser dialog box in order to sort and show/hide the items (columns) displayed in the panel, and return customized settings to the defaults (see "2.5 Customize Display
Method").
(2) Information area
This area displays the acquired function information.
The analyze tool acquires two types of function information: Static analysis information and Dynamic analysis information. The timing when each type of information can be displays differs (see "1.1.2 Types of analysis information").
When the active project is changed while displaying the function information, the function information of the target
project is displayed. Note, however, that if the cross reference information has not been generated in the project or
the analyze tool is not supported by the project, nothing is displayed on this panel.
The value of the information that has been changed because of the execution of a program is shown highlighted
(the color depends on the configuration in the [General - Font and Color] category of the Option dialog box). To
reset the highlighting, click the
button on the toolbar.
The items and details acquired as function information are as follows:
Item
Function Name
Type
Contents
Static
Displays the name of the global function or the file-internal static function that is
analysis
defined/referenced in the C source file.
The maximum display characters is as follows:
- [CA78K0][CA78K0R]: 249 characters
- [CA850]:
1022 characters
- [CX]:
2046 characters
The meanings of an icon displayed is as follows:
File Name
:
A function
Static
Displays the file name (without path) of the C source file where the function is
analysis
defined.
Note, however, that if it is not defined in a C source file in project, or if analysis was
not completed, then this will display "(No Definition)".
If it is defined in a header file, then the name of the header file is displayed.
File PassNote 1
Static
Displays the absolute path of the C source file where the function is defined.
analysis
Note, however, that if it is not defined in a C source file in project, or if analysis was
not completed, then this will be blank.
If it is defined in a header file, then the absolute path of the header file is displayed.
R20UT0265EJ0100 Rev.1.00
Sep 01, 2010
Page 67 of 129
CubeSuite Ver.1.40
Item
APPENDIX A WINDOW REFERENCE
Type
PE Information
Static
[V850E2M]
analysis
Contents
Displays the following information about PE in which the function is executed.
- In PEn:
PEn
- In common PE: Common
- Unknown:
-
Note that this item appears only when the selected microcontroller version supports
multi-core.
ImportNote 1
Static
analysis
Displays the following information about the source of the function information.
- If it was acquired from inside an active project
"Original" is displayed.
- If it was acquired from an import file
The names of all import files are displayed.
- If it was acquired from inside an active project and an import file
"Original" and the names of all import files are displayed.
See "2.10 Import or Export Information File" for details on the import function.
Attribute
Static
Displays the function's symbol attributes/symbol-modifier attributes.
analysis
If there are multiple attributes, then they are displayed separated by commas (",").
Note, however, that this will display "-" if analysis is not complete.
The following attributes can be displayed.
- [CA78K0]
static, callt, callf, noauto, norec, interrupt, bank, rtos task, rtos interrupt
- [CA78K0R]
static, callt, interrupt, near, far, rtos task, rtos interrupt
- [CA850]
static
- [CX ]
static, interrupt, inline, delete
Return Type
Static
Displays the return type of the functionNote 2.
analysis
If including an alternative name by using "#define statement" or "typedef statement", then not the alternative name but the type is displayed.
Note, however, that this will display "-" if analysis is not complete.
The maximum number of pointers that can be displayed is as follows:
- [CA78K0][CA78K0R]: 7
Arguments CountNote 1
- [CA850]:
6
- [CX]:
8
Static
Displays the argument value of the function in decimal number notation.
analysis
If including a variable argument parameter, then the string "variable" is added.
Note, however, that this will display "-" if analysis is not complete.
R20UT0265EJ0100 Rev.1.00
Sep 01, 2010
Page 68 of 129
CubeSuite Ver.1.40
Item
Arguments
APPENDIX A WINDOW REFERENCE
Type
Contents
Note 2
Static
Displays the argument type
analysis
/formal argument name of the function.
If there are multiple arguments, then they are displayed separated by commas (",").
For a variable argument, only the argument type that has been defined is displayed.
If there are no arguments, then "void" is displayed.
If including an alternative name by using "#define statement" or "typedef statement", then not the alternative name but the type is displayed.
Note, however, that this will display "-" if analysis is not complete.
The maximum number of pointers that can be displayed is as follows (the first
dimension of an array is handled as a pointer):
- [CA78K0][CA78K0R]: 8
Code Size[Bytes]
Stack Size[Bytes]
- [CA850]:
6
- [CX]:
8
Static
Displays the function's code size in decimal number notation.
analysis
Note, however, that this will display "-" if analysis is not complete.
Static
Displays the function's stack size in decimal number notation.
analysis
Note, however, that this will display "-" if analysis is not complete.
[CA78K0][CA78K0R]
The value displayed here is stack size secured by the compiler in the first function
or first basic block. For this reason, it will be different from the stack size displayed by the stack usage tracer. It also does not include the stack size used by
CALL/PUSH/POP instruction inside the function.
Start Address
Static
Displays the function's start address in hexadecimal number notation.
analysis
The number of digits to display is equivalent to the maximum address value of the
selected microcontroller.
Note, however, that this will display "-" if analysis is not complete.
End AddressNote 1
Static
Displays the end address of the function aligned in ROM in hexadecimal number
analysis
notation.
The number of digits to display is equivalent to the maximum address value of the
selected microcontroller.
Note, however, that this will display "-" if analysis is not complete.
Reference Count
Static
Displays the number of times the function is referenced in the program, in decimal
analysis
number notation. Prototype declarations are also counted as references.
Code in C source files that is referenced but is eliminated by the preprocessor during compilation (e.g. via "#if" or "#ifdef" statements) is not included in the number of
references (it is also not output by the search results from [Find All References] in
the context menu).
Note, however, that this will display "-" if analysis is not complete.
[CA78K0][CA78K0R]
The function names included in "#pragma directive" are also counted as references.
[CX]
References to functions via assignment to function pointers are not included in
the reference count.
R20UT0265EJ0100 Rev.1.00
Sep 01, 2010
Page 69 of 129
CubeSuite Ver.1.40
APPENDIX A WINDOW REFERENCE
Item
Type
Contents
Execution Count
Dynamic
Displays the number of times the function was executed (called) as a result of pro-
[IECUBE]
analysis
gram execution, in decimal number notationNote 3.
This function counts the number of times that the instruction located at the address
[IECUBE2]
allocated to the function label is executed. For this reason, an invalid value may be
[Simulator]
displayed if the measurement starts midway through the execution of a function.
Note, however, that this will display "-" if the debug tool's Trace function is disabled,
or analysis is not complete.
Execution Time[unit]
Dynamic
Displays the execution time of the function (the time executing the code in the func-
[IECUBE [78K0R]]
analysis
tion body, not including subroutines)Note 3, 4.
The unit of time can be changed by selecting [Unit of Time] from the [Toolbar], or
[IECUBE [V850]]
from the Property panel's [Settings] tab, in the [General] category, changing the
[IECUBE2]
[Unit of time] property (see the [Unit of time] property in the Property panel for
[Simulator]
details on the time-display format).
Note, however, that this will display "-" if the debug tool's Trace function is disabled,
or analysis is not complete.
Execution Time(Per-
Dynamic
Displays the proportion of total execution time (range that could be obtained as
centage)[%]
analysis
trace data) taken by the execution time of the target function, rounded to the near-
[IECUBE [78K0R]]
est two decimal places, in the range 0.00 to 100.00Note 3, 4.
[IECUBE [V850]]
The level of shading of the cell's background color indicates the proportion.
[IECUBE2]
Note, however, that this will display "-" if the debug tool's Trace function is disabled,
or analysis is not complete.
[Simulator]
Execution Time(Aver-
Dynamic
Displays the average execution time of the function ("execution time" / "number of
age)[unit]
analysis
executions")Note 3, 4.
[IECUBE [78K0R]]
The results of calculation are displayed rounded to the nearest nanosecond.
[IECUBE [V850]]
The unit of time can be changed by selecting [Unit of Time] from the [Toolbar], or
[IECUBE2]
from the Property panel's [Settings] tab, in the [General] category, changing the
[Unit of time] property.
[Simulator]
The unit of time can be changed by selecting [Unit of Time] from the [Toolbar], or
from the Property panel's [Settings] tab, in the [General] category, changing the
[Unit of time] property (see the [Unit of time] property in the Property panel for
details on the time-display format).
Note, however, that this will display "-" if the debug tool's Trace function is disabled,
or analysis is not complete.
Code Coverage[%]
Dynamic
Displays the code coverage ratio of the function (C0: "number of bytes of code exe-
[IECUBE]
analysis
cuted in the address range" / "function’s code size" x 100)Note 5.
The level of shading of the cell's background color indicates the code coverage.
[IECUBE2]
Note, however, that this will display "-" if the debug tool's Coverage function is dis-
[Simulator]
abled, or analysis is not complete.
Notes 1.
This item does not appear by default.
See "2.5.1 Set the columns to display" for details on how to display this item.
2.
If a "typedef" has been used assign a different name to a basic type, the following types are displayed.
Original Type of "typedef"
- unsigned long
Type Displayed
unsigned long
- unsigned int
R20UT0265EJ0100 Rev.1.00
Sep 01, 2010
Page 70 of 129
CubeSuite Ver.1.40
APPENDIX A WINDOW REFERENCE
Original Type of "typedef"
Type Displayed
- signed long
long
- signed int
- long
- int
- unsigned short
unsigned short
- signed short
short
- short
- unsigned char
unsigned char
- char (when "-Xchar=unsigned" option is specified)
- signed char
char
- char (when "-Xchar=unsigned" option is not specified)
3.
Set the [Accumulate result of analysis] property in the [General] category on the [Settings] tab of the
Property panel to [Yes] to display the cumulative value for each program execution.
4.
The execution time does not include the execution time of the runtime libraries provided by the compiler.
5.
The code coverage ratio is calculated with the cumulative value for each program execution.
If you need to reset the code coverage ratio, select [Clear Coverage Information] from the context menu
of the Editor panel or Disassemble panel, and then click the
button.
Furthermore, as the result of a build after editing the program, if the function's allocated address is different from its allocated address at the time of the previous build, the code coverage ratio for the function that has not been executed may be displayed.
In the bottom of the [Function Name] item, the following information for each file is shown as [*Total*].
Note that "(No Definition)" displayed in the [File Name] item is treated as one file.
Figure A-6. [*Total*] Display (Function List Panel)
Display
*Total*
Type
-
Item
File Name
Note
R20UT0265EJ0100 Rev.1.00
Sep 01, 2010
Contents
The target file name
File Pass
File pass of the target file
Code Size[Bytes]
Total of the function's code size in the target file
Reference Count
Total number of times functions are referenced in the target file
Execution Count
Total number of times functions were executed in the target file
Execution Time[unit]
Total of the execution time of functions in the target file
Execution Time(Per-
The proportion of total execution time (range that could be obtained as
centage)[%]
trace data) taken by the execution time of functions in the target file
Code Coverage[%]
The code coverage ratio of functions in the target file
Page 71 of 129
CubeSuite Ver.1.40
APPENDIX A WINDOW REFERENCE
Note This item does not appear by default.
See "2.5.1 Set the columns to display" for details on how to display this item.
Cautions 1.
[IECUBE [78K0]]
The following items are not supported.
[Execution Time[unit]] / [Execution Time(Percentage)[%]] / [Execution Time(Average)[unit]]
2.
[IECUBE [78K0R]]
"0" is output as the first trace-data time tag during program execution.
For this reason, if the user repeatedly starts and stops execution, or performs step execution, the [Execution Time[unit]] / [Execution Time(Percentage)[%]] / [Execution Time(Average)[unit]] items will be invalid.
3.
[IECUBE [V850]]
If step execution (step in and step over execution) was performed, the values output in the
time tags of the trace data will be invalid.
As a result, the [Execution Time[unit]] / [Execution Time(Percentage)[%]] / [Execution
Time(Average)[unit]] items will be invalid.
Moreover, the [Code Coverage[%]] item does not appear when the coverage board is not
mounted on IECUBE to be used.
4.
[CA78K0][CA78K0R]
If a source file with the same name exists in a project, the build tool rewrites the cross reference information of them. Therefore, the information of other than the source file that has
been compiled last in files with the same name cannot be acquired.
5.
[CX]
Unused static functions deleted via compiler optimization cannot be displayed in the panel.
6.
Values of the following items for the system library functions cannot be acquired.
[Return Type]/[Arguments Count]/[Arguments]/[Code Size[Bytes]]/[Stack Size[Bytes]]/[End
Address]/[Execution Time[unit]]/[Execution Time(Percentage)[%]]/[Execution Time(Average)[unit]]/[Code Coverage[%]]
7.
The items of the Dynamic analysis information do not appear while disconnecting from the
debug tool (default).
Remarks 1.
The display of each type of information can be customized as follows:
- Sort the analysis information
- Filter the analysis information
2.
The current row mark (
) on the left edge of this area indicates that the column in question is the
current row.
The following operations can be performed on the current row:
- Jump to Defined Location
- Set Break Events
- Display List of Referencing Location
R20UT0265EJ0100 Rev.1.00
Sep 01, 2010
Page 72 of 129
CubeSuite Ver.1.40
APPENDIX A WINDOW REFERENCE
[Toolbar]
The toolbar provides the following items and functions.
Note that all these items are invalid during execution of a program.
Acquires the latest data from the debug tool, and updates the contents of this panel.
Displays the latest information automatically by acquiring the information each time program execution
stops.
Note that this button is invalid when the [Refresh at program stop] property in the [General] category on
the [Settings] tab of the Property panel is set to other than [Specify Individually] (this button is locked in
accordance with the setting on the Property panel).
Resets highlighting of values that have been changed by executing a program.
Displays only the information value for functions in a file(s)/category(s) currently selected in the Project
Tree panel (see "(a) Linking with the Project Tree panel").
Displays only the information value for functions starting with the word at the caret position in the Editor
panel (see "(b) Linking with the Editor panel").
Displays only the information value for functions in the Common area and PE currently selected in the
Debug Manager panel (see "(c) Linking with the Debug Manager panel [V850E2M]").
Note that this button is invalid when the selected microcontroller version does not support multi-core. or
while disconnecting from the debug tool.
Unit of Time
The following cascade menus are displayed to specify the time unit for the analyze tool.
The setting of the [Unit of time] property in the [General] category on the [Settings] tab of the Property
panel is specified by default.
The time unit set in this toolbar is reflected in the Property panel.
H:M:S
Displays the time as "hours, minutes (0 - 59), seconds (0 - 59)".
Second
Displays the time in second units. The value is rounded to three decimal places.
Millisecond
Displays the time in millisecond units. The value is rounded to three decimal places.
Microsecond
Displays the time in microsecond units. The value is rounded to three decimal places.
Nanosecond
Displays the time in nanosecond units. The value is rounded to integer number.
[[File] menu (Function List panel-dedicated items)]
The [File] menu for this panel provides the following items and functions.
Save Function List Data
Overwrites the contents of this panel to the previously saved file (see "2.12 Save Analysis
Information").
Note that when the file has never been saved or the file is write disabled, the same operation is applied as the selection in [Save Function List Data As...].
Save Function List Data As...
Opens the Save As dialog box to newly save the contents of this panel to the specified text
file (see "2.12 Save Analysis Information").
[[Edit] menu (Function List panel-dedicated items)]
The [Edit] menu for this panel provides the following items and functions.
Copy
Copies the contents of the selected column (multiple selections possible) to the clipboard
as character strings separated by tabs.
Note that the contents of the clipboard cannot be pasted to this panel.
Select All
R20UT0265EJ0100 Rev.1.00
Sep 01, 2010
Selects all the columns being displayed in this panel.
Page 73 of 129
CubeSuite Ver.1.40
APPENDIX A WINDOW REFERENCE
[Context menu]
The context menu displayed by right-clicking on this panel provides the following items and functions.
Find All References
Displays a list of the locations referencing the function(s) of the selected row(s), in the Output panel’s [Find References] tab (see "2.9 Display List of Referencing Location").
Set Break to Function
Sets a breakpoint at the first line of the function at the current row (the first executable line
in the target function) (see "2.7.1 Set a breakpoint to a function").
Note that this item is invalid while disconnecting from the debug tool.
Jump to Source
Opens the Editor panel and displays the source file in which the function of the current row
is defined (see "2.6 Jump to Defined Location").
Jump to Disassemble
Opens the Disassemble panel (Disassemble1) and displays the disassemble data corresponding to the start address of the function of the current row (see "2.6 Jump to Defined
Location").
Note that this item is invalid while disconnecting from the debug tool.
Jump to Memory
Opens the Memory panel (Memory1) and displays the memory list corresponding to the
start address of the function of the current row (see "2.6 Jump to Defined Location").
Note that this item is invalid while disconnecting from the debug tool.
Copy
Copies the contents of the selected row(s) to the clipboard as character strings separated
by tabs.
Note that the contents of the clipboard cannot be pasted to this panel.
R20UT0265EJ0100 Rev.1.00
Sep 01, 2010
Page 74 of 129
CubeSuite Ver.1.40
APPENDIX A WINDOW REFERENCE
Variable List panel
This panel is used to display the acquired variable information.
See "2.1 Overview" for details on how to display the variable information.
Caution
[CA78K0][CA78K0R][CA850]
When [Clean Project] from the [Build] menu is selected, the contents currently being displayed in
this panel will be cleared.
Figure A-7. Variable List Panel
[Toolbar]
(1)
(2)
The following items are explained here.
- [How to open]
- [Description of each area]
- [Toolbar]
- [[File] menu (Variable List panel-dedicated items)]
- [[Edit] menu (Variable List panel-dedicated items)]
- [Context menu]
[How to open]
- On the toolbar in the Main window, click the
button.
- From the [View] menu, select [Program Analyzer] >> [Variable List].
[Description of each area]
(1) Header area
(a) Column name
The name of the item of the acquired variable information is displayed.
Marks (icons) that are displayed at the name of the item indicate as follows:
Mark (Icon)
Meaning
/
Indicates whether display is locked (see "2.5.3 Lock the specific column to display").
/
Indicates whether there is a sort order setting (see "2.5.4 Sort the analysis information").
/
Indicates whether there is a filter display setting (see "2.5.5 Filter the analysis information").
R20UT0265EJ0100 Rev.1.00
Sep 01, 2010
Page 75 of 129
CubeSuite Ver.1.40
APPENDIX A WINDOW REFERENCE
Mark (Icon)
Meaning
Indicates that a message relating to information about this item has been output to the Output
panel. Hover the mouse over it to display a pop-up with the last message to be output.
Remark
Columns to display can be customized via mouse operations in this area.
- Set the columns to display
- Change the order of the columns to display
- Lock the specific column to display
(b) Button
Opens the Column Chooser dialog box in order to sort and show/hide the items (columns) displayed in the panel, and return customized settings to the defaults (see "2.5 Customize Display Method").
(2) Information area
This area displays the acquired variable information.
The analyze tool acquires two types of function information: Static analysis information and Dynamic analysis information. The timing when each type of information can be displays differs (see "1.1.2 Types of analysis information").
When the active project is changed while displaying the variable information, the variable information of the target
project is displayed. Note, however, that if the cross reference information has not been generated in the project or
the analyze tool is not supported by the project, nothing is displayed on this panel.
The value of the information that has been changed because of the execution of a program is shown highlighted
(the color depends on the configuration in the [General - Font and Color] category of the Option dialog box). To
reset the highlighting, click the
button on the toolbar.
The items and details acquired as variable information are as follows:
Item
Variable Name
Type
Contents
Static
Displays the name of the global variable, the file-internal static variable or the static
analysis
variable inside functions that is defined/referenced in the C source file.
Moreover, displays the name of SFR/IOR being used in the program when the [Display the SFR/IOR] property in the [General] category on the [Settings] tab of the
Property panel is set to [Yes].
The maximum display characters is as follows:
- [CA78K0][CA78K0R]: 249 characters
- [CA850]:
1022 characters
- [CX]:
2046 characters
The meanings of icons displayed are as follows:
R20UT0265EJ0100 Rev.1.00
Sep 01, 2010
-
:
A variable
-
:
A SFR [78K0][78K0R] or an IOR [V850]
Page 76 of 129
CubeSuite Ver.1.40
Item
File Name
APPENDIX A WINDOW REFERENCE
Type
Contents
Static
Displays the file name (without path) of the C source file where the variable is
analysis
definedNote 1.
Note, however, that if it is not defined in a C source file in project, or if analysis was
not completed, then this will display "(No Definition)".
If it is defined in a header file, then the name of the header file is displayed.
[CA78K0][CA78K0R]
If a line with a variable described in "extern declaration" and a line with the variable definition exist in the same file, the information of the variable definition cannot be acquired. Consequently, in this case, this item will display "(No
Definition)".
Function NameNote 1
File PathNote 1
Static
Displays the name of the function where the variable is defined.
analysis
Note, however, this will be blank for other than static variables inside functions.
Static
Displays the absolute path of the C source file where the variable is defined.
analysis
Note, however, that if it is not defined in a C source file in project, or if analysis was
not completed, then this will be blank.
If it is defined in a header file, then the absolute path of the header file is displayed.
PE Information
Static
Displays the following information about PE from which the variable can be
[V850E2M]
analysis
accessed.
- From PEn:
PEn
- From common PE: Common
- Unknown:
-
Note that this item appears only when the selected microcontroller version supports
multi-core.
ImportNote 1
Static
analysis
Displays the following information about the source of the variable information.
- If it was acquired from inside an active project
"Original" is displayed.
- If it was acquired from an import file
The names of all import files are displayed.
- If it was acquired from inside an active project and an import file
"Original" and the names of all import files are displayed.
See "2.10 Import or Export Information File" for details on the import function.
Attribute
Static
Displays the variable's symbol attributes/symbol-modifier attributes.
analysis
If there are multiple attributes, then they are displayed separated by commas (",").
Note, however, that this will display "-" if analysis is not complete.
The following attributes can be displayed.
- [CA78K0]
static, const, volatile, sreg, rwsfr, rosfr, wosfr
- [CA78K0R]
static, const, volatile, sreg, rwsfr, rosfr, wosfr, near, far
- [CA850]
static
- [CX]
static, ior, const, volatile, delete
R20UT0265EJ0100 Rev.1.00
Sep 01, 2010
Page 77 of 129
CubeSuite Ver.1.40
Item
Type
APPENDIX A WINDOW REFERENCE
Type
Contents
Note 2
Static
Displays the type of the variable
analysis
.
If including an alternative name by using "#define statement" or "typedef statement", then not the alternative name but the type is displayed.
Note, however, that this will display "-" if analysis is not complete.
The maximum number of pointers that can be displayed is as follows (up to 4
dimensions for an array can be displayed):
- [CA78K0][CA78K0R]: 8
Members
- [CA850]:
6
- [CX]:
8
Static
Displays the members of the structure/union.
analysis
If there are multiple members, then they are displayed separated by commas (",").
Note, however, that this will display "-" if other than structures/unions or analysis is
not complete.
Address
Static
Displays the variable's allocated address in hexadecimal number notation.
analysis
The number of digits to display is equivalent to the maximum address value of the
selected microcontroller.
Note, however, that this will display "-" if analysis is not complete.
Size[Bytes]
Static
Displays the variable's size in decimal number notation.
analysis
Note, however, that this will display "-" for bit variables or the like that cannot be displayed in bytes, or if analysis is not complete.
Reference Count
Static
Displays the number of times the variable is referenced in the program, in decimal
analysis
number notation.
The location where the variable is defined is also counted. The totals for structures,
unions, and arrays are displayed at the variable level (references to individual
members and array elements are not shown).
Code in C source files that is referenced but is eliminated by the preprocessor during compilation (e.g. via "#if" or "#ifdef" statements) is not included in the number of
references (it is also not output by the search results from [Find All References] in
the context menu).
Note, however, that this will display "-" if analysis is not complete.
[CX]
In the definition of variables, a line with an assignment statement (e.g. "int variable = 10") is counted.
"variable++;" is interpreted as "variable = variable + 1". Therefore, this variable is
counted twice.
Read Count
[IECUBE]
Dynamic
Displays the number of times the variable was read, in decimal number notationNote
analysis
3, 4
.
For structures and unions, reads are counted at the structure/union variable level
[IECUBE2]
(the number of reads at the individual member and element levels are not shown).
[Simulator]
Note, however, that this will display "-" if the debug tool's Trace function is disabled,
or if analysis is not complete.
Write Count
Dynamic
Displays the number of times the variable was written, in decimal number nota-
[IECUBE]
analysis
tionNote 3, 4.
[IECUBE2]
[Simulator]
For structures and unions, writes are counted at the structure/union variable level
(the number of writes at the individual member and element levels are not shown).
Note, however, that this will display "-" if the debug tool's Trace function is disabled,
or if analysis is not complete.
R20UT0265EJ0100 Rev.1.00
Sep 01, 2010
Page 78 of 129
CubeSuite Ver.1.40
APPENDIX A WINDOW REFERENCE
Item
Type
Note 1
Contents
Read/Write Count
Dynamic
Displays the number of times the variable was read/written, in decimal number
[IECUBE]
analysis
notationNote 3, 4.
For structures and unions, reads/writes are counted at the structure/union variable
[IECUBE2]
level (the number of reads/writes at the individual member and element levels are
[Simulator]
not shown).
It may not be possible to analyze reads/writes of variables is segments where
variables have been assigned to registers via compiler optimization. For this
reason, reads/writes in such sections will not be counted.
Note, however, that this will display "-" if the debug tool's Trace function is disabled,
or if analysis is not complete.
Minimum Value
Dynamic
Displays the minimum measurement time from the results of program execution, in
[IECUBE]
analysis
decimal number notationNote 3.
Note, however, that this will display "-" if for bit type variables/boolean type vari-
[IECUBE2]
ables/structures/unions/arrays/pointer, if the debug tool's Trace function is disabled,
[Simulator]
or if analysis is not complete.
[CA78K0][CA78K0R]
Only a variable/SFR less than or equal to 2 bytes can be displayed.
[CA850][CX]
Only a variable/IOR less than or equal to 4 bytes can be displayed.
Maximum Value
Dynamic
Displays the maximum measurement time from the results of program execution, in
[IECUBE]
analysis
decimal number notationNote 3.
Note, however, that this will display "-" if for bit type variables/boolean type vari-
[IECUBE2]
ables/structures/unions/arrays/pointer, if the debug tool's Trace function is disabled,
[Simulator]
or if analysis is not complete.
[CA78K0][CA78K0R]
Only a variable/SFR less than or equal to 2 bytes can be displayed.
[CA850][CX]
Only a variable/IOR less than or equal to 4 bytes can be displayed.
Data Coverage[%]
Dynamic
Displays the data coverage ratio of the variable ("number of bytes accessed in the
[IECUBE [78K0]]
analysis
address range" / "variable size" x 100)Note 5.
[IECUBE [78K0R]]
The level of shading of the cell's background color indicates the data coverage.
Note, however, that this will display "-" if the debug tool's Coverage function is dis-
[Simulator]
abled, or if analysis is not complete.
Notes 1.
This item does not appear by default.
See "2.5.1 Set the columns to display" for details on how to display this item.
2.
[CX]
If a "typedef" has been used assign a different name to a basic type, the following types are displayed.
Original Type of "typedef"
- unsigned long
Type Displayed
unsigned long
- unsigned int
- signed long
long
- signed int
- long
- int
- unsigned short
R20UT0265EJ0100 Rev.1.00
Sep 01, 2010
unsigned short
Page 79 of 129
CubeSuite Ver.1.40
APPENDIX A WINDOW REFERENCE
Original Type of "typedef"
Type Displayed
- signed short
short
- short
- unsigned char
unsigned char
- char (when "-Xchar=unsigned" option is specified)
- signed char
signed char
- char (when "-Xchar=unsigned" option is not specified)
3.
Set the [Accumulate result of analysis] property in the [General] category on the [Settings] tab of the
Property panel to [Yes] to display the cumulative value for each program execution.
4.
The calculation is based on the acquired trace data. So for example, if one write to a 4-byte area was
output in the trace data as the upper 2 bytes and the lower 2 bytes, then two times will be displayed.
5.
The data coverage ratio is calculated with the cumulative value for each program execution.
If you need to reset the data coverage ratio, select [Clear Coverage Information] from the context menu
of the Editor panel or Disassemble panel, and then click the
button.
Furthermore, as the result of a build after editing the program, if the variable's allocated address is different from its allocated address at the time of the previous build, the data coverage ratio for the variable that has not been accessed may be displayed.
In the bottom of the [Variable Name] item, the following information for each file is shown as [*Total*].
Note that "(No Definition)" displayed in the [File Name] item is treated as one file.
Figure A-8. [*Total*] Display (Variable List Panel)
Display
*Total*
Type
-
Item
File Name
Note
Contents
The target file name
File Pass
File pass of the target file
Size[Bytes]
Total of the variable's size in the target file
Reference Count
Total number of times variables are referenced in the target file
Read Count
Total number of times variables were read in the target file
Write Count
Total number of times variables were written in the target file
Read/Write Count
Total number of times variables were read/written in the target file
Data Coverage[%]
The data coverage ratio of variables in the target file
Note This item does not appear by default.
See "2.5.1 Set the columns to display" for details on how to display this item.
Cautions 1.
The [Read Count]/[Write Count]/[Read/Write Count]/[Data Coverage[%]] item for a bit type
variable or a boolean type variable is measured by counting the number of accesses to the
address that the variable is being allocated.
Consequently, if bit type variables or boolean type variables are allocated to the same
address, these items above will display the same value.
R20UT0265EJ0100 Rev.1.00
Sep 01, 2010
Page 80 of 129
CubeSuite Ver.1.40
2.
APPENDIX A WINDOW REFERENCE
[CA78K0][CA78K0R]
If a source file with the same name exists in a project, the build tool rewrites the cross reference information of them. Therefore, the information of other than the source file that has
been compiled last in files with the same name cannot be acquired.
3.
[CA850]
If there are assembler instructions coded between "#pragma asm" and "#pragma endasm",
then the registers and instructions coded in that location will be displayed as variables.
4.
[CX]
Unused variables deleted via compiler optimization are not displayed.
5.
The items of the Dynamic analysis information do not appear while disconnecting from the
debug tool (default).
Remarks 1.
If static variables inside functions with the same name are declared in a function, they are handled
as follows:
[CA78K0][CA78K0R][V850]
- [Variable Name]/[File Name]/[Function Name]/[File Path]/[Import]
The information of the variable that is first declared in a function is displayed.
- [Reference Count]
All number of times the variable declared in a function is referenced is displayed.
- Items other than listed above
The information of the variable that is last declared in a function is displayed.
[CX]
- [Type]/[Members]
The information of the variable that is first declared in a function is displayed.
- Items other than listed above
The information of the variable that is first declared in a function is displayed.
2.
The display of each type of information can be customized as follows:
- Sort the analysis information
- Filter the analysis information
3.
The current row mark (
) on the left edge of this area indicates that the column in question is the
current row.
The following operations can be performed on the current row:
- Jump to Defined Location
- Register Watch-Expressions
- Display List of Referencing Location
[Toolbar]
The toolbar provides the following items and functions.
Note that all these items are invalid during execution of a program.
Acquires the latest data from the debug tool, and updates the contents of this panel.
Displays the latest information automatically by acquiring the information each time program execution stops.
Note that this button is invalid when the [Refresh at program stop] property in the [General] category on the
[Settings] tab of the Property panel is set to other than [Specify Individually] (this button is locked in accordance with the setting on the Property panel).
Resets highlighting of values that have been changed by executing a program.
Displays only the information value for variables in a file(s)/category(s) currently selected in the Project Tree
panel (see "(a) Linking with the Project Tree panel").
R20UT0265EJ0100 Rev.1.00
Sep 01, 2010
Page 81 of 129
CubeSuite Ver.1.40
APPENDIX A WINDOW REFERENCE
Displays only the information value for variables starting with the word at the caret position in the Editor panel
(see "(b) Linking with the Editor panel").
Displays only the information value for variables in the Common area and PE currently selected in the Debug
Manager panel (see "(c) Linking with the Debug Manager panel [V850E2M]").
Note that this button is invalid when the selected microcontroller version does not support multi-core. or while
disconnecting from the debug tool.
[[File] menu (Variable List panel-dedicated items)]
The [File] menu for this panel provides the following items and functions.
Save Variable List Data
Overwrites the contents of this panel to the previously saved file (see "2.12 Save Analysis
Information").
Note that when the file has never been saved or the file is write disabled, the same operation is applied as the selection in [Save Variable List Data As...].
Save Variable List Data As...
Opens the Save As dialog box to newly save the contents of this panel to the specified text
file (see "2.12 Save Analysis Information").
[[Edit] menu (Variable List panel-dedicated items)]
The [Edit] menu for this panel provides the following items and functions.
Copy
Copies the contents of the selected column (multiple selections possible) to the clipboard
as character strings separated by tabs.
Note that the contents of the clipboard cannot be pasted to this panel.
Select All
Selects all the columns being displayed in this panel.
[Context menu]
The context menu displayed by right-clicking on this panel provides the following items and functions.
Find All References
Displays a list of the locations referencing the variable(s) of the selected row(s), in the Output panel’s [Find References] tab (see "2.9 Display List of Referencing Location").
Register to Analysis Chart1
Registers the variable(s) of the selected row(s) to the Analysis Chart panel (Analysis
Chart1) (see "2.11.1 Graph transitions in variable values").
Note that this item is invalid while disconnecting from the debug tool.
Access Break
The following cascade menus are displayed to set a break event with access condition
(see "2.7.2 Set a break event to a variable").
Note that this item is invalid while disconnecting from the debug tool.
Set Variable Read Break to
Sets a break event with read access condition to the variable of the current row.
Set Variable Write Break to
Sets a break event with write access condition to the variable of the current row.
Set Variable R/W Break to
Sets a break event with read/write access condition to the variable of the current row.
Register to Watch1
Registers the variable(s) of the selected row(s) to the Watch panel (Watch1) as watchexpression(s) (see "2.8 Register Watch-Expressions").
Note that this item is invalid while disconnecting from the debug tool.
Jump to Source
Opens the Editor panel and displays the source file in which the variable of the current row
is defined (see "2.6 Jump to Defined Location").
R20UT0265EJ0100 Rev.1.00
Sep 01, 2010
Page 82 of 129
CubeSuite Ver.1.40
Jump to Memory
APPENDIX A WINDOW REFERENCE
Opens the Memory panel (Memory1) and displays the memory list from the start address
of the variable of the current row (see "2.6 Jump to Defined Location").
Note that this item is invalid while disconnecting from the debug tool.
Copy
Copies the contents of the selected row(s) to the clipboard as character strings separated
by tabs.
Note that the contents of the clipboard cannot be pasted to this panel.
R20UT0265EJ0100 Rev.1.00
Sep 01, 2010
Page 83 of 129
CubeSuite Ver.1.40
APPENDIX A WINDOW REFERENCE
Call Graph panel
This panel is used to display the tree-structured chart (call graph) that indicates calling relationships between functions.
See "2.4 Display Calling Relationships between Functions (Call Graph)" for details on how to display the call graph.
Cautions 1.
If the debug tool to use does not support the Trace function, or if the debug tool's trace function
is not enabled, then the Dynamic analysis information (an execution count) in the call graph
cannot be displayed.
2.
Remark
If a clean is executed in the build tool, the call graph currently being displayed will be erased.
A function whose source file does not exist in the project can be displayed in the call graph if the [Display
the function without definition at Call Graph panel] property in the [General] category on the [Settings] tab of
the Property panel is set to [Yes].
Figure A-9. Call Graph Panel
[Toolbar]
(1)
(2)
The following items are explained here.
- [How to open]
- [Description of each area]
- [Toolbar]
- [[File] menu (Call Graph panel-dedicated items)]
- [[Edit] menu (Call Graph panel-dedicated items)]
- [Context menu]
R20UT0265EJ0100 Rev.1.00
Sep 01, 2010
Page 84 of 129
CubeSuite Ver.1.40
APPENDIX A WINDOW REFERENCE
[How to open]
- On the toolbar in the Main window, click the
button.
- From the [View] menu, select [Program Analyzer] >> [Call Graph].
[Description of each area]
(1) Display setting area
Toggles whether scrolling of content is enabled by dragging the panel directly. By
Scroll button
default, scrolling is disabled.
Note that if scrolling is enabled, then the shape of the mouse cursor will change, and
clicking on a Function box in the call graph will not cause that function to be highlighted (it will not be reflected in the [Target function name] combo box). There will
also not be a Pop-up display with information about the function.
Changes the call graph's zoom ratio. A number between 10 and 109 can be selected
Zoom slider
(by default, 100 is specified).
Changes the call graph's zoom ratio. Each click of one of the buttons decrements/
Zoom in/out button
increments the value of the zoom slider by 1.
Automatically changes the call graph's zoom ratio. The call graph is enlarged or
Fit to panel button
shrunk in accordance with the size of the panel, so that the entire call graph can be
displayed.
Resets the zoom ratio of the call graph to the default value of 100.
Zoom to 100% button
Selects the parent function to target for display in the call graph (it will be at the top of
[Parent function name] combo box
(Left combo box)
the call graph) from the drop-down listNote. By default, the first function to appear
named "main" or containing the word "main" is specified as the parent function (if
there is no corresponding function, it will be empty).
Selects the function to highlight (show in selected state) on the call graph from the follow-
[Target function name] combo box
(Right combo box)
ing drop-down list.
- If the [Parent function name] combo box is empty
The names of all functions in the program
- If a parent function is specified with the [Parent function name] combo box
The names of functions called by that parent function (including child and grandchild functions)
If scrolling via the Scroll button is disabled, then when a function box is clicked in the
call graph, the function's name will be reflected in the combo box.
Note [V850E2M]
If the selected microcontroller version supports multi-core, you can select "PEn". In this case, the call graph
will only be displayed for the functions executed in the selected PEn.
R20UT0265EJ0100 Rev.1.00
Sep 01, 2010
Page 85 of 129
CubeSuite Ver.1.40
APPENDIX A WINDOW REFERENCE
(2) Call graph area
This area displays a call graph indicating calling relationships between functions that have been acquired from the
cross reference information.
By default, the first function to appear named "main" or containing the word "main" is considered to be the parent
function, and that function is placed on the left edge of the call graph (the corresponding parent function name will
be displayed in the [Parent function name] combo box). If there is no corresponding function name, then the functions in the program that are not called by any other functions (reference count = 0) will be considered to be parent
functions, and they will be placed on the leftmost edge (the [Parent function name] combo box will be empty).
Next, the child functions, grandchild functions, and so on will be placed on the call graph, from left to right (they will
be arranged from top to bottom, with the functions to appear first shown topmost).
If an arbitrary parent function is specified in the [Parent function name] combo boxNote, then only the functions
called by that function will appear in the call graph. If the combo box is empty, then all functions in the program will
appear in the call graph.
Note [V850E2M]
If the selected microcontroller version supports multi-core and "PEn" is selected in the [Parent function
name] combo box, the call graph will only be displayed for the functions executed in the selected PEn.
The composition of the call graph is as follows.
Figure A-10. Composition of Call Graph
(a) Function box
(b) Connection line
(a) Function box
The function is displayed in a box format.
The following information is displayed in a function box.
Figure A-11. Information of Function Box
Function name
Definition
Attribute
Condition
Function name
R20UT0265EJ0100 Rev.1.00
Sep 01, 2010
PE information [V850E2M]
Indicates the name of the target function.
Page 86 of 129
CubeSuite Ver.1.40
Definition
APPENDIX A WINDOW REFERENCE
Indicates the location at which the target function is defined with "File name(Line number)".
Note, however, that if the definition information does not exist, then this will display "(No
Definition)".
Attribute
If the target function is a static function, then "<static>" is displayed.
Condition
The current state of the target function is shown in the following background colors.
- Light blue:
Not executed
- Purple:
Executed
PE Information
If the selected microcontroller version supports multi-core, PE in which the target func-
[V850E2M]
tion is assigned is shown in the following shadow colors.
- Gray:
Common
- Red:
PE1
- Green: PE2
- Blue:
PE3
- Orange: PE4
Remark
By double-clicking a function box, you can jump to the location of the source text where the function
is defined (see "2.6 Jump to Defined Location").
Note, however, that this function cannot be used when the scroll function for the call graph is
allowed by using the Scroll button (
button). In this case, select the target function with the
[Target function name] combo box, then select [Jump to Source] from the context menu.
(b) Connection line
If a given function is called statically by another function, then the function boxes of the two functions will be
shown linked by a connection line. Connection lines are only displayed for static function calls. Connection
lines are not displayed for dynamic function calls.
The following information is displayed by each connection line.
Remark
If there are no static function calls but there are dynamic function calls (e.g. if function calls are only
made using function pointers), then this information can be confirmed in the Pop-up display.
Figure A-12. Information of Connection Line
Reference count
Execution count
Reference count
Indicates the number of times static calls have been made.
Execution count
Indicates the number of dynamic calls in parentheses: "( )".
This information is the cumulative value for each program execution when the [Accumulate
result of analysis] property in the [General] category on the [Settings] tab of the Property panel
is set to [Yes].
Note that this information appears only when the trace data exist.
R20UT0265EJ0100 Rev.1.00
Sep 01, 2010
Page 87 of 129
CubeSuite Ver.1.40
Recursive call
Circular call
APPENDIX A WINDOW REFERENCE
A connection line and reference count is displayed as follows when a function calls itself.
As an example, say that there are functions A, B, and C. If A calls B, which calls C, which then
calls A (A -> B -> C -> A), then although connection lines will be displayed for the calls of A to B
and B to C, no connection line will be shown for the call of C to A. Instead, the following line segment will only be shown, to indicate a circular call.
You can check information about functions in a circular call via the Pop-up display.
(c) Pop-up display
When the mouse cursor is hovered over a function box, information about that function appears in a pop-up.
The display format is as follows:
Caution
This function cannot be used when the scroll function for the call graph is allowed by using
the Scroll button (
button).
Function name: Function name
Location: File name(Line number)
@absolute path of the file
Recursive call count: Reference count(Execution: Execution count)
Circular call count
Function name: Reference count(Execution: Execution count)
Function name: Reference count(Execution: Execution count)
...
Dynamic call count
Function name: Count
Function name: Count
...
Function name
Indicates the name of the target function.
Location
Indicates the location at which the target function is defined with "File name(Line number)".
Note, however, that if the definition information does not exist, then this will display "(No Definition)".
Recursive call count
R20UT0265EJ0100 Rev.1.00
Sep 01, 2010
This item is displayed only if the target function is a recursive call.
Reference count:
Number of recursive calls made
Execution count:
Number of executions (only if there is trace data)
Page 88 of 129
CubeSuite Ver.1.40
Circular call count
APPENDIX A WINDOW REFERENCE
This item is displayed only if there are circular function calls from the target function. If there
are multiple target functions, that at most 4 will be listed.
Dynamic call count
Function name:
Name of function in circular call
Reference count:
Number of circular calls made
Execution count:
Number of executions (only if there is trace data)
This item is displayed only if there are only dynamic function calls, and no static function
calls.
Remark
If there are multiple target functions, that at most 4 will be listed.
Function name:
Name of dynamic call function
Count:
Number of executions
The cumulative value for each program execution is displayed as Execution count when the [Accumulate result of analysis] property in the [General] category on the [Settings] tab of the Property
panel is set to [Yes].
[Toolbar]
The toolbar provides the following items and functions.
Note that all these items are invalid during execution of a program.
Acquires the latest data from the debug tool, and updates the contents of this panel.
Note that this button is invalid during execution of a program.
Displays the latest information automatically by acquiring the information each time program execution
stops.
Note, however, that this button will be disabled if the [Refresh at program stop] property in the [General]
category on the [Settings] tab of the Property panel is set to other than [Specify Individually] (this button
is locked in accordance with the setting on the Property panel).
Opens the Call Graph Search dialog box to search for a function existing on this panel.
[[File] menu (Call Graph panel-dedicated items)]
The [File] menu for this panel provides the following items and functions.
Save Call Graph Data
Overwrites the contents of this panel to the previously saved file (see "2.12 Save Analysis
Information").
Note that when the file has never been saved or the file is write disabled, the same operation is applied as the selection in [Save Call Graph Data As...].
Save Call Graph Data As...
Opens the Save As dialog box to newly save the contents of this panel to the specified text
file (see "2.12 Save Analysis Information").
R20UT0265EJ0100 Rev.1.00
Sep 01, 2010
Page 89 of 129
CubeSuite Ver.1.40
APPENDIX A WINDOW REFERENCE
[[Edit] menu (Call Graph panel-dedicated items)]
The [Edit] menu for this panel provides the following items and functions.
Find...
Opens the Call Graph Search dialog box to search for a function currently existing on this
panel.
[Context menu]
The context menu displayed by right-clicking on this panel provides the following items and functions.
Jump to Source
Opens the Editor panel and displays the source file in which the function currently being
selected with the [Target function name] combo box is defined (see "2.6 Jump to Defined
Location").
Jump to Disassemble
Opens the Disassemble panel (Disassemble1) and displays the disassemble data corresponding to the start address of the function currently being selected with the [Target function name] combo box (see "2.6 Jump to Defined Location").
Note that this item is invalid while disconnecting from the debug tool.
Jump to Memory
Opens the Memory panel (Memory1) and displays the memory list corresponding to the
start address of the function currently being selected with the [Target function name]
combo box (see "2.6 Jump to Defined Location").
Note that this item is invalid while disconnecting from the debug tool.
Jump to Function List
Opens the Function List panel and selects the function currently being selected with the
[Target function name] combo box.
R20UT0265EJ0100 Rev.1.00
Sep 01, 2010
Page 90 of 129
CubeSuite Ver.1.40
APPENDIX A WINDOW REFERENCE
Analysis Chart panel
This panel is used to display charts of the acquired function information and variable information.
Up to a maximum of four of these panels can be opened. Each panel is identified by the names "Analysis1",
"Analysis2", "Analysis3", and "Analysis4" on the title bar.
See "2.11 Display Analysis Information in Chart" for details on how to display the chart in this panel.
Caution
This panel can be opened only while connecting to the debug tool (this panel is closed after disconnecting from the debug tool).
Figure A-13. Analysis Chart Panel
(1)
(2)
(3)
The following items are explained here.
- [How to open]
- [Description of each area]
- [[File] menu (Analysis Chart panel-dedicated items)]
[How to open]
- On the toolbar in the Main window, click the
button.
- From the [View] menu, select [Program Analyzer] >> [Analysis Chart1 - 4]
[Description of each area]
(1) Toolbar
The available buttons on the toolbar differ depending on the currently selected tab.
See the section for the tab in question for details.
(2) Chart area
This area displays a chart relating to the acquired function information/variable information.
R20UT0265EJ0100 Rev.1.00
Sep 01, 2010
Page 91 of 129
CubeSuite Ver.1.40
APPENDIX A WINDOW REFERENCE
(3) Tab selection area
The type of chart is switched when a tab is selected.
In this panel, a following tab is contained (see the section explaining the tab for details on the display/setting).
- [Variable Value Changing Chart] tab
- [Execution Time(Percentage) Chart] tab
Remark
A
mark is displayed on the tab if a message relating to the chart information has been output to the
Output panel.
[[File] menu (Analysis Chart panel-dedicated items)]
The [File] menu for this panel provides the following items and functions.
Save Analysis Chart Data
Overwrites the contents that are displayed on the currently selected tab to the previously
saved file (see "2.12 Save Analysis Information").
Note that when the file has never been saved or the file is write disabled, the same operation is applied as the selection in [Save Analysis Chart Data As...].
Save Analysis Chart Data As...
Opens the Save As dialog box to newly save the contents that are displayed on the currently selected tab to the specified file (see "2.12 Save Analysis Information").
R20UT0265EJ0100 Rev.1.00
Sep 01, 2010
Page 92 of 129
CubeSuite Ver.1.40
APPENDIX A WINDOW REFERENCE
[Variable Value Changing Chart] tab
Use this tab to display the relationship of variable/register/other values registered as graphing targets to time in a line
chart.
These tabs on the Analysis Chart panel are identified by the names "Analysis Chart1", "Analysis Chart2", "Analysis
Chart3", and "Analysis Chart4". From these tabs, you can register graphing targets individually.
See "2.11.1 Graph transitions in variable values" for details on how to display graphs on this tab.
Figure A-14. Analysis Chart Panel: [Variable Value Changing Chart] Tab
[Toolbar]
(1)
(2)
(3)
Figure A-15. Analysis Chart Panel: [Variable Value Changing Chart] Tab (without Legend)
[Toolbar]
(1)
(2)
The following items are explained here.
- [How to open]
- [Description of each area]
- [Toolbar]
R20UT0265EJ0100 Rev.1.00
Sep 01, 2010
Page 93 of 129
CubeSuite Ver.1.40
APPENDIX A WINDOW REFERENCE
[How to open]
- On the toolbar in the Main window, click the
button, and then select the [Variable Value Changing Chart] tab.
- From the [View] menu, select [Program Analyzer] >> [Analysis Chart1-4], and then select the [Variable Value
Changing Chart] tab.
[Description of each area]
(1) Variable name/Variable value setting area
This area is provided with the following functions.
Note that these functions are invalid during execution of a program.
(a) Registering/deleting graphing targets
Register or delete targets for graphing on this tab.
- Registering a new graphing target
[Variable Name] combo box
Enter the name of the new graphing target to register directly via the keyboard (maximum character length: 2,046)Note.
The following types of graphing targets can be registered.
- Global variable
- File-internal static variable
- Static variable inside functions
- CPU register
- SFR [78K0][78K0R]
- IOR [V850]
- Address
- Deleting a graphing target that was previously registered
Select the graphing target to delete from the drop-down list.
The drop-down list displays the names of all graphing targets that are currently registered.
A graphing target can be selected by clicking the graph, or if a legend is displayed,
by clicking on the target legend.
Registers the target name specified in the [Variable Name] combo box as a graphing
Add button
target.
Deletes the target name specified in the [Variable Name] combo box as a graphing tar-
Delete button
get.
Note The input format is as follows (same as the input format of the Watch panel):
Note the following, however, when registering items:
- If the variable name of a structure, union, or array is registered, it cannot be graphed.
- For structures, unions, and arrays, the member name or element must be specified.
- Immediate addresses are registered with a size of 1 byte.
- There may be restrictions on the number and size of targets that can be graphed, depending on the
debug tool used and the method by which the graph data was acquired (see "(2) Select the method
for acquiring the graph data").
R20UT0265EJ0100 Rev.1.00
Sep 01, 2010
Page 94 of 129
CubeSuite Ver.1.40
APPENDIX A WINDOW REFERENCE
Table A-2. Input Format of Graphing Targets
Input Format
Value to be Acquired
Variable name of C language
Value of C language variable
Variable-expression[Variable-expression]
Element of array
Variable-expression.Member name
Member of structures/unions
Variable-expression->Member name
Member of structures/unions that pointer designates
*Variable-expression
Value of pointer variable
CPU register name
Value of the CPU register
SFR register name [78K0][78K0R]
SFR register value
I/O register name [V850]
I/O register value
Label, EQU symbol and immediate address
Values of label, EQU symbol and immediate
address
Bit symbol
Caution
Bit symbol value
Immediate addresses of different sizes with the same address cannot be registered.
In this case, the immediate addresses that has been registered previously takes precedence.
Remark
See "(1) Register graphing targets" for other ways to register graphing targets.
(b) Find values
Find locations where a variable changes to the specified value in the currently displayed graph (see "(4) Validate the graph data").
Select the graphing target to find from the drop-down list.
[Variable Name] combo box
The drop-down list displays the names of all graphing targets that are currently registered.
A graphing target can be selected by clicking the graph, or if a legend is displayed, by
clicking on the target legend.
Specify the value to find by entering it directly via the keyboard (maximum history size:
[Variable Value] combo box
10 items).
Note that values can only be specified in decimal number notation.
Search to the left for locations where the graphing target specified in the [Variable
Previous change button
Name] combo box changes to the value specified in the [Variable Value] combo box.
Search to the right for locations where the graphing target specified in the [Variable
Next change button
R20UT0265EJ0100 Rev.1.00
Sep 01, 2010
Name] combo box changes to the value specified in the [Variable Value] combo box.
Page 95 of 129
CubeSuite Ver.1.40
APPENDIX A WINDOW REFERENCE
If the search is successful, the following mark is displayed at the matching location (if there are no matching
locations, then a message is displayed in the Output panel).
Mark indicating found location
(2) Chart area
This area displays the relationship between values (Y axis) and time (X axis) in the registered graphing target, in a
line chart.
The format of the line chart will differ as follows, depending on the method for acquiring the graph data.
- When the Trace data analysis is specified
Creates a graph linking each plot via
perpendicular lines (step-plot chart).
- When the Real-time sampling analysis is specified
Creates a chart linking each plot via
straight lines.
Caution
If the Trace data analysis is specified, the changes to variables are not displayed when they
occur while the variable is assigned to a register due to compiler optimization.
Remark
If the acquired graph data exceeds the buffer capacity, then the oldest graph data is overwritten by the
new graph data (ring buffer system).
In this case, part of the graph rendering will be blank.
R20UT0265EJ0100 Rev.1.00
Sep 01, 2010
Page 96 of 129
CubeSuite Ver.1.40
APPENDIX A WINDOW REFERENCE
This area is provided with the following functions.
(a) Time (X axis)
Displays the passage of time. The display units are in accordance with the acquired data.
Click on the
/
mark to expand the chart in the direction of the X axis.
The time display range depends on the method for acquiring the graph data (see "Table 2-8. Differences
Depending on the Method for Acquiring Graph Data").
(b) Value (Y axis)
Displays the values of the registered graphing target.
By default, the maximum and minimum values of the acquired data are used as the upper and lower bounds of
the chart, but it is also possible to specify a range to display (see "((a) Setting the display range").
It is also possible to specify a valid range of values, in order to avoid displaying abnormal values (see "(b)
Setting the valid range (Discard abnormal values)").
(c) Pop-up display
When the mouse cursor is hovered over a transition location on the graph, information about that location
appears in a pop-up.
The display format will differ as follows, depending on the method for acquiring the graph data.
- When the Trace data analysis is specified
Value name
Value: Data value, Location: File name(Line number)
Time: Data value
Remark
The [Location] information is displayed only when the transition location information exists in
the graph data (when the information does not exist, "-" is displayed). In this case, furthermore, you can display the applicable location in the Editor panel by clicking the transition
point.
Note, however, that the [Location] information may be invalid value when the graph data is
acquired by simultaneously using a Trace event and a Point Trace event in the debug tool.
- When the Real-time sampling analysis is specified
Value name
Value: Data value
Time: Data value
R20UT0265EJ0100 Rev.1.00
Sep 01, 2010
Page 97 of 129
CubeSuite Ver.1.40
APPENDIX A WINDOW REFERENCE
(3) Legend area
This area displays the legend of the registered graphing target (default).
To hide it, set the [Display the legend 1 - 4] in the [Analysis Chart1-4] category on the [Settings] tab of the Property
panel to [No]. Moreover, in this category, you can also use the [Location of the legend 1 - 4] property to specify
where to display the legend.
[Toolbar]
The toolbar provides the following items and functions.
Note that all these items are invalid during execution of a program.
Acquires the latest data from the debug tool, and updates the contents of this panel.
Displays the latest information automatically by acquiring the information each time program execution
stops.
Note, however, that this button will be disabled if the [Refresh at program stop] property in the [General] category on the [Settings] tab of the Property panel is set to other than [Specify Individually]
(default) (this button is locked in accordance with the setting on the Property panel).
Registers automatically watch-expressions on the Watch panel as the graphing targets (see "(1) Register graphing targets").
Uses the Trace data analysis as the method for acquiring the graph data.
Uses the Real-time sampling analysis as the method for acquiring the graph data (default).
R20UT0265EJ0100 Rev.1.00
Sep 01, 2010
Page 98 of 129
CubeSuite Ver.1.40
APPENDIX A WINDOW REFERENCE
[Execution Time(Percentage) Chart] tab
Use this tab to display the acquired function information in a pie chart of the function execution times.
See "2.11.2 Chart the function execution time ratios" for details on how to display graphs on this tab.
Cautions 1.
If the debug tool to use does not support the Trace function, or if the debug tool’s trace function
is not enabled, then this chart cannot be displayed.
2.
[IECUBE [78K0]]
Because the trace time tag function is not supported, this chart cannot be displayed.
Figure A-16. Analysis Chart Panel: [Execution Time(Percentage) Chart] Tab
[Toolbar]
(1)
The following items are explained here.
- [How to open]
- [Description of each area]
- [Toolbar]
[How to open]
- On the toolbar in the Main window, click the
button, and then select the [Execution Time(Percentage) Chart]
tab.
- From the [View] menu, select [Program Analyzer] >> [Analysis Chart1-4], and then select the [Execution Time(Percentage) Chart] tab.
[Description of each area]
(1) Chart area
This area displays a pie chart indicating function execution time ratios.
You can change the number of functions to display by setting from the [The number of functions displaying in the
Execution Time(Percentage) Chart1-4] property in the [General] category on the [Settings] tab of the Property
panel (set to [10] by default).
R20UT0265EJ0100 Rev.1.00
Sep 01, 2010
Page 99 of 129
CubeSuite Ver.1.40
APPENDIX A WINDOW REFERENCE
The targets are charted in ranking order of highest proportion of execution time taken. Functions exceeding the
number specified here are displayed together under "Others".
(a) Label display
Each function label is displayed in the format "Function-name[proportion of execution time (%)]".
For static files, the file name is also included inside the parentheses ( ).
Remark
The proportion of execution time is the same as the [Execution Time(Percentage)[%]] in the Function List panel.
(b) Pop-up display
When the mouse cursor is hovered over a function, information about that function's execution time appears in
a pop-up in the format "Execution-time[unit]".
The [Unit] can be changed by the [Unit of time] property in the [General] category on the [Settings] tab of the
Property panel.
Remark
The Execution-time is the same as the [Execution Time[unit]] in the Function List panel.
[Toolbar]
The toolbar provides the following items and functions.
Note that all these items are invalid during execution of a program.
Acquires the latest data from the debug tool, and updates the contents of this panel.
Displays the latest information automatically by acquiring the information each time program execution
stops.
Note, however, that this button will be disabled if the [Refresh at program stop] property in the [General]
category on the [Settings] tab of the Property panel is set to other than [Specify Individually] (default) (this
button is locked in accordance with the setting on the Property panel).
Does not work in this tab.
Does not work in this tab.
Does not work in this tab.
R20UT0265EJ0100 Rev.1.00
Sep 01, 2010
Page 100 of 129
CubeSuite Ver.1.40
APPENDIX A WINDOW REFERENCE
Output panel
This panel is used to display operation logs for various components (analyze tool, design tool, build tool, debug tool,
etc.) provided by CubeSuite and a list of locations that refer to the specified function/variable.
See "2.9 Display List of Referencing Location" for details on how to output lists of locations referencing a function or
variable.
Figure A-17. Output Panel
(1)
(2)
The following items are explained here.
- [How to open]
- [Description of each area]
- [[File] menu (Output panel-dedicated items)]
- [[Edit] menu (Output panel-dedicated items)]
- [Context menu]
[How to open]
- From the [View] menu, select [Output].
[Description of each area]
(1) Message area
This area displays operation logs for various components (analyze tool, design tool, build tool, debug tool, etc.)
provided by CubeSuite and a list of places that refer to the specified function/variable.
For details on the contents displayed in this area, see the section explaining the corresponding tab.
(2) Tab selection area
The origin of messages is changed when each tab is selected.
The following tabs are available for the analyze tool.
- [All Messages] tab
- [Program Analyzer] tab
- [Find References] tab
Remark
When the new message is output, "*" mark is displayed to the left of the tab name.
R20UT0265EJ0100 Rev.1.00
Sep 01, 2010
Page 101 of 129
CubeSuite Ver.1.40
APPENDIX A WINDOW REFERENCE
[[File] menu (Output panel-dedicated items)]
The [File] menu for this panel provides the following items and functions.
Save Output-Tab Name
Overwrites the contents that are displayed on the currently selected tab to the preciously
saved text file (*.txt).
Note that when the file has never been saved or the file is write disabled, the same operation is applied as the selection in [Save Output-Tab Name As....].
Save Output-Tab Name As...
Opens the Save As dialog box to newly save the contents that are displayed on the currently selected tab to the specified text file (*.txt).
[[Edit] menu (Output panel-dedicated items)]
The [Edit] menu for this panel provides the following items and functions.
Copy
Copies the contents of the selected range to the clipboard as character string(s).
Select All
Selects all the messages displayed on the currently selected tab.
Find...
Opens the Search and Replace dialog box.
Replace...
Opens the Search and Replace dialog box.
[Context menu]
The context menu displayed by right-clicking on this panel provides the following items and functions.
Copy
Copies the contents of the selected range to the clipboard as character string(s).
Select All
Selects all the messages displayed on the currently selected tab.
Clear
Deletes all the messages displayed on the currently selected tab.
Tag Jump
Opens the Editor panel and jumps to the number of the corresponding line in the corresponding file of the message at the caret position.
Stop Searching
Cancels the current search operation.
This item is in valid when is not being executed.
Help for Message
Displays online help for the message on the current caret position.
This item only applies to warning messages and error messages.
R20UT0265EJ0100 Rev.1.00
Sep 01, 2010
Page 102 of 129
CubeSuite Ver.1.40
APPENDIX A WINDOW REFERENCE
[All Messages] tab
This tab is used to display operation logs for all components (analyze tool, design tool, build tool, debug tool, etc.) provided by CubeSuite.
Figure A-18. Output Panel: [All Messages] Tab
(1)
The following items are explained here.
- [How to open]
- [Description of each area]
[How to open]
- From the [View] menu, select [Output], and then select the [All Messages] tab.
[Description of each area]
(1) Message area
This area displays operation logs for all components (analyze tool, design tool, build tool, debug tool, etc.) provided
by CubeSuite. Note that messages that the analysis tool output during analysis are not displayed on this tab
(these messages are displayed only on the [Program Analyzer] tab).
The colors of message display differ with the type of message as shown below (character colors and background
colors depend on the configuration in the [General - Font and Color] category of the Option dialog box).
Message Type
Normal message
Warning message
Error message
Display Example (Default)
Character color
Black
Background color
White
Character color
Blue
Background color
Standard color
Character color
Red
Background color
Remarks 1.
Light gray
Description
Displayed with information notices
Displayed with warnings about operations
Displayed when there is a critical error, or
when execution is not possible due to a operational mistake
When the output message is double-clicked, or the [Enter] key is pressed with the caret over the
message, the Editor panel appears and the destination line number of the file is displayed.
R20UT0265EJ0100 Rev.1.00
Sep 01, 2010
Page 103 of 129
CubeSuite Ver.1.40
2.
APPENDIX A WINDOW REFERENCE
Online help with regard to the message in the line is shown by selecting [Help for Message] in the
context menu or pressing the [F1] key while the caret is in the line where the warning message or
the error message is displayed.
3.
You can save the contents displayed on this tab to a text file (*.txt) by selecting [Save Output-All
Messages As...] from the [File] menu.
R20UT0265EJ0100 Rev.1.00
Sep 01, 2010
Page 104 of 129
CubeSuite Ver.1.40
APPENDIX A WINDOW REFERENCE
[Program Analyzer] tab
This tab is used to display only operation logs for the analyze tool out of those for various components (analyze tool,
design tool, build tool, debug tool, etc.) provided by CubeSuite.
Figure A-19. Output Panel: [Program Analyzer] Tab
(1)
The following items are explained here.
- [How to open]
- [Description of each area]
[How to open]
- From the [View] menu, select [Output], and then select the [Program Analyzer] tab.
[Description of each area]
(1) Message area
This area displays only operation logs for the analyze tool out of those for various components (analyze tool,
design tool, build tool, debug tool, etc.) provided by CubeSuite.
The colors of message display differ with the type of message as shown below (character colors and background
colors depend on the configuration in the [General - Font and Color] category of the Option dialog box).
Message Type
Normal message
Warning message
Error message
Display Example (Default)
Character color
Black
Background color
White
Character color
Blue
Background color
Standard color
Character color
Red
Background color
Remarks 1.
Light gray
Description
Displayed with information notices
Displayed with warnings about operations
Displayed when there is a critical error, or
when execution is not possible due to a operational mistake
When the output message is double-clicked, or the [Enter] key is pressed with the caret over the
message, the Editor panel appears and the destination line number of the file is displayed.
2.
Online help with regard to the message in the line is shown by selecting [Help for Message] in the
context menu or pressing the [F1] key while the caret is in the line where the warning message or
the error message is displayed.
3.
You can save the contents displayed on this tab to a text file (*.txt) by selecting [Save Output-Program Analyzer As...] from the [File] menu.
R20UT0265EJ0100 Rev.1.00
Sep 01, 2010
Page 105 of 129
CubeSuite Ver.1.40
APPENDIX A WINDOW REFERENCE
[Find References] tab
Use this tab to display a list of locations referencing the specified function/variable.
See "2.9 Display List of Referencing Location" for details on how to output lists of locations referencing a function or
variable.
Cautions 1.
This tab does not appear if the Display List of Referencing Location operation is never performed.
2.
Code in C source files that is referenced but is eliminated by the preprocessor during compilation (e.g. via "#if" or "#ifdef" statements) is not output as referenced locations.
3.
[CX]
Reference of a function that is assignment to function pointers is not output as referenced locations.
4.
Each time a search is made for referencing locations, the output list of referencing locations is
cleared.
Figure A-20. Output Panel: [Find References] Tab
(1)
The following items are explained here.
- [How to open]
- [Description of each area]
[How to open]
- From the [View] menu, select [Output], and then select the [Find References] tab.
[Description of each area]
(1) Message area
This area displays the following list of locations referencing a function/variable on the Function List panel/Variable
List panel (see "2.9 Display List of Referencing Location").
Remarks 1.
When the function name/variable name on this tab is double-clicked, the Editor panel appears and
the caret moves to the line where the function/variable is defined.
2.
The color of the highlighted target function name and target variable name depends on the [Highlight] item in the [General - Font and Color] category of the Option dialog box.
R20UT0265EJ0100 Rev.1.00
Sep 01, 2010
Page 106 of 129
CubeSuite Ver.1.40
3.
APPENDIX A WINDOW REFERENCE
You can save the contents displayed on this tab to a text file (*.txt) by selecting [Save Output-Find
References As...] from the [File] menu.
(a) Output format of list of locations referencing a function
The contents of the search results consist of the following parts:
Figure A-21. Output Format of List of Locations Referencing a Function
Start of finding all references
Target: Target function name
Definition: File name (Number of lines):
A
Line 1of the location
Reference(Execution Count: Number): File name (Number of lines):
Line 1of the location:
:
A list of the functions which are being called by function Target function name:
B
Calling function name
:
A list of the variables doing a reference (read / write) by function Target function name:
C
Reference variable name
:
End of finding all references
The location at which the target function is defined and a list of locations referencing the target function
Target
Indicates the name of the target function.
Definition
Indicates the location at which the target function is defined.
Note that if the information cannot be acquired from the cross reference file, then "None" is displayed.
File name (Number of
Indicates the file nameNote at which the location in question
lines)
exists. The number in parentheses indicates the number of lines
(line number) in the file.
Line 1 of the location
A
Displays a 1-line excerpt from the file at the location.
At this time, the target function name is highlighted.
Reference
Lists the locations referencing the target function. If there is the Dynamic analysis information,
then the number of times the target function is executed is included in parentheses ( ).
Note that if the information cannot be acquired from the cross reference file, then "None" is displayed.
File name (Number of
Indicates the file nameNote at which the location in question
lines)
exists. The number in parentheses indicates the number of lines
(line number) in the file.
Line 1 of the location
Displays a 1-line excerpt from the file at the location.
At this time, the target function name is highlighted.
A list of functions called within the target function
B
Calling function
Lists the names of functions called within the target function.
name
If no functions are called, then "None" is displayed.
R20UT0265EJ0100 Rev.1.00
Sep 01, 2010
Page 107 of 129
CubeSuite Ver.1.40
APPENDIX A WINDOW REFERENCE
A list of variables referenced (read/written) inside the target function
C
Reference vari-
Lists the names of variables referenced (read/written) inside the target function.
able name
If no variables are referenced, then "None" is displayed.
Note When the [File path] item is being displayed on the Function List panel (this item is not displayed by
default), the absolute path of the file appears.
Figure A-22. Example of List of Locations Referencing a Function (without Dynamic Analysis Information)
Figure A-23. Example of List of Locations Referencing a Function (with Dynamic Analysis Information)
(b) Output format of list of locations referencing a variable
The output search results consist of the location where the target variable is defined, and a list of locations referencing the target variable.
Figure A-24. Output Format of List of Locations Referencing a Variable
Start of finding all references
Target: Target variable name
Definition: File name (Number of lines):
Line 1of the location
Reference (Read/Write Count:Number): File name (Number of lines):
Line 1of the location
:
End of finding all references
Target
Indicates the name of the target variable.
R20UT0265EJ0100 Rev.1.00
Sep 01, 2010
Page 108 of 129
CubeSuite Ver.1.40
Definition
APPENDIX A WINDOW REFERENCE
Indicates the location at which the target variable is defined.
Note that if the information cannot be acquired from the cross reference file, then "None" is displayed.
File name (Number
Indicates the file nameNote at which the location in question exists. The num-
of lines)
ber in parentheses indicates the number of lines (line number) in the file.
Line 1 of the location
Displays a 1-line excerpt from the file at the location.
At this time, the target variable name is highlighted.
Reference
Lists the locations referencing the target variable. If there is the Dynamic analysis information, then the number of times the target variable is executed is included in parentheses ( ).
Note that if the information cannot be acquired from the cross reference file, then "None" is displayed.
File name (Number
Indicates the file nameNote at which the location in question exists. The num-
of lines)
ber in parentheses indicates the number of lines (line number) in the file.
Line 1 of the location
Displays a 1-line excerpt from the file at the location.
At this time, the target variable name is highlighted.
Note When the [File path] item is being displayed on the Variable List panel (this item is not displayed by
default), the absolute path of the file appears.
Remarks 1.
How lines with variables described in "extern declaration" are handled depending on the compiler currently used is as follows:
- [CA78K0][CA78K0R]
A line with a variable described in "extern declaration" is handled as "Reference".
Furthermore, if a line with a variable described in "extern declaration" and a line with the variable definition exist in the same file, then "None" is displayed in "Definition".
- [CA850]
A line with a variable described in "extern declaration" is handled as "Definition".
- [CX]
A line with a variable described in "extern declaration" is handled as "Reference".
2.
[CX]
In the definition of variables, a line with an assignment statement (e.g. "int variable = 10") is
handled as "Reference".
Figure A-25. Example of List of Locations Referencing a Variable (without Dynamic Analysis Information)
Figure A-26. Example of List of Locations Referencing a Variable (with Dynamic Analysis Information)
R20UT0265EJ0100 Rev.1.00
Sep 01, 2010
Page 109 of 129
CubeSuite Ver.1.40
APPENDIX A WINDOW REFERENCE
Path Edit dialog box
This dialog box is used to specify the file when importing an information file (Function list file (*.csfl)/Variable list file
(*.csvl)).
See "2.10 Import or Export Information File" for details on the import function.
Figure A-27. Path Edit Dialog Box
(1)
[Function buttons]
The following items are explained here.
- [How to open]
- [Description of each area]
- [Function buttons]
[How to open]
- On the [Settings] tab in the Property panel, select the [Import files] property in the [Import / Export] category, and
then click the [...] button.
[Description of each area]
(1) Path edit area
(a) [Path(One path per one line)]
Specify each Function list file (*.csfl)/Variable list file (*.csvl) to import, one to a line, including the path (up to
259 characters per line, and up to 64 lines can be specified). If you specify a relative path, specify the project
folder as the base.
Note that at this time, you can use the following macro names for embedded macros.
Macro Name
Function
%ProjectName%
Replaces itself with the project name.
%CubeSuitePath%
Replaces itself with the absolute path of the CubeSuite install folder.
R20UT0265EJ0100 Rev.1.00
Sep 01, 2010
Page 110 of 129
CubeSuite Ver.1.40
APPENDIX A WINDOW REFERENCE
(b) Button
Browse...
Opens a dialog box to specify files to import.
The selected file name is added to [Path(One path per one line)].
[Function buttons]
Button
Function
OK
Sets the specified file(s) to the [Import files] property then closes the dialog box.
Cancel
Ignores the setting and closes this dialog box.
Help
Displays the online help of this dialog box.
R20UT0265EJ0100 Rev.1.00
Sep 01, 2010
Page 111 of 129
CubeSuite Ver.1.40
APPENDIX A WINDOW REFERENCE
Column Chooser dialog box
This dialog box is used to sort, show/hide the items (columns) displayed on the Function List panel/Variable List panel.
If the Customize Display Method operation has been performed on one of the panels, then this dialog can also be used
to reset these customizations to the default settings.
Figure A-28. Column Chooser Dialog Box (For Function List Panel)
(1)
[Function buttons]
Figure A-29. Column Chooser Dialog Box (For Variable List Panel)
(1)
[Function buttons]
R20UT0265EJ0100 Rev.1.00
Sep 01, 2010
Page 112 of 129
CubeSuite Ver.1.40
APPENDIX A WINDOW REFERENCE
The following items are explained here.
- [How to open]
- [Description of each area]
- [Function buttons]
[How to open]
- On the Function List panel, click the
button.
- On the Variable List panel, click the
button.
[Description of each area]
(1) Item list area
This area displays a list of all items (columns) that can be displayed in the Function List panel/Variable List panel
(the items (columns) that can be displayed differ according to the microcontroller and the debug tool used).
The display order of the items in this list, and the state of checkboxes, are the same as the current sort order and
visible/hidden status in the corresponding panel.
Specify the checkboxes of each item to show or hide that item on the panel.
Displays this item on the panel.
Does not display this item on the panel.
Indicates that a message relating to information about this item has been output to the Output panel. Hover the
mouse over it to display a pop-up with the last message to be output.
[Function buttons]
Button
Function
Default
Resets the display order and visible/hidden settings for each item in the Function List
panel/Variable List panel to their default values.
Close
Remark
Closes this dialog box.
The default display status for each item is as follows.
The order of [Item] in the table corresponds to the display order of items (columns) on each panel.
Note that all display locking, display filtering, and other customization will be cleared.
The available items are also limited depending on the microcontroller and debug tool used.
Table A-3. Default Display Status (Function List Panel)
Item
Status
While disconnecting from the
While connecting to
debug tool
the debug tool
Function Name
Display
Display
File Name
Display
Display
Non-display
Non-display
Display
Display
Non-display
Non-display
File Path
PE Information
Note
[V850E2M]
Import
R20UT0265EJ0100 Rev.1.00
Sep 01, 2010
Page 113 of 129
CubeSuite Ver.1.40
APPENDIX A WINDOW REFERENCE
Item
Status
While disconnecting from the
While connecting to
debug tool
the debug tool
Attribute
Display
Display
Return Type
Display
Display
Arguments Count
Non-display
Non-display
Arguments
Display
Display
Code Size[Bytes]
Display
Display
Stack Size[Bytes]
Display
Display
Start Address
Display
Display
End Address
Non-display
Non-display
Reference Count
Display
Display
Execution Count
Non-display
Display
Non-display
Display
Non-display
Display
Non-display
Display
Non-display
Display
[IECUBE]
[IECUBE2]
[Simulator]
Execution Time[unit]
[IECUBE [78K0R]]
[IECUBE [V850]]
[IECUBE2]
[Simulator]
Execution Time(Percentage)[%]
[IECUBE [78K0R]]
[IECUBE [V850]]
[IECUBE2]
[Simulator]
Execution Time(Average)[unit]
[IECUBE [78K0R]]
[IECUBE [V850]]
[IECUBE2]
[Simulator]
Code Coverage[%]
[IECUBE]
[IECUBE2]
[Simulator]
Note [V850E2M]
This item appears only when the selected microcontroller version supports multi-core.
Table A-4. Default Display Status (Variable List Panel)
Item
Status
While disconnecting from the
While connecting to the debug
debug tool
tool
Variable Name
Display
Display
File Name
Display
Display
R20UT0265EJ0100 Rev.1.00
Sep 01, 2010
Page 114 of 129
CubeSuite Ver.1.40
APPENDIX A WINDOW REFERENCE
Item
Status
While disconnecting from the
While connecting to the debug
debug tool
tool
Function Name
Non-display
Non-display
File Path
Non-display
Non-display
PE InformationNote
Non-display
Display
Import
Non-display
Non-display
Attribute
Display
Display
Type
Display
Display
Members
Display
Display
Address
Display
Display
Size[Bytes]
Display
Display
Reference Count
Display
Display
Read Count
Non-display
Display
Non-display
Display
Non-display
Non-display
Non-display
Display
Non-display
Display
Non-display
Display
[V850E2M]
[IECUBE]
[IECUBE2]
[Simulator]
Write Count
[IECUBE]
[IECUBE2]
[Simulator]
Read/Write Count
[IECUBE]
[IECUBE2]
[Simulator]
Minimum Value
[IECUBE]
[IECUBE2]
[Simulator]
Maximum Value
[IECUBE]
[IECUBE2]
[Simulator]
Data Coverage[%]
[IECUBE [78K0]]
[IECUBE [78K0R]]
[IECUBE2]
[Simulator]
Note [V850E2M]
This item appears only when the selected microcontroller version supports multi-core.
R20UT0265EJ0100 Rev.1.00
Sep 01, 2010
Page 115 of 129
CubeSuite Ver.1.40
APPENDIX A WINDOW REFERENCE
Call Graph Search dialog box
This dialog box is used to search for a function existing in the call graph displayed in the Call Graph panel.
Caution
Searches can be performed only for functions (function boxes) that appear in a call graph.
Figure A-30. Call Graph Search Dialog Box
(1)
(2)
[Function buttons]
The following items are explained here.
- [How to open]
- [Description of each area]
- [Function buttons]
[How to open]
- On the toolbar of the Call Graph panel, click the
button.
- Focus the Call Graph panel, and then select [Find...] from the [Edit] menu.
[Description of each area]
(1) [Search condition]
Configure the search conditions.
If the (b) [Parent Count] /(c) [Child Count] below are also specified as search conditions, then only functions
meeting all conditions will be searched.
(a) [Function Name]
Specify a function name to search.
You can either type character strings directly into the text box, or select one from the input history via the dropdown list (up to 10 items).
The previous specified function name is displayed by default (if it does not exist, then this is left blank).
Remark
You can also specify a function name with any one of the following methods.
- Drag and drop an arbitrary row of the Function List panel to this dialog box.
- Drag and drop an arbitrary character strings to this combo box.
R20UT0265EJ0100 Rev.1.00
Sep 01, 2010
Page 116 of 129
CubeSuite Ver.1.40
APPENDIX A WINDOW REFERENCE
<1> [Condition]
From the following drop-down list, select the condition for the character strings specified with [Function
Name].
equals
Searches for the function name that exactly matches the specified string.
begins with
Searches for function names starting with the specified string.
ends with
Searches for function names ending with the specified string.
contains
Searches for function names containing the specified string (default).
<2> [Case-sensitive]
Searches with the designated characters in case-sensitive.
Searches with the designated characters in not case-sensitive (default).
(b) [Parent Count]
If required as a search parameter, you can specify the number of parent functions to search.
You can either type a value directly into the text box (settable range: 0 to 65535), or select one from the input
history via the drop-down list (up to 10 items).
The previous specified value is displayed by default (if it does not exist, then this is left blank).
<1> [Condition]
From the following drop-down list, select the condition for the numeric value specified with [Parent
Count].
is greater than
Searches for the names of functions with more (greater than) the specified number of parent functions.
is greater than or
Searches for the names of functions with at least as many (greater than or equal to) the
equals to
specified number of parent functions.
equals to
Searches for the names of functions with the same number of (equal to) the specified number of parent functions (default).
is less than or
Searches for the names of functions with at least as less (greater than or equal to) the
equals to
specified number of parent functions.
is less than
Searches for the names of functions with less (greater than) the specified number of parent
functions.
(c) [Child Count]
If required as a search parameter, you can specify the number of child functions to search.
You can either type a value directly into the text box (settable range: 0 to 65535), or select one from the input
history via the drop-down list (up to 10 items).
The previous specified value is displayed by default (if it does not exist, then this is left blank).
<1> [Condition]
From the following drop-down list, select the condition for the numeric value specified with [Child Count].
is greater than
Searches for the names of functions with more (greater than) the specified number of child
functions.
R20UT0265EJ0100 Rev.1.00
Sep 01, 2010
Page 117 of 129
CubeSuite Ver.1.40
APPENDIX A WINDOW REFERENCE
is greater than or
Searches for the names of functions with at least as many (greater than or equal to) the
equals to
specified number of child functions.
equals to
Searches for the names of functions with the same number of (equal to) the specified number of child functions (default).
is less than or
Searches for the names of functions with at least as less (greater than or equal to) the
equals to
specified number of child functions.
is less than
Searches for the names of functions with less (greater than) the specified number of child
functions.
(2) [Preview]
This area displays all part of the call graph.
If the area currently displayed in the Call Graph panel is a portion of the entire call graph, then that area is shown in
a red frame.
[Function buttons]
Button
Search Backward
Function
The search uses the specified conditions, starting from the function name at the bottom of the
call graph, and proceeding upward. The corresponding function box is highlighted. If a function has been specified in the [Target function name] combo box on the Call Graph panel,
then the search starts from the corresponding function, moving upward.
Note that if an illegal value is specified, or the program is executing, then a message will
appear, and the function search will not be performed. If focus moves to this dialog box from
a panel other than the Call Graph panel or the Call Graph panel is hidden, then this button will
be disabled.
Search Forward
The search uses the specified conditions, starting from the function name at the top of the
call graph, and proceeding downward. The corresponding function box is highlighted. If a
function has been specified in the [Target function name] combo box on the Call Graph panel,
then the search starts from the corresponding function, moving downward.
Note that if an illegal value is specified, or the program is executing, then a message will
appear, and the function search will not be performed. If focus moves to this dialog box from
a panel other than the Call Graph panel or the Call Graph panel is hidden, then this button will
be disabled.
Cancel
Cancels the function search and closes this dialog box.
Help
Displays the help for this dialog box.
R20UT0265EJ0100 Rev.1.00
Sep 01, 2010
Page 118 of 129
CubeSuite Ver.1.40
APPENDIX A WINDOW REFERENCE
Filter Settings dialog box
This dialog box is used to set the filter conditions when filtering the display of analysis information on the Function List
panel/Variable List panel.
Caution
The filtering configured via this dialog box and the Filtering results linked to panel are mutually
exclusive functions.
For this reason, the two filtering functions here cannot be enabled simultaneously (when one of the
filters is active, setting the other filter will disable all filters set to date).
See "2.5.5 Filter the analysis information" for details on the display-filter.
Figure A-31. Filter Settings Dialog Box
(1)
(2)
(1)
[Function buttons]
The following items are explained here.
- [How to open]
- [Description of each area]
- [Function buttons]
[How to open]
- On the Function List panel/Variable List panel, click the filter icon (
/
), and then select the [(Custom)].
[Description of each area]
Configure the filter conditions.
In the First condition setting area (top)/Second condition setting area (bottom), you can specify up to two conditions.
Use the Logical operator buttons ([AND]/[OR]) to set the two conditions as a single filter condition.
(1) First condition setting area (top)/Second condition setting area (bottom)
(a) Comparison value (left combo box)
You can either type the comparison value of for the filter (number or string) directly via the keyboard (up to
2,048 characters), or select one from the input history via the drop-down list (maximum 10 items).
By default, the comparison value set in the current target item is displayed.
(b) Condition (right combo box)
Select the condition for the comparison value specified in (a), above, from the drop-down list.
By default, the condition set in the current target item is selected.
R20UT0265EJ0100 Rev.1.00
Sep 01, 2010
Page 119 of 129
CubeSuite Ver.1.40
APPENDIX A WINDOW REFERENCE
Item
Comparison Value
Numerical Value
no condition
Note
Character String
Compared as numerical value
Compared as character string
equals
does not equal
is greater than
is greater than or equal to
is less than
is less than or equal to
begins with
Compared as character string
does not begin with
ends with
does not end with
contains
does not contain
Note If [no condition] is selected, then the comparison value will be ignored (not set as a condition).
Caution
Use the top condition-specification area if you only wish to specify one filtering condition.
(2) Logical operator buttons
Select the logical relationship holding between the conditions specified in the First condition setting area (top)/Second condition setting area (bottom) via the following option button.
AND
Only information meeting both condition 1 and condition 2 is displayed.
This is mutually exclusive to the [OR] button.
OR
Only information meeting either condition 1 or condition 2 is displayed.
This is mutually exclusive to the [AND] button.
[Function buttons]
Button
OK
Function
Displays the analysis information in the Function List panel/Variable List panel under the
specified filtering conditions.
If the Filtering results linked to panel was performed, then all display-filters linked to the
panel conducted prior to this are deleted.
Cancel
Ignores the setting and closes this dialog box.
Help
Displays the online help of this dialog box.
R20UT0265EJ0100 Rev.1.00
Sep 01, 2010
Page 120 of 129
CubeSuite Ver.1.40
APPENDIX A WINDOW REFERENCE
Save As dialog box
This dialog box is used to save the contents of the Function List panel/Variable List panel/Call Graph panel/Analysis
Chart panel to a specified file.
Note, however, that what is saved is as follows:
- Function List panel/Variable List panel:
Only the currently displayed items (column) and analysis information (rows)
- Call Graph panel:
Depending on the settings of this dialog box
- Analysis Chart panel:
Only the contents of the currently displayed tab
Figure A-32. Save As Dialog Box
(1)
(2)
(3)
[Function buttons]
(4)
The following items are explained here.
- [How to open]
- [Description of each area]
- [Function buttons]
[How to open]
- Focus the Function List panel, and then select [Save Function List Data As...] from the [File] menu.
- Focus the Variable List panel, and then select [Save Variable List Data As...] from the [File] menu.
- Focus the Call Graph panel, and then select [Save Call Graph Data As...] from the [File] menu.
- Focus the Analysis Chart panel, and then select [Save Analysis Chart Data As...] from the [File] menu.
R20UT0265EJ0100 Rev.1.00
Sep 01, 2010
Page 121 of 129
CubeSuite Ver.1.40
APPENDIX A WINDOW REFERENCE
[Description of each area]
(1) [Save in]
Select the folder to save the panel contents in the file.
(2) List of files area
This area displays a list of files matching the conditions selected in [Save in] and [Save as type].
(3) [File name]
Specify the file name to save.
(4) [Save as type]
Select the type of file to save.
(a) For the Function List panel
The following file types are displayed:
Text Files (*.txt)
Text format
CSV(Comma-Separated Variables) (*.csv)
CSV format
Microsoft Office Excel Workbook (*.xls)
Microsoft Excel 97 - Excel 2003, and 5.0/95 book format
CubeSuite Function List file (*.csfl)
File format to import the function information (See "2.10 Import or
Export Information File".)
(b) For the Variable List panel
The following file types are displayed:
Text Files (*.txt)
Text format
CSV(Comma-Separated Variables) (*.csv)
CSV format
Microsoft Office Excel Workbook (*.xls)
Microsoft Excel 97 - Excel 2003, and 5.0/95 book format
CubeSuite Variable List file (*.csvl)
File format to import the variable information (See "2.10 Import or
Export Information File".)
(c) For the Call Graph panel
The following file types are displayed:
Bitmap(Only the visible part) (*.bmp)
Bitmap format (32-bit) (Graphic file format)
JPEG(Only the visible part) (*.jpg)
JPEG format (Graphic file format)
PNG(Only the visible part) (*.png)
PNG format (Graphic file format)
Bitmap (*.bmp)
Bitmap format (32-bit) (Graphic file format)
JPEG (*.jpg)
JPEG format (Graphic file format)
PNG (*.png)
PNG format (Graphic file format)
EMF (*.emf)
EMF format (Graphic file format)
Caution
All part of the call graph may not successfully be saved as a graphic file format if the project
is too big.
R20UT0265EJ0100 Rev.1.00
Sep 01, 2010
Page 122 of 129
CubeSuite Ver.1.40
APPENDIX A WINDOW REFERENCE
Remarks 1.
When "(Only the visible part)" is selected, only the part currently being displayed in the panel
will be saved.
2.
If the zoom function has been applied, then the image will be saved at the current zoom ratio
(except for EMF format).
(d) For the Analysis Chart panel
The following file types are displayed:
Text Files (*.txt)
Text format
CSV(Comma-Separated Variables) (*.csv)
CSV format
Microsoft Office Excel Workbook (*.xls)
Microsoft Excel 97 - Excel 2003, and 5.0/95 book format
Bitmap (*.bmp)
Bitmap format (32-bit) (Graphic file format)
JPEG (*.jpg)
JPEG format (Graphic file format)
PNG (*.png)
PNG format (Graphic file format)
Remark
Items to be saved in other than the graphic file format are as follows:
- [Variable Value Changing Chart] tab
When the graph has been acquired via the Trace data analysis
Item
Time
Note
-
Value(Variable
Value(Variable
name)
name)
...
Location
Outputs only the variable whose value has been
If the informa-
changed (if the value designates an unknown, this
tion does not
field is left blank).
exist, this field
is left blank
When the graph has been acquired via the Real-time sampling analysis
Item
Note
Time
-
Value(Variable
Value(Variable
Value(Variable
name)
name)
name)
...
Outputs always the value of the variable (if the value designates an
unknown, this field is left blank).
- [Execution Time(Percentage) Chart] tab
Item
Remark
Function Name
Percentage[%]
Time
The data is saved with entries separated by commas (,). If the data contains commas, each entry is
surrounded by double quotes (" ") in order to avoid illegal formatting.
[Function buttons]
Button
Function
Save
Saves the file with the specified name.
Cancel
Closes this dialog box.
R20UT0265EJ0100 Rev.1.00
Sep 01, 2010
Page 123 of 129
CubeSuite Ver.1.40
APPENDIX B INDEX
APPENDIX B INDEX
Function List panel ... 66
A
Active project ... 37
Analysis Chart panel ... 91
[Execution Time(Percentage) Chart]tab ... 99
[Variable Valu Changing Chart]tab ... 93
Ascending order ... 29
G
Graphing target ... 41, 94
I
Import ... 37, 110
B
Information file ... 37
Break event ... 34
Breakpoint ... 33
J
Jump to the defined location ... 33
C
Call Graph panel ... 84
Call Graph Search dialog box ... 116
Circular call ... 88
Code coverage ratio ... 70
Column Chooser dialog box ... 112
Coverage function ... 10
Cross reference information ... 9, 60
Current row mark ... 33, 72, 81
D
Data coverage ratio ... 79
L
Line chart ... 40, 93
List of referencing location ... 36, 106
Lock display icon ... 29
M
Main window ... 51
Menubar ... 52
Method for acquiring graph data ... 42
O
Output panel ... 101
[All Messages]tab ... 103
[Find References]tab ... 106
[Program Analyzer]tab ... 105
Defined location ... 33
Descending order ... 29
Discard abnormal values ... 44
Display range ... 43
Dynamic analysis information ... 10
P
Path Edit dialog box ... 110
E
Export ... 37
F
Features ... 14
Pie chart ... 46, 99
Pop-up display ... 45
Project Tree panel ... 54
Property panel ... 56
[Settings]tab ... 59
Filter icon ... 30
Filter Settings dialog box ... 119
Filters for displaying information ... 29
Function execution time ratios ... 46
Function list file ... 37, 38, 110
R20UT0265EJ0100 Rev.1.00
Sep 01, 2010
R
Real-time sampling analysis ... 42
Recursive call ... 88
RRM function ... 10, 42
Page 124 of 129
CubeSuite Ver.1.40
APPENDIX B INDEX
Runtime library ... 71
S
Save As dialog box ... 121
Static analysis information ... 9
Structure ... 78
T
Toolbar ... 52
Trace data analysis ... 42
Trace function ... 42
U
Union ... 78
V
Valid range ... 44
Variable list file ... 37, 38, 110
Variable List panel ... 75
W
Watch-expression ... 35
Window reference ... 50
R20UT0265EJ0100 Rev.1.00
Sep 01, 2010
Page 125 of 129
Revision Record
Description
Rev.
Date
Page
1.00
Sep 01, 2010
-
Summary
First Edition issued
CubeSuite Ver.1.40 User’s Manual: Analysis
Publication Date:
Rev.1.00
Sep 1, 2010
Published by:
Renesas Electronics Corporation
http://www.renesas.com
SALES OFFICES
Refer to "http://www.renesas.com/" for the latest and detailed information.
Renesas Electronics America Inc.
2880 Scott Boulevard Santa Clara, CA 95050-2554, U.S.A.
Tel: +1-408-588-6000, Fax: +1-408-588-6130
Renesas Electronics Canada Limited
1101 Nicholson Road, Newmarket, Ontario L3Y 9C3, Canada
Tel: +1-905-898-5441, Fax: +1-905-898-3220
Renesas Electronics Europe Limited
Dukes Meadow, Millboard Road, Bourne End, Buckinghamshire, SL8 5FH, U.K
Tel: +44-1628-585-100, Fax: +44-1628-585-900
Renesas Electronics Europe GmbH
Arcadiastrasse 10, 40472 Düsseldorf, Germany
Tel: +49-211-65030, Fax: +49-211-6503-1327
Renesas Electronics (China) Co., Ltd.
7th Floor, Quantum Plaza, No.27 ZhiChunLu Haidian District, Beijing 100083, P.R.China
Tel: +86-10-8235-1155, Fax: +86-10-8235-7679
Renesas Electronics (Shanghai) Co., Ltd.
Unit 204, 205, AZIA Center, No.1233 Lujiazui Ring Rd., Pudong District, Shanghai 200120, China
Tel: +86-21-5877-1818, Fax: +86-21-6887-7858 / -7898
Renesas Electronics Hong Kong Limited
Unit 1601-1613, 16/F., Tower 2, Grand Century Place, 193 Prince Edward Road West, Mongkok, Kowloon, Hong Kong
Tel: +852-2886-9318, Fax: +852 2886-9022/9044
Renesas Electronics Taiwan Co., Ltd.
7F, No. 363 Fu Shing North Road Taipei, Taiwan
Tel: +886-2-8175-9600, Fax: +886 2-8175-9670
Renesas Electronics Singapore Pte. Ltd.
1 harbourFront Avenue, #06-10, keppel Bay Tower, Singapore 098632
Tel: +65-6213-0200, Fax: +65-6278-8001
Renesas Electronics Malaysia Sdn.Bhd.
Unit 906, Block B, Menara Amcorp, Amcorp Trade Centre, No. 18, Jln Persiaran Barat, 46050 Petaling Jaya, Selangor Darul Ehsan, Malaysia
Tel: +60-3-7955-9390, Fax: +60-3-7955-9510
Renesas Electronics Korea Co., Ltd.
11F., Samik Lavied' or Bldg., 720-2 Yeoksam-Dong, Kangnam-Ku, Seoul 135-080, Korea
Tel: +82-2-558-3737, Fax: +82-2-558-5141
© 2010 Renesas Electronics Corporation. All rights reserved.
Colophon 1.0
CubeSuite Ver.1.40
R20UT0265EJ0100