1
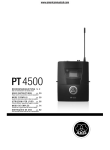
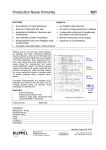
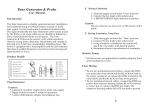
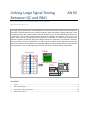
Linking Large Signal Testing Between QC and R&D AN 65 Application Note for the KLIPPEL R&D and QC SYSTEM (Document Revision 1.2) The large signal performance of loudspeakers is limited by nonlinear and thermal mechanisms. Transducer nonlinearities limit the acoustical output, affect the speaker system alignment, cause unstable behavior and create audible nonlinear distortions such as intermodulation and harmonic distortion. The nonlinear characteristics depend on important parameters, such as voice coil offset, which can vary during the production process. Therefore, it is important to optimize the nonlinear speaker parameters during the design and test for conformity in production. However, these processes can be very different. To help provide consistent and comparable results, this document explains the link between the KLIPPEL R&D (LSI) and QC (MSC) systems which provide measurements, such as large signal identification and voice coil offset testing, respectively. FAIL Force factor Bl (X) 5 Impedance Coil Offset XBl XC Stiffness Asymmetry Fs Re Qts 4 Coil Offset: 0.56 mm 7 Bl [N/A] 6 Corrected Rest Position Detected Coil Offset 3 2 1 0 -4 << Coil in -2 0 X [mm] 2 4 coil out >> CONTENTS 1 Scope .............................................................................................................................................................. 2 2 Step-by-Step Guide......................................................................................................................................... 3 3 Root Causes of Result Deviation................................................................................................................... 10 4 Related Information ..................................................................................................................................... 13 Linking Large Signal Testing Between QC and R&D 1 AN 65 Scope Different measurement principles and conditions exist between R&D and QC resulting in different ways to present the nonlinear transducer parameters. While QC requires speed, robustness and simplicity, R&D requires a more in-depth detailed analysis. Linking both processes is crucial for successful consistency and meaningful testing. In addition to understanding and handling differences between R&D and QC, the objectives are: Setting up end-of-line testing (MSC) based on R&D measurement results using reference speaker(s) Ensuring comparable and reproducible results Optimal balance of accuracy and test speed on the production line Dealing with different motor geometries. Motivation Objectives Device Under Test Electrodynamic transducers operated in free air or mounted in a sealed or vented enclosure. Requirements Both KLIPPEL R&D and QC systems are prerequisites. The following lists represent the minimal (though complete) configurations: KLIPPEL R&D System Distortion Analyzer Power amplifier Laser sensor (optional) LPM - Linear Parameter Measurement LSI – Large Signal Identification (Woofer, Tweeter, or Box depending on DUT type); from version 206.x (for derived nonlinear asymmetry parameters) KLIPPEL QC System Parameters QC Standard Production Analyzer Power amplifier MSC – Motor & Suspension Check The following relevant large signal design and end-of-line testing parameters are related to suspension (spider, surround) and motor (B-field distribution and voice coil) and can be separated into base and derived parameters: Motor Parameters Force factor at rest position 𝐵𝑙(0)* Nonlinear Force Factor 𝐵𝑙(𝑥)* Bl Symmetry Point 𝑥sym Coil Offset 𝑥offset Peak displacement limited by motor 𝑥Bl Suspension Parameters Nonlinear Stiffness 𝐾ms (𝑥)* Stiffness Asymmetry 𝐴kms Peak displacement limited by suspension 𝑥C All listed measures comply with IEC 62458. Other parameters such as nonlinear inductance and losses are mainly defined by design and are not considered as relevant for end-of-line testing. For parameter definitions please refer to the references in the module’s user manual. Note: implementation of derived nonlinear parameters may differ slightly between MSC and LSI (i.e. due to different reference peak displacements). *Base parameters KLIPPEL Application Note Page 2 of 13 Linking Large Signal Testing Between QC and R&D 2 AN 65 Step-by-Step Guide The following procedure outlines the general approach for setting up and evaluating the results of a QC MSC test based on R&D measurements from one or more reference speakers. These instructions mainly focus on finding an optimal test setup (generating testing limits is not covered). Please refer to the MSC Manual for more information. The device under test (DUT) does not necessarily have to be a “good” reference unit when used for relative limit calculations. You are encouraged to test multiple units for assessing variations and double checking the settings applied. The speaker used in this example is a conventional woofer with an overhung coil configuration. 2.1 Linear Parameter Identification (R&D) LPM Measurement The Linear Parameter Measurement is accurately identifying the lumped parameters of the transducer’s linear equivalent circuit (T/S parameters, etc.). Both LSI and MSC require a mechanical calibration factor to display the result in absolute mechanical units (mm). Either the moving mass 𝑀ms or the force factor at the coil rest position 𝐵𝑙(𝑥 = 0) can be used for this purpose. Both can be measured with optimal accuracy using LPM. Please refer to LPM - Tutorial for detailed instructions about setting up an LPM measurement. Either the laser or the added mass method can be used with LPM. LPM Results After the LPM has finished successfully, the resulting 𝐵𝑙 and 𝑀ms can be found in the result window Table Linear Parameters. These parameters may be exported to the clipboard as shown below: KLIPPEL Application Note Page 3 of 13 Linking Large Signal Testing Between QC and R&D 2.2 AN 65 Large Signal Parameter Identification (R&D) 1. LSI Measurement Import the mechanical calibration parameters 𝐵𝑙(0) or 𝑀ms as shown below: This is required to display the results in absolute mechanical units (e.g. mm). Using a laser sensor with LSI is optional. When using a laser sensor with LSI, importing LPM parameters is not required but recommended for better accuracy. Please refer to LSITutorial for detailed instructions on how to setup a new LSI operation. To obtain the nonlinear parameter set, define suitable Protection Parameters and perform the LSI measurement according to LSI-Tutorial. 2. Nonlinear Curves The relevant LSI result windows, nonlinear force factor 𝐵𝑙(𝑥) and the nonlinear stiffness 𝐾ms (𝑥), are shown below in the final state of the measurement (time cursor in Temperature, Power result window is located in the final position). The colored lines represent the nonlinear parameters within the displacement range ±xprot defined by the protection parameters. The black lines indicate the displacement range xp- < x < xp+ with a 99 % probability of occurrence (only for time cursor located in final position). The 𝐵𝑙(𝑥) plot in this example shows a visible offset from the rest position at 𝑥 = 0 along with a slight field asymmetry. The suspension tends to be asymmetric as well. Note: The orientation of these curves depends on the polarity connection during the measurement. In case a laser sensor is used, “coil in” and “coil out” markers indicate the actual physical orientation of the parameters. However, for consistent comparability reasons, it is recommended to always connect the speaker with correct polarity. 3. Bl Symmetry Point The window below shows the Bl Symmetry Range and Symmetry Point plot which provide additional diagnostic information about Bl asymmetry and coil positioning. KLIPPEL Application Note Page 4 of 13 Linking Large Signal Testing Between QC and R&D AN 65 At low displacement amplitudes the field asymmetry is dominant because the symmetry point 𝑥sym (𝑥ac ) (red dashed curve) varies with rising amplitude. At higher excursions the symmetry point 𝑥sym (𝑥ac ) @ 𝑥p- approaches a stable value of approx. −1 mm (green line) indicating a non-optimal voice coil rest position which significantly limits the working range of the driver. Due to the field asymmetry, the voice coil offset can only be estimated correctly at very high displacement amplitudes. This must be considered when setting up MSC because using the symmetry point measured at lower displacement amplitudes would be misleading. Note: Some motor designs require special attention when testing voice coil offset. For details about the most common voice coil configurations and the corresponding Bl Symmetry Range and Symmetry Point plots, please refer to application note AN1 - Optimal Voice Coil Rest Position. 4. Derived Single Value Parameters The LSI result window Nonlinear Parameters contains single values that have been derived from the relevant nonlinear curves. These single values may be used for comparing with the QC MSC module’s output. The value of 𝑥sym corresponds to the observations made in the Symmetry Point plot at higher displacement amplitudes. To optimize the rest position, the voice coil should be shifted approx. 1 mm towards the back plate. Parameter 𝐴𝐾 indicates an asymmetry in the suspension of approx. 25 % as shown in the 𝐾ms (𝑥) curve. The displacement limits show the amount of displacement required for each nonlinearity to produce 10% distortion. Only 𝑥𝐵𝑙 and 𝑥𝐶 are tested in production by MSC. Note: in this case, the dominant nonlinearity is the inductance 𝐿(𝑥) represented by𝑥𝐿 . This is a coil design problem that will not be evaluated during the QC test. KLIPPEL Application Note Page 5 of 13 Linking Large Signal Testing Between QC and R&D 5. State Conditions AN 65 The LSI result window State provides auxiliary information reflecting the state conditions during the measurement. Displacement amplitude information, such as the protection displacement limit 𝑥prot , should be stated along with the derived nonlinear parameters, 𝐴𝐾 or 𝑥sym (𝑥offset ). This ensures comparability between results since 𝐴𝐾 and 𝑥sym (𝑥offset ) are determined at high displacements. In addition, these state conditions help estimate the start and target values (terminal voltage, peak displacement, required 𝐵𝑙 decay) to set up the QC MSC test for comparable results. 2.3 Setting up the QC Test The LSI results can be used to set up the QC MSC test in an end-of-line test environment. The test setup may be different because the QC measurement is usually performed with the DUT inside or attached to a test box instead of free air. For best comparability of the results, it is recommended to keep the same mounting orientation and load (large test box) as used during the LSI test. Note: It is important to connect the DUT with correct polarity. Otherwise, some nonlinear parameters and states will have the wrong sign when compared to LSI. 1. Create/Select Test Open QC Start – Engineer and create a new test based on a suitable template or select an existing test which shall be enhanced by the MSC for large signal testing Click Measure to login for setup. KLIPPEL Application Note Page 6 of 13 Linking Large Signal Testing Between QC and R&D 2. Add MSC Task AN 65 Click Add.. under Property Page - Tasks to add the MSC to the test sequence. Use the arrow buttons to change the order of the test sequence. In a reverberant test environment it is not recommended to place MSC right before an acoustic test step like Sound Pressure, as its high-level acoustical decay may falsify the Rub&Buzz test. Note: For minimal overall test time the MSC should be placed early in the test sequence. Signal processing for MSC is performed in parallel with subsequent measurements. 3. Set Driver Type Set up MSC by selecting one of the predefined Driver Type templates. Select the template according to the specified resonance frequency range of the DUT. See the MSC Tutorial section - Find the Optimal Driver Type for more information. The present DUT’s resonance frequency is below 80 Hz, thus the Subwoofer template is recommended. The Woofer template would be applicable as well but it is recommended to use the “lower” template as it uses more reliable settings such as longer measurement time for better low frequency resolution. Settings, such as measurement time, frequency range and resolution are set automatically in the background. The complete set of available settings is shown by selecting Advanced parameter. In most cases the template settings are suitable or a good starting point. 4. Set Initial Test Voltage One of the most critical setup parameters is the excitation Voltage since it defines the peak displacement during the measurement. Although the excitation signals of LSI (noise) and MSC (multitone) differ, both have comparable characteristics. Therefore, 𝑈rms , as displayed in the LSI State window (see section State Window), may be used as a reasonable test voltage for the first run of MSC. 5. Mechanical Calibration For mechanical calibration either 𝐵𝑙(𝑥 = 0) or 𝑀ms can be copied from the LPM measurement. Select the corresponding parameter in Settings – Calibration. It is recommended to use the most stable parameter (i.e. the parameter which exhibits the least amount of variation amongst a series of sample drivers in production). Importing moving mass may be preferable as it is independent of the coil rest position. Further aspects are discussed in section Root Causes of Result Deviation. If Relative calibration is selected, all results will be displayed in % of peak displacement. This is not recommended due to the lack of diagnostic information in the result. 6. First Run After selecting the desired results such as Coil Offset in parameter category Measurements, start a first measurement to verify the setup parameters by clicking the Start button in Control Panel. The Summary window shows the results of the MSC with the estimated Coil Offset printed at the top. The value is a close match to the 𝑥sym value measured by LSI, even when just using the standard QC template settings. In addition, Stiffness Asymmetry KLIPPEL Application Note Page 7 of 13 Linking Large Signal Testing Between QC and R&D AN 65 shows good agreement with𝐴𝐾 . The state variables shown in the second table should be checked to verify that the MSC measurement conditions are the same as LSI measurement conditions. Peak displacement 𝑥peak in MSC refers to the maximal absolute displacement* which should be to the LSI reference displacement 𝑥prot which has been identified according to the user defined protection limits. Therefore, it is recommended to reduce the MSC stimulus voltage in order to decrease the peak displacement by ≈ 1.4 mm. 𝐵𝑙min is an indicator of the “degree of nonlinearity” because it describes the force factor variation 𝐵𝑙(𝑥) related to the 𝐵𝑙 at the rest position𝐵𝑙(𝑥 = 0). In this example, 𝐵𝑙min is below the LSI protection limit of 50 % which is another indication that the MSC stimulus voltage should be reduced. Note: To estimate a valid voice coil offset, the MSC measurement looks for a symmetrical force factor reduction of 70% or greater. In some cases, when Bl(x) is highly asymmetric, the warning message “Nonlinear working range not reached..” will be displayed. However, if the results can be validated by comparing MSC state variables to LSI, the warning can be ignored. *Separate xpeak and xbottom available from version QC4.0d. 7. Modify Advanced Settings In some cases, it may be necessary to edit additional parameters to improve the agreement between results. Selecting the Advanced option activates the following additional hidden parameters: KLIPPEL Application Note If linear parameter estimation of the MSC fails or LPM shows a clear preference for a specific Inductance Model, adjust the MSC parameter to match. To increase accuracy, consider increasing the measurement Time, especially for low frequency transducers. To find the optimal test time, start the measurement using the maximal measurement time (for best accuracy) and then reduce the time, step-wise, until the results start to deviate. Preloop defines the additional time spent to bring the speaker into steadystate conditions. Compensate Amplifier accounts for the amplifier roll off at very low frequencies. In some cases results may be impaired if the applied boost is high. Amplifier compensation may be deactivated in most cases. Microspeakers or tweeters may heat up even during a short MSC test. The resulting variation of 𝑅e may impair the MSC results. Consider activating Consider thermal heating. However, this will result in a significantly longer test time to identify the thermal characteristic. Therefore only use it if the results imPage 8 of 13 Linking Large Signal Testing Between QC and R&D AN 65 prove. Consider nonlinear damping will account for the effect of nonlinear damping as a function of velocity 𝑅ms (𝑣). This effect is relevant for micro speakers and should be activated for this transducer type. More related information can be found in the section Root Causes of Result Deviation and in the MSC – Tutorial section Customize your MSC Task. 8. Final Setup Check The screenshot below shows the results with optimized setup parameters. A lower voltage has been used to reduce the peak displacement and the measurement time was increased to improve accuracy. Now, the Coil Offset is slightly less than the xsym value stated in the LSI Nonlinear Parameters table. However, using the cross cursor in LSI’s Bl Symmetry Range plot shows a very good agreementwith the 𝑥ac value provided in MSC’s parameter table. 𝒙ac 9. Verify Setup In order to verify the test setup parameters when multiple speaker samples are available, it is recommended to run the QC test on the complete sample lot. This helps verify typical variations, accuracy, stability and limit settings. KLIPPEL Application Note Page 9 of 13 AN 65 Linking Large Signal Testing Between QC and R&D Peak Displacement Therefore, the maximum displacement during both measurements should be the same. Note: there are different parameters referring to peak displacement which should be distinguished, such as𝑥peak , 𝑥bottom , 𝑥ac , 𝑥prot , 𝑥p . Bl Symmetry Range Symmetry Point KLIPPEL 5,0 xsym(2mm) ≠ xsym(3,5mm) 2,5 Coil out >> Comparing derived nonlinear parameters such as voice coil offset or stiffness asymmetry may heavily depend on the peak displacement achieved during the measurements. This is especially the case for nonlinear characteristics with a dominant inherent asymmetry. 0,0 Offset 3.1 Root Causes of Result Deviation -2,5 << Coil in 3 -5,0 0,0 0,5 1,0 1,5 2,0 2,5 3,0 3,5 4,0 Amplitude [mm] 4,5 5,0 5,5 6,0 For very linear motor designs, always check that displacement is high enough to produce flanks on both sides of the nonlinear curve, even when assuming high offset. This policy of producing flanks should also be followed when the nonlinear curve has two sub-maxima and a local minima. See AN1 for more details. In order to be determine displacement limit parameters, such as 𝑥C and𝑥Bl , a certain amount of variation is required. Measurement Duration and Excitation Signal The LSI measurement takes significant time to adaptively determine the nonlinear parameters with a broad band noise signal. The LSI displacement PDF histogram shows low voice coil displacement most of the time. Relatively speaking, there are very few incidents of high excursions. However, especially high amplitude information is required for nonlinear identification purposes. Displace ment PD F (X) histogra m 00:08:27 PDF (X) PDF (-X) KLIP PEL 0,25 0,20 xp+ xpPDF [1/mm] 3.2 0,15 0,10 99% probability interval Contrast to LSI, MSC must acquire all information in only a few seconds. Therefore, a 0,05 dedicated multitone signal is used to ensure symmetric peak displacement and a low crest 0,00 -4 -2 0 2 4 factor at minimal test time. During this short X [mm] test time, peak displacement is only achieved a few times. Therefore, increasing time is recommended to improve the result agreement. The default settings of the Driver Type templates may not be time optimal for your transducer, especially when the resonance frequency of the DUT is in the lower recommended range of the selected template. KLIPPEL Application Note Page 10 of 13 AN 65 Linking Large Signal Testing Between QC and R&D 3.3 Orientation Due to a soft suspension or a large moving mass, the effects of gravity may impair the results by causing a significant shift in the coil rest position. Therefore, It is recommended to always keep the DUT orientation similar to the target application and maintain consistency throughout all the measurements. The influence of gravity on the coil rest position can be estimated by the following equation: ∆𝑥offset = g ∙ 𝑚ms ∙ 𝑐ms The offset is given relative to vertical orientation. 3.4 Polarity Although it is not relevant towards determining the actual nonlinear identification, polarity is important to correctly orient an outward coil movement with a positive voltage on the positive terminal of the speaker. If a laser sensor is used during the LSI measurement, the polarity is automatically determined. However, a correct polarity connection is recommended to have consistent orientation of the nonlinear curve abscissa. Due to the lack of mechanical sensors, MSC relies on correct connections. The wrong polarity connection during MSC can be detected as an inverted sign in the offset result. 3.5 Time Variance & Ageing The material properties of the suspension change with the amount of mechanical work performed (i.e. stress and strain during operation). As a result, the mechanical parameters (small and large signal) vary with time as shown in the example 𝐾(𝑡) plot below. The changes can be irreversible. For example, the quick stiffness decay during the "break-in" period of new transducers. A change in suspension stiffness may produce a change in coil rest position. Therefore, LSI should be performed before MSC. In LSI, both the initial and final coil rest position is indicated by vertical lines in the nonlinear parameter charts. K(t) K(t=1h) Speaker 2 K(t=100h) final Speaker 1 coil rest position 0 20 40 60 80 100 120 140 160 hour KLIPPEL Application Note 180 original coil rest position t Page 11 of 13 Linking Large Signal Testing Between QC and R&D 3.6 AN 65 Self-Heating In order to identify the large signal parameters during LSI, the device under test is usually operated close to its mechanical or thermal protection limits. As a result, the measurement is compensated for an increase in D.C. resistance 𝑅e due to voice coil heating. Voice coil heating may also occur during MSC. The setup parameter Consider thermal heating may be used to compensate but this increases measurement time significantly (by factor 3) and it is not required in most cases. Typically, only micro speakers or tweeters may suffer from heating during the MSC test because the thermal time constant of the voice coil 𝜏v is relatively fast. Therefore, keep the measurement time as short as possible or activate thermal mode when the results are not reliable. Note: LSI provides an optional Thermal Mode which is performed after nonlinear parameter identification to identify thermal parameters such as 𝜏v . 3.7 Variance of Mechanical Calibration To calibrate the result parameters in absolute mechanical units (e.g. mm), LSI facilitates importing a reference value such as the force factor at the rest position 𝐵𝑙(𝑥 = 0) or the total moving mass 𝑀ms . These parameters are measured accurately with high precision by LPM. During end-of-line testing, 𝐵𝑙(𝑥 = 0) or 𝑀ms are usually not updated for each unit tested. Therefore, to calibrate the variations between samples, MSC also facilitates the entry of a typical (reference) value. This means that any deviation between the measured and typical values indirectly affect the results such as 𝑥𝐵𝑙 or voice coil offset. The relative error between measured displacement 𝑥 ′ and typical displacement 𝑥 is described by the following relations: 𝐵𝑙typ 𝑥′ 𝑀ms,DUT = =√ 𝑥 𝐵𝑙DUT 𝑀ms,typ As shown, a 𝐵𝑙 deviation causes a linear error while a moving mass deviation has less of an impact (square root). In terms of typical production processes, force factor is often more stable than moving mass. However, 𝐵𝑙(𝑥 = 0) strongly depends on the rest position by definition, importing mass may be more robust. Note: A typical end-of-line test includes small signal parameter and acoustical response measurements. Parameters, such as resonant frequency or average sound pressure level, will indicate a significant deviation in 𝐵𝑙(𝑥 = 0) or 𝑀ms . 3.8 Test Setup (Load) During, end-of-line testing, test boxes are commonly used to provide consistent measurement conditions and ambient noise isolation. Because R&D tests are typically performed in free air or in a baffle, the acoustical load conditions during a QC test may be different. The enclosed air acts as an additional spring which increases the total measured stiffness and limits peak displacement. The actual impact depends on the DUTs radiating surface area and the volume of the test box. In most cases, increasing stimulus voltage is sufficient to compensate for the drop in peak displacement. In some cases, even large signal parameters may be corrupted. For example, in very small test boxes, air compression becomes nonlinear. At the same time a dominant air stiffness may linearize the total 𝐾ms (𝑥). 3.9 Ambient Conditions Since temperature and humidity variations may have significant effects on suspension parameters and other characteristics, all tests should be performed under the same climatic conditions. Although factory conditions can be drastically different from laboratory conditions, it is important to at least provide the same climate conditions during setup and evaluation stages. KLIPPEL Application Note Page 12 of 13 Linking Large Signal Testing Between QC and R&D 4 AN 65 Related Information Application Notes AN1: “Optimal Voice Coil Rest Position” AN2: “Separating Spider and Surround” AN3: “Adjusting the Mechanical Suspension” AN5: “Displacement Limits due to Driver Nonlinearities” AN21: “Reduce Distortion by Shifting Voice Coil” AN24: “Measuring Telecommunication Drivers” You may download all KLIPPEL application notes here. Specifications Manuals Standards Papers S13 QC - Motor and Suspension Check (MSC) S1 – Large Signal Identification (LSI) S2 - Linear Parameter Measurement (LPM) Tutorial & Manual MSC Tutorial & Manual LSI Tutorial & Manual LPM IEC 62458 – Sound System Equipment – Electroacoustical Transducers – Measurement of Large Signal Parameters W. Klippel “Mechanical Fatigue and Load-Induced Aging of Loudspeaker Suspension” W. Klippel “Nonlinear Modeling of Heat Transfer” W. Klippel “Loudspeaker Nonlinearities – Causes, Parameters, Symptoms” W. Klippel “Assessing Large Signal Performance of Transducers ” W. Klippel “Assessment of Voice Coil Peak Displacement Xmax” W. Klippel “Nonlinear Damping in Micro Speakers” th S. Hutt, L. Fincham; “Loudspeaker Production Variance”, presented at the 125 convention of the Audio Engineering Society 2008 (San Francisco) Most of the listed papers and many more related may be downloaded here. Find explanations for symbols at: http://www.klippel.de/know-how/literature.html Last updated: March 30, 2015 KLIPPEL Application Note Page 13 of 13